Article

A Steam Ejector Refrigeration System Powered by Engine Combustion Waste Heat: Part 1. Characterization of the Internal Flow Structure

1
School of Mechanical Engineering & Automation, Northeastern University, Shenyang 110819, China
2
School of Mechanical and Manufacturing Engineering, University of New South Wales, Sydney, NSW 2052, Australia
3
School of Engineering, RMIT University, Melbourne, Vic 3083, Australia
4
Australian Nuclear Science and Technology Organization (ANSTO), Locked Bag 2001, Kirrawee DC, NSW 2232, Australia
*
Author to whom correspondence should be addressed.
Appl. Sci. 2019, 9(20), 4275; https://doi.org/10.3390/app9204275
Submission received: 17 September 2019 / Revised: 1 October 2019 / Accepted: 8 October 2019 / Published: 12 October 2019
(This article belongs to the Special Issue Progress in Combustion Diagnostics, Science and Technology)

Abstract

:
With the escalating production of automobiles, energy efficiency and environmental friendliness have always been a major concern in the automotive industry. In order to effectively lower the energy consumption of a vehicle, it is essential to develop air-conditioning systems that can make good use of combustion waste heat. Ejector refrigeration systems have become increasingly popular for this purpose due to their energy efficiency and ability to recycle waste heat. In this article, the elements affecting the performance of a typical ejector refrigeration system have been explored using both experimental and numerical approaches. For the first time, the internal flow structure was characterized by means of comprehensive numerical simulations. In essence, three major sections of the steam ejector were investigated. Two energy processes and the shock-mixing layer were defined and analyzed. The results indicated that the length of the choking zone directly affects the entertainment ratio under different primary fluid temperature. The optimum enterainment ratio was achieved with 138 °C primary fluid temperature. The shock-mixing layer was greatly affected by secondary fluid temperature. With increasing of back pressure, the normal shock gradually shifted from the diffuser towards the throat, while the shock train length remains lunchanged.

1. Introduction

Energy conservation and recyclability are among the greatest concerns of modern research studies in automotive industry. Regarding all the energy consumed within a vehicle, the air-conditioning system typically takes up a larger part. With major breakthroughs in refrigeration system technologies in the usage of low-grade energy, steam ejector refrigeration systems have become one of the potential devices for effective energy conversion, which can be driven by industrial and automobile exhaust heat waste [1]. The applications of steam ejectors range from transportation systems, fire safety [2], petroleum, chemical industry and seawater desalination [3]. Throughout the last century, the automobile has accounted for the majority of transport worldwide. However, the fuel consumption against energy converting ratio is relatively low. The effective thermal efficiency of the engine is generally about 30%. The remaining 65% of the fuel combustion heat includes 10% lost for radiation, 30% lost to the exhaust and 30% lost by the cooling system. That is, the waste heat accounts for 30% [4]. The engine combustion waste heat has the characteristics of high temperature, fast flow rate and strong pressure. Its temperature can range from 200 °C to 600 °C [1]. This part of the heat not only exacerbates the air pollution but also causes the overheating of the water tank to affect the dynamic performance of the automobiles. To reduce waste heat or to improve the waste heat utilisation rate is an effective way to decline the air pollution and enhance the operating stability of the automobile. As an independent running individual, the recovery and utilisation of the waste heat are partly limited. In 1980, Hamner firstly proposed to apply the combustion waste heat of automobile engine to power a steam ejector refrigeration system [5]. From an application perspective, using the recycled waste heat as a power source for driving the automotive air conditioning system is a promising way to save energy [6]. Comparing the compression cooling system of the automobile, the steam ejector refrigeration system has the potential to be used in automobiles, due to it has no moving parts, simple structure, small equipment area, durable operation and low cost [2].
The steam ejector refrigeration system consists of four major parts: the generator, the steam ejector, the evaporator and the condenser. The water vapour generated from the generator enters the nozzle at a higher temperature. After it flowed through the nozzle, the water vapour was reduced to a low pressure fluid at the entrance of the ejector. Then the water vapor in the evaporator was sucked into the ejector by the pressure difference. Though a series of flow changes, the two streams of fluid are mixed into a mixed fluid and together discharged into the condenser to continue the next refrigeration cycle [7,8]. There is a direct relationship between the performance of the refrigeration system and ejector working characteristics [9] and the efficiency of the steam ejector refrigeration system largely depends on the characteristics of the steam ejector [10,11]. Therefore, a comprehensive understanding of the factors affecting the performance of the steam ejector is essential to improve the performance of the whole refrigeration system. The disadvantage of the steam ejector is that its efficiency is relatively low [12].
As early as 1910, Leblanc proposed the ejector refrigeration cycle system [13]. The researchers have conducted extensive experimental studies and numerical simulations of the steam ejector [14,15]. Though the main research of the ejector was still focused on the thermodynamic analysis of the ejector [16,17], the numerical simulation of the steam ejector developed rapidly. For example, the research on the spontaneous condensation inside the ejector has made some progress in the past five years. The wet steam model applied in the optimization of the ejector efficiency was studied by Li [18]. A developed wet steam model in the non-equilibrium condensation phenomenon to understand the intricate feature of the steam condensation was demonstrated by Yang [19]. Zhang [20] proposed a modified wet steam model to evaluate the pumping performance and optimize the operating conditions of the steam ejector. Moreover, the study of the numerical simulation on the pumping performance of the ejector by changing the geometry structure and the operating parameters have been investigated by the researchers. The internal complex flow phenomena such as the shock wave [21], boundary layer separation [22] and shock boundary layer interaction [23] have been studied to improve the design of the ejector. Bartosiewicz [24] studied the flow separation phenomenon in detail by both experimental and numerical simulation methods. Zhu [25] analysed the shock wave structures and their effect on the pumping performance of the converging-diverging and the converging nozzle ejectors. The effect of the first shock wavelength on the ejector performance is studied by using an image processing method. The results showed that the ejector performance decreases with the increase of the shock wavelength at a given primary flow pressure. Zhu [26] proposed a shock circle model in predicting the ejector performance is simpler than many 1D modelling methods and can predict the performance of critical mode operation ejectors much more accurately. Numerical study of the internal flow and heat transfer in the steam ejector has been conducted [27,28], which provided valuable insights for geometry improvements for the ejector design. It can effectively reveal the internal flow and the mixing process of the ejector. The shock’s position of the mixed fluid played a very important role in the ejector performance [29]. Nevertheless, the flow structure inside the steam ejector was still lack of full understanding.
In this work, a steam ejector refrigeration system driven by the combustion waste heat of the automobile engine was proposed. A steam ejector refrigeration system with a cooling capacity of 12.5 kW was studied experimentally. The characteristics of the internal flow structure in the steam ejector are analyzed by using both experimental and numerical approaches. The whole flow region inside the ejector was firstly divided into three zones via static pressure, namely: inducing zone, choking zone and discharging zone. By identifying these three zones, the flow structures such as the shock train, choking position and the normal shock wave can be identified with more indication. The shock-mixing layer is defined as where the separation boundary of the primary and secondary fluids. The effects of the energy exchange and mixing progress on the pumping performance of the ejector were analyzed and discussed. By discussing the characteristic of the internal flow structure, the influence of the operating condition, i.e., the primary fluid temperature (134 °C–146 °C), the secondary fluid temperature (5 °C–20 °C) and back pressure (3000 Pa–5000 Pa) on the pumping performance under was comprehensively investigated.

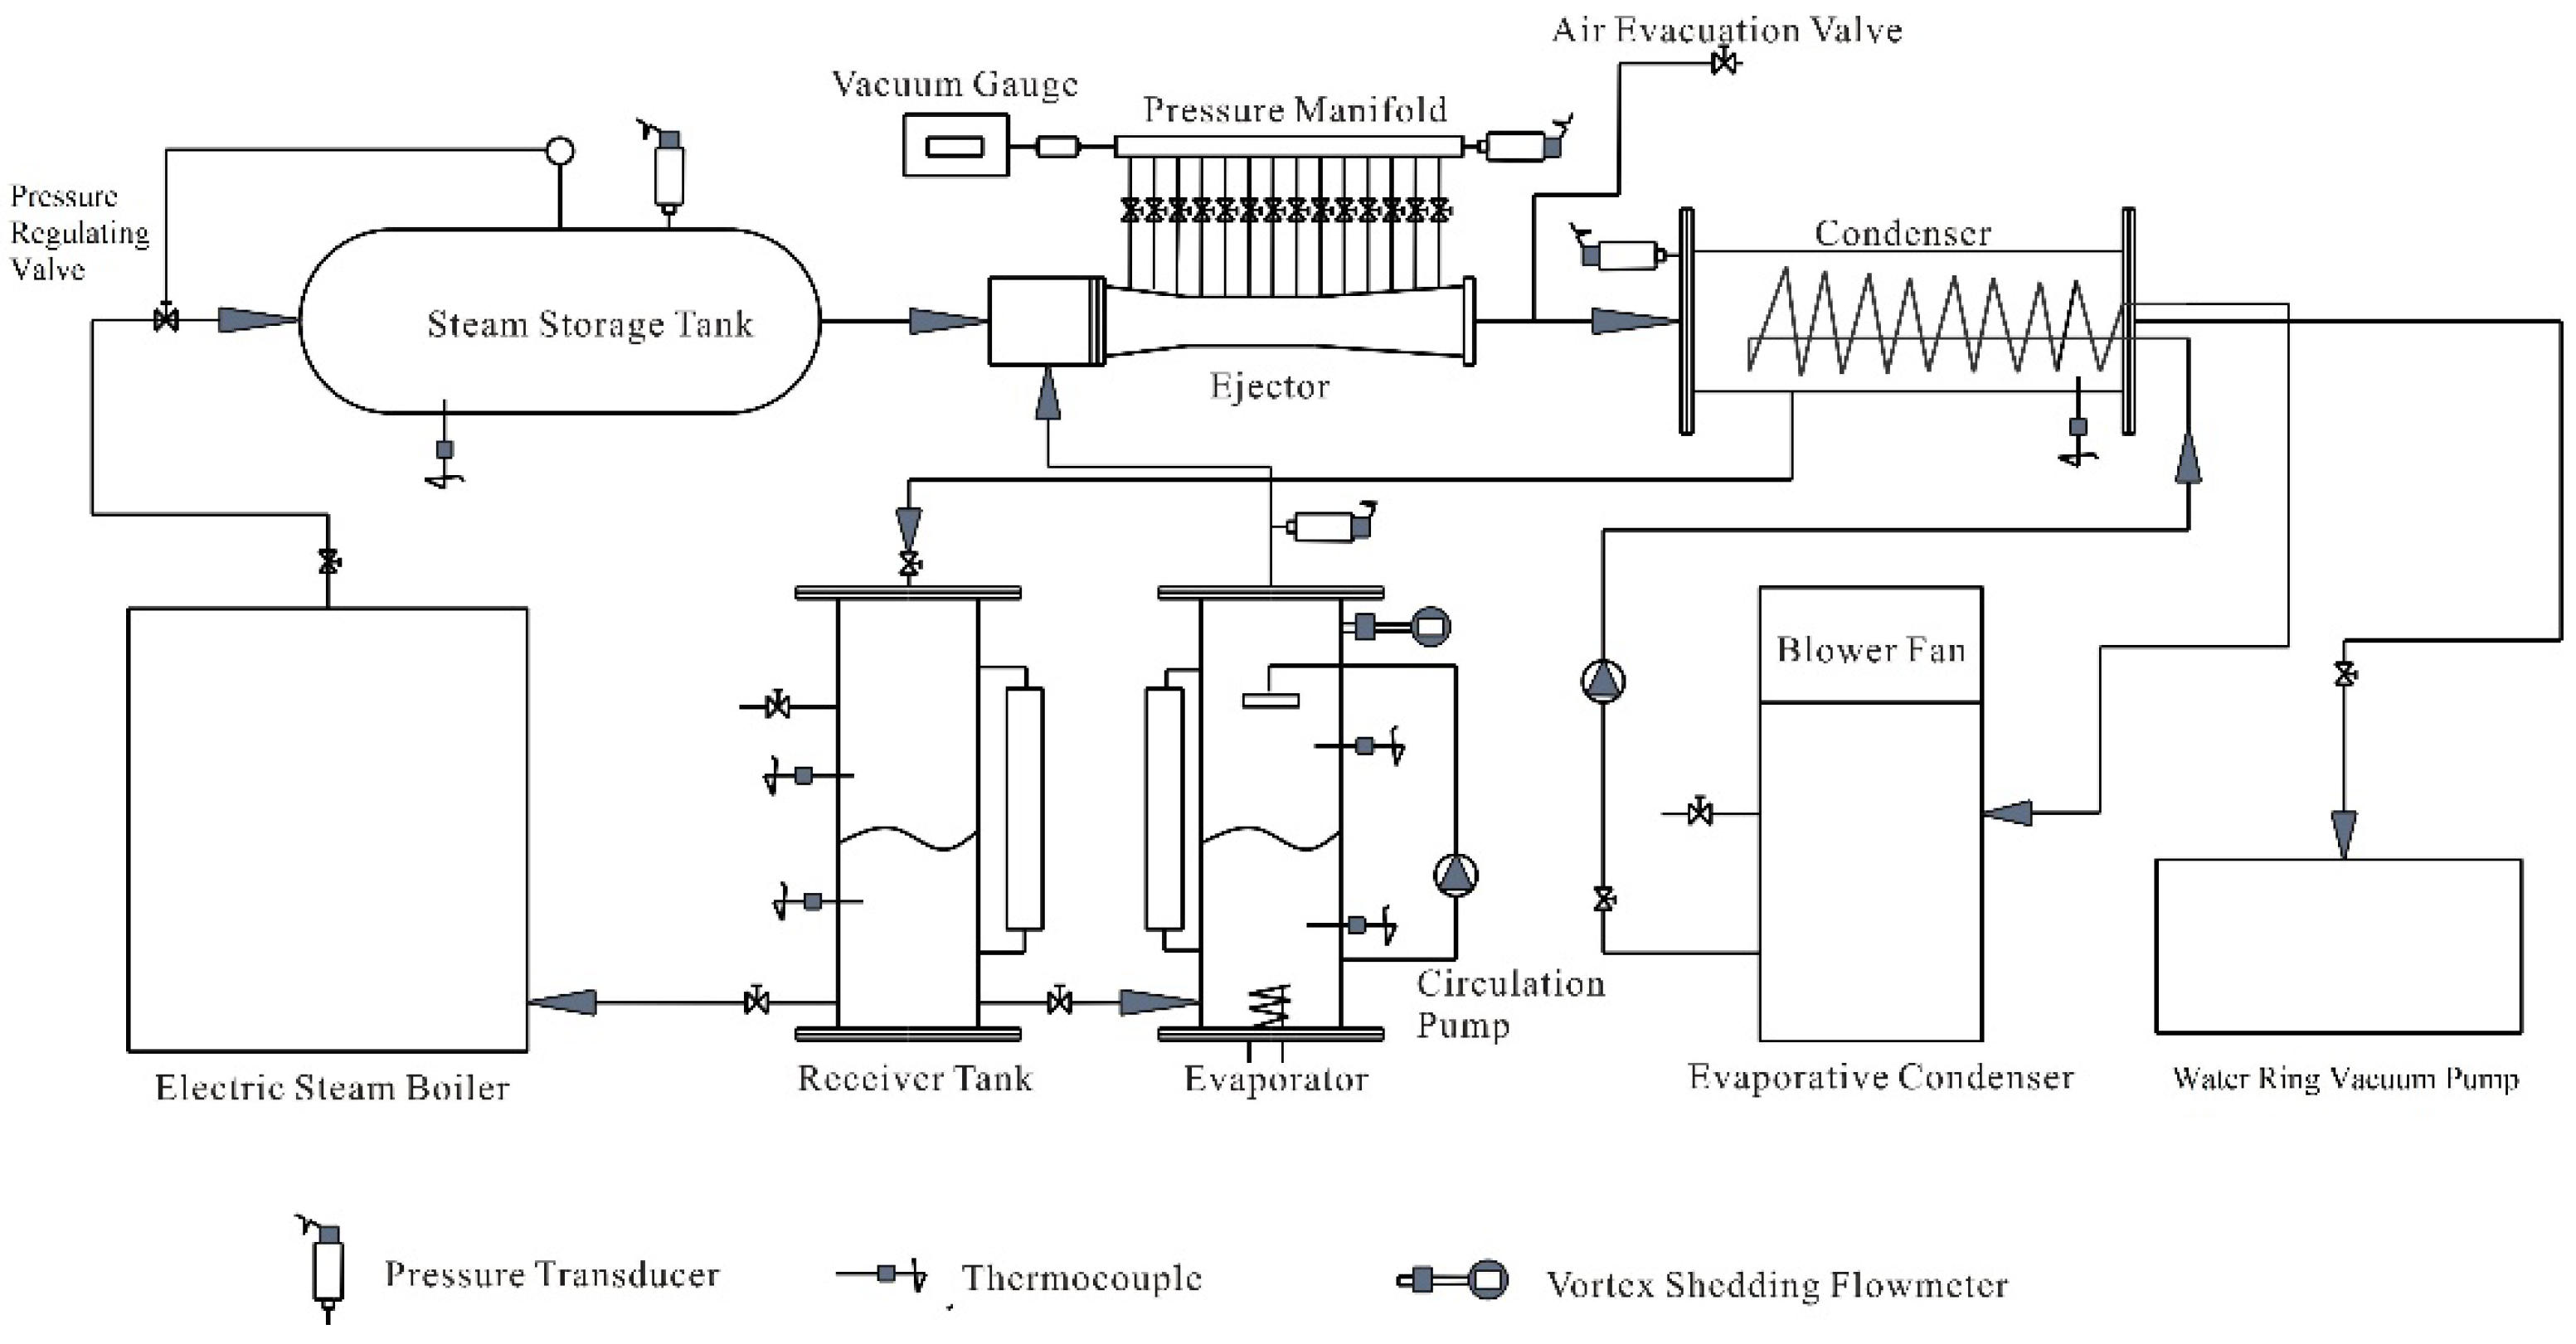
2. Experiment Instrumentation

The steam ejector refrigeration system is mainly composed of four components: a generator, a steam ejector, an evaporator, and a condenser. Other experimental components include a storage tank, a water ring vacuum pump, an evaporative condenser, pressure regulating valves, vacuum gauge and pipes, as displayed in Figure 1. The steam generator generates saturated steam with a certain pressure and temperature, then the saturated steam passes through a steam-pressure regulating valve and reaches the steam storage tank. The high-speed primary fluid from the steam storage tank entrained the vapour from the evaporator through the ejector to achieve the purpose of refrigeration and then discharges into the condenser for the next cooling cycle. A water ring pump is installed at the outlet of the water-cooled condenser and supplies a stable back pressure for the steam ejector as the back-pressure pump. It is used to cool the high-temperature steam in the condenser to prevent the pump body from being corroded and stabilize the gas pressure in the condenser. The purpose of installing evaporative condenser is to make the condensed water from the condenser cool down rapidly so that it can enter the next cooking cycle quickly and improve the cycling efficiency of the refrigeration system. The steam ejector outlet is equipped with a back pressure regulating valve to regulate the back pressure at different levels. The secondary fluid is evaporated from the evaporator, and its mass flow rate is measured by the vortex shedding mass flow meter. The measurement and control of the primary fluid pressure are mainly achieved by means of a pressure transmitter, a PID controller and a pressure regulating valve. The pressure transmitter not only measures and displays the pressure, as a pressure gauge but also converts the pressure in the steam storage tank into an electrical signal sent to the PID controller. The PID operator automatically acquires a given signal from the system and valve position feedback signal and adjust the output of the corresponding control according to the difference between the pressure and the electrical signal. Then the pressure regulating valve will change the mass flow of primary fluid after accepting the DC signal from the PID controller. Therefore, the experimental primary fluid pressure can maintain at a given value.
A T-type thermocouple temperature control meter measures the temperature of the water in the evaporator which constantly adjusts to the temperature to reach the preset temperature, making sure the experiment can work under set conditions. 15 small holes are evenly opened on the ejector wall to measure the static wall pressure. The vacuum valve is connected to each hole through the vacuum silicon tubes. The pressure is carried through the valve and measured by the film vacuum gauge in turn. The error of the pressure transmitter of the full-scale is 0.5%. The instrument used to test the wall pressure is a film vacuum gauge with an error of 0.25% of the full scale. The mass flow rate of the secondary fluid is measured by a vortex flowmeter with the uncertainty of less than 0.33% and with the accuracy of 1%. The T-type thermocouple temperature control meter is used to measure the temperature with an error of ± 1 °C and an error of 0.5% of full scale. Besides, energy balance analysis was performed on the evaporator, generator and condenser during equipment commissioning to ensure measurement accuracy.
The cooling capacity of the experimental system is 12.5 kW. The maximum pressure and the saturated temperature of steam provided by the generator are 0.44 MPa and 148 °C, respectively. The cooling water circulating flow rate is 0.34–0.9 m3/h. The geometric parameters of the steam ejector are shown in Table 1. The operating conditions of the steam ejector are shown in Table 2.

3. Numerical Analysis of Flow Behaviour inside the Steam Ejector

The coefficient of performance (COP) is evaluated as the ratio of the refrigeration effect to the energy input of the system as given in Equation (1) [30]:
C O P = Q e Q g + W p
The COP can be rewritten after a series of calculations by neglecting pump work using Equation (2) [31]:
C O P = m p . m a . × Δ h e Δ h b = E m × Δ h e Δ h b
Therefore, it is obvious that the COP of the whole system depends entirely on the entrainment ratio, and the value of COP will be closer to the value of the entrainment ratio. Entrainment ratio (Em) is a common index for evaluating the pumping performance and reflects the working capability of the steam ejector which is defined as the mass flow rate ratio of the secondary fluid to the primary fluid’s mass flow rate [32]. Based on the existing experimental data, Chou [18] established a 1-D model of the ejector with R113 and R141b as the primary fluid:
E m = ( P 2 P 1 ) · 1 ( T 2 T 1 ) 1 / 2 · K p · K f · K s · φ
Kp is correlative with the structure of the nozzle, Kf is correlative with the effective area in the ejector, Ks is correlative with the aspect ratio and the exit Mach number of the primary nozzle, φ is a specific correction factor when the geometry structure of the ejector operating system is fixed. When the geometry dimensions of the nozzle are constant, the operating parameters Kp, Ks of the primary fluid are invariant, the entrainment ratio of the ejector is varied with the primary fluid pressure and secondary fluid pressure. The maximum Em of the ejector will be obtained when the ejector only operated at the double-choked flow mode under certain operating conditions [33,34]. Previous researches have shown that the shock-mixing layer [35], effective area [36], shock train [37] and the choking flow [38] in the throat section of the ejector are key factors in dominating the pumping efficiency of the ejector [39,40]. However, the research of the complex flow characteristics inside the ejector is limited by the present existing research methods.

3.1. Numerical Simulation Method

The CFD simulation software ANSYS Fluent version 19.2 was employed in this numerical study. Previously, the research work studied by Pianthong and Seehanam [41] has already demonstrated that the simulation results by the two-dimensional axisymmetric model and three-dimensional model were almost identical. Therefore, a two-dimensional axisymmetric model can be made as an assumption to perform the analysis of this study. The segregated solver is applied in ANSYS Fluent and the pressure is modelled by pressure velocity coupling approaches, which is typical for a wide range heat fluid interaction problems [42,43]. Huang [44] divided the ejector operating mode into three parts. When the back pressure of the ejector was below the critical value, the ejector was in the double-choked flow mode and is operating normally. The ejector is in unchoked flow and reversed flow modes when it was greater than the critical value. In practice, the spontaneous condensation of water vapour exists inside the steam ejector. A few study results have pointed out that the ideal gas cannot truly reflect the flow characteristics of the ejector [45]. The wet steam model can better predict the actual flow conditions and the simulation results are closer to the experimental values [46,47]. Nevertheless, the research of comparing the CFD simulation values with the experimental values studied by Moore et al. [48], it was concluded that the simulated value of the ideal gas model is closer to the experimental value and can better reflect the fluid flow characteristics than the wet steam model in the double-choked flow mode. Garcia del Valle [38] pointed out that there was no significant difference between the ideal gas and the real gas in the linear axisymmetric supersonic ejector. The ideal gas can be used to replace the real gas in numerical analysis reflect the flow property inside the ejector. Aphornratana [49] also proved that the ideal gas model could provide similar simulation results to the real gas in a steam ejector with lower operating pressure. To save computational cost and to improve simulation efficiency, the ideal gas model is selected for simulation analysis for thermal fluidic flows [50,51]. The fluid flow inside the steam ejector is governed by the compressible steady-state flow conservation equations including the mass conservation equation, the momentum conservation equation and the energy conservation equation, which can be written as follows:
The continuity equation:
ρ t + x i ( ρ u i ) = 0
The momentum equation:
t ( ρ u i ) + x j ( ρ u i u j ) = P x i + τ i j x j
The energy equation:
t ( ρ E ) + x i ( u i ( ρ E + P ) ) = · ( α e f f T x i ) + · ( u j ( τ i j ) )
where:
τ i j = μ e f f ( u i x j + u j x i ) 2 3 μ e f f u k x k δ i j
with:
ρ = P R T
where τij is the stress tensor, E is the total energy, αeff is the effective thermal conductivity, and μeff is the effective molecular dynamic viscosity.
The density-based model is employed for the simulation. The turbulence model was a realizable k-ε model [52,53] with which we can obtain higher accuracy of simulation results based on our previous research. The two inlets were set as pressure-inlets, and the outlet was set as a pressure-outlet. The wall-boundary was assumed to be a no-slip and adiabatic, using Enhanced Wall Treatment for near-wall treatment with y plus = 0.835 (<1) [54,55]. The second-order upwind format was used to calculate all the convective terms. The convergence criterion for residual of all dependent variables and the mass imbalance value was set to 1 × 10⁻⁶ and 1 × 10⁻⁷, respectively.
The independence of the grid has been analysed by obtaining a resulting mesh composed of 51,203 quadrilateral elements. Three meshes-course grid, medium grid and fine grid were used to evaluate the grid independency; three grid units are 29,375, 51,203 and 74,512, respectively. As can be seen from Figure 2, the computational accuracy of the grid with 51,203 units and 74,512 units has a similar variable trend and no further improvement compared with the grid of 29,375 units. Therefore, the simulation model with 51,203 was chosen for reducing the computational time and saving costs in the later simulations. The grid was refined based on the adaptive technology of the Mach number gradient. The quadrilateral structure grid is displayed in Figure 3.

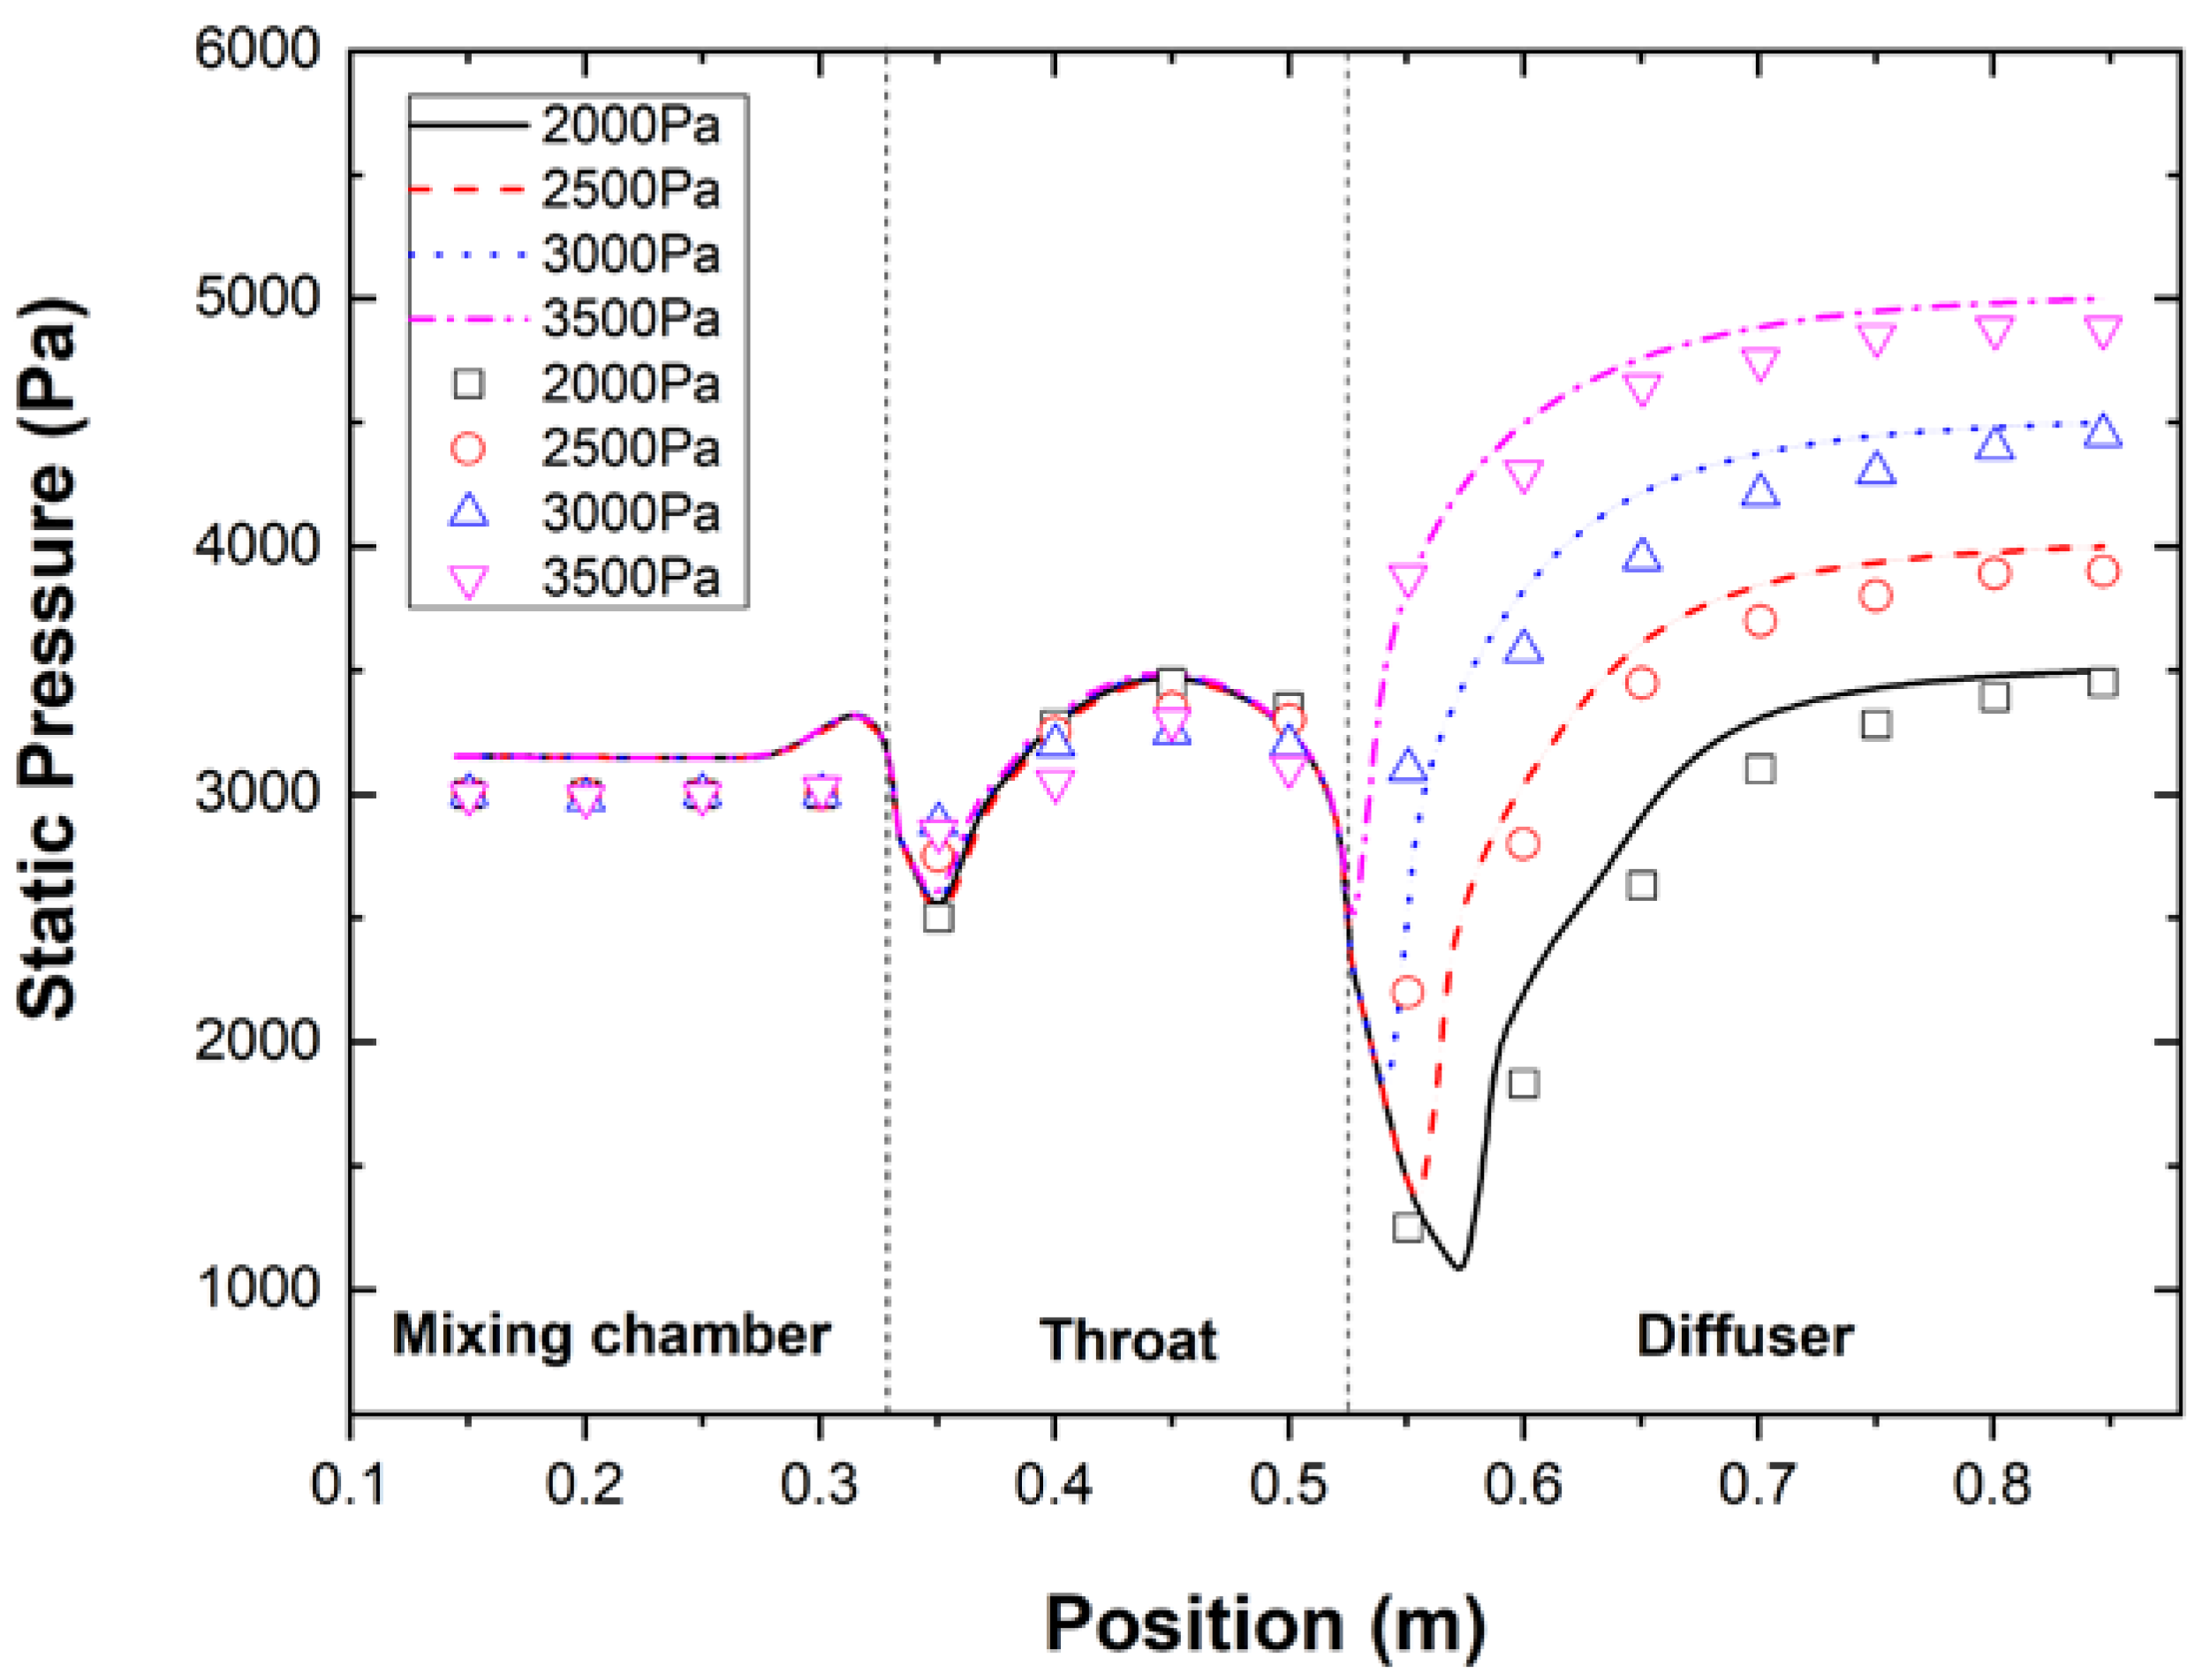
3.2. CFD Model Validation

The static pressure distribution along the wall of the steam ejector was used as the reference data for validating the numerical simulation model. The comparison was conducted when the primary fluid pressure is 0.34 MPa, and the secondary fluid pressure is 1710 Pa with different back pressures. As displayed in Figure 4, the static pressure distribution of the experimental values and simulation values is close. Though in the mixing chamber of the ejector, there is a certain difference between the two. The cause may one is that the simulation assumes that the fluid is ideal gas and the actual situation is based on it but not all. The other is that the sealing property of the experimental equipment and its manufacturing error which it is still controlled within an acceptable range. In the throat and divergent sections, the agreement between the two is good, and the distribution trend of the wall pressure is relatively consistent. The total average deviation of experimental and CFD simulation is less than 8%, which is the allowable error range in the engineering industry. Thus, the feasibility and accuracy of the simulation model can be verified. During the experiment, a thermocouple is used to measure the temperature of the vapour in the evaporator. Owing to the influence of the inlet temperature and the ambient temperature on the thermocouple, the temperature of the steam is in a dynamic change near the set temperature.

3.3. Analysis of the Flow Structure inside the Steam Ejector

Research into the flow characteristics inside the steam ejector is still at the stage of theoretical analysis due to the lack of effective experimental methods. With the advantages of the computational fluid dynamics (CFD) technology, a detailed understanding of the internal flow structure of ejector is conducted in this part. The entire flow region is divided, and a new method of judging the flow characteristics inside the steam ejector is proposed. The simulation is underway in the condition of the primary fluid pressure, the secondary fluid pressure and the backpressure are 0.34 MPa, 1710 Pa and 3500 Pa, respectively.

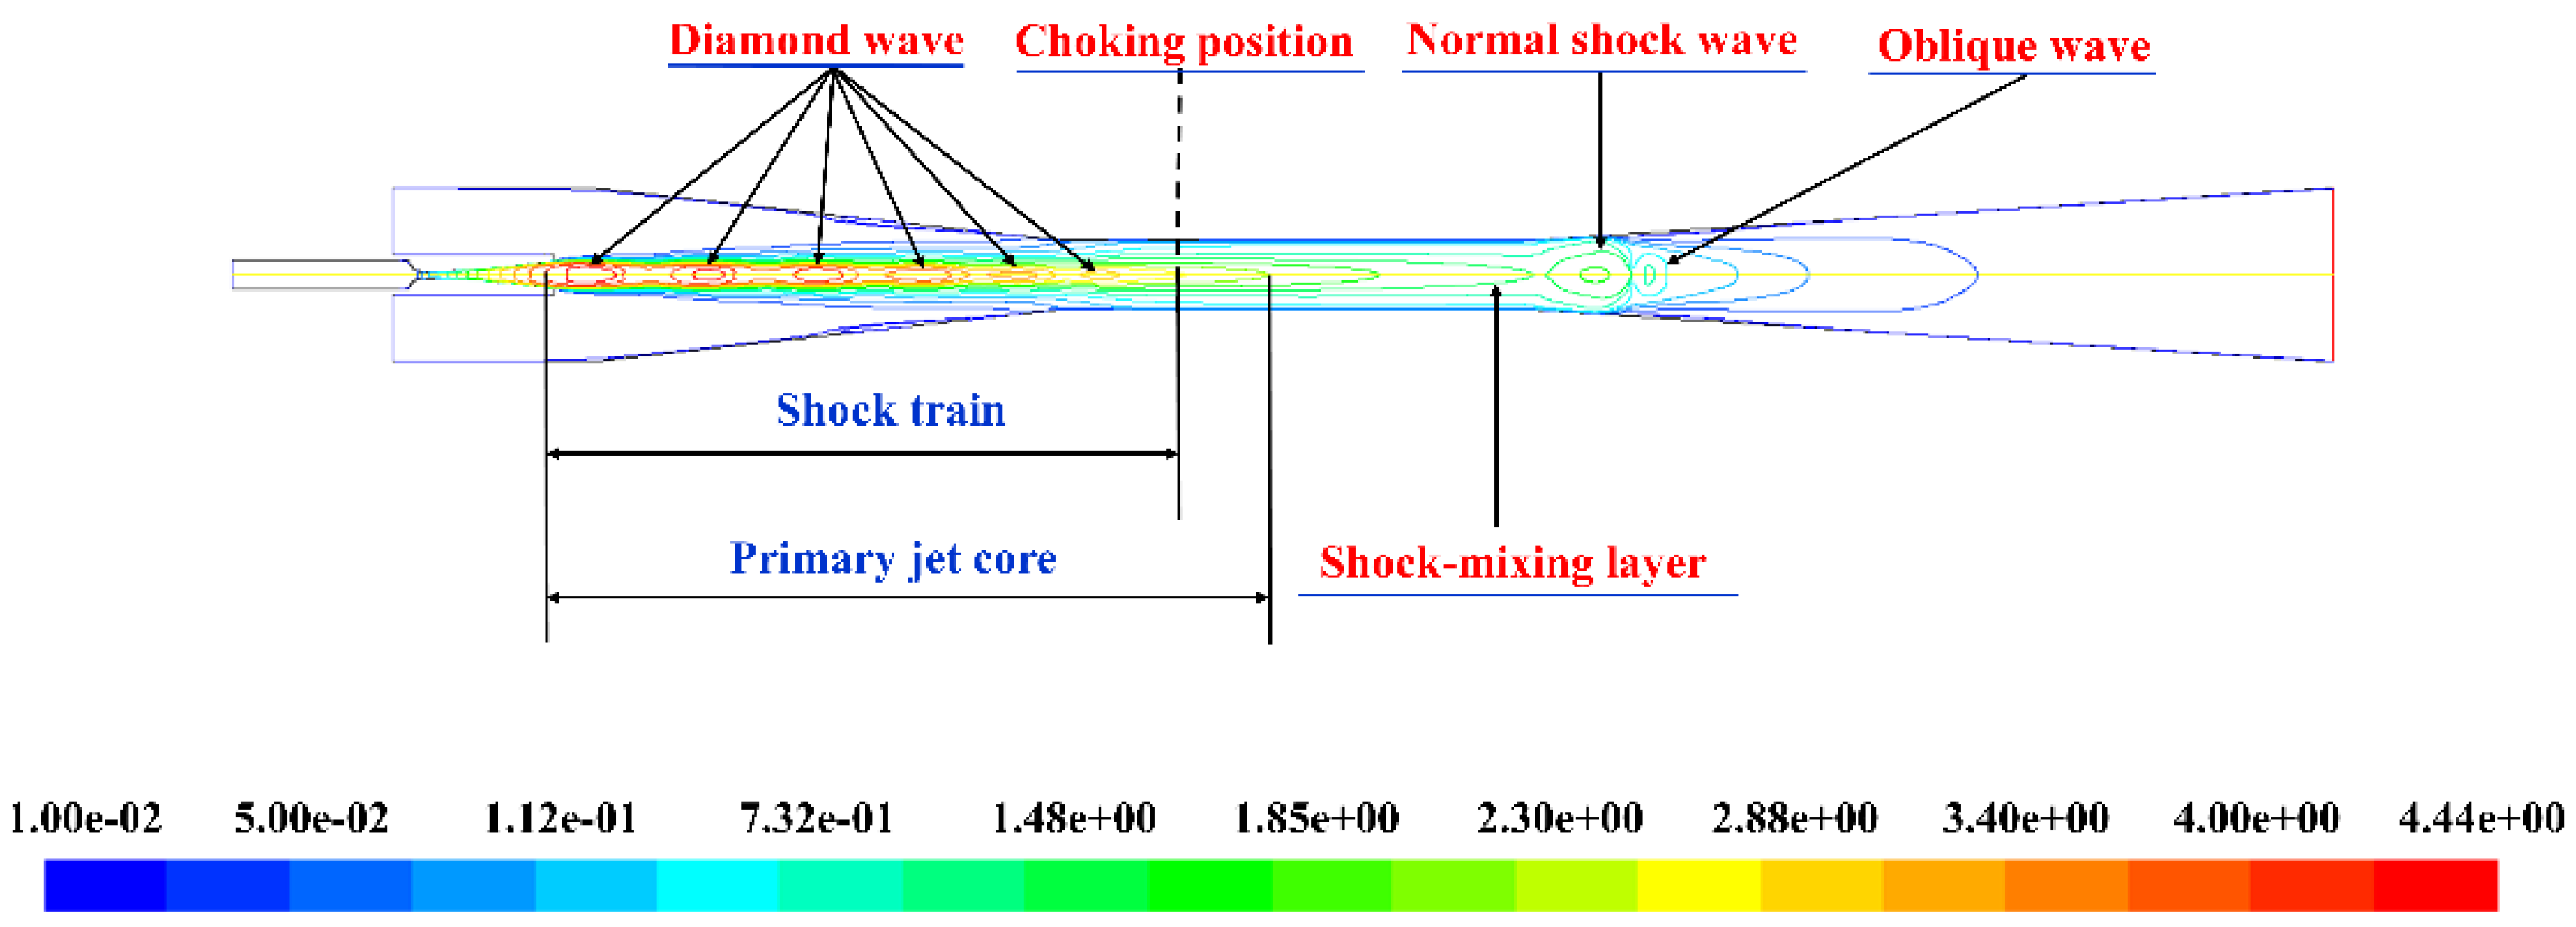
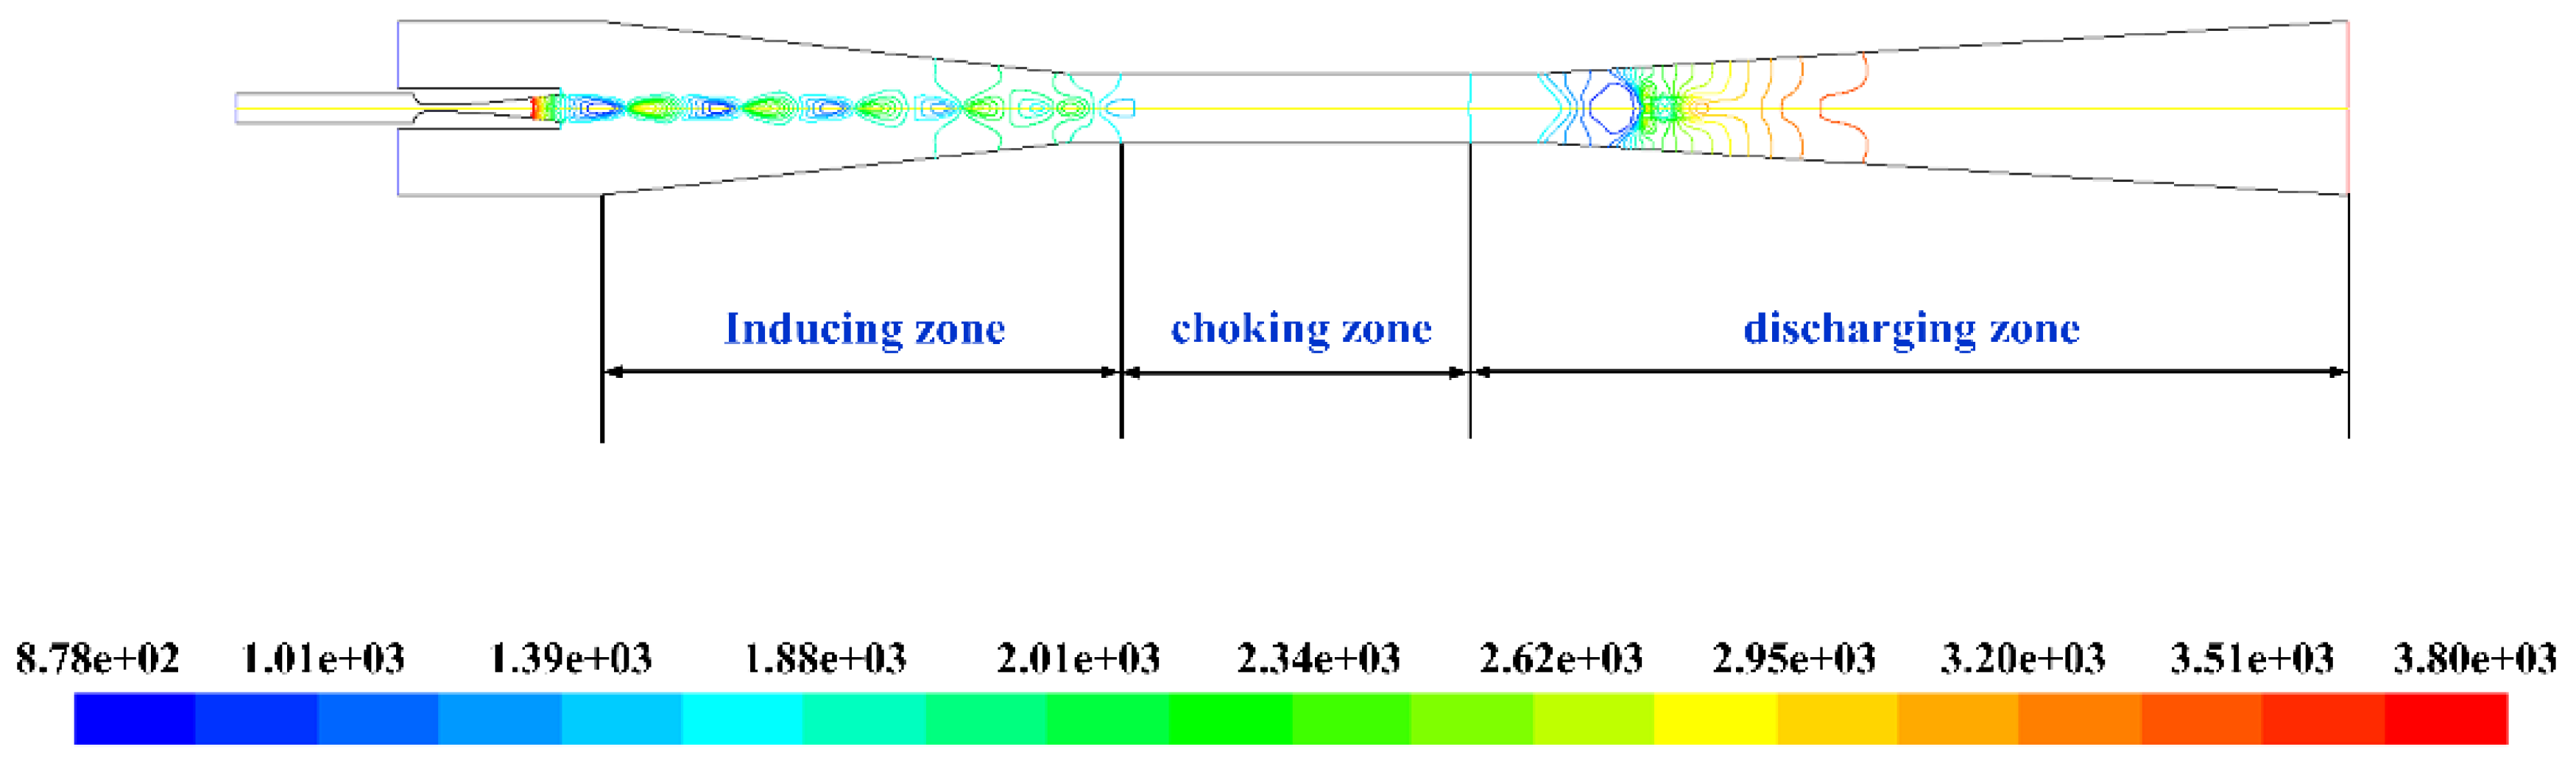
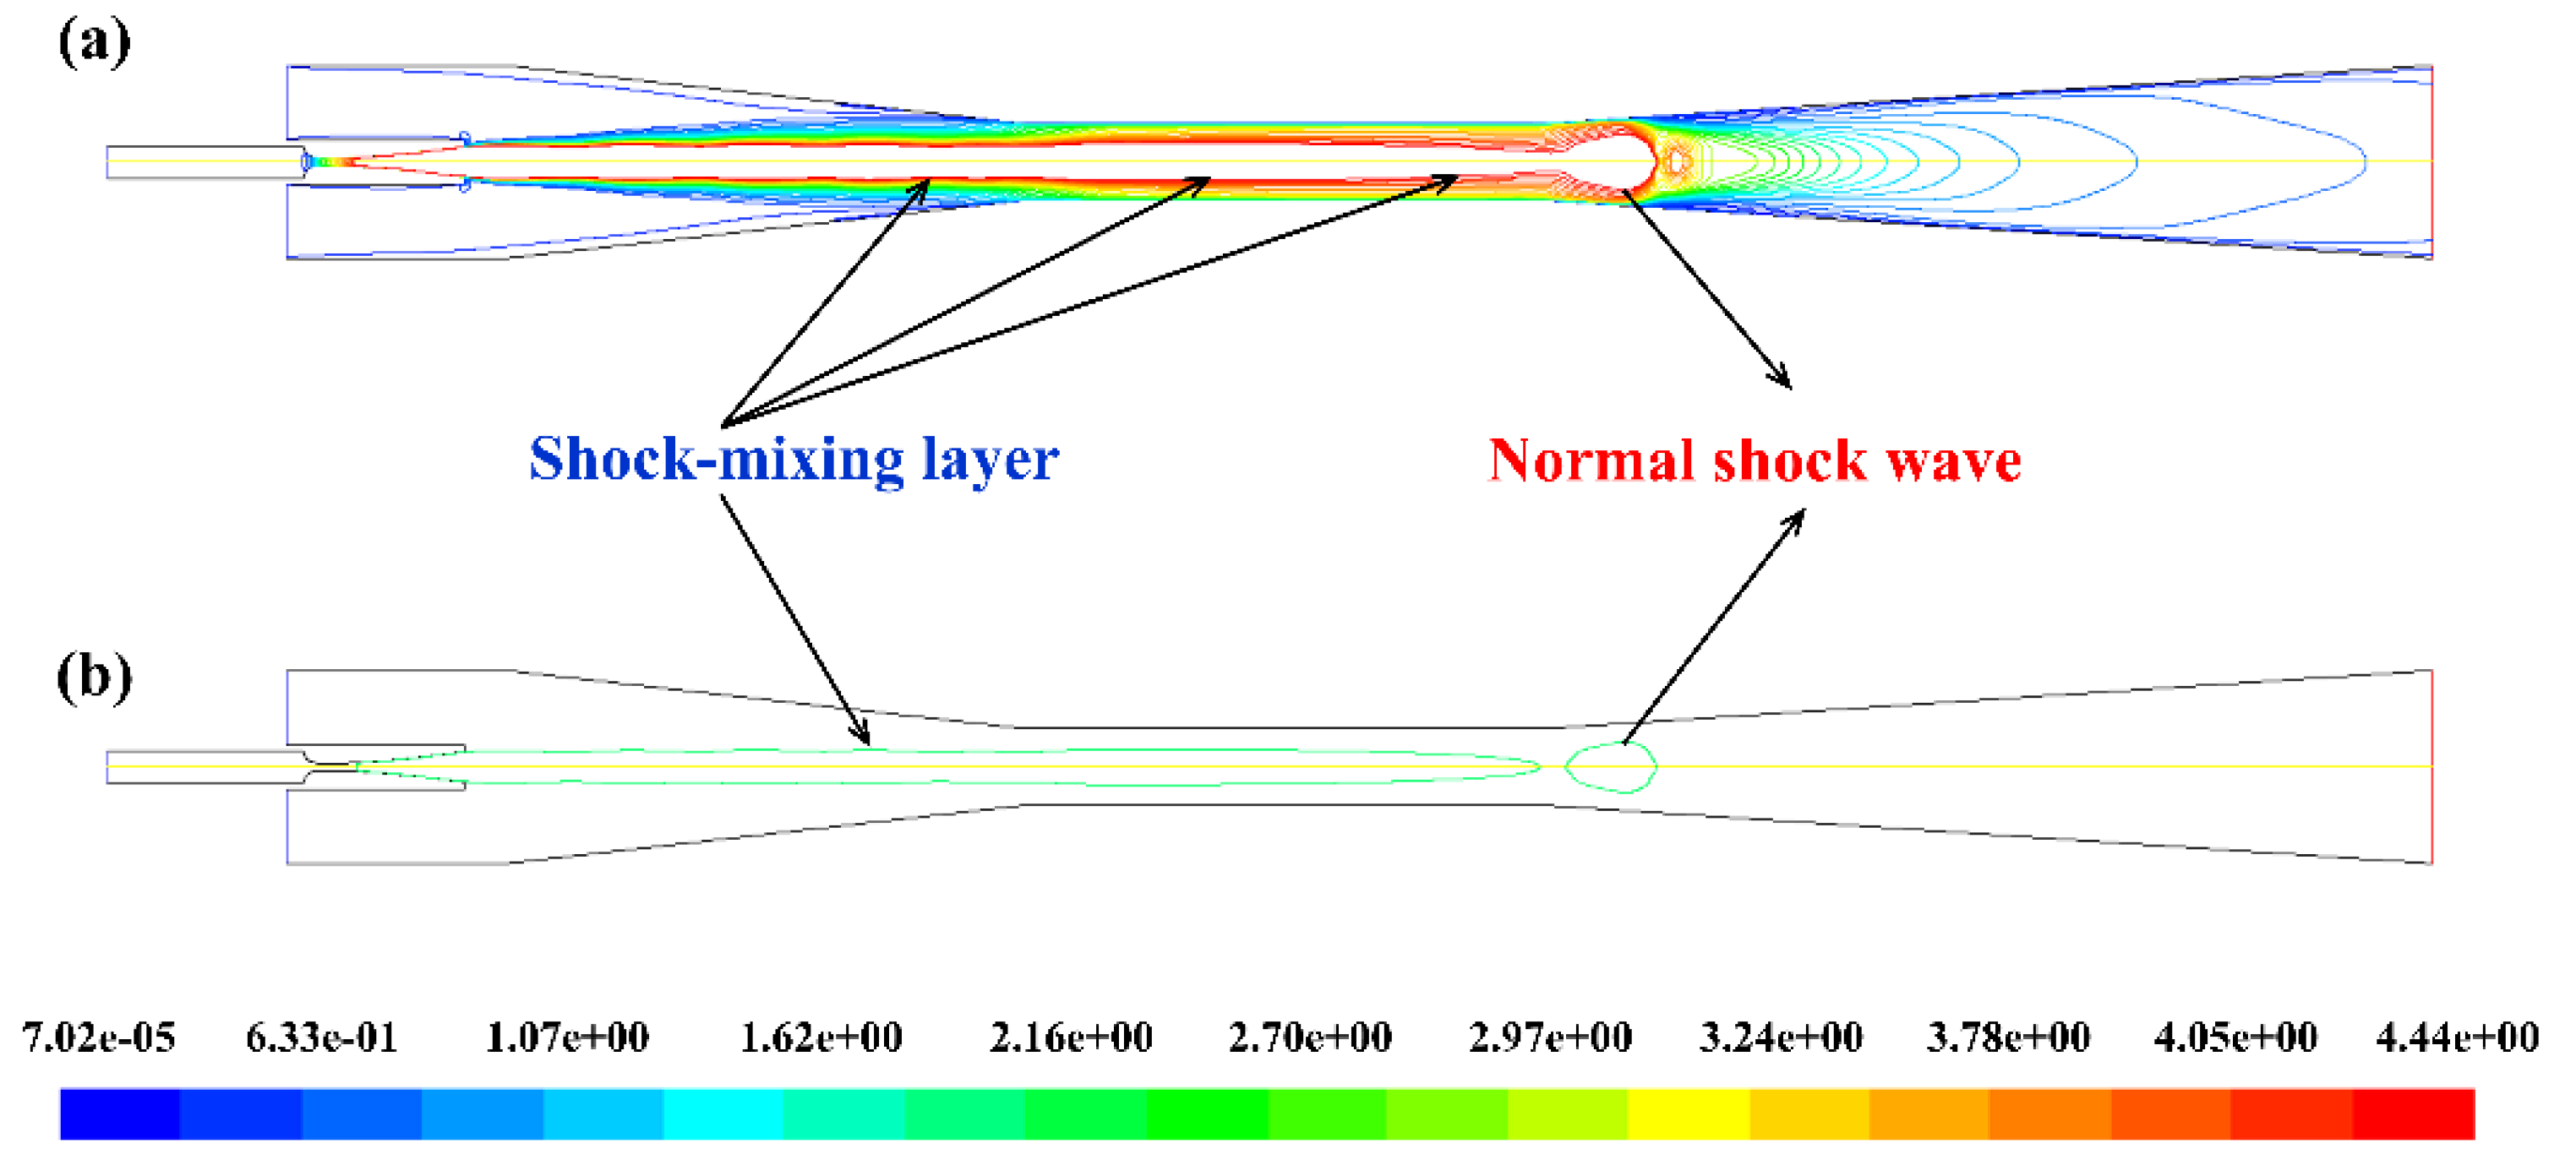
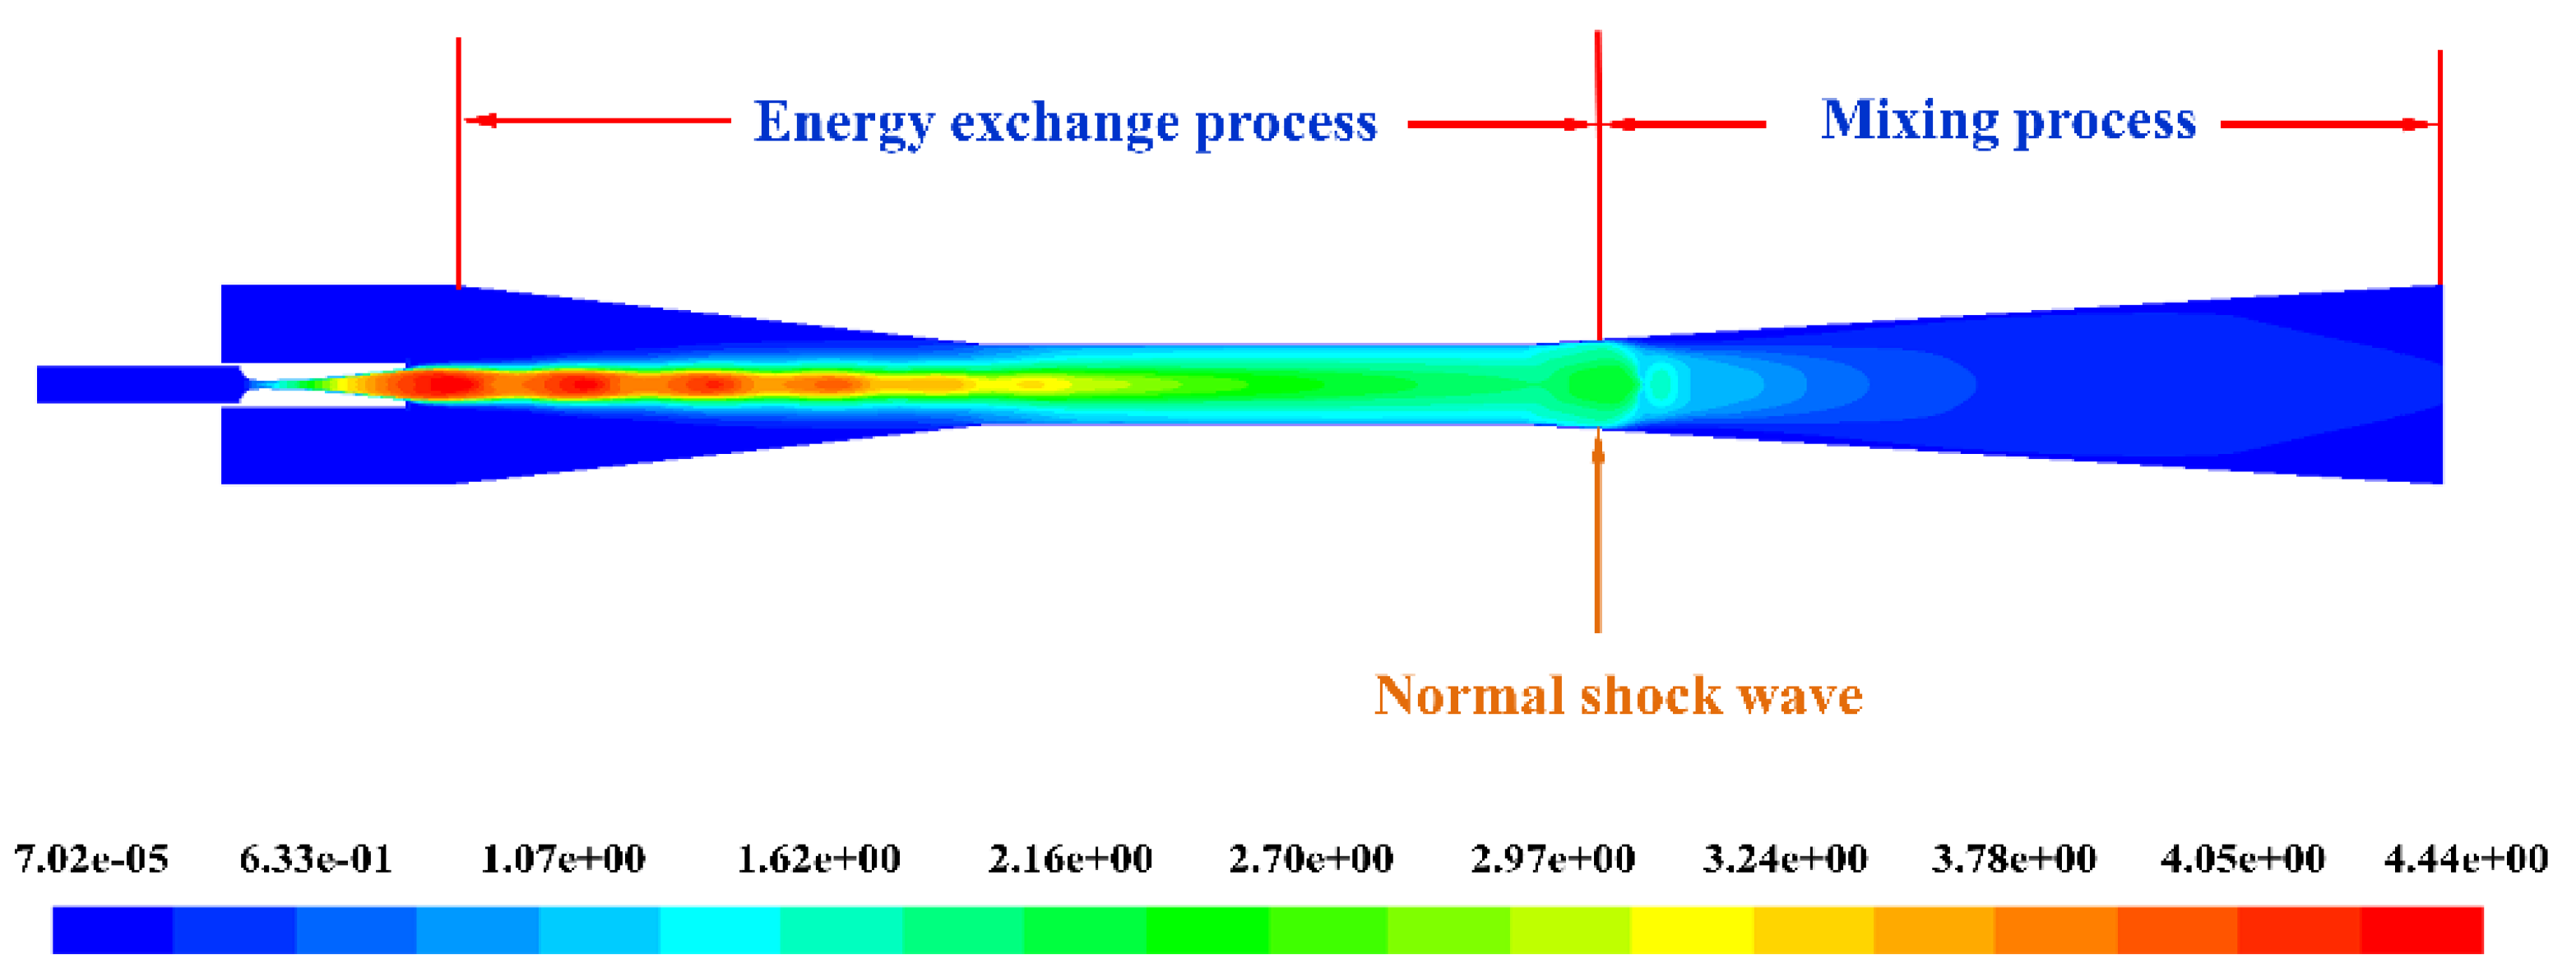
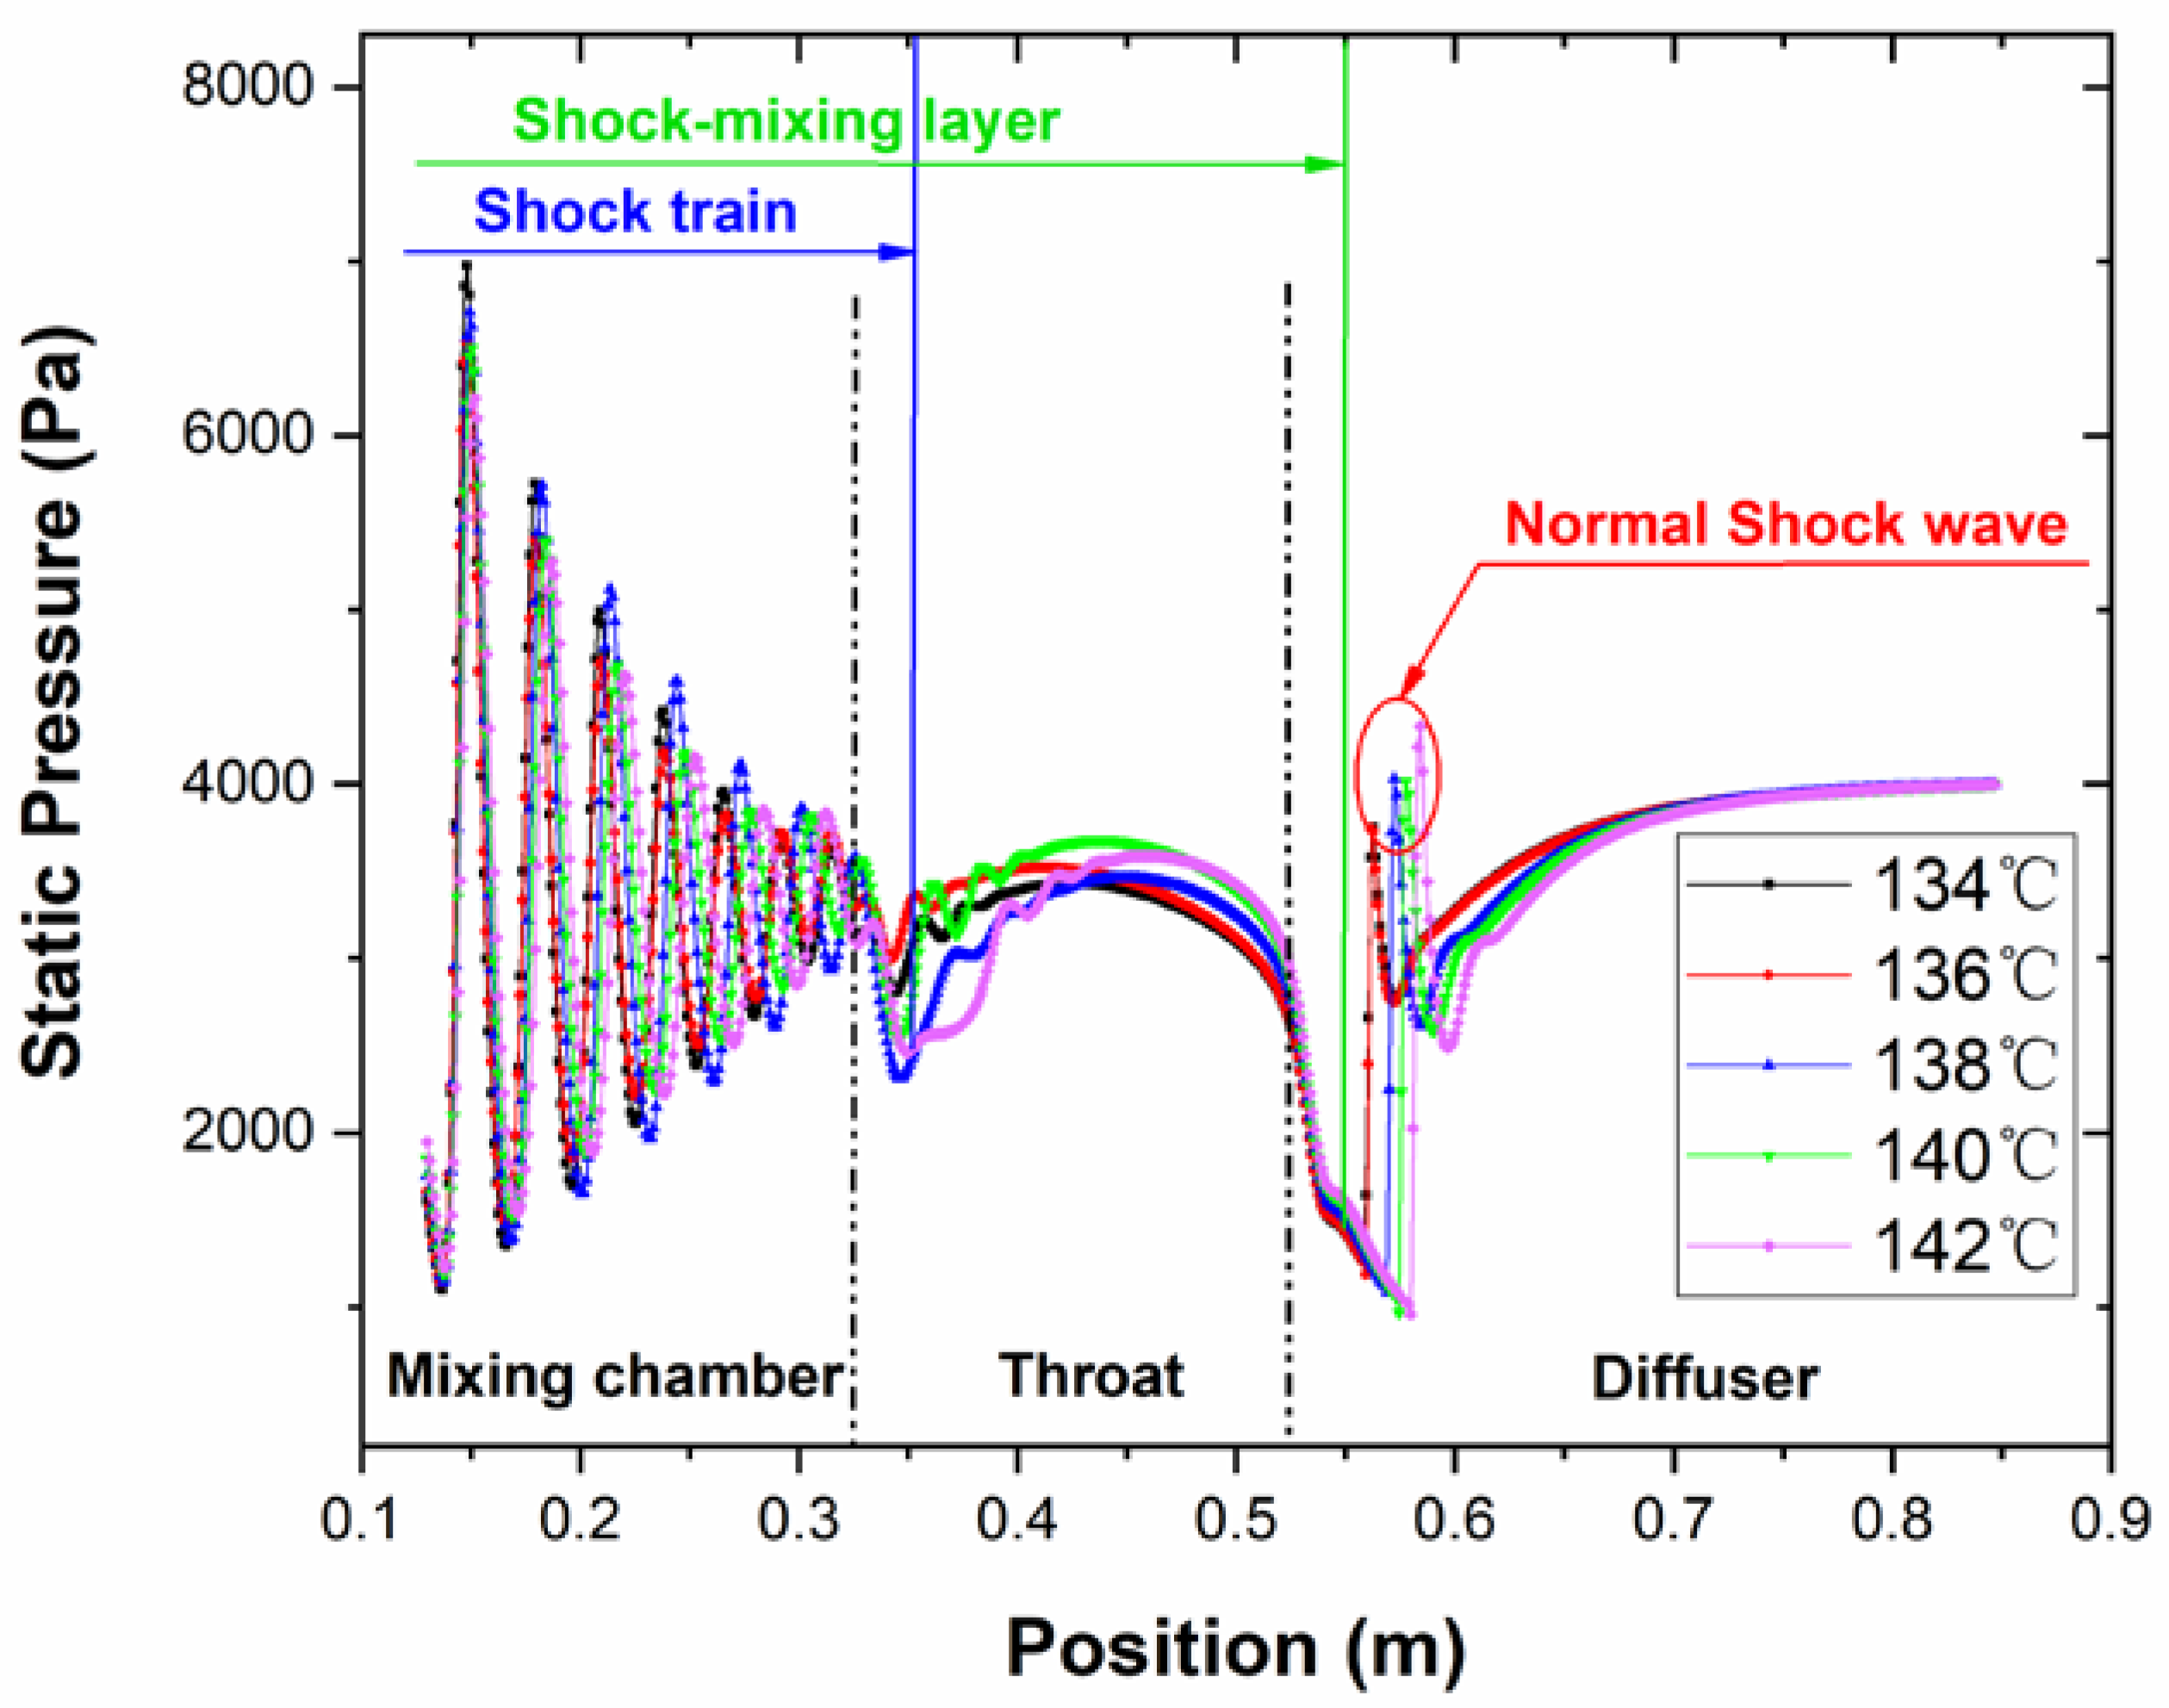
3.3.1. The Division of the Entire Flow Region

The Mach number contour of the static pressure is shown in Figure 5. The fluid flow characteristics of the shock train, the diamond wave, the primary jet core, choking position, shock-mixing layer, the normal shock wave and oblique shock waves can be observed. The flow region is divided into three zones as indicated by the static pressure distribution along the ejector axis in Figure 6. The first flow area is the “inducing zone”. In this zone, the supersonic primary fluid forms a primary jet core after spraying from the nozzle [10]. A low-pressure region was generated at the nozzle outlet. The secondary fluid was pumped into the mixing chamber driven by the pressure difference. Then the secondary fluid was accelerated by the viscous transport capacity of a high-speed shock-mixing layer and reached sonic at the end of the zone. Meanwhile, the intensity of the diamond wave [56] decreased until it disappeared. Under the combined action of the pressure difference and viscous transport capacity of shock-mixing layer, the purpose of pumping and accelerating the secondary fluid has been accomplished.
The second flow area is the “chocking zone”. It can be seen from Figure 6 that the static pressure was constant, and the velocity shows no obvious changes in this zone. One reason is that the energy of the primary jet core had been partly consumed in the previous flow. The other reason was that the secondary fluid flowed in a fixed cross-sectional area (i.e., the effective area [57]). The kinetic and internal energy was continuously added with the increasing of the mass flow rate of the secondary fluid. The two streams began to mix and are at co-velocity at the end of this zone. The mixed fluid was choked and exceeded sonic. Besides, the size of the effective area played an important role in determining the pumping performance of the ejector.
The third flow area is the “discharging zone” where the momentum of the primary fluid decreased while the secondary fluid’s momentum correspondingly increased. However, the primary fluid is still in the supersonic state. A normal shock wave which resulted in the velocity dropping and the pressure rising abruptly was generated to make the mixed fluid overcome the backpressure to discharge from the diffuser section. Meanwhile, the shock-mixing layer was broken as the normal shock wave appeared. The velocity of the two streams completely mixed after a series of oblique shocks. In this zone, the back pressure was the main influencing factor that directly determined the position and intensity of the normal shock wave and oblique shock.

3.3.2. The Shock-Mixing Layer

With the aim of deeply understanding the structure and characteristics of the fluid flow inside the ejector, it is necessary to analyse and discuss the shock-mixing layer of which is the key factor affecting the mixing progress of the two streams. The position and the shape of the shock-mixing layer can be reflected through the powerful visualisation function of the simulation method. The secondary fluid did not mix with the primary fluid immediately after entering the mixing chamber as shown in Figure 7a. The shock-mixing layer with a large velocity gradient between the primary fluid and the secondary fluid is captured. It was the boundary layer of the momentum exchange and mixing between the two streams. It was mainly that the high-speed primary fluid transferred its kinetic and internal energy to the secondary fluid through the viscous transport capacity of the shock-mixing layer. Also, the velocity of the primary fluid decreases gradually through the restraint function of the shock-mixing layer. The borderline of the shock-mixing layer was displayed in Figure 7b. The length range of the shock-mixing layer is from the position of the nozzle outlet to the front of the normal shock wave where the two streams were reaching the co-velocity.
As indicated in Figure 8, the flow process in the ejector can be divided into the energy exchanging process and the mixing process. In Figure 8, the energy and momentum transmissions of the two streams in front of the normal shock wave were conducted in the exchanging progress and the shock-mixing layer was broken, and the two streams began to mix after the normal shock wave was generated in the mixing progress. However, before the beginning of the mixing process of the primary fluid and the secondary fluid, the shock-mixing layer with a certain thickness can be regarded as a wall surface separating the two fluids. The flow duct of the secondary fluid was a converging-diverging structure like that of the primary nozzle. It was consisting of mixing channel, throat and diffuser as displayed in Figure 7a. The only difference between the actual and the imaginary converging-diverging structure was that the inner wall was a moving wall to provide the maximum energy to accelerate the secondary fluid. The secondary fluid was accelerated from stagnation state to supersonic state relying on continuously absorbing the kinetic energy from the moving wall in the energy exchange process. The position where the secondary fluid reaches the sonic velocity is the choking position and mostly is located at the minimum cross-section of the mixing chamber. In the end, the mixed fluid flow completely mixed after flowing through a series of oblique shock waves and the mixed fluid overcame the back pressure to discharge from the ejector. In summary, the whole flow progress is divided by the position of the normal shock wave, the area before the normal shock wave is the energy exchange process region while the area behind the normal shock wave is the mixing process region.

4. Results and Discussion

4.1. The Influence of the Primary Fluid Temperature

As can be seen from the variation of the entrainment ratio with the primary fluid temperature in Figure 9. The operating condition was the secondary fluid temperature, and the back pressure is 15 °C and 3000 Pa, respectively, which the primary fluid temperature varies from 134 °C to 146 °C. The maximum value of the entrainment ratio is 0.69 as the primary fluid temperature is 138 °C. The entrainment ratio increases with the increasing of the primary fluid temperature when it is less than 138 °C. On the contrary, when the temperature is higher than 138 °C, the entrainment ratio gradual declines. In the condition of the constant geometry of the ejector, there exists a primary fluid temperature which optimizes the entrainment ratio. The static pressure lines of the flow structure are as shown in Figure 10 that the length of the shock train and the shock-mixing layer are almost the same. It indicates that these two flow characteristics are less affected by the primary fluid temperature. There is no significant difference inside the mixing chamber and diffuser sections when the temperature changes. Though the Mach number changes a lot at the inlet of the throat section, the shape of the primary fluid jet core is also similar. The local peak value of the normal shock wave increases with the temperature increasing.
With the increase of the primary fluid temperature, the position of the normal shock wave gradually moves from the outlet of the throat section to the inlet of the diffuser section and the intensity of the normal shock wave is enhanced (see Figure 10 and Figure 11). Thus, the ability to resist the interference of the back pressure is significantly improved. Only when the normal shock wave is generated in the diffuser section, the ejector will work in double-choking flow and operates in a normal working state [45]. As mentioned before, the choking zone is an area that the static pressure and velocity were constant. As can be seen from Figure 11, the length of the choking zone changes with the primary fluid temperature. The length of the choking zone reaches the maximum value of 86 mm when the temperature is 138 °C. As the length of the choking zone increases, the inducing zone which is in front of the choking zone is almost the same while the discharge zone after choking zone is shortened. Compared with Figure 9, it is found that the length of the choking zone is a positive linear correlation with the entrainment ratio and the length of the choking zone directly affects the efficiency of the ejector. As the aspect of the energy transmission, the inducing zone and the choking zone were the main areas where the kinetic and the internal energy exchanges between the primary fluid and the secondary fluid. The two zones are including in the energy exchange progress. The results illustrate that the pumping performance of the ejector would be directly determined by the length the energy exchange progress. The longer length of the energy exchange progress, the higher the efficiency of the ejector would be. The length of the choking zone should be increased as the length of the discharging zone should be reduced to improve the pumping performance of the ejector.
When the primary fluid temperature is too high, there will be a velocity reflux flow at the position of the nozzle outlet and a part of the kinetic energy would be lost as shown in the dotted line in Figure 11. It causes the kinetic energy of the primary fluid entering the choking zone reduced, and the entrainment ratio decreased. Although the length of the choking zone is much longer at 146 °C than at 134 °C, the entrainment ratio of the two is similar, which are 0.572 and 0.5684, respectively. Similarly, the length of the choking zone at 144 °C is also the same when the primary fluid temperature is at 136 °C, but the entrainment ratios are different.

4.2. The Influence of the Secondary Fluid Temperature

The Mach number contour of the flow field is shown in Figure 12, as the primary fluid temperature and back pressures of the steam ejector are 138 °C and 3500 Pa, respectively. With the increase of secondary fluid pressure, the length of the shock-mixing layer firstly increases and then decreases. The position of the normal shock moves downstream, and the position of the shock train locates in the mixing chamber section while the choke occurs in the throat section. It shows that the secondary fluid pressure has a significant effect on the flow characteristics of the ejector.
Otherwise, the length of the primary jet core and the shock-mixing layer increases with the increasing of the secondary fluid temperature when it is less than 20 °C. As in the analysis above, the shock-mixing layer is the main momentum and energy exchange region, where the degree of energy and momentum transfer between the two streams are determined. The primary and secondary fluids will not be mixed until the shock-mixing layer disappears. The longer the length of the shock-mixing layer is, the more degree energy and momentum transmission would be. On the other hand, with the secondary fluid temperature increases, the position of the normal shock wave gradually moves downstream indicating that the ability of ejector to resist back pressure disturbance is enhanced and the ejector will operate more stably. As indicated by the variation of the entrainment ratio with the secondary fluid temperature in Figure 13, the increasing of the length of the shock-mixing layer causes the normal shock wave moving downstream and its intensity then the entrainment ratio increases except the temperature of the secondary fluid is at 20 °C. The entrainment ratio is not only influenced by the length of the shock-mixing layer but also relates to the area from the end of shock mixing layer to the beginning of the normal shock wave where the energy and momentum exchanging progress finished and the two streams starts to mix. In this area, the ability of the primary fluid pumping the secondary fluid is continuously enhanced and the mass flow rate of the secondary fluid is also increased resulting in the pumping performance of the ejector will be better and better.
The ratio of the primary fluid pressure to the secondary fluid pressure is generally referred as “expansion ratio”, which is a dimensionless parameter to analyse the flow behaviour and to reflect the efficiency of a steam ejector [15]. As the value of expansion ratio increases, it means more secondary fluid is entrained given the same amount of primary fluid is being consumed. The pumping performance of the ejector will be greatly improved. Comparing Figure 12 with Figure 13, the steam ejector should be operated at relatively higher secondary fluid pressure to maintain the Mach number in a higher value and to pump more mass flow rate of the secondary fluid. The higher of the secondary fluid pressure is, the mixing progress will be, and the larger secondary fluid mass flow rate will be obtained.

4.3. The Influence of the Back Pressure

Figure 14 displays the flow structure inside the steam ejector under different back pressure, when the temperature of the primary and the secondary fluids are 138 °C and 20 °C, respectively. The existence of the normal shock wave prevents the disturbance caused by the back pressure spreading from the diffuser section to the throat section. The increase of the distance between the normal shock wave and the outlet of the ejector leads to reduce the ability to resist the back pressure disturbances. It will be more difficult to form a choking flow which played an important role in affecting the pumping efficiency of the ejector [45]. As can be seen in Figure 15, when the back pressure is less than 4600 Pa, the entrainment ratios are always the same value of 0.546. The boundary layer separation occurs in the mixing chamber section, the normal shock wave disappeared when the back pressure is at 5000 Pa, and the entrainment ratio rapidly drops to 0.27 as shown in Figure 14 and Figure 15. When the back pressure is more than 4600 Pa, the entrainment ratio decreases gradually with the increase of the back pressure until it reaches 0 at 7300 Pa. It shows that the critical back pressure is 4600 Pa. When the back pressure is higher than the critical value, the backpressure is so high that the primary fluid is kept from flowing into the diffuser section, and the choking flow would not be formed due to the largest primary jet core does not move into the mixing chamber. The energy exchange between the primary fluid and the secondary fluid is too short of exchanging momentum and energy with each other enough. The ideal flow passage of the converging-diverging structure of the secondary fluid flow passage is not formed where the secondary fluid cannot be further accelerated in the mixing chamber section to be pumped. Then, the flow rate of the secondary fluid is gradually reduced resulting the entrainment ratio decline (in Figure 14).
In Figure 14 and Figure 16, the length of the shock train is relatively similar, and the flow structure inside the mixing chamber and the throat sections remains the same when the back pressure is less than the critical value (4600 Pa). Also, the entrainment ratio remains constant as the length of shock-mixing layer, and the energy exchange progress is nearly the same. Simultaneously, the energy and momentum transfer process between the primary fluid and the secondary fluid and the velocity distribution in this region are substantially the same. When the back pressure exceeds the critical value, there will be no normal shock exists in the diffuser section. The disturbance caused by the back pressure will propagate to the upstream to destroy the choking flow. Once the choking phenomenon cannot be generated, the mass flow rate of the secondary fluid will sharply drop until zero. When the back pressure is higher than the critical back pressure, the ejector will in the reverse flow mode resulting in mass flow rate of the secondary reduced and the entrainment ratio decreases as shown in Figure 15.

5. Conclusions

The use of steam ejector refrigeration technology to recover waste heat from engine combustion and convert it into useful energy is an effective energy-saving and environmental protection measure. A steam ejector refrigeration system driven by the engine combustion waste heat in the minibus with the cooling capacity of 12.5 kW was proposed. An experimental setup of the steam ejector refrigeration system was established. The computational fluid dynamics (CFD) approach was used to analyse the internal flow characteristic inside the steam ejector which cannot be fully accessed and studied through the experiment research. The influence of fluid flow characteristics on the pumping performance of the steam ejector was comprehensively studied. The reasons for the variation of the entrainment ratio under the operating parameters (i.e., the primary fluid temperature, the secondary fluid temperature and the back pressure) were also discussed. In summary, the following are the key findings from this study: (i) the entire flow area inside the steam ejector was divided into three regions: the inducing zone, the chocking zone and the discharging zone. Also, the energy exchange progress and the mixing progress are determined; (ii) the position and the shape of the shock-mixing layer which the boundary layer separating the primary fluid from the secondary fluid was defined, (iii) in the range of the primary fluid temperature from 134 °C to 138 °C, the entrainment ratio was positively correlated with the length of the choking zone. However, though the length of the choking zone increases, the pumping performance of the steam ejector would be reduced when the temperature of the primary fluid exceeds 138 °C; (iv) The shock-mixing layer only increased with the temperature until 15 °C, and then a significant drop happened at 20 °C. It indicates that the entrainment ratio increased from 5 °C to 20 °C, in which the improvement from 15 °C to 20 °C was marginal; and (v) with the increase of the back pressure, the normal shock moved from the diffuser section to the throat section. When the back pressure is less than the critical value (4600 Pa), the length of the shock-mixing layer is not significantly affected. As the back pressure exceeds the critical pressure, due to the disappearance of the normal shock wave, the choking condition cannot be maintained causing the pumping efficiency drops rapidly until the steam ejector lost its pumping capacity. Generally, this in-depth numerical and experimental study provided major insight structural design optimizations of steam ejectors.

Author Contributions

Conceptualization, Y.H. and L.G.; algorithm, Y.H. and X.W.; software, Y.H., R.C., T.B.Y.C. and H.L.; data curation, Y.H., C.L. and H.L.; formal analysis, Y.H. and A.C.Y.Y.; numerical simulations, Y.H., and R.C.; validation, A.C.Y.Y. and C.L.; writing—original draft preparation, Y.H. and X.W.; writing—review and editing, L.G. and A.C.Y.Y.; visualization, C.L. and A.C.Y.Y.; supervision, J.T. and G.H.Y.; funding acquisition, X.W., J.T. and G.H.Y.

Funding

This research was funded by the National Natural Science Foundation of China (51775098), the Australian Research Council (DP160101953) and the Australian Research Council Industrial Transformation Training Centre (ARC IC170100032) in the University of New South Wale. All financial and technical support are deeply appreciated by the authors.

Conflicts of Interest

The authors declare no conflict of interest.

References

  1. Wang, L.; Cai, W.; Zhao, H.; Lin, C.; Yan, J. Experimentation and cycle performance prediction of hybrid A/C system using automobile exhaust waste heat. Appl. Therm. Eng. 2016, 94, 314–323. [Google Scholar] [CrossRef]
  2. Li, A.; Yuen, A.Y.C.; Chen, T.B.Y.; Wang, C.; Liu, H.L.; Cao, R.F.; Yang, W.; Yeoh, G.H.; Timchenko, V. Computational Study of Wet Steam Flow to Optimize Steam Ejector Efficiency for Potential Fire Suppression Application. Appl. Sci. 2019, 9, 1486. [Google Scholar] [CrossRef]
  3. Wu, H.; Liu, Z.; Han, B.; Li, Y. Numerical investigation of the influences of mixing chamber geometries on steam ejector performance. Desalination 2014, 353, 15–20. [Google Scholar] [CrossRef]
  4. Sumeru, K.; Martin, L.; Ani, F.N.; Nasution, H. Energy savings in air conditioning system using ejector: An overview. Appl. Mech. Mater. 2014, 493, 93–98. [Google Scholar] [CrossRef]
  5. Hamner, R.M. An Alternate Source of Cooling- the Ejector-Compression Heat-Pump. Ashrae J.-Am. Soc. Heat. Refrig. Air-Cond. Eng. 1980, 22, 62–66. [Google Scholar]
  6. Passengers, I. Determination of the ejector dimensions of a bus air-conditioning system using analytical and numerical methods. Appl. Therm. Eng. 2015, 90, 110–119. [Google Scholar]
  7. Chunnanond, K.; Aphornratana, S. Ejectors: Applications in refrigeration technology. Renew. Sustain. Energy Rev. 2004, 8, 129–155. [Google Scholar] [CrossRef]
  8. Poirier, M.; Giguère, D.; Sapoundjiev, H. Experimental parametric investigation of vapor ejector for refrigeration applications. Energy 2018, 162, 1287–1300. [Google Scholar] [CrossRef]
  9. Haghparast, P.; Sorin, M.V.; Nesreddine, H. The impact of internal ejector working characteristics and geometry on the performance of a refrigeration cycle. Energy 2018, 162, 728–743. [Google Scholar] [CrossRef]
  10. Sriveerakul, T.; Aphornratana, S.; Chunnanond, K. Performance prediction of steam ejector using computational fluid dynamics: Part 1. Validation of the CFD results. Int. J. Therm. Sci. 2007, 46, 812–822. [Google Scholar] [CrossRef]
  11. Wang, X.; Dong, J.; Li, A.; Lei, H.; Tu, J. Numerical study of primary steam superheating effects on steam ejector flow and its pumping performance. Energy 2014, 78, 205–211. [Google Scholar] [CrossRef]
  12. Riffat, S.B.; Jiang, L.; Gan, G. Recent development in ejector technology—A review. Int. J. Ambient Energy 2005, 26, 13–26. [Google Scholar] [CrossRef]
  13. Stoecker, W.F. Steam-Jet Refrigeration; McGraw-Hill: Boston, MA, USA, 1958. [Google Scholar]
  14. Chen, J.; Jarall, S.; Havtun, H.; Palm, B. A review on versatile ejector applications in refrigeration systems. Renew. Sustain. Energy Rev. 2015, 49, 67–90. [Google Scholar] [CrossRef]
  15. Besagni, G.; Mereu, R.; Inzoli, F. Ejector refrigeration: A comprehensive review. Renew. Sustain. Energy Rev. 2016, 53, 373–407. [Google Scholar] [CrossRef] [Green Version]
  16. Sanaye, S.; Emadi, M.; Refahi, A. Thermal and economic modeling and optimization of a novel combined ejector refrigeration cycle. Int. J. Refrig. 2019, 98, 480–493. [Google Scholar] [CrossRef]
  17. Ahmadzadeh, A.; Salimpour, M.R.; Sedaghat, A. Thermal and exergoeconomic analysis of a novel solar driven combined power and ejector refrigeration (CPER) system. Int. J. Refrig. 2017, 83, 143–156. [Google Scholar] [CrossRef]
  18. Li, A.; Yeoh, G.H.; Timchenko, V.; Yuen, A.C.Y.; Wang, X. Numerical Study of Condensation Effect on a Steam Ejector by Wet Steam Model. In Proceedings of the Thirteenth International Conference on Flow Dynamics (ICFD2016), Sendai, Japan, 10–12 October 2016; Volume 12, pp. 492–493. [Google Scholar]
  19. Yang, Y.; Zhu, X.; Yan, Y.; Ding, H.; Wen, C. Performance of supersonic steam ejectors considering the nonequilibrium condensation phenomenon for e ffi cient energy utilisation. Appl. Energy 2019, 242, 157–167. [Google Scholar] [CrossRef]
  20. Zhang, G.; Zhang, X.; Wang, D.; Jin, Z.; Qin, X. Performance evaluation and operation optimization of the steam ejector based on modified model. Appl. Therm. Eng. 2019, 163, 114388. [Google Scholar] [CrossRef]
  21. Wang, X.; Dong, J.; Zhang, G.; Fu, Q.; Li, H.; Han, Y.; Tu, J. The primary pseudo-shock pattern of steam ejector and its influence on pumping efficiency based on CFD approach. Energy 2019, 167, 224–234. [Google Scholar] [CrossRef]
  22. Han, Y.; Wang, X.; Sun, H.; Zhang, G.; Guo, L.; Tu, J. CFD simulation on the boundary layer separation in the steam ejector and its influence on the pumping performance. Energy 2019, 167, 469–483. [Google Scholar] [CrossRef]
  23. Glushniova, A.V.; Saveliev, A.S.; Son, E.E.; Tereshonok, D.V. Shock wave-boundary layer interaction on the non-adiabatic ramp surface. High Temp. 2014, 52, 220–224. [Google Scholar] [CrossRef]
  24. Bartosiewicz, Y.; Aidoun, Z.; Mercadier, Y. Numerical assessment of ejector operation for refrigeration applications based on CFD. Appl. Therm. Eng. 2006, 26, 604–612. [Google Scholar] [CrossRef]
  25. Zhu, Y.; Jiang, P. Experimental and analytical studies on the shock wave length in convergent and convergent-divergent nozzle ejectors. Energy Convers. Manag. 2014, 88, 907–914. [Google Scholar] [CrossRef]
  26. Zhu, Y.; Cai, W.; Wen, C.; Li, Y. Shock circle model for ejector performance evaluation. Energy Convers. Manag. 2007, 48, 2533–2541. [Google Scholar] [CrossRef]
  27. Varga, S.; Oliveira, A.C.; Diaconu, B. Numerical assessment of steam ejector efficiencies using CFD. Int. J. Refrig. 2009, 32, 1203–1211. [Google Scholar] [CrossRef]
  28. Jeong, H.; Utomo, T.; Ji, M.; Lee, Y.; Lee, G.; Chung, H. CFD analysis of flow phenomena inside thermo vapor compressor influenced by operating conditions and converging duct angles. J. Mech. Sci. Technol. 2009, 23, 2366–2375. [Google Scholar] [CrossRef]
  29. Ruangtrakoon, N.; Thongtip, T.; Aphornratana, S.; Sriveerakul, T. CFD simulation on the effect of primary nozzle geometries for a steam ejector in refrigeration cycle. Int. J. Therm. Sci. 2013, 63, 133–145. [Google Scholar] [CrossRef]
  30. Sankarlal, T.; Mani, A. Experimental studies on an ammonia ejector refrigeration system. Int. Commun. Heat Mass Transf. 2006, 33, 224–230. [Google Scholar] [CrossRef]
  31. Ramesh, A.S.; Joseph Sekhar, S. Experimental Studies on the Effect of Suction Chamber Angle on the Entrainment of Passive Fluid in a Steam Ejector. J. Fluids Eng. 2017, 140, 011106. [Google Scholar] [CrossRef]
  32. Ramesh, A.S.; Sekhar, S.J. Experimental and numerical investigations on the effect of suction chamber angle and nozzle exit position of a steam-jet ejector. Energy 2018, 164, 1097–1113. [Google Scholar] [CrossRef]
  33. Fu, W.; Liu, Z.; Li, Y.; Wu, H.; Tang, Y. Numerical study for the influences of primary steam nozzle distance and mixing chamber throat diameter on steam ejector performance. Int. J. Therm. Sci. 2018, 132, 509–516. [Google Scholar] [CrossRef]
  34. Bartosiewicz, Y.; Aidoun, Z.; Desevaux, P.; Mercadier, Y. Numerical and experimental investigations on supersonic ejectors. Int. J. Heat Fluid Flow 2005, 26, 56–70. [Google Scholar] [CrossRef]
  35. Ariafar, K.; Buttsworth, D.; Al-Doori, G.; Sharifi, N. Mixing layer effects on the entrainment ratio in steam ejectors through ideal gas computational simulations. Energy 2016, 95, 380–392. [Google Scholar] [CrossRef]
  36. Sharifi, N.; Sharifi, M. Reducing energy consumption of a steam ejector through experimental optimization of the nozzle geometry. Energy 2014, 66, 860–867. [Google Scholar] [CrossRef]
  37. Matsuo, S.; Kanesaki, K.; Nagao, J.; Khan, M.T.I.; Setoguchi, T.; Kim, H.D. Effects of Supersonic Nozzle Geometry on Characteristics of Shock Wave Structure. Open J. Fluid Dyn. 2012, 2, 181–186. [Google Scholar] [CrossRef]
  38. García Del Valle, J.; Sáiz Jabardo, J.M.; Castro Ruiz, F.; San José Alonso, J. A one dimensional model for the determination of an ejector entrainment ratio. Int. J. Refrig. 2012, 35, 772–784. [Google Scholar] [CrossRef]
  39. Sriveerakul, T.; Aphornratana, S.; Chunnanond, K. Performance prediction of steam ejector using computational fluid dynamics: Part 2. Flow structure of a steam ejector influenced by operating pressures and geometries. Int. J. Therm. Sci. 2007, 46, 823–833. [Google Scholar] [CrossRef]
  40. Pianthong, K.; Seehanam, W.; Behnia, M.; Sriveerakul, T.; Aphornratana, S. Investigation and improvement of ejector refrigeration system using computational fluid dynamics technique. Energy Convers. Manag. 2007, 48, 2556–2564. [Google Scholar] [CrossRef]
  41. Eames, I.W.; Aphornratana, S.; Haider, H. A theoretical and experimental study of a small-scale steam jet refrigerator. Int. J. Refrig. 1995, 18, 378–386. [Google Scholar] [CrossRef]
  42. Yuen, A.C.Y.; Yeoh, G.H.; Cheung, S.C.P.; Chan, Q.N.; Chen, T.B.Y.; Yang, W.; Lu, H. Numerical study of the development and angular speed of a small-scale fire whirl. J. Comput. Sci. 2018, 27, 21–34. [Google Scholar] [CrossRef]
  43. Yuen, A.C.Y.; Chen, T.B.Y.; Yeoh, G.H.; Yang, W.; Cheung, S.C.P.; Cook, M.; Yu, B.; Chan, Q.N.; Yip, H.L. Establishing pyrolysis kinetics for the modelling of the flammability and burning characteristics of solid combustible materials. J. Fire Sci. 2018, 36, 494–517. [Google Scholar] [CrossRef] [Green Version]
  44. Huang, B.J.; Chang, J.M.; Wang, C.P.; Petrenko, V.A. 1-D analysis of ejector performance. Int. J. Refrig. 1999, 22, 354–364. [Google Scholar] [CrossRef]
  45. Selvaraju, A.; Mani, A. Analysis of a vapour ejector refrigeration system with environment friendly refrigerants. Int. J. Therm. Sci. 2004, 43, 915–921. [Google Scholar] [CrossRef]
  46. Sharifi, N.; Boroomand, M.; Sharifi, M. Numerical assessment of steam nucleation on thermodynamic performance of steam ejectors. Appl. Therm. Eng. 2013, 52, 449–459. [Google Scholar] [CrossRef]
  47. Sharifi, N.; Boroomand, M.; Kouhikamali, R. Wet steam flow energy analysis within thermo-compressors. Energy 2012, 47, 609–619. [Google Scholar] [CrossRef]
  48. Ariafar, K.; Buttsworth, D.; Al-Doori, G.; Malpress, R. Effect of mixing on the performance of wet steam ejectors. Energy 2015, 93, 2030–2041. [Google Scholar] [CrossRef]
  49. Aphornratana, S.; Eames, I.W. A small capacity steam-ejector refrigerator: Experimental investigation of a system using ejector with movable primary nozzle. Int. J. Refrig. 1997, 20, 352–358. [Google Scholar] [CrossRef]
  50. Yuen, A.C.Y.; Yeoh, G.H.; Timchenko, V.; Chen, T.B.Y.; Chan, Q.N.; Wang, C.; Li, D.D. Comparison of detailed soot formation models for sooty and non-sooty flames in an under-ventilated ISO room. Int. J. Heat Mass Transf. 2017, 115, 717–729. [Google Scholar] [CrossRef]
  51. Yuen, A.C.Y.; Yeoh, G.H.; Timchenko, V.; Cheung, S.C.P.; Barber, T.J. Importance of detailed chemical kinetics on combustion and soot modelling of ventilated and under-ventilated fires in compartment. Int. J. Heat Mass Transf. 2016, 96, 171–188. [Google Scholar] [CrossRef]
  52. Shih, T.H.; Liou, W.W.; Shabbir, A.; Yang, Z.; Zhu, J. A new κ-ε eddy viscosity model for high reynolds number turbulent flows. Comput. Fluids 1995, 24, 227–238. [Google Scholar] [CrossRef]
  53. Yang, X.; Long, X.; Yao, X. Numerical investigation on the mixing process in a steam ejector with different nozzle structures. Int. J. Therm. Sci. 2012, 56, 95–106. [Google Scholar] [CrossRef]
  54. Yuen, A.C.Y.; Yeoh, G.H. Numerical Simulation of an Enclosure Fire in a Large Test Hall. Comput. Therm. Sci. 2013, 5, 459–471. [Google Scholar] [CrossRef]
  55. Yuen, A.C.Y.; Yeoh, G.H.; Timchenko, V.; Cheung, S.C.P.; Chan, Q.N.; Chen, T. On the influences of key modelling constants of large eddy simulations for large-scale compartment fires predictions. Int. J. Comput. Fluid Dyn. 2017, 31, 324–337. [Google Scholar] [CrossRef]
  56. Dvorak, V.; Safarik, P. Transonic instability in entrance part of mixing chamber of high-speed ejector. J. Therm. Sci. 2005, 14, 258–264. [Google Scholar] [CrossRef]
  57. Monday, J.T.; Bagster, D.F. A New Ejector Theory Applied to Steam Jet Refrigeration. Ind. Eng. Chem. Process Des. Dev. 1977, 16, 442–449. [Google Scholar] [CrossRef]
Figure 1. The experimental steam ejector refrigeration system.
Applsci 09 04275 g001
Figure 2. The Mach number with different grid density.
Applsci 09 04275 g002
Figure 3. The structural grid of the computational domain.
Applsci 09 04275 g003
Figure 4. Wall pressure distribution under different back pressure.
Applsci 09 04275 g004
Figure 5. Fluid flow structure inside the ejector.
Applsci 09 04275 g005
Figure 6. Flow zones distribution in the steam ejector.
Applsci 09 04275 g006
Figure 7. The location and range of the shock-mixing layer (a) the contour of Mach number (b) the borderline.
Applsci 09 04275 g007
Figure 8. Flow structure partition under the influence of the shock-mixing layer.
Applsci 09 04275 g008
Figure 9. The variation of the entrainment ratio with the primary fluid pressure.
Applsci 09 04275 g009
Figure 10. Comparison of static pressure distribution along the axis under different primary fluid pressure.
Applsci 09 04275 g010
Figure 11. The contours of Mach number under various primary fluid temperature.
Applsci 09 04275 g011
Figure 12. The contours of Mach number for various secondary fluid temperature.
Applsci 09 04275 g012
Figure 13. The variation of the entrainment ratio with different secondary fluid temperature.
Applsci 09 04275 g013
Figure 14. Contours of Mach number for various back pressure.
Applsci 09 04275 g014
Figure 15. Comparison of entrainment ratio and the mass flow rate of two streams under different back pressure.
Applsci 09 04275 g015
Figure 16. Comparison of static pressure distribution along the ejector axis by different back pressure.
Applsci 09 04275 g016
Table 1. Geometrical parameters of the steam ejector.
Geometrical ParametersValue
Diameter of the nozzle inlet12 mm
Diameter of the nozzle outlet11 mm
Diameter of the nozzle throat2.5 mm
Expand the angle of the nozzle10°
Nozzle exit position10 mm
Diameter of mixing chamber inlet70 mm
Diameter of throat28 mm
Length of mixing chamber122.2 mm
Length of throat90 mm
Length of diffuser210 mm
Table 2. Flow conditions of the steam ejector.
Boundary ConditionsValue
Primary fluid temperature134 °C~146 °C
Secondary fluid temperature
Back pressure
5 °C~20 °C
3000 Pa~5000 Pa

