Abstract
The formation of Fano resonance based on graphene heptamers with symmetry and the effect of nanoparticles at different positions on the collective behavior are investigated in this paper. The significances of central nanodisks on the whole structure are studied first by varying the chemical potential. In addition, the effect of six graphene nanodisks placed in the ring on collective behaviors is also investigated. The influence of the nanodisks at different positions of the ring on the Fano resonance spectrum of the whole oligomer is researched by changing the chemical potential and radius. The proposed nanostructures may find broad applications in the fields of chemical and biochemical sensing.
1. Introduction
Surface plasmon resonance (SPR), including localized surface plasmon resonance (LSPR) and propagating surface plasmon polariton (SPP) [1,2], is a special electromagnetic mode formed by the interaction between the collective oscillation of electrons moving freely on the material surface and the incident photons. The LSPR means that the electromagnetic oscillation is limited to the surface of the metal nanoparticle or the surface of the metal nanostructures, which is closely related to the size of the metal particle and the geometry of the metallic nanostructures [3]. On the other hand, the SPP waves propagate continuously on the interface between the metal and dielectric, and the ohmic loss of metals makes the SPPs attenuate continuously [4]. The metallic nanoparticles can form nanoclusters, which are also known as plasmonic molecules (PMs), since the coupling effect of the nanodisks in the PMs is similar to the bonds formed by atoms interacting with each other in the molecules [5]. In plasmonic clusters, the coupling between surface plasmons produces multiple novel optical properties, such as electromagnetic induced transparency (EIT) [6,7,8] and Fano resonance [9,10,11,12].
Fano resonance is caused by the destructive interference between a subradiant dark mode and a superradiant bright mode [11,12,13,14,15]. It effectively suppresses radiation attenuation, forms fine spectral lines, and enhances the near field [16]. Moreover, the sensing performance characterized by the biomass sensing factor can be significantly enhanced by utilizing Fano resonance effect [12]. Many metal-based nanostructures, such as metal strips [17,18,19], nanosphericals [2,20,21], nanorings [22,23], nanodisks [24,25], and nanospherical shells [16,21], have been designed to study the Fano effect. However, the plasmonic clusters consisting of noble metal materials show many shortcomings. First, due to the high ohmic loss of metals [26,27], the cluster suffers huge absorption loss [27]. Secondly, when the geometrical structure of clusters is determined, the frequency range of PMs is hard to adjust according to other conditions, which leads to the difficulty of further development of functional structures [26]. Fortunately, the graphene-guided SPPs wave shows lower ohmic loss and higher electromagnetic field confinement ability. Furthermore, the greatest advantage is the frequency tunability due to the modification of the chemical potential of the graphene [28]. Therefore, it is predicted that graphene-based PMs possess fantastic properties compared to their noble metal counterparts.
In this paper, a plasmonic heptamer based on graphene nanodisks is designed to study the effects of chemical potential and radius changes of nanodisks at different positions on the overall behaviors of the structure. At first, a graphene nanodisk with variable chemical potential is placed in the center of a hexamer to form a heptamer with a symmetry. In this process, surface plasmon of central nanodisk hybridizes with other six satellite nanodisks, which provides a basis for the formation of Fano resonance in the extinction spectrum. Furthermore, the quality of Fano resonance is effectively adjusted by the chemical potential of central nanodisk. After that, the significance of the radius and chemical potential of the ring nanodisks are discussed, respectively. At the same time, the influence of the number of nanodisks on Fano resonance is also discussed.
2. Simulated Methods and Models
As shown in Figure 1a, the oligomer consisting of seven graphene nanodisks is placed on a calcium fluoride () substrate with a refractive index of 1.4 and surrounded by air with a refractive index of 1. In the infrared spectral region, is transparent and this structure has no effects of substrate phonon [29]. Therefore, using as substrate can eliminate the coupling problem between the plasmon and phonon in the graphene plasmonic structure [30]. According to the requirements of the substrate, calcium fluoride also can be replaced by potassium bromide or other infrared transparent materials. In order to further understand the structural parameters, the projection of the oligomer on the XOY plane is given in Figure 1b. Six graphene nanodisks of the same size are evenly placed on a circle with a radius R = 160 nm and a nanodisk with a radius = 90 nm is in the center of this structure. The radius and chemical potential of the satellite nanodisks are 50 nm and 0.5 eV, respectively. The distance between center nanodisk and ring nanodisks d is kept at 10 nm. In this system, the power of incident light is set as W. In order to avoid the reflected light fields, the perfectly matched layer (PML) is set around the nanostructure. In addition, the thicknesses of seven graphene nanodisks are meshed by at least five layers and the maximum element size in the graphene layer is set as 2 nm to ensure the accuracy of simulation. Simultaneously, the mesh size increases gradually from graphene nanodisks to the PML.
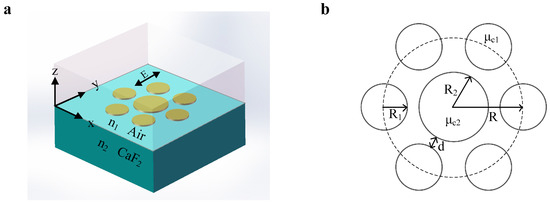
Figure 1.
(a) The incident light is polarized along the y axis. The graphene oligomer is surrounded by air with a refractive index = 1 and placed on calcium fluoride substrate with a refractive index = 1.4. (b) The top view of the schematic structure of the graphene oligomer.
In this study, the complex surface conductivity of graphene is written as , where and are intraband electron-photon scattering and interband electron-electron transition, respectively [31]. The intraband electron-photon scattering is described by
and the interband electron-electron transition is given by
where ħ is the reduced Planck constant, ω is the radian frequency, T is the absolute temperature, τ is the electro momentum relaxation time, and is the chemical potential. In this article, T and τ are set as 300 K and 0.5 ps, respectively.
The complex surface conductivity of graphene is related to the complex permittivity. The complex permittivity is written as [32]
where η0 = 377 Ω represents the impedance of the free space, and k0 stands for the wavenumber of the light in air. In our model, the thickness Δ of a single carbon atom is set as 0.334 nm and the incident light is polarized along the y axis, which is shown in Figure 1a.
In order to research the electromagnetic properties of the graphene heptamer, the extinction cross-section is calculated by the commercial finite element method (FEM) software COMSOL Multi-Physics, RF module. The extinction cross-section is given by
where is scattering cross-section,
and is the absorption cross-section
In Equations (5) and (6), the parameter indicates the incident intensity. is the normal vector that points outwards from the graphene plasmonic oligomer. stands for the scattered electromagnetic energy intensity. Q represents the power loss density in the nanocluster.
3. Simulation Results and Discussions
3.1. The Effect of the Chemical Potential of the Central Nanodisk on Fano Resonance
Usually, Fano resonance can be obtained by two approaches [26]. One approach is to destroy the symmetry of the structure [33,34]. Another approach is to introduce additional nanoparticles without changing the symmetry [35,36]. In order to study the formation of Fano resonance of graphene heptamers with symmetry, nanoclusters with/without the central nanodisk are calculated respectively. Figure 2a shows the structure of the hexamer without the center disk and the distribution of the chemical potential. Six nanodisks with same chemical potential setting at 0.5 eV are evenly placed on the satellite orbit. Strikingly, there is only a pronounced resonance peak in extinction spectrum when the wavelength ranges from 4.6 to 4.9 , as shown in Figure 2b. This peak is labeled as A and the corresponding electric field |E| distribution is presented in Figure 2c. For peak A, the hot spots distribute evenly on the edge of all nanodisks. Simultaneously, a single nanodisk was calculated to investigate the coupling strength between ring nanodisks, as shown in Figure 2d. A single nanodisk at different positions in the ring has the same distribution of electromagnetic field without coupling between nanodisks [12]. However, the PMs, consisting of these single nanodisks, show uneven electromagnetic field distribution because of the coupling effect of the electromagnetic field, which means that the contribution of some nanodisks to the collective behavior is different [16,35]. By comparing the amplitudes of a single nanodisk and hexamer, it is clearly seen that the coupling between nanodisks can greatly enhance the amplitude of the resonance peak. In the hexamer, the amplitude of the resonance peak is 1096.511 nm2 (see Figure 2b), while the counterpart of the single nanodisk is 7.792 nm2 (see Figure 2d). Therefore, the coupling of plasmons between the nanodisks can increase the strength by at least two orders of magnitude. Also, it makes the resonance peak red shift.
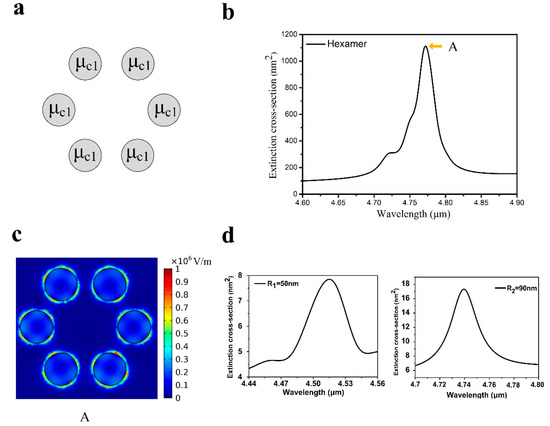
Figure 2.
(a) There are only six graphene nanodisks with same chemical potential () on satellite orbits. (b) A pronounced peak in the extinction spectrum of the graphene hexamer appears when the incident plane light wavelength ranges from 4.6 to 4.9 . (c) The electric field (|E|) distribution of A. (d) The calculated extinction spectrum of a single nanodisk in the ring (left panel). Simultaneously, the central nanodisk is also considered (right panel).
However, an intriguing phenomenon appears when a central graphene nanodisk is added into this structure. The surface plasmon mode of the central nanodisk couples with the satellite nanodisks through near-field interaction, which results in a new local plasmon hybridization mode. In order to exclude the effect of the distances between nanodisks on the collective behavior, is kept at 90 nm and d is kept at 10 nm. When the chemical potential of the central nanodisk is consistent with the satellite nanodisks, two plasmonic resonance peaks and a dip appear in the extinction spectrum, as represented in the top of Figure 3b. Two peaks from left to right in the extinction spectrum are marked as B and C, respectively. The electric-field intensity distribution of peak B is given in Figure 3c. In contrast to the peak A, this collective behavior of the hexamer and the heptamer demonstrates striking similarities. For convenience, this mode is referred to mode I. However, compared with peak B, peak C shows a different phenomenon, indicating that the satellite nanodisks couple strongly with the central nanodisk. Hot points at peak C are transferred to the gap between the central nanodisk and the satellite nanodisks, which show another mode relative to peak A and peak B. This mode is defined as mode II. In a previous study [9], the phenomenon of Fano resonance was verified by the theory that it can be divided into two independent subgroup modes. Therefore, the lineshape of the Fano resonance containing peak B and peak C can be explained by a mode wherein the central nanodisk does not influence the collective behavior, and another mode wherein the central nanodisk couples strongly with the satellite nanodisks. In order to observe the coupling between the central nanodisk and the ring nanodisks, the extinction spectrum of the central nanodisk is calculated, as shown in Figure 2d. The amplitude of the plasmonic resonance peak of the central nanodisk is smaller than that of the hexamer. However, when a central nanodisk is added into the hexamer, the coupling between the nanodisks can produce two peaks and a dip, as presented in Figure 3b. For the structure with central and ring nanodisks, the central nanodisk is the key to producing Fano resonance without changing the symmetry [12,36]. In this structure, the resonance of the nanodisks in the ring are in phase when the central nanodisk is not taken into account; the corresponding extinction spectrum is presented in Figure 2b. Therefore, six nanodisks with in-phase oscillation generate the superradiant bright mode. However, the subradiant dark mode is caused by the interference between the central nanodisk and the ring nanodisks when a central nanodisk is added into structure [26]. The Fano resonance occurs when two modes couple with each other.
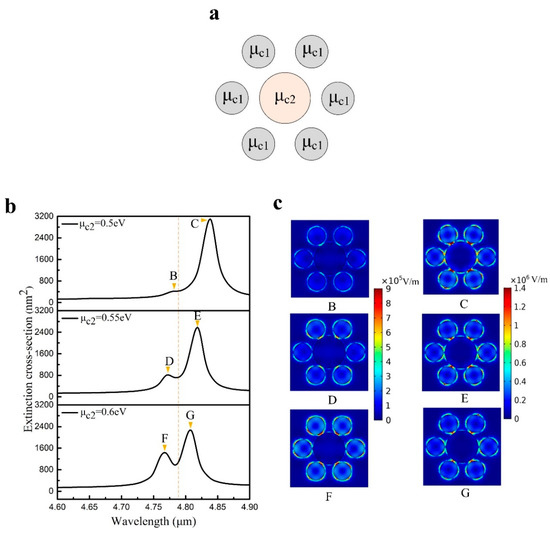
Figure 3.
(a) Distribution of different chemical potentials in graphene heptamers. (b) Extinction spectra with different chemical potentials of the central nanodisk. (c) The electric field (|E|) distribution of plasmonic resonance peaks B to G.
The plasmonic resonance peak B and the modulation depth of the Fano resonance are unclear when the chemical potential of the central nanodisk is 0.5 eV. In order to get a deeper modulation depth of the Fano resonance, we vary the chemical potential of the central nanodisk from 0.5 eV to 0.6 eV with steps of 0.05 eV. The distribution of the chemical potential in the graphene heptamer is presented in Figure 3a. The chemical potential of local graphene nanodisks can be turned by electrostatic and chemical doping in this process. For electrostatic doping, the local chemical potential can be manipulated via supplying the top gate voltage in an appropriation top gate configuration. For chemical doping, the required graphene nanodisks can be exposed to HNO3 vapor, while other nanodisks should avoid contact with HNO3 vapor. For variation of the chemical potential of the central nanodisk, the structure still has spatial symmetry along the y-axis, which does not destroy the symmetry of the heptamer structure. Figure 3b shows the extinction spectra of a series of graphene oligomers with different chemical potentials. As the chemical potential of the central nanodisk increases, the contrast between peak B and peak C is enhanced. According to the electric field (|E|) distribution from peak B to peak G (see Figure 3c), two subgroup modes remain unchanged. Nevertheless, the extinction spectra show blue shift and the modulation depth at Fano resonance is enhanced with the increase of the chemical potential. These phenomena are relative to the effective refractive index of graphene. The effective refractive index of graphene presents a tendency to decrease as the chemical potential increases [28]. Therefore, the ability of the central graphene nanodisk to confine the incident light is weakened. This results in a decrease of the interaction between surface plasmons on the central nanodisk and the satellite nanodisks, which explains the phenomenon of blue shift in the extinction spectra. The modulation depth of the Fano resonance becomes more pronounced because of the blue shift of the superradiant bright mode and the subradiant dark mode. Accordingly, if the chemical potential of the central nanodisk continues to increase in a certain range, the bright mode and dark mode overlap more closely, which makes the lineshape of the Fano resonance more symmetrical.
In order to analyze the electromagnetic behavior at Fano resonance, the near-field electric field distribution of the Fano resonance is calculated. The radius of the central nanodisk and the satellite nanodisks are 90 nm and 50 nm, respectively. The chemical potential of the central nanodisk is set as 0.6 eV, and that of the six satellite nanodisks are 0.5 eV. The extinction spectrum of this structure is depicted in the bottom of Figure 3b, whereas the near-field distribution at the Fano resonance frequency is presented in Figure 4. It is clear that the dipole resonances of the top two nanodisks and the bottom two nanodisks in this structure are in phase. However, compared with these four nanodisks, the dipole resonance of the central nanodisk is an out-of-phase oscillation. The Fano resonance of this heptamer becomes possible due to the opposite dipole resonances. Furthermore, not all nanodisks have an effect on this collective behavior. The dipole resonances produced by the leftmost and rightmost nanodisks are weaker than those of the other nanodisks. Therefore, when the structure of the leftmost and the rightmost nanodisks changes, the impacts on the collective behavior are negligible. Therefore, to dwell on the influence of ring nanodisks on this collective behavior, we modify the chemical potential and radius of the target nanodisk and calculate the extinction spectra.
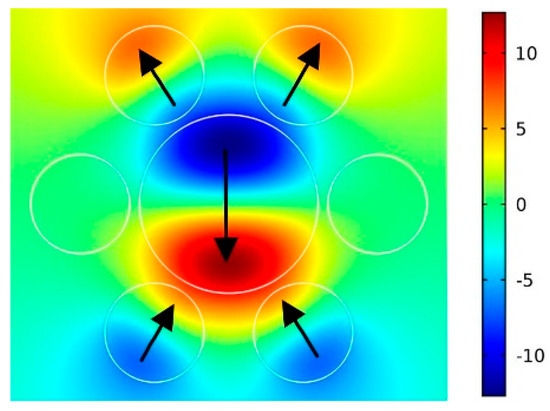
Figure 4.
The E distribution at Fano resonance when the chemical potential of central nanodisk is 0.6 eV.
3.2. The Effect of a Single Nanodisk in the Ring on Collective Behavior
In this section, we investigate the effect of a single nanodisk in the ring on the collective behavior of the heptamer. From Figure 4, it can be clearly seen that the contributions of the leftmost nanodisk and the rightmost nanodisk are negligible. Therefore, it is more meaningful to research the influence of the two top nanodisks and the two bottom nanodisks. Due to the symmetry of the heptamer and the polarization of the incident light, these four nanodisks have identical effects on the collective behavior. Therefore, the upper left nanodisk is selected as the focus in this study. The chemical potential of the upper left nanodisk is labeled as , as presented in Figure 5a. The other five nanodisks in the ring and the central nanodisk are set as 0.5 eV and 0.6 eV, respectively. was varied from 0.5 eV to 0.8 eV and the corresponding spectra are shown in Figure 5c. It is clear that a new plasmonic resonance peak, marked as H, appears in the spectrum when the chemical potential of the upper left nanodisk differs from the other ring nanodisks. This phenomenon arises from the destruction of the symmetry [16]. It is also remarkable that the Fano resonance disappears with the increase of . When increases, the effective refractive index of the upper left nanodisk decreases, which makes the interaction between surface plasmons weaker. Consequently, this leads to the net dipole moment in ring nanodisks no longer matching the dipole moment of the central nanodisk. Hence, the Fano dip disappears gradually in the extinction spectra. When is 0.8 eV, the Fano dip is barely observed in the spectrum. The radius distribution and the extinction spectra are shown in Figure 5b,d, respectively. The radius of the target nanodisk, labeled as , decreases gradually, while other nanodisks retain the original parameters. When is reduced to 48 nm, it can be found that the extinction spectrum has a larger blue shift, whereas when is reduced to 45 nm, the blue shift of the spectrum is smaller. When the radius of the upper left nanodisk decreases, the coupling of surface plasmons between the upper left nanodisk and the other three nanodisks gradually weakens, which explains the blue shift of the spectral position at Fano resonance. However, when the radius decreases slowly, the distance between the nanodisks becomes larger, which weakens the behavior of the upper left nanodisk participating in the whole process. Therefore, the blue shift of extinction spectrum decreases gradually with the radius decreasing. At the same time, the dipole moment of the upper left nanodisk decreases with the decreasing of the radius. This further enhances the mismatching between the net dipole moment of the ring and the center nanodisk. As a result, the modulation depth of the Fano resonance decreases.
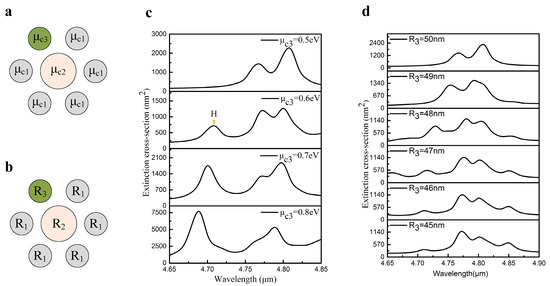
Figure 5.
(a) The chemical potential of the upper left nanodisk is labeled as . (b) The radius of the upper left nanodisk is marked as . (c) The Fano dip disappears gradually when is varied from 0.5 eV to 0.8 eV. (d) The extinction spectra with the change of radius.
3.3. The Effect of the Top and Bottom Nanodisks in the Ring on Collective Behaviors
In order to further research the influence of the changes of the nanodisk on collective behavior, we vary the upper left nanodisk and the lower left nanodisk. The distributions of chemical potential and radius are depicted in Figure 6a,b, respectively. When the chemical potential labeled as gradually increases, the Fano resonance phenomenon is weakened and gradually disappears, which is shown in Figure 6c. Compared with Figure 5c, it can be seen that the Fano resonance disappears much faster than the change of the chemical potential in the upper left nanodisk. In Figure 5c, the Fano resonance disappears when the chemical potential changes to 0.8 eV. However, in Figure 6c, the Fano resonance disappears when the chemical potential changes to 0.7 eV. The change of this situation is caused by the drastic variation of the dipole moment. For the change of radius, a series of extinction spectra with different radii are obtained by varying the radius of the upper left nanodisk and the lower left nanodisk, as presented in Figure 6d. It can be seen that the decrease of the radius makes the Fano resonance gradually disappear. When the radius is reduced to 10 nm, the Fano resonance disappears completely. However, when the nanodisks are completely absent, the extinction spectrum is almost the same as when the radius is 10 nm. This highlights that when the nanodisk is small enough, the nanodisk becomes an isolated particle, and its effect on the collective behavior is negligible. Moreover, the variation of chemical potential and radius does not lead to the change of mode I and mode II. The electric field distributions of the two modes are depicted in Figure 6e. The electric distribution of the plasmonic resonance peak of mode I shows that the chemical potentials of the upper left nanodisk and the lower left nanodisk not only affect themselves, but also have a great influence on the leftmost nanodisk. When the chemical potentials of the upper left nanodisk and the lower left nanodisk are greater than other nanodisks, the near-field distributions of nanodisks next to them are enhanced [27]. Moreover, the leftmost nanodisk is right in the middle of these two nanodisks, the near-field distribution of the leftmost nanodisk is enhanced. Because the plasmonic peak belongs to mode I, the enhanced hot spots are evenly distributed around the nanodisk. However, it is observable from the near-field distribution of the plasmonic peak belonging to mode II that the hot spots on the leftmost nanodisk are mainly distributed between the central nanodisk and the leftmost nanodisk.
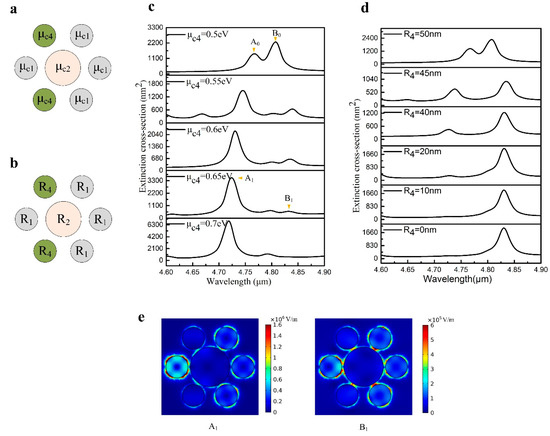
Figure 6.
(a) The distribution of chemical potential in the heptamer. (b) Variation of the radius of the upper left nanodisk and the lower left nanodisk. (c) With the change of chemical potential, the Fano resonance gradually disappears. (d) The extinction spectra with the change of radius. (e) The norm electric field distributions (|E|) of mode I and mode II under chemical potential changes.
In order to more comprehensively study the influence of the nanodisks at different positions on the collective behavior, we also modified the parameters of the upper left nanodisk and the lower right nanodisk. The distributions of chemical potential and radius are shown in Figure 7a and Figure 7b, respectively. For the change of chemical potential, it is seen that when the chemical potential is 0.7 eV, the Fano resonance disappears, which is depicted in Figure 7c. Compared with the variation of the upper left nanodisk, the change of Fano resonance in the extinction spectra is similar, except that the Fano resonance disappears faster when the two nanodisks are modified. When increases, the dipole moments of two nanodisks decrease, which causes the net dipole moment of the ring to decrease rapidly. Therefore, it can be seen that the influence of the number of nanodisks on the Fano resonance is different. Fast modulation of Fano resonance is achievable by changing the number of nanodisks in the ring. With the change of radius, we can see that the peak values of mode I and mode II decrease with the decrease of radius. This is because both the nanodisks contribute to both modes. When the radius become smaller, the coupling between the nanodisks becomes weaker and the peak value becomes smaller. At the same time, it can be clearly seen from Figure 7d that the spectrum demonstrates a strong blue shift. When the radius of the two nanodisks decrease, the coupling of surface plasmons between the adjacent nanodisks gradually weakens. Therefore, the extinction spectrum has a blue shift within the radius variation range. Compared with the change of the radius of the upper left nanodisk, the blue shift of the extinction spectrum is faster in the same range of radius change. Therefore, changing the radius of multiple nanodisks on the ring makes the collective behavior change rapidly by variation of the dipole moment.
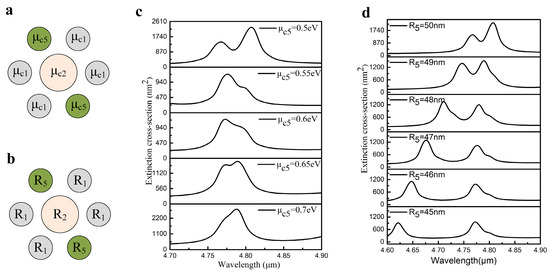
Figure 7.
(a) The chemical potentials of the upper left nanodisk and the lower right nanodisk are labeled as . (b) The distribution of different radii in heptamer radius. (c) The extinction spectra with the change of chemical potential. (d) With the decrease of radius, the values of the two plasmonic resonance peaks gradually decrease.
4. Conclusions
In conclusion, we have investigated the influence of nanodisks at different positions on the collective behavior of a graphene heptamer. First, by adding a central nanodisk into the hexamer formed by homogeneous placement of six nanodisks in a ring, two plasmonic resonance peaks and a dip appear in the extinction spectrum. Compared with the near-field distribution of the hexamer, the lineshape of the Fano resonance can be explained by two independent subgroup modes. Furthermore, by adjusting the chemical potential of the central nanodisk, a higher quality lineshape of Fano resonance is obtained. Also, the effect of the nanodisks at different positions in the ring on the properties of the Fano resonance was studied. The mechanism of the Fano resonance was investigated in terms of the electric field distribution of the plasmonic oligomer. The proposed nanostructures may find broad applications in the fields of chemical and biochemical sensing, and pave the way for the study of more complex graphene polymers.
Author Contributions
W.Q. supervised this project; H.Z. and W.Q. provided the original idea; H.Z., G.P., G.W., and J.R. created the models and did the simulations; H.Z., W.Q., Z.W., Z.Z., Z.L., P.Q., and Q.K. analyzed the data and discussed the results, H.Z. and W.Q. wrote the paper. All authors read and approved the final manuscript.
Funding
This research was supported by the Natural Science Fund of China under grant No. 11774103, Quanzhou City Science & Technology Program under grand No. 2018C003, The open project of Fujian Key Laboratory of Semiconductor Materials and Applications under No. 2019001, and Project for Cultivating Postgraduates’ Innovative Ability in Scientific Research of Huaqiao University (18013082026, 18014082040, 17013082023).
Conflicts of Interest
The authors claim no conflicts of interest regarding this work.
References
- Barnes, W.L.; Dereux, A.; Ebbesen, T.W. Surface plasmon subwavelength optics. Nature 2003, 424, 824. [Google Scholar] [CrossRef] [PubMed]
- Kelly, K.L.; Coronado, E.; Zhao, L.L.; Schatz, G.C. The optical properties of metal nanoparticles: The influence of size, shape, and dielectric environment. ACS Publ. 2003, 34, 668–677. [Google Scholar]
- Low, T.; Avouris, P. Graphene plasmonics for terahertz to mid-infrared applications. ACS Nano 2014, 8, 1086–1101. [Google Scholar] [CrossRef] [PubMed]
- Pitarke, J.; Silkin, V.; Chulkov, E.; Echenique, P. Theory of surface plasmons and surface-plasmon polaritons. Rep. Prog. Phys. 2006, 70, 1. [Google Scholar] [CrossRef]
- Zohar, N.; Chuntonov, L.; Haran, G. The simplest plasmonic molecules: Metal nanoparticle dimers and trimers. J. Photochem. Photobiol. C Photochem. Rev. 2014, 21, 26–39. [Google Scholar] [CrossRef]
- Liu, N.; Langguth, L.; Weiss, T.; Kästel, J.; Fleischhauer, M.; Pfau, T.; Giessen, H. Plasmonic analogue of electromagnetically induced transparency at the drude damping limit. Nat. Mater. 2009, 8, 758. [Google Scholar] [CrossRef]
- Fleischhauer, M.; Imamoglu, A.; Marangos, J.P. Electromagnetically induced transparency: Optics in coherent media. Rev. Mod. Phys. 2005, 77, 633. [Google Scholar] [CrossRef]
- Pitchappa, P.; Manjappa, M.; Ho, C.P.; Singh, R.; Singh, N.; Lee, C. Active control of electromagnetically induced transparency analog in terahertz mems metamaterial. Adv. Opt. Mater. 2016, 4, 541–547. [Google Scholar] [CrossRef]
- Rahmani, M.; Lei, D.Y.; Giannini, V.; Lukiyanchuk, B.; Ranjbar, M.; Liew, T.Y.F.; Hong, M.; Maier, S.A. Subgroup decomposition of plasmonic resonances in hybrid oligomers: Modeling the resonance lineshape. Nano Lett. 2012, 12, 2101–2106. [Google Scholar] [CrossRef]
- Fedotov, V.; Papasimakis, N.; Plum, E.; Bitzer, A.; Walther, M.; Kuo, P.; Tsai, D.; Zheludev, N. Spectral collapse in ensembles of metamolecules. Phys. Rev. Lett. 2010, 104, 223901. [Google Scholar] [CrossRef]
- Luk’yanchuk, B.; Zheludev, N.I.; Maier, S.A.; Halas, N.J.; Nordlander, P.; Giessen, H.; Chong, C.T. The fano resonance in plasmonic nanostructures and metamaterials. Nat. Mater. 2010, 9, 707. [Google Scholar] [CrossRef] [PubMed]
- Hentschel, M.; Saliba, M.; Vogelgesang, R.; Giessen, H.; Alivisatos, A.P.; Liu, N. Transition from isolated to collective modes in plasmonic oligomers. Nano Lett. 2010, 10, 2721–2726. [Google Scholar] [CrossRef] [PubMed]
- Meng-Jun, L.; Hui, F.; Xiao-Ming, L.; Xiao-Cong, Y. Subgroup decomposition analyses of d-3h and d-4h plasmonic metamolecule fano resonance spectrum. Acta Phys. Sin. 2016, 65, 057302. [Google Scholar]
- Dayal, G.; Chin, X.Y.; Soci, C.; Singh, R. High-q whispering-gallery-mode-based plasmonic fano resonances in coupled metallic metasurfaces at near infrared frequencies. Adv. Opt. Mater. 2016, 4, 1295–1301. [Google Scholar] [CrossRef]
- Giannini, V.; Francescato, Y.; Amrania, H.; Phillips, C.C.; Maier, S.A. Fano resonances in nanoscale plasmonic systems: A parameter-free modeling approach. Nano Lett. 2011, 11, 2835–2840. [Google Scholar] [CrossRef] [PubMed]
- Fan, J.A.; Bao, K.; Wu, C.; Bao, J.; Bardhan, R.; Halas, N.J.; Manoharan, V.N.; Shvets, G.; Nordlander, P.; Capasso, F. Fano-like interference in self-assembled plasmonic quadrumer clusters. Nano Lett. 2010, 10, 4680–4685. [Google Scholar] [CrossRef] [PubMed]
- Le Perchec, J.; Desieres, Y.; Espiau de Lamaestre, R. Plasmon-based photosensors comprising a very thin semiconducting region. Appl. Phys. Lett. 2009, 94, 181104. [Google Scholar] [CrossRef]
- Song, S.; Chen, Q.; Jin, L.; Sun, F. Great light absorption enhancement in a graphene photodetector integrated with a metamaterial perfect absorber. Nanoscale 2013, 5, 9615–9619. [Google Scholar] [CrossRef]
- Cai, Y.; Zhu, J.; Liu, Q.H. Tunable enhanced optical absorption of graphene using plasmonic perfect absorbers. Appl. Phys. Lett. 2015, 106, 043105. [Google Scholar] [CrossRef]
- Mirin, N.A.; Bao, K.; Nordlander, P. Fano resonances in plasmonic nanoparticle aggregates. J. Phys. Chem. A 2009, 113, 4028–4034. [Google Scholar] [CrossRef]
- Brown, L.V.; Sobhani, H.; Lassiter, J.B.; Nordlander, P.; Halas, N.J. Heterodimers: Plasmonic properties of mismatched nanoparticle pairs. ACS Nano 2010, 4, 819–832. [Google Scholar] [CrossRef] [PubMed]
- Qiu, R.; Lin, H.; Huang, J.; Liang, C.; Yi, Z. Tunable multipolar fano resonances and electric field enhancements in au ring-disk plasmonic nanostructures. Materials 2018, 11, 1576. [Google Scholar] [CrossRef] [PubMed]
- Khardikov, V.V.; Iarko, E.O.; Prosvirnin, S.L. Trapping of light by metal arrays. J. Opt. 2010, 12, 045102. [Google Scholar] [CrossRef]
- Yi, Z.; Niu, G.; Ye, X.; Luo, J.; Li, X.; Jiang, X.; Huang, J.; Yi, Y.; Duan, T.; Zhang, J. Nanodisk-induced modification of plasmon coupling and appearance of fano resonance without symmetry breaking in concentric ag nanoring-nanodisk. Plasmonics 2017, 12, 889–898. [Google Scholar] [CrossRef]
- Heeg, S.; Fernandez-Garcia, R.; Oikonomou, A.; Schedin, F.; Narula, R.; Maier, S.A.; Vijayaraghavan, A.; Reich, S. Polarized plasmonic enhancement by au nanostructures probed through raman scattering of suspended graphene. Nano Lett. 2012, 13, 301–308. [Google Scholar] [CrossRef]
- Ren, J.; Qiu, W.; Chen, H.; Qiu, P.; Lin, Z.; Wang, J.-X.; Kan, Q.; Pan, J.-Q. Electromagnetic field coupling characteristics in graphene plasmonic oligomers: From isolated to collective modes. Phys. Chem. Chem. Phys. 2017, 19, 14671–14679. [Google Scholar] [CrossRef]
- Ren, J.; Wang, W.; Qiu, W.; Qiu, P.; Wang, Z.; Lin, Z.; Wang, J.-X.; Kan, Q.; Pan, J.-Q. Dynamic tailoring of electromagnetic behaviors of graphene plasmonic oligomers by local chemical potential. Phys. Chem. Chem. Phys. 2018, 20, 16695–16703. [Google Scholar] [CrossRef]
- Ren, J.; Wang, G.; Qiu, W.; Chen, H.; Qiu, P.; Kan, Q.; Pan, J.-Q. A flexible control on electromagnetic behaviors of graphene oligomer by tuning chemical potential. Nanoscale Res. Lett. 2018, 13, 349. [Google Scholar] [CrossRef]
- Guo, X.; Hu, H.; Zhu, X.; Yang, X.; Dai, Q. Higher order fano graphene metamaterials for nanoscale optical sensing. Nanoscale 2017, 9, 14998–15004. [Google Scholar] [CrossRef]
- Hu, H.; Yang, X.; Zhai, F.; Hu, D.; Liu, R.; Liu, K.; Sun, Z.; Dai, Q. Far-field nanoscale infrared spectroscopy of vibrational fingerprints of molecules with graphene plasmons. Nat. Commun. 2016, 7, 12334. [Google Scholar] [CrossRef]
- Shi, B.; Cai, W.; Zhang, X.; Xiang, Y.; Zhan, Y.; Geng, J.; Ren, M.; Xu, J. Tunable band-stop filters for graphene plasmons based on periodically modulated graphene. Sci. Rep. 2016, 6, 26796. [Google Scholar] [CrossRef] [PubMed]
- Han, X.; Wang, T.; Li, X.; Xiao, S.; Zhu, Y. Dynamically tunable plasmon induced transparency in a graphene-based nanoribbon waveguide coupled with graphene rectangular resonators structure on sapphire substrate. Opt. Express 2015, 23, 31945–31955. [Google Scholar] [CrossRef] [PubMed]
- Fu, Y.H.; Zhang, J.B.; Yu, Y.F.; Luk’Yanchuk, B. Generating and manipulating higher order fano resonances in dual-disk ring plasmonic nanostructures. ACS Nano 2012, 6, 5130. [Google Scholar] [CrossRef]
- Fang, Z.; Cai, J.; Yan, Z.; Nordlander, P.; Halas, N.J.; Zhu, X. Removing a wedge from a metallic nanodisk reveals a fano resonance. Nano Lett. 2011, 11, 4475–4479. [Google Scholar] [CrossRef]
- Mario, H.; Daniel, D.; Ralf, V.; Harald, G.; Na, L. Plasmonic oligomers: The role of individual particles in collective behavior. ACS Nano 2011, 5, 2042. [Google Scholar]
- Zhang, W.; Gallinet, B.; Martin, O.J.F. Symmetry and selection rules for localized surface plasmon resonances in nanostructures. Phys. Rev. B Condens. Matter 2010, 81, 5032. [Google Scholar] [CrossRef]


© 2019 by the authors. Licensee MDPI, Basel, Switzerland. This article is an open access article distributed under the terms and conditions of the Creative Commons Attribution (CC BY) license (http://creativecommons.org/licenses/by/4.0/).