Ultrasonic Transducer Array Performance for Improved Cleaning of Pipelines in Marine and Freshwater Applications


Abstract
:Featured Application
Abstract
1. Introduction
1.1. Underwater Pipelines
1.2. Fouling Mitigation
1.3. Fouling Detection
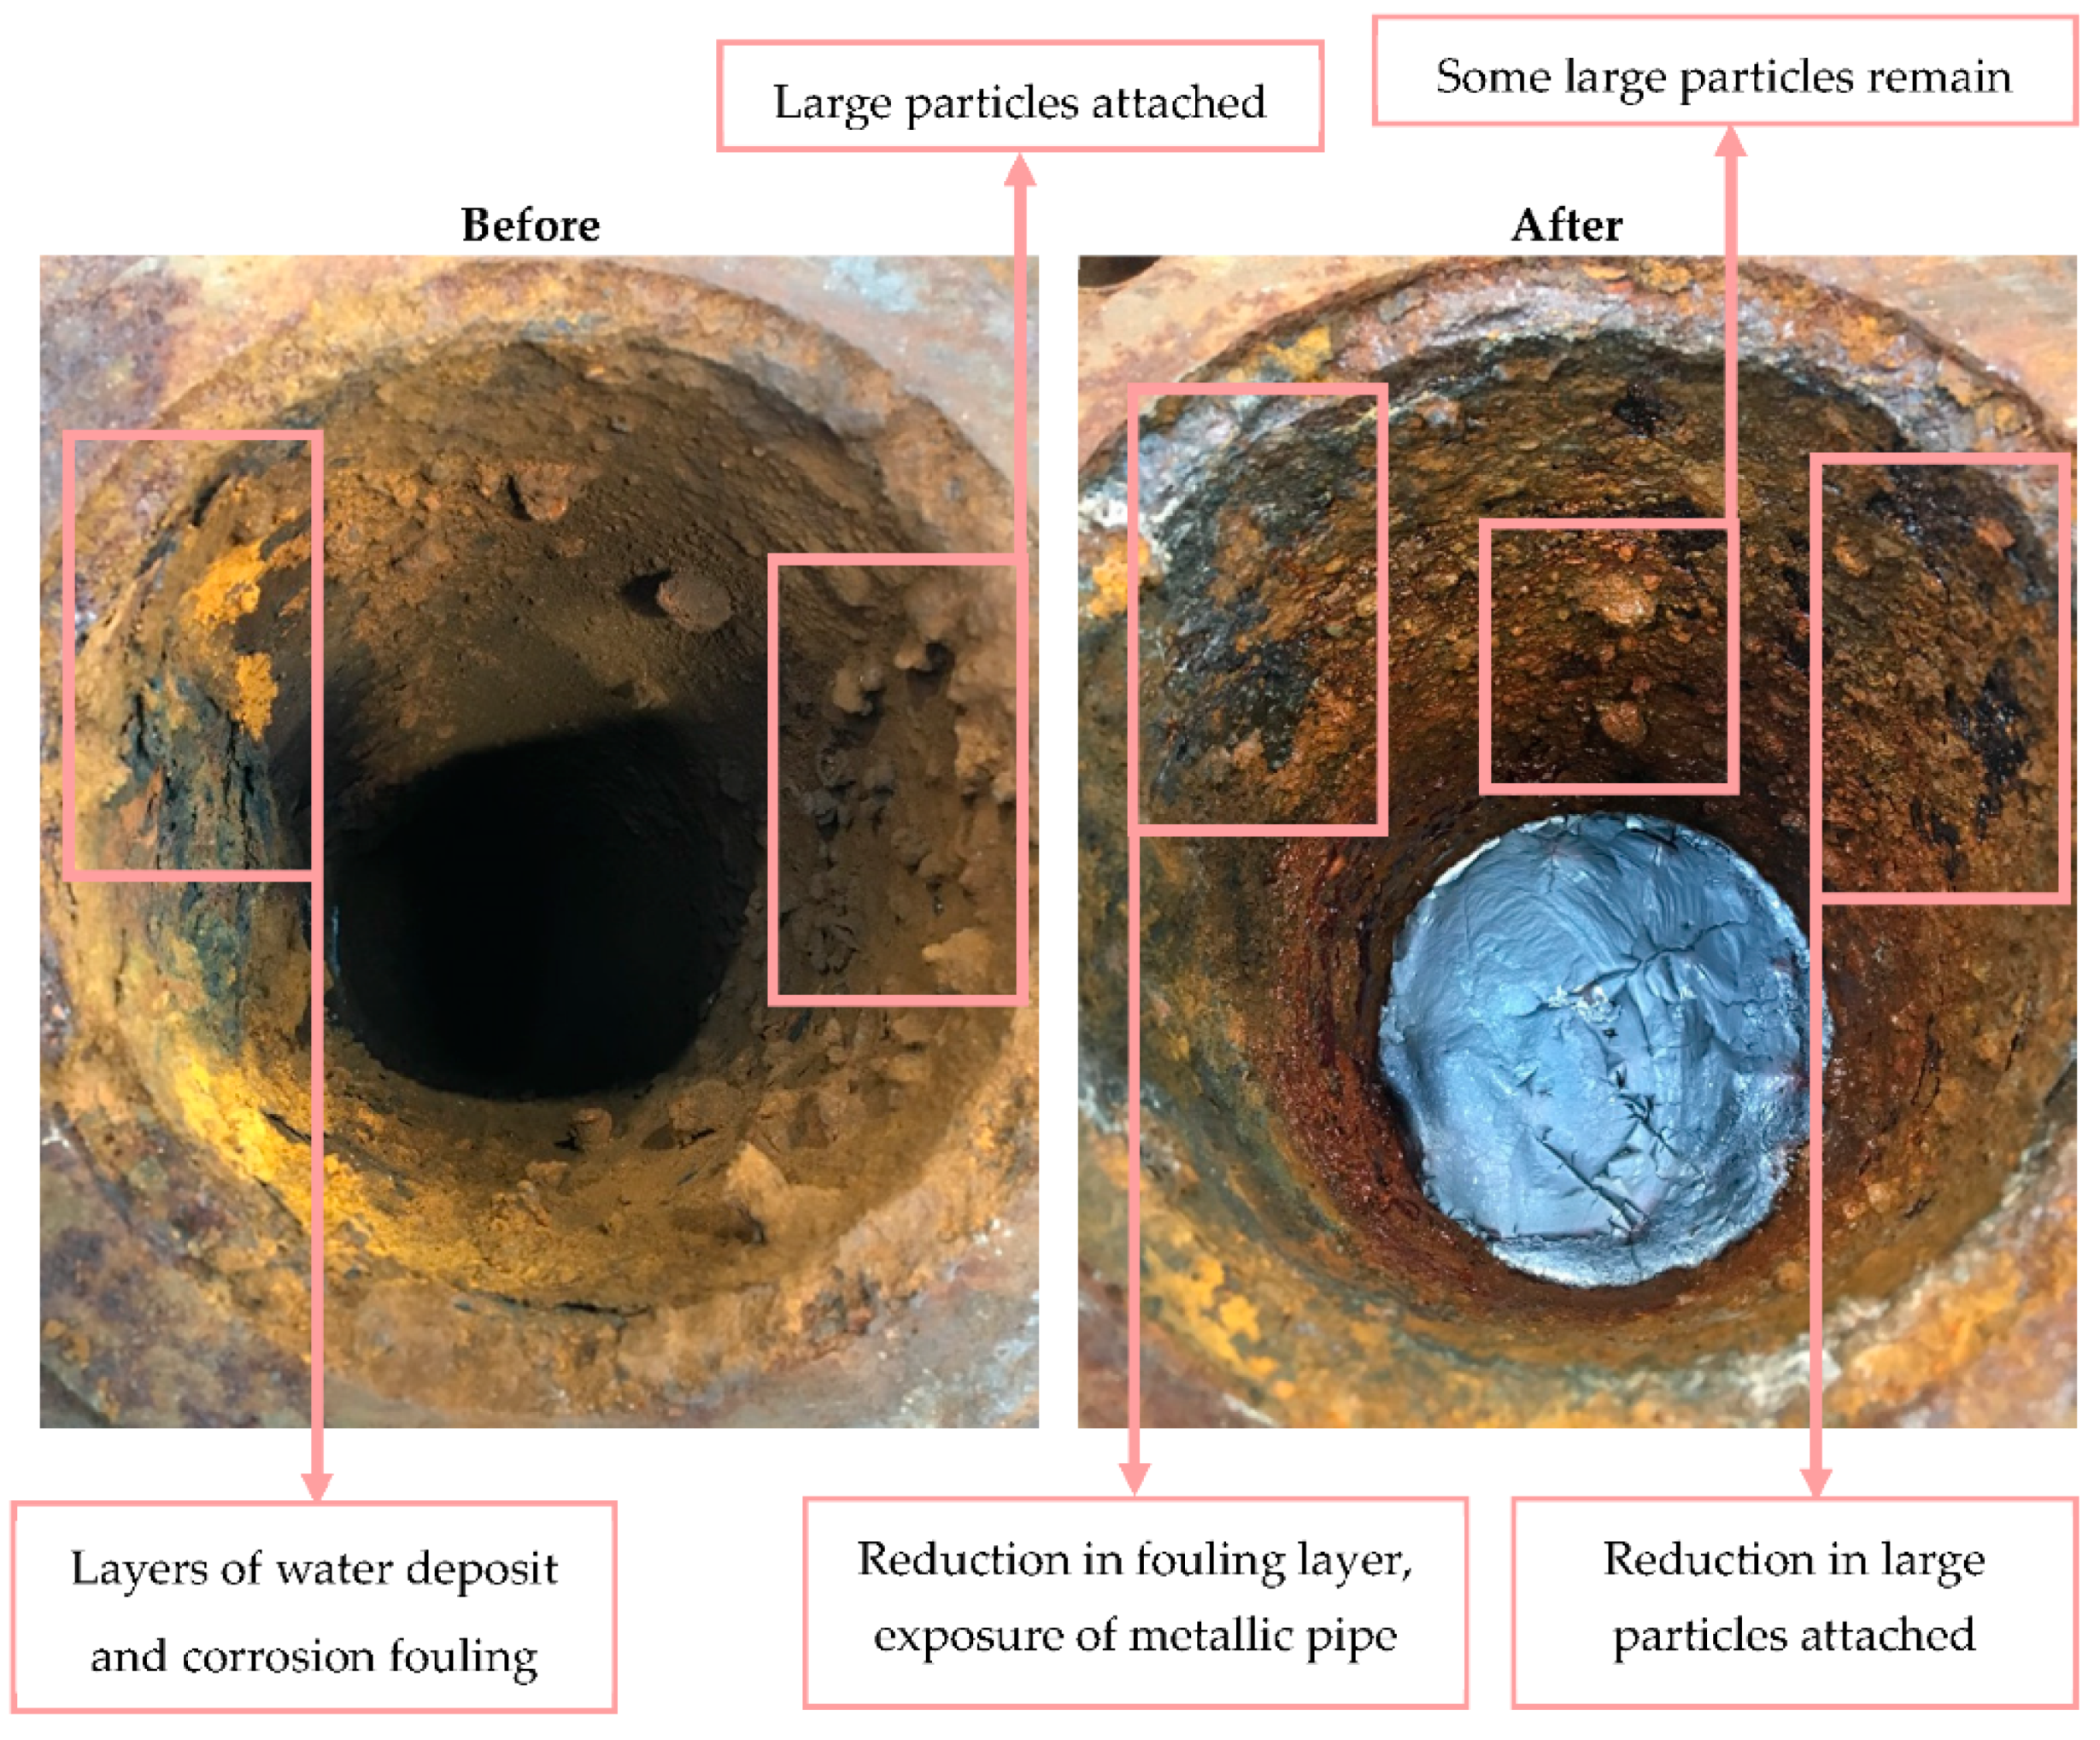
1.4. Fouling Removal
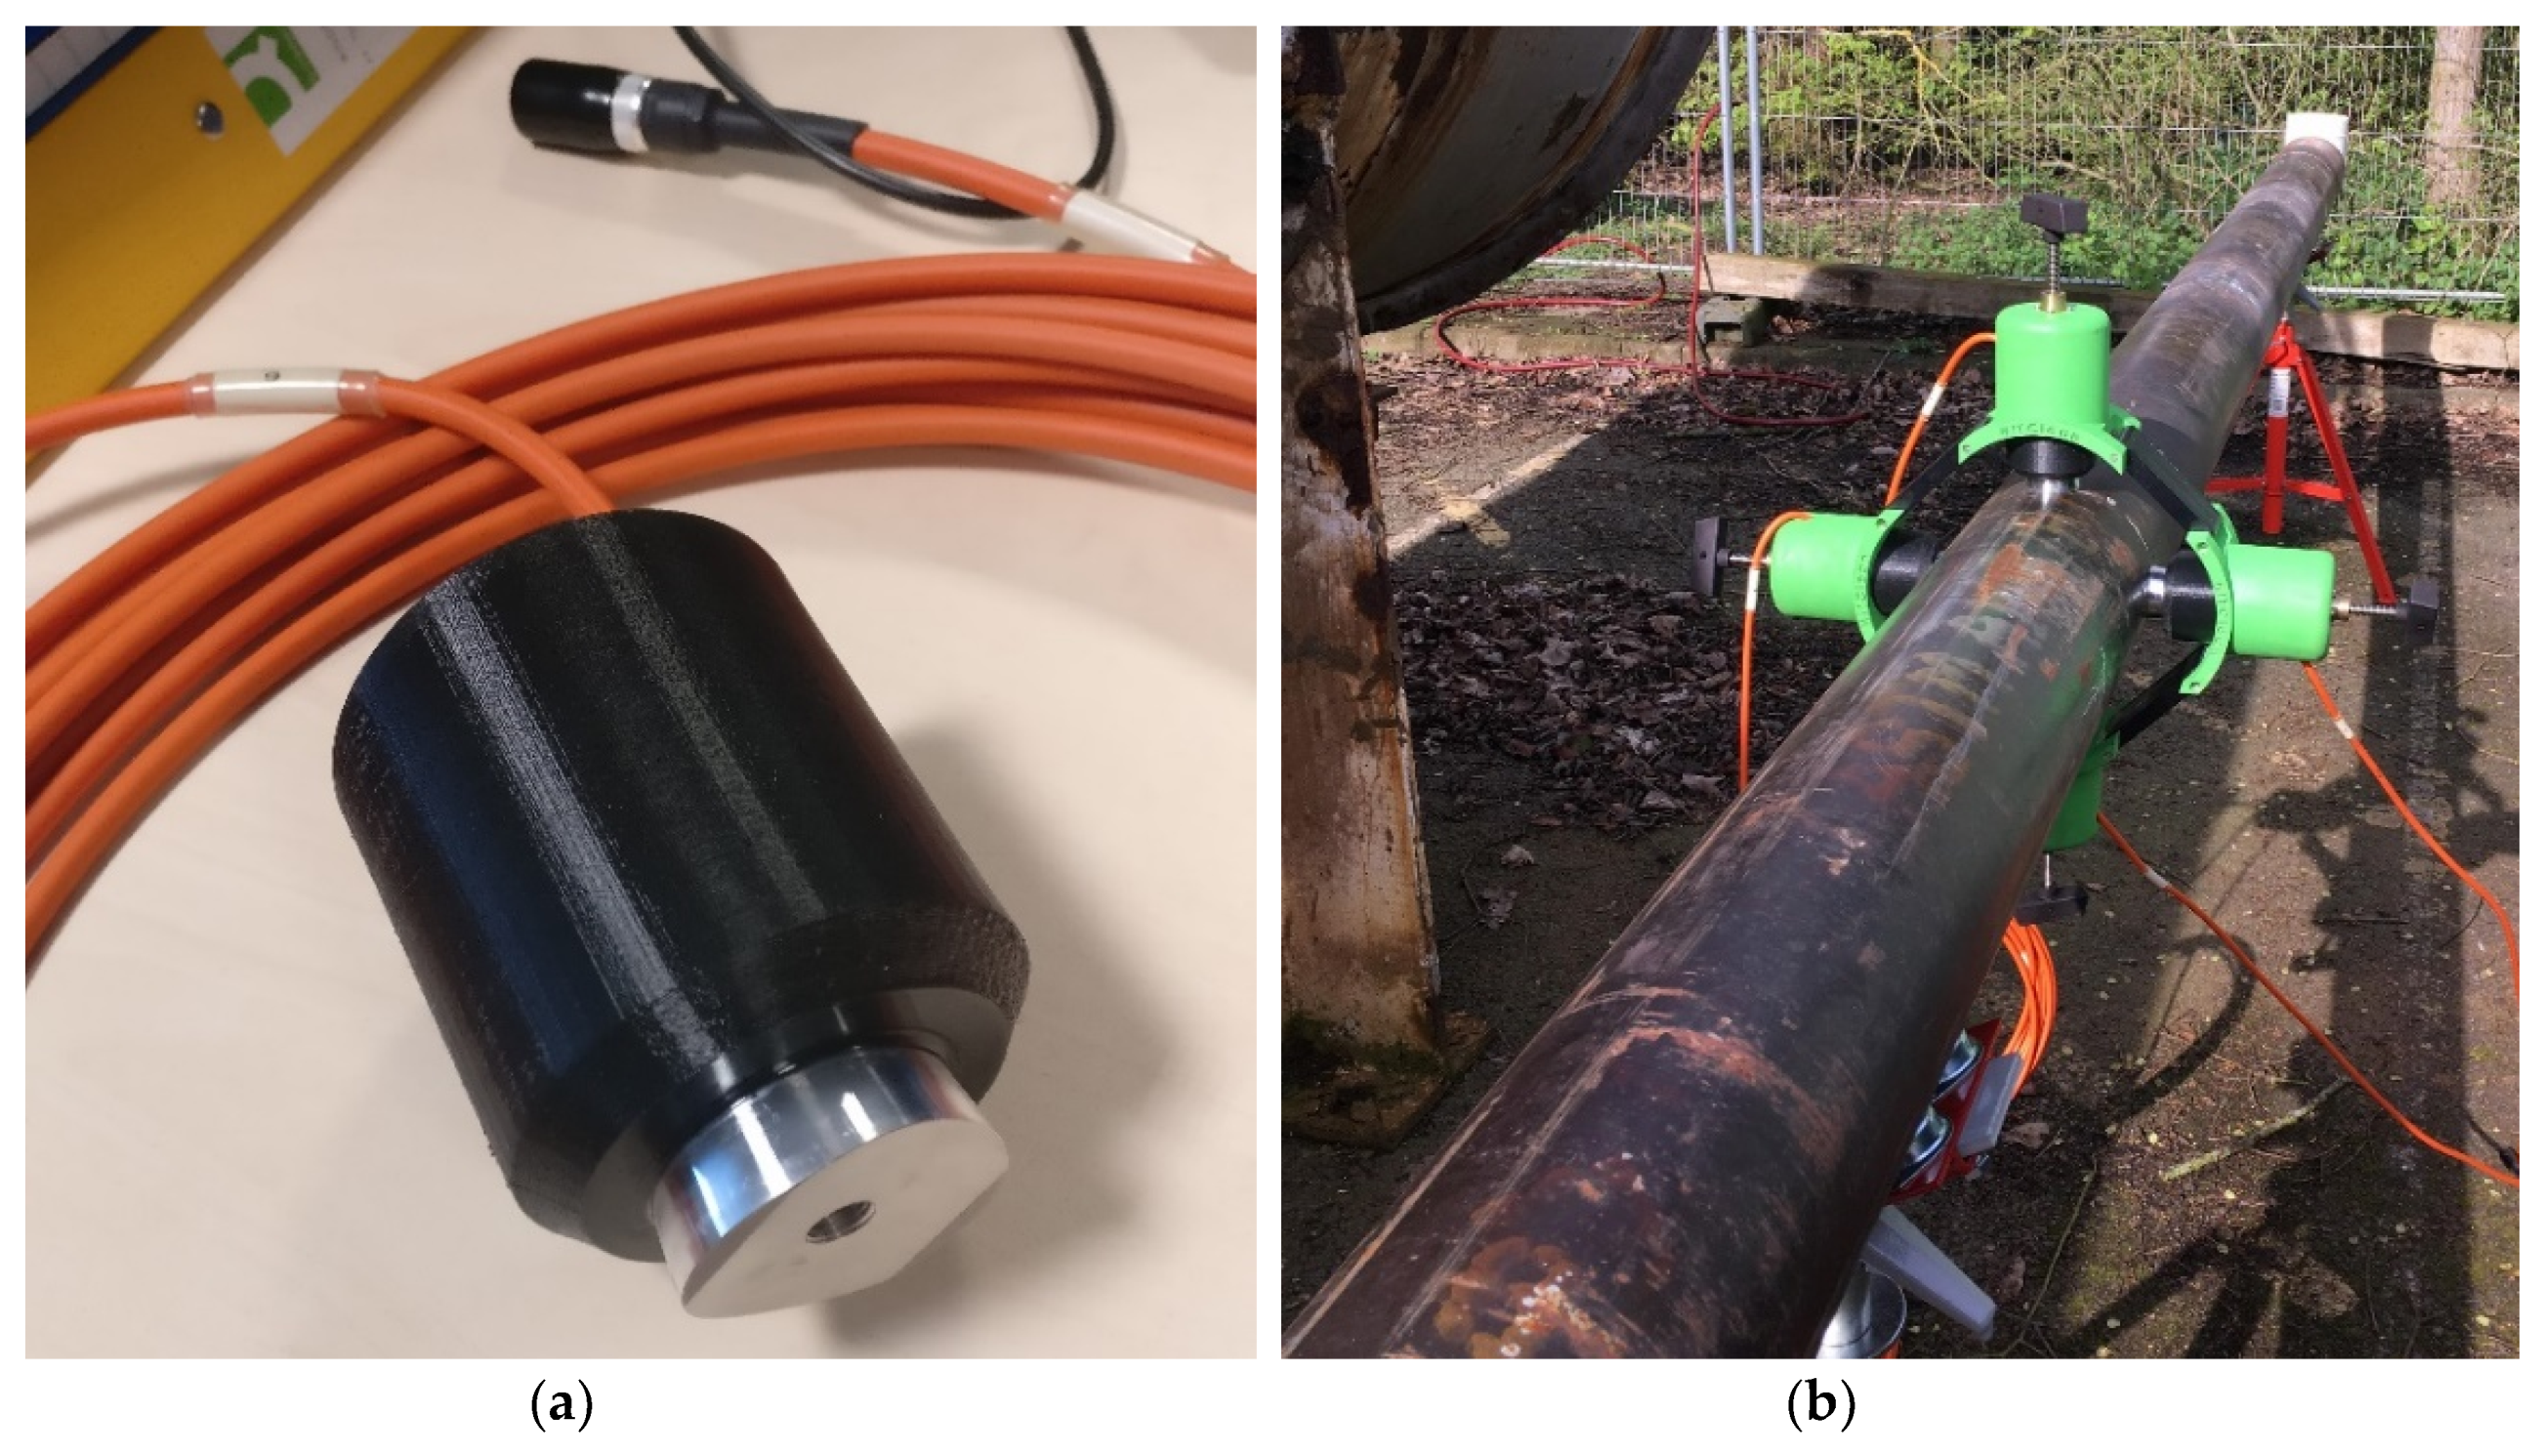
2. Marinization Methodology
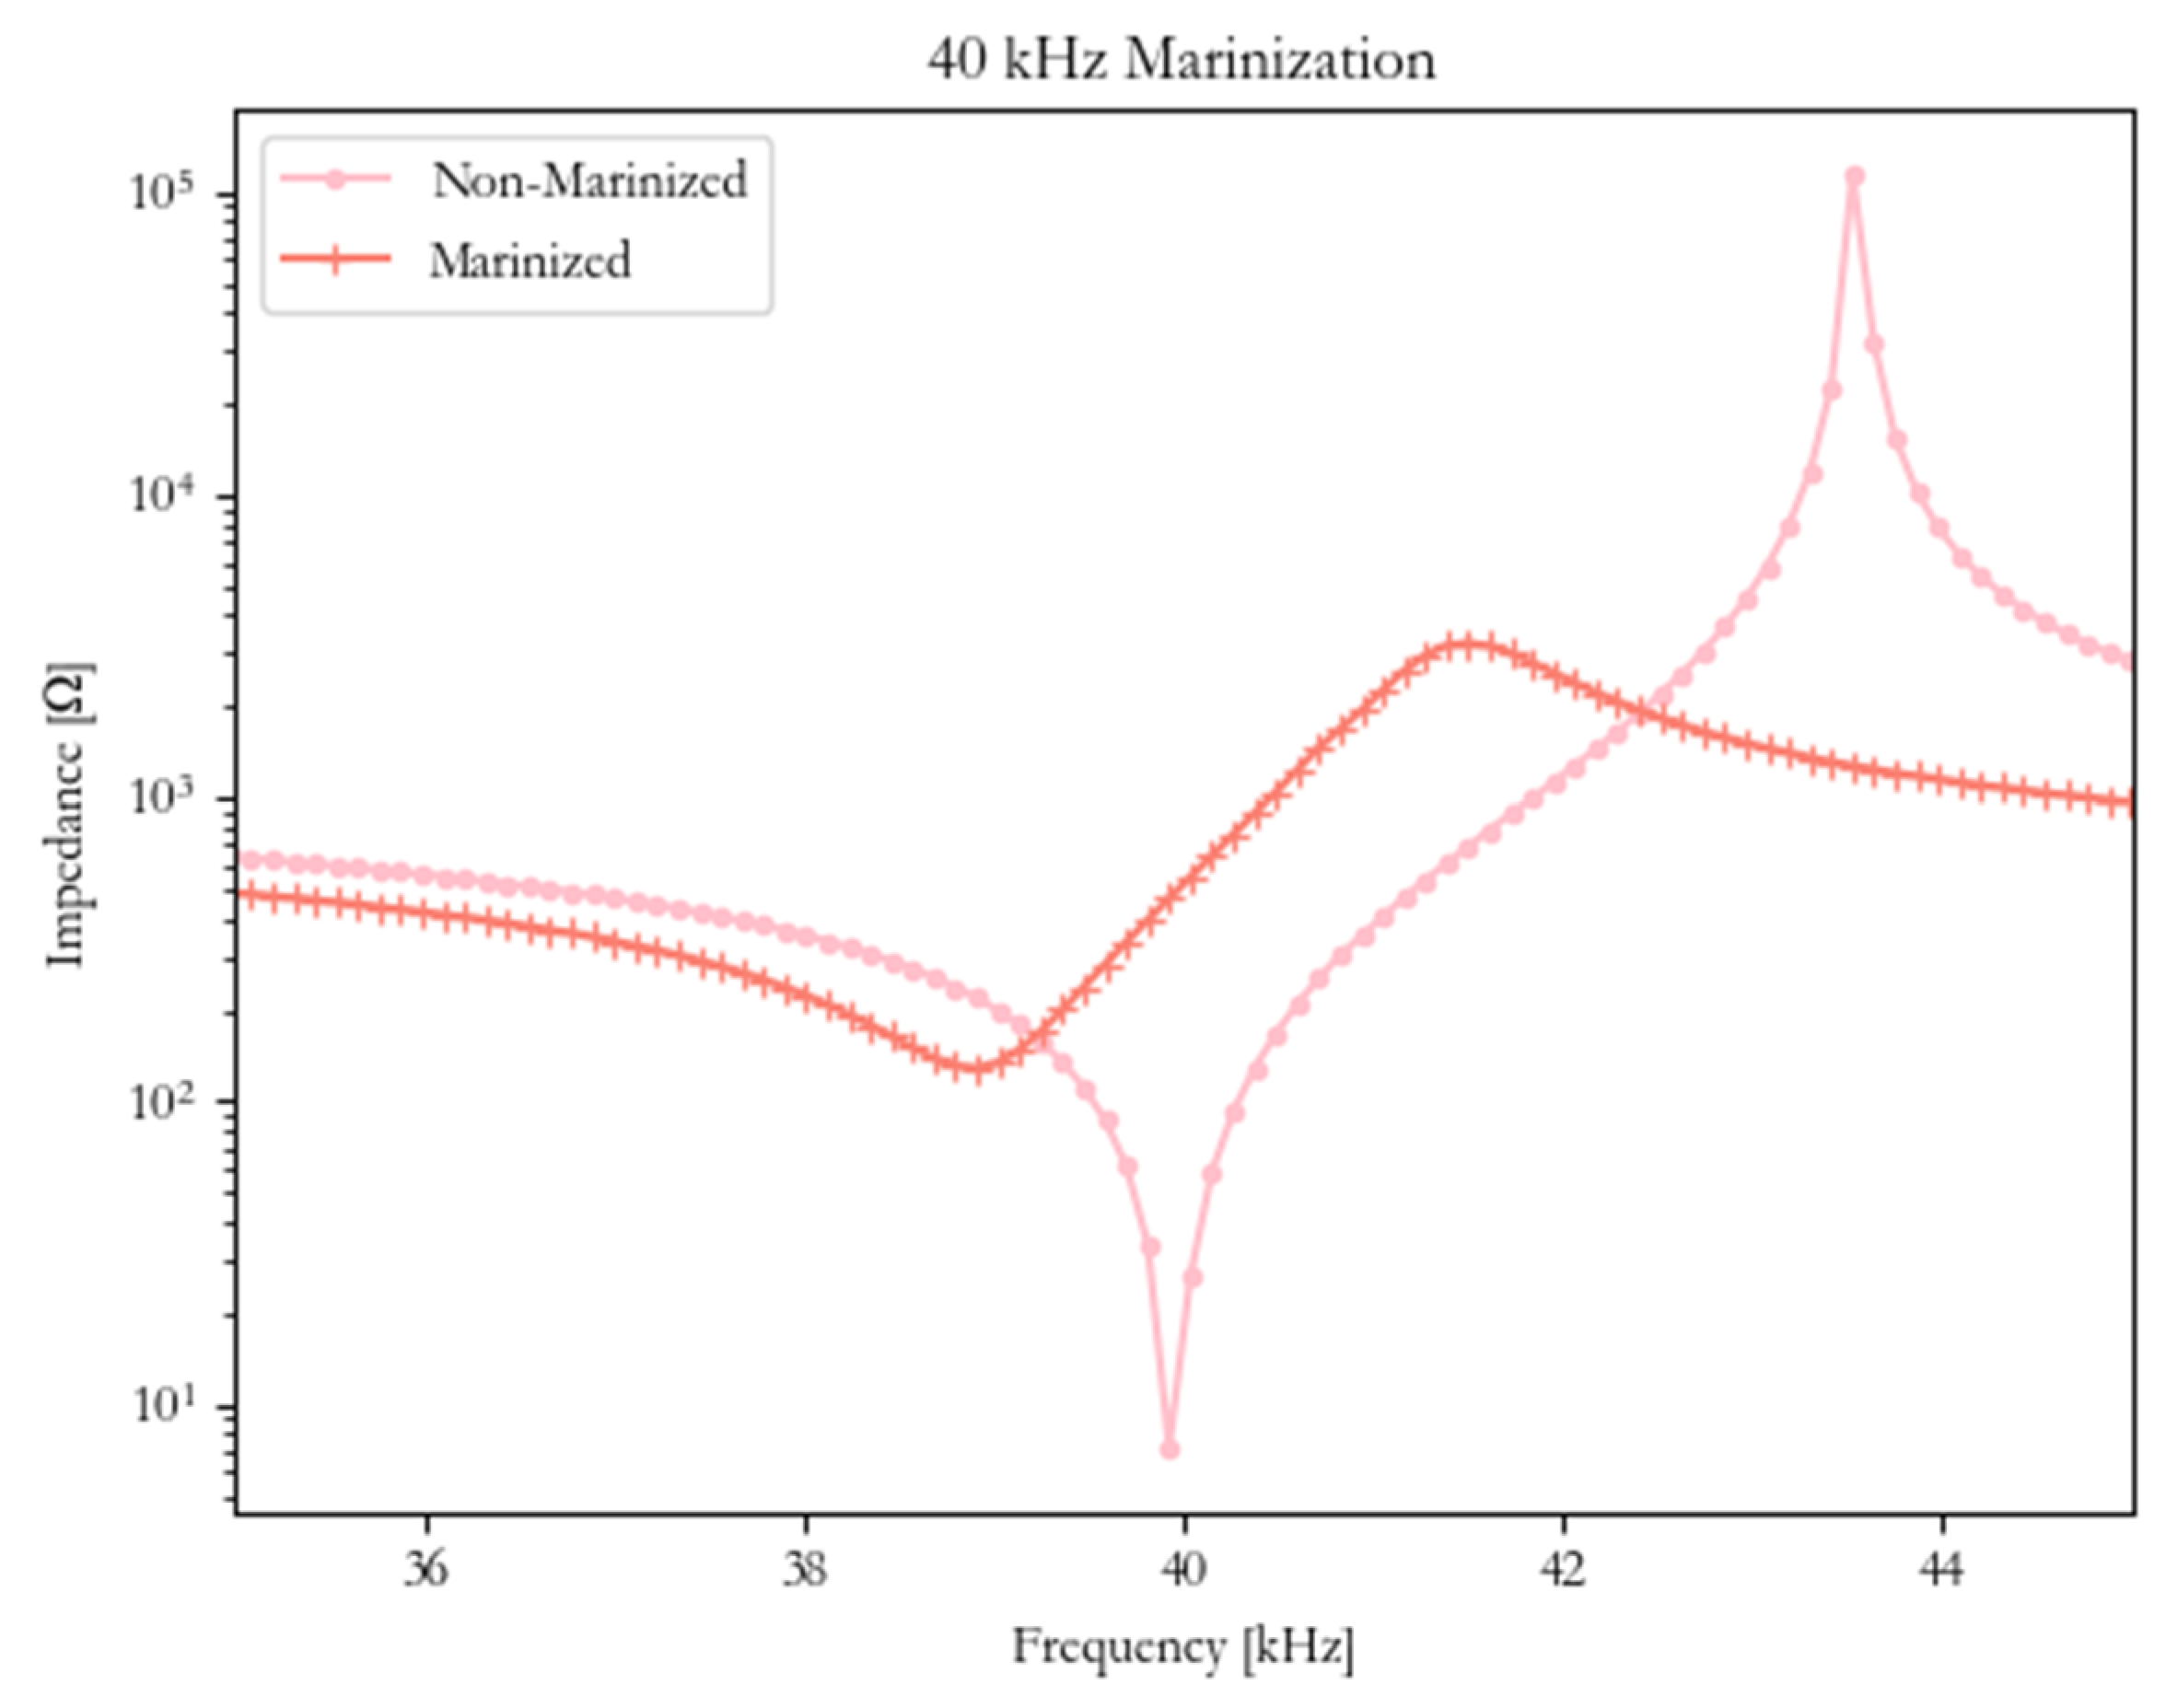
HPUT Marinization Characterization
3. Laboratory Methodology
3.1. Power Electronics
- Power 4 × 100 W Root Mean Square (RMS), High Voltage Amplifier
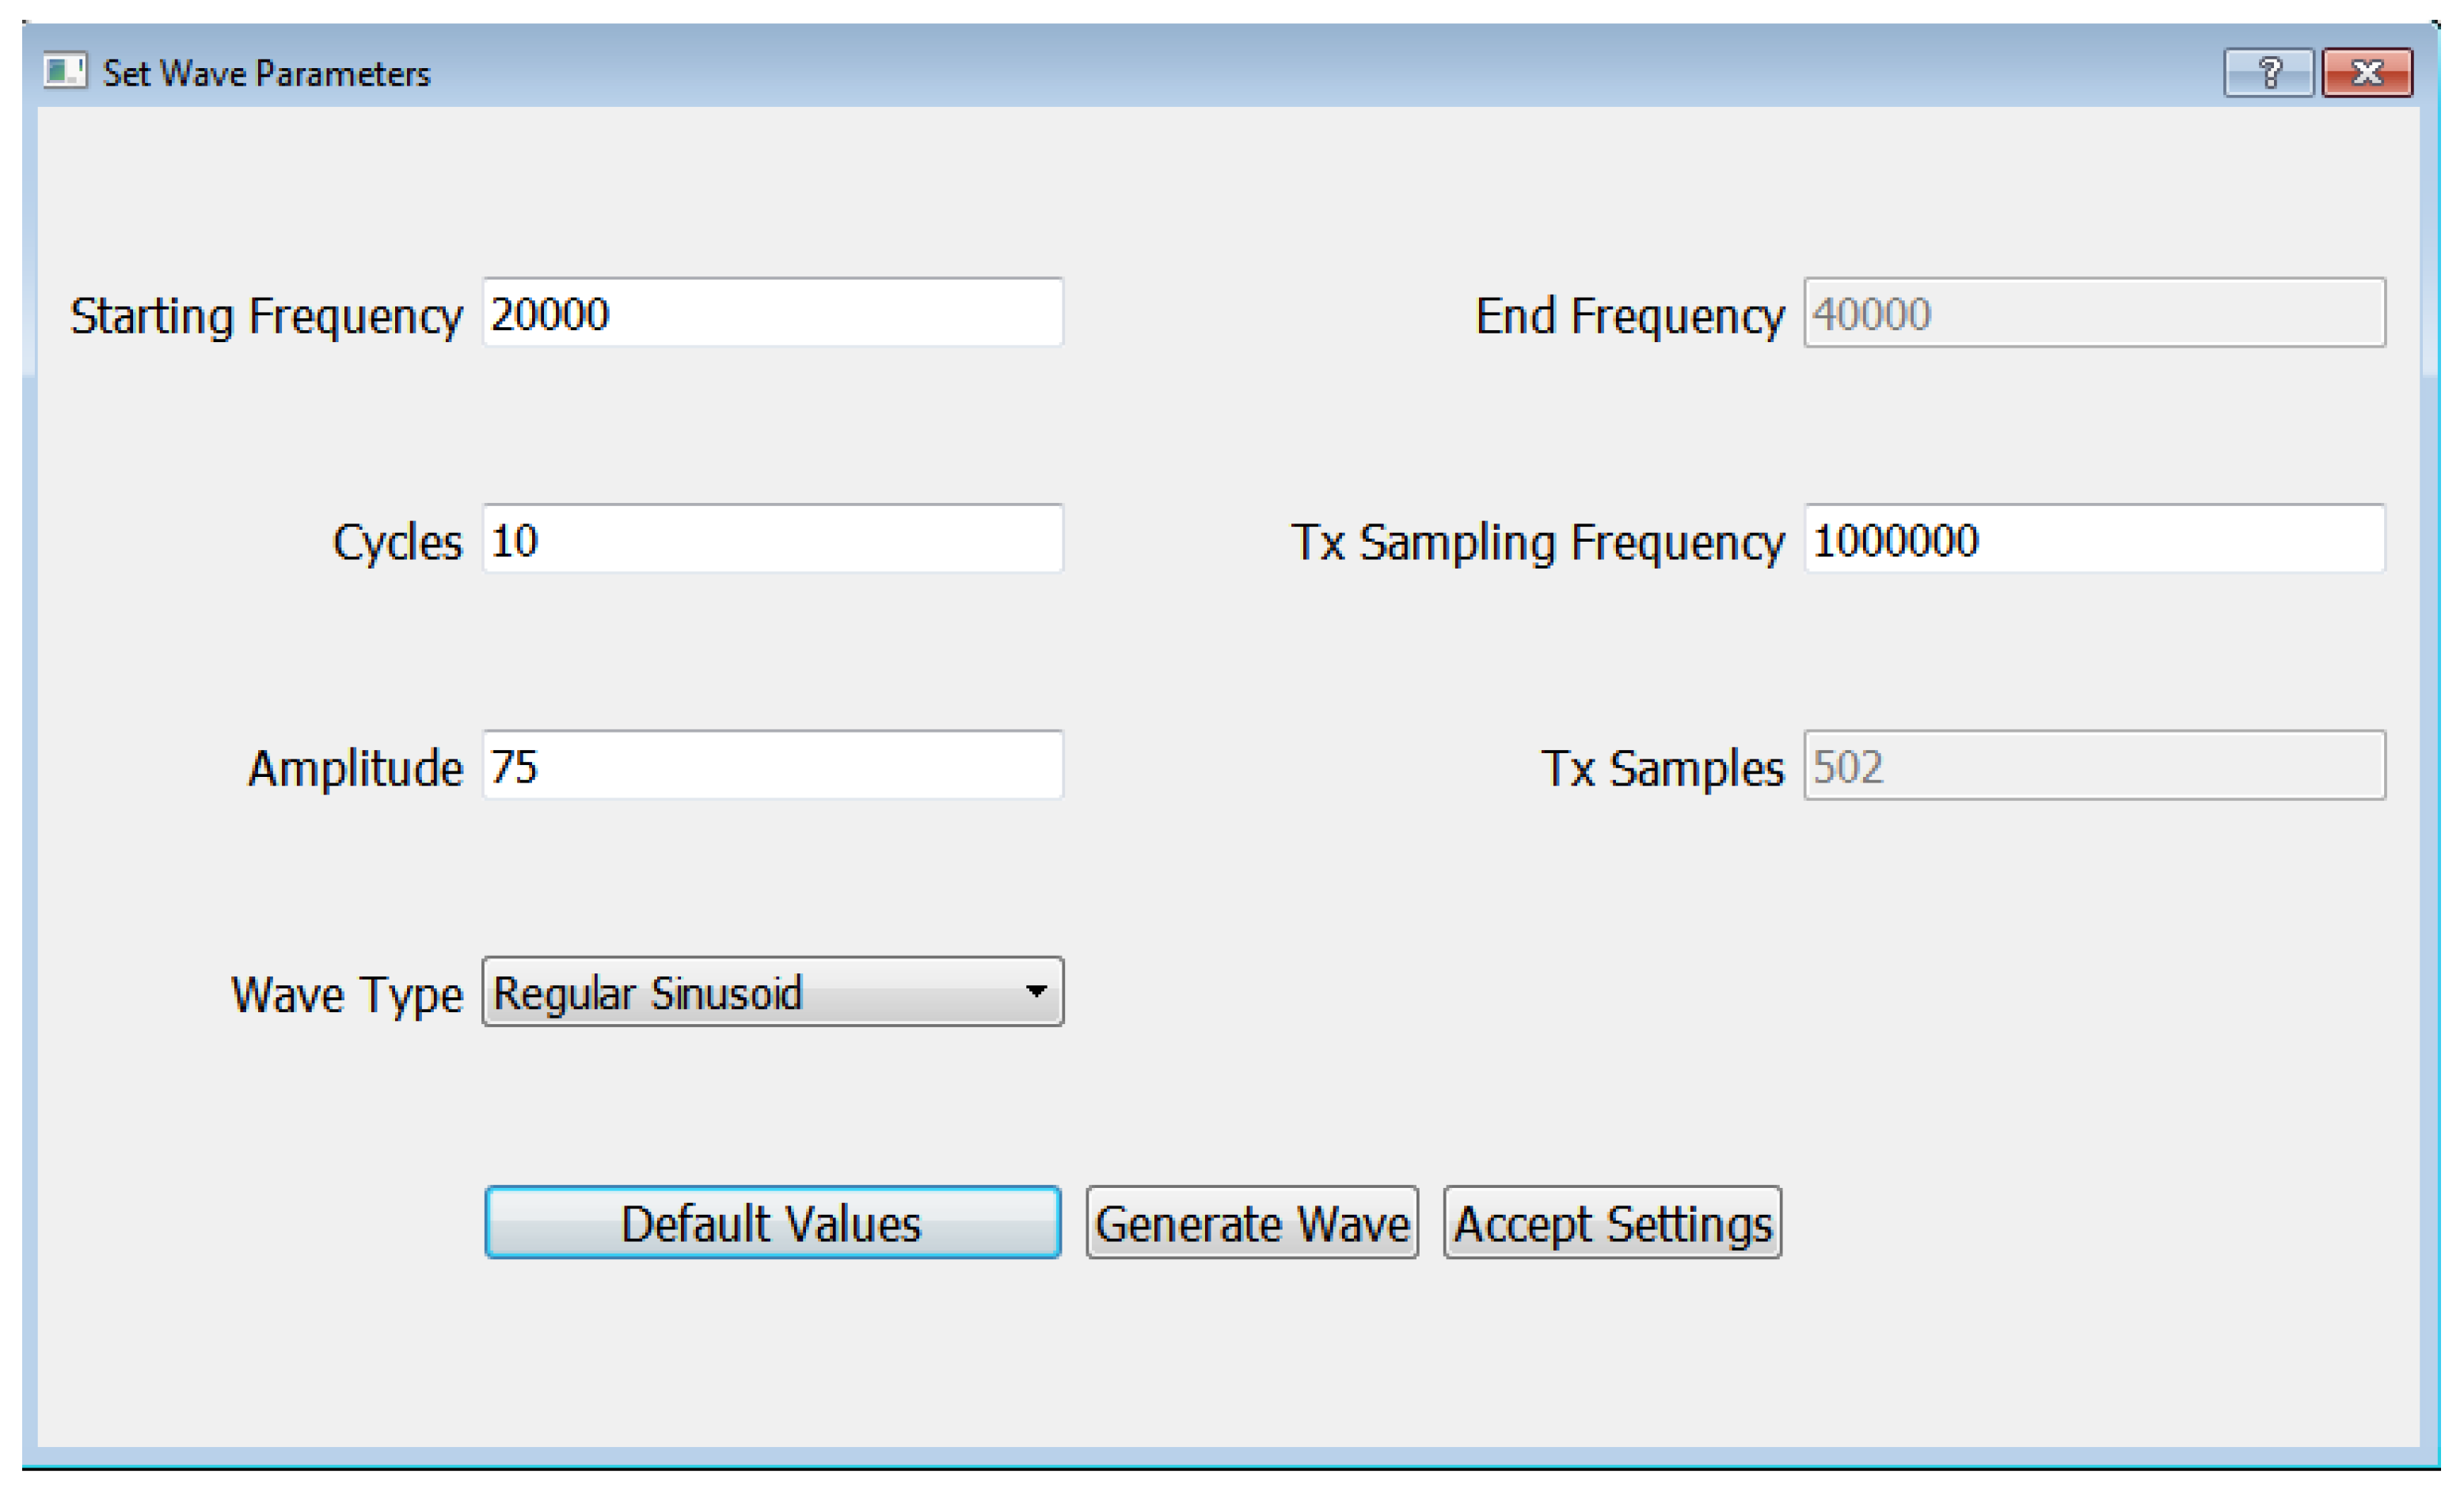
- Power Supply control 100–300 V, adjustable voltage via dimmer and QT_Sendwave
- Maximum current output 5 A RMS
- Operating Frequency 10–300 kHz
- Load Box with current protection, allowing off-resonance voltages up to 1000 V
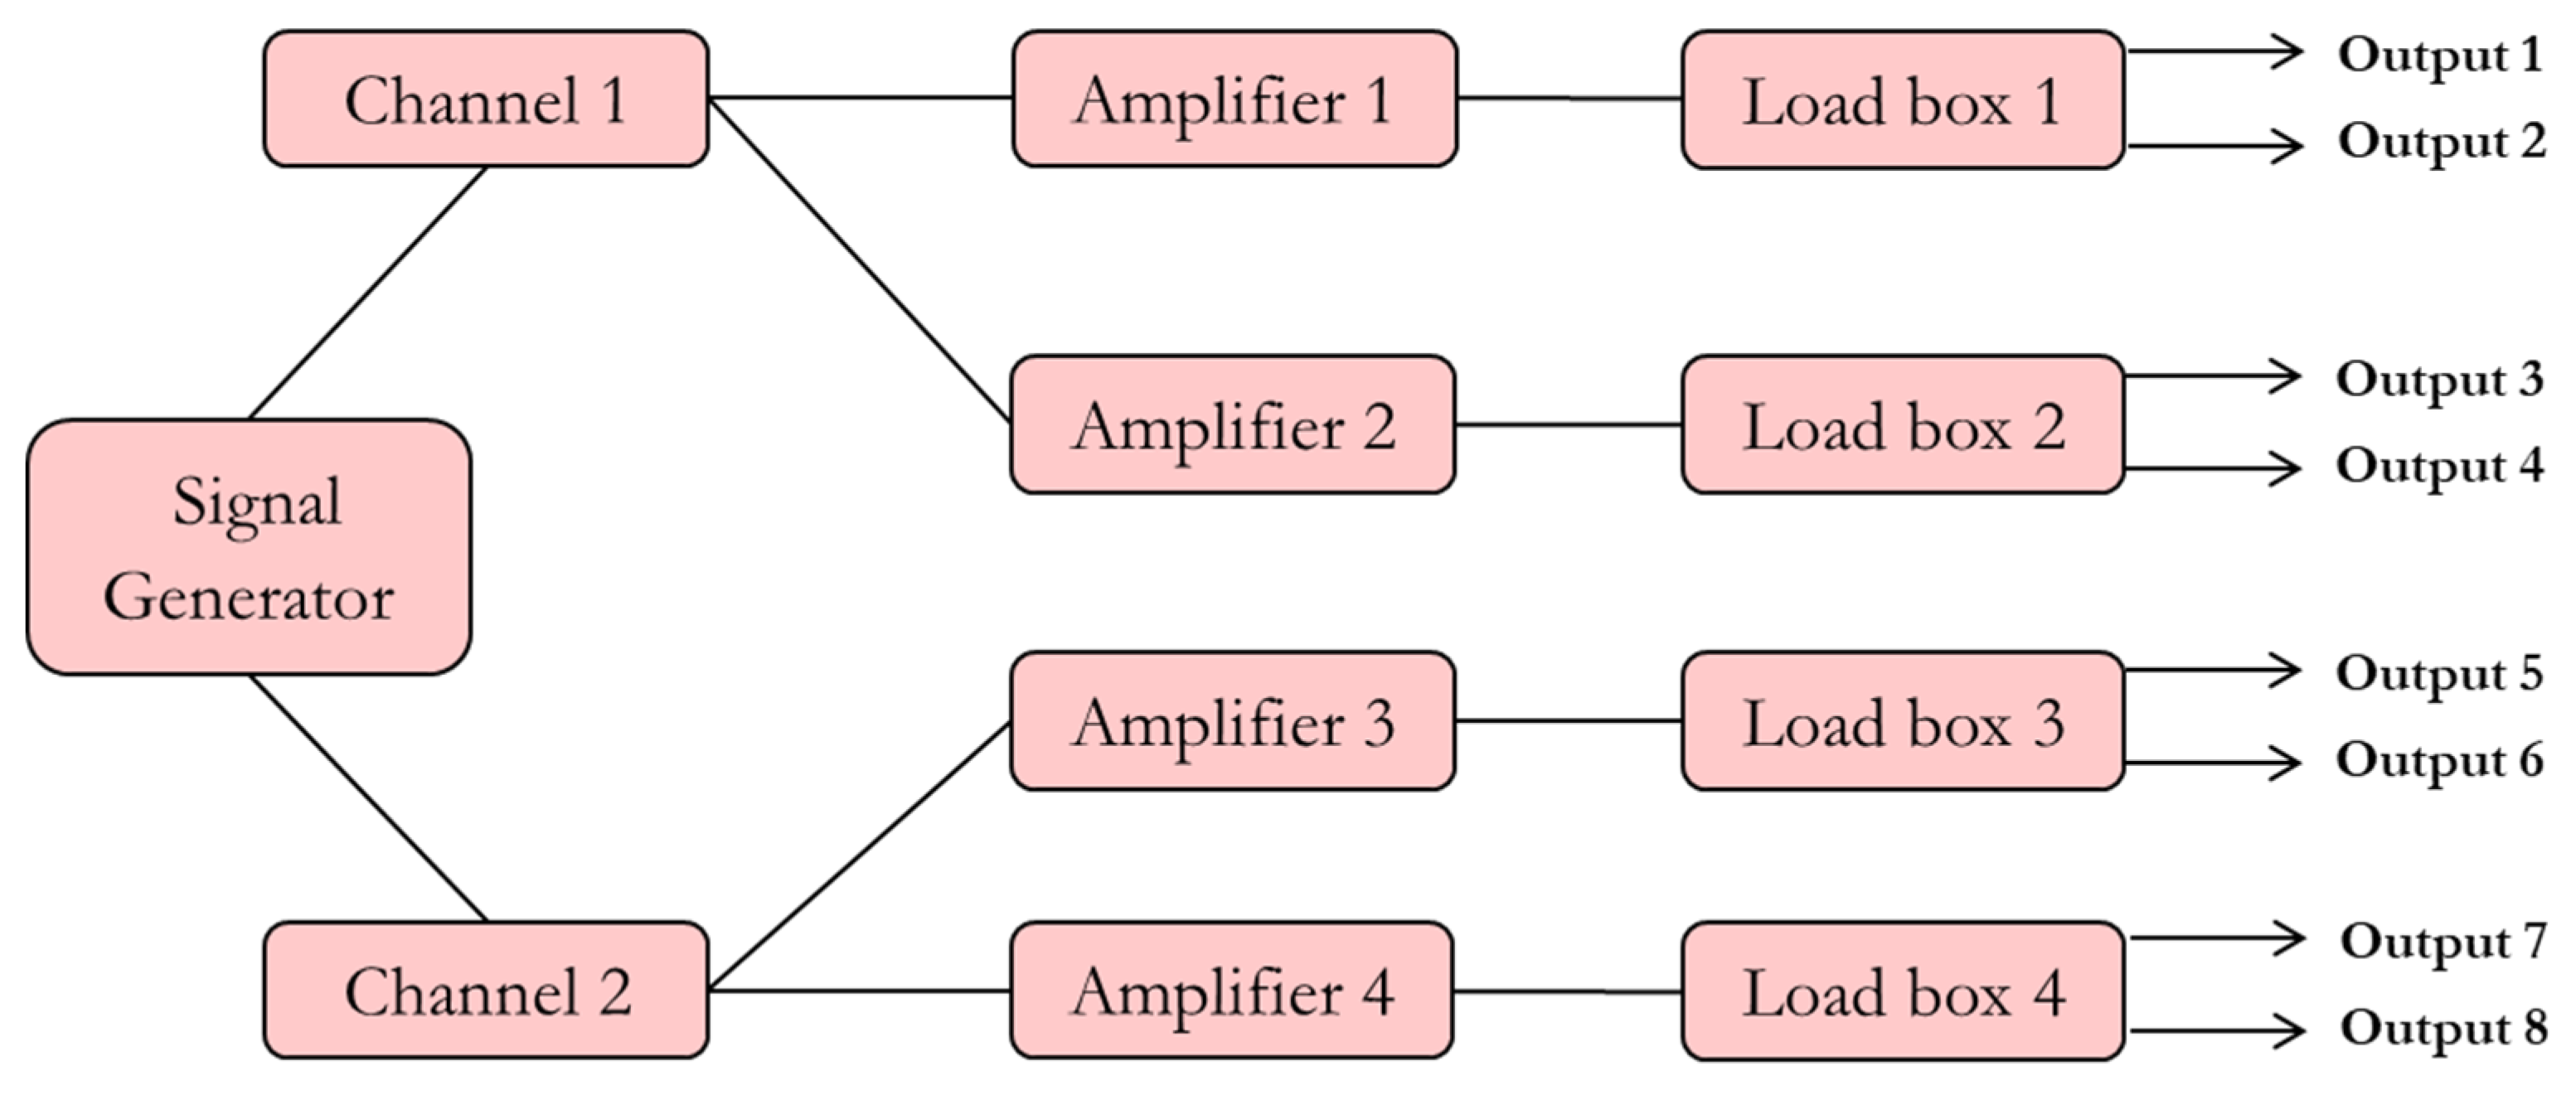
- Programmable 2 channel output signal generator
- 2 channel signal generator—two different outputs simultaneously
- Each signal generator drives 2 amplifiers
- 8 continuous-wave output channels (2 per channel 4 per output)
- Single sinusoids and chirp functions
- Arbitrary function generator possible with a software upgrade
- Power monitoring functions
- Power supply monitoring functions
- Logging, auto restart, and parameter persistence functions
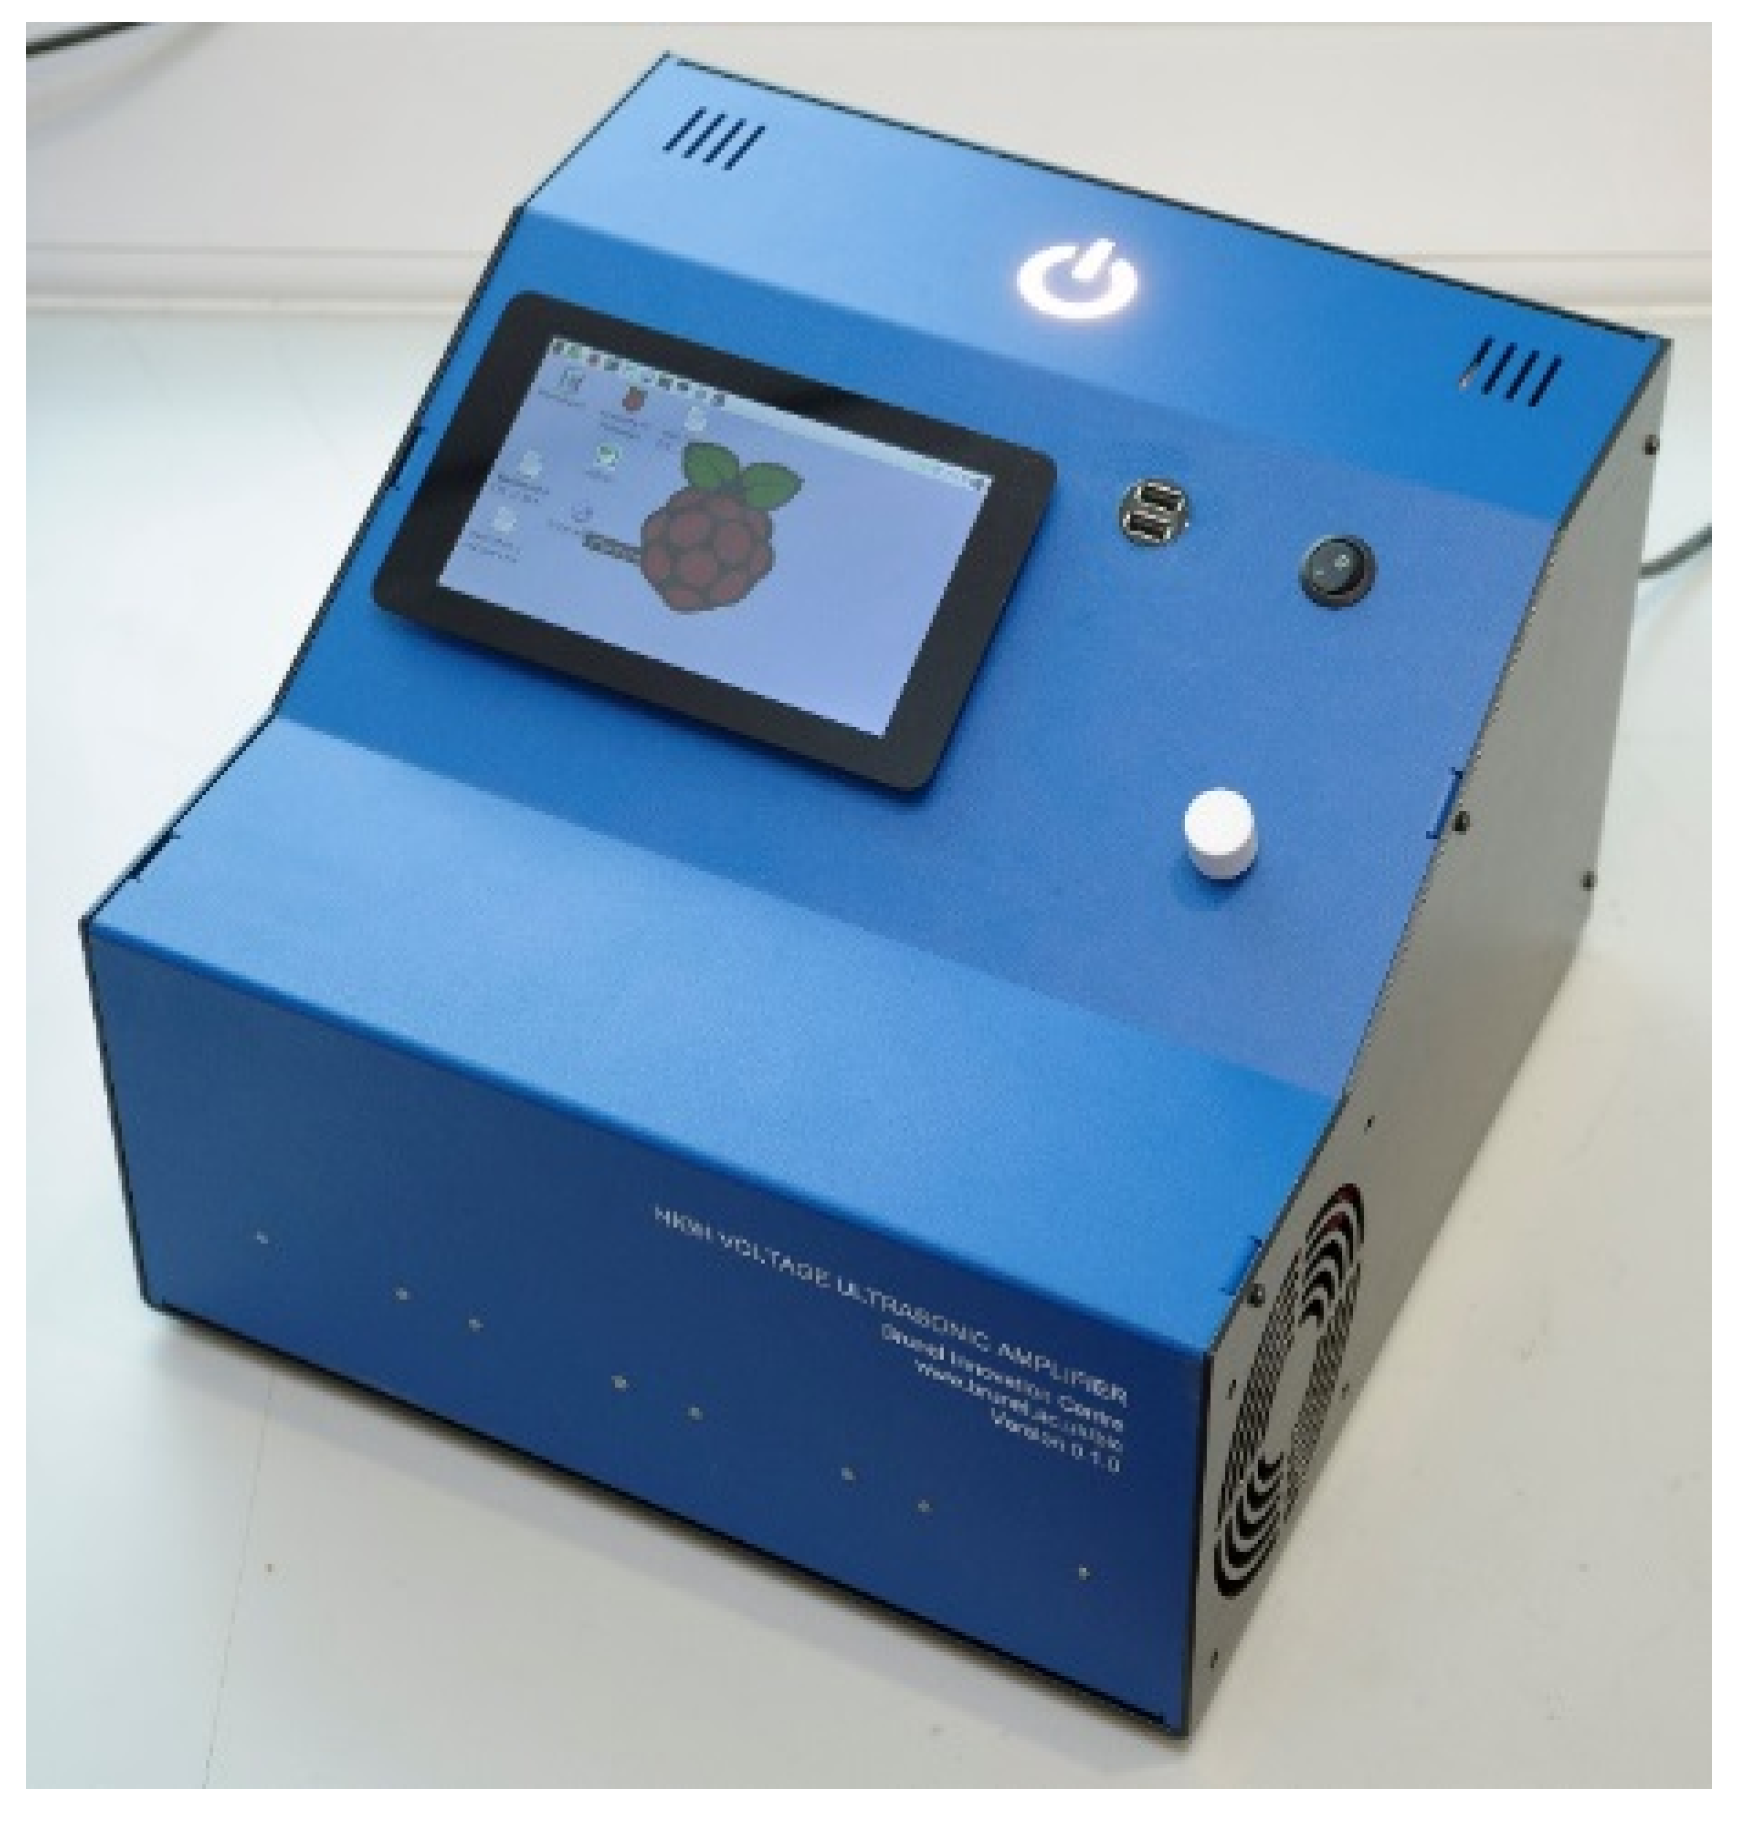
- Raspberry pi with a touch screen interface
- 2 USB ports
- Fan cooled
- Isolated transformer
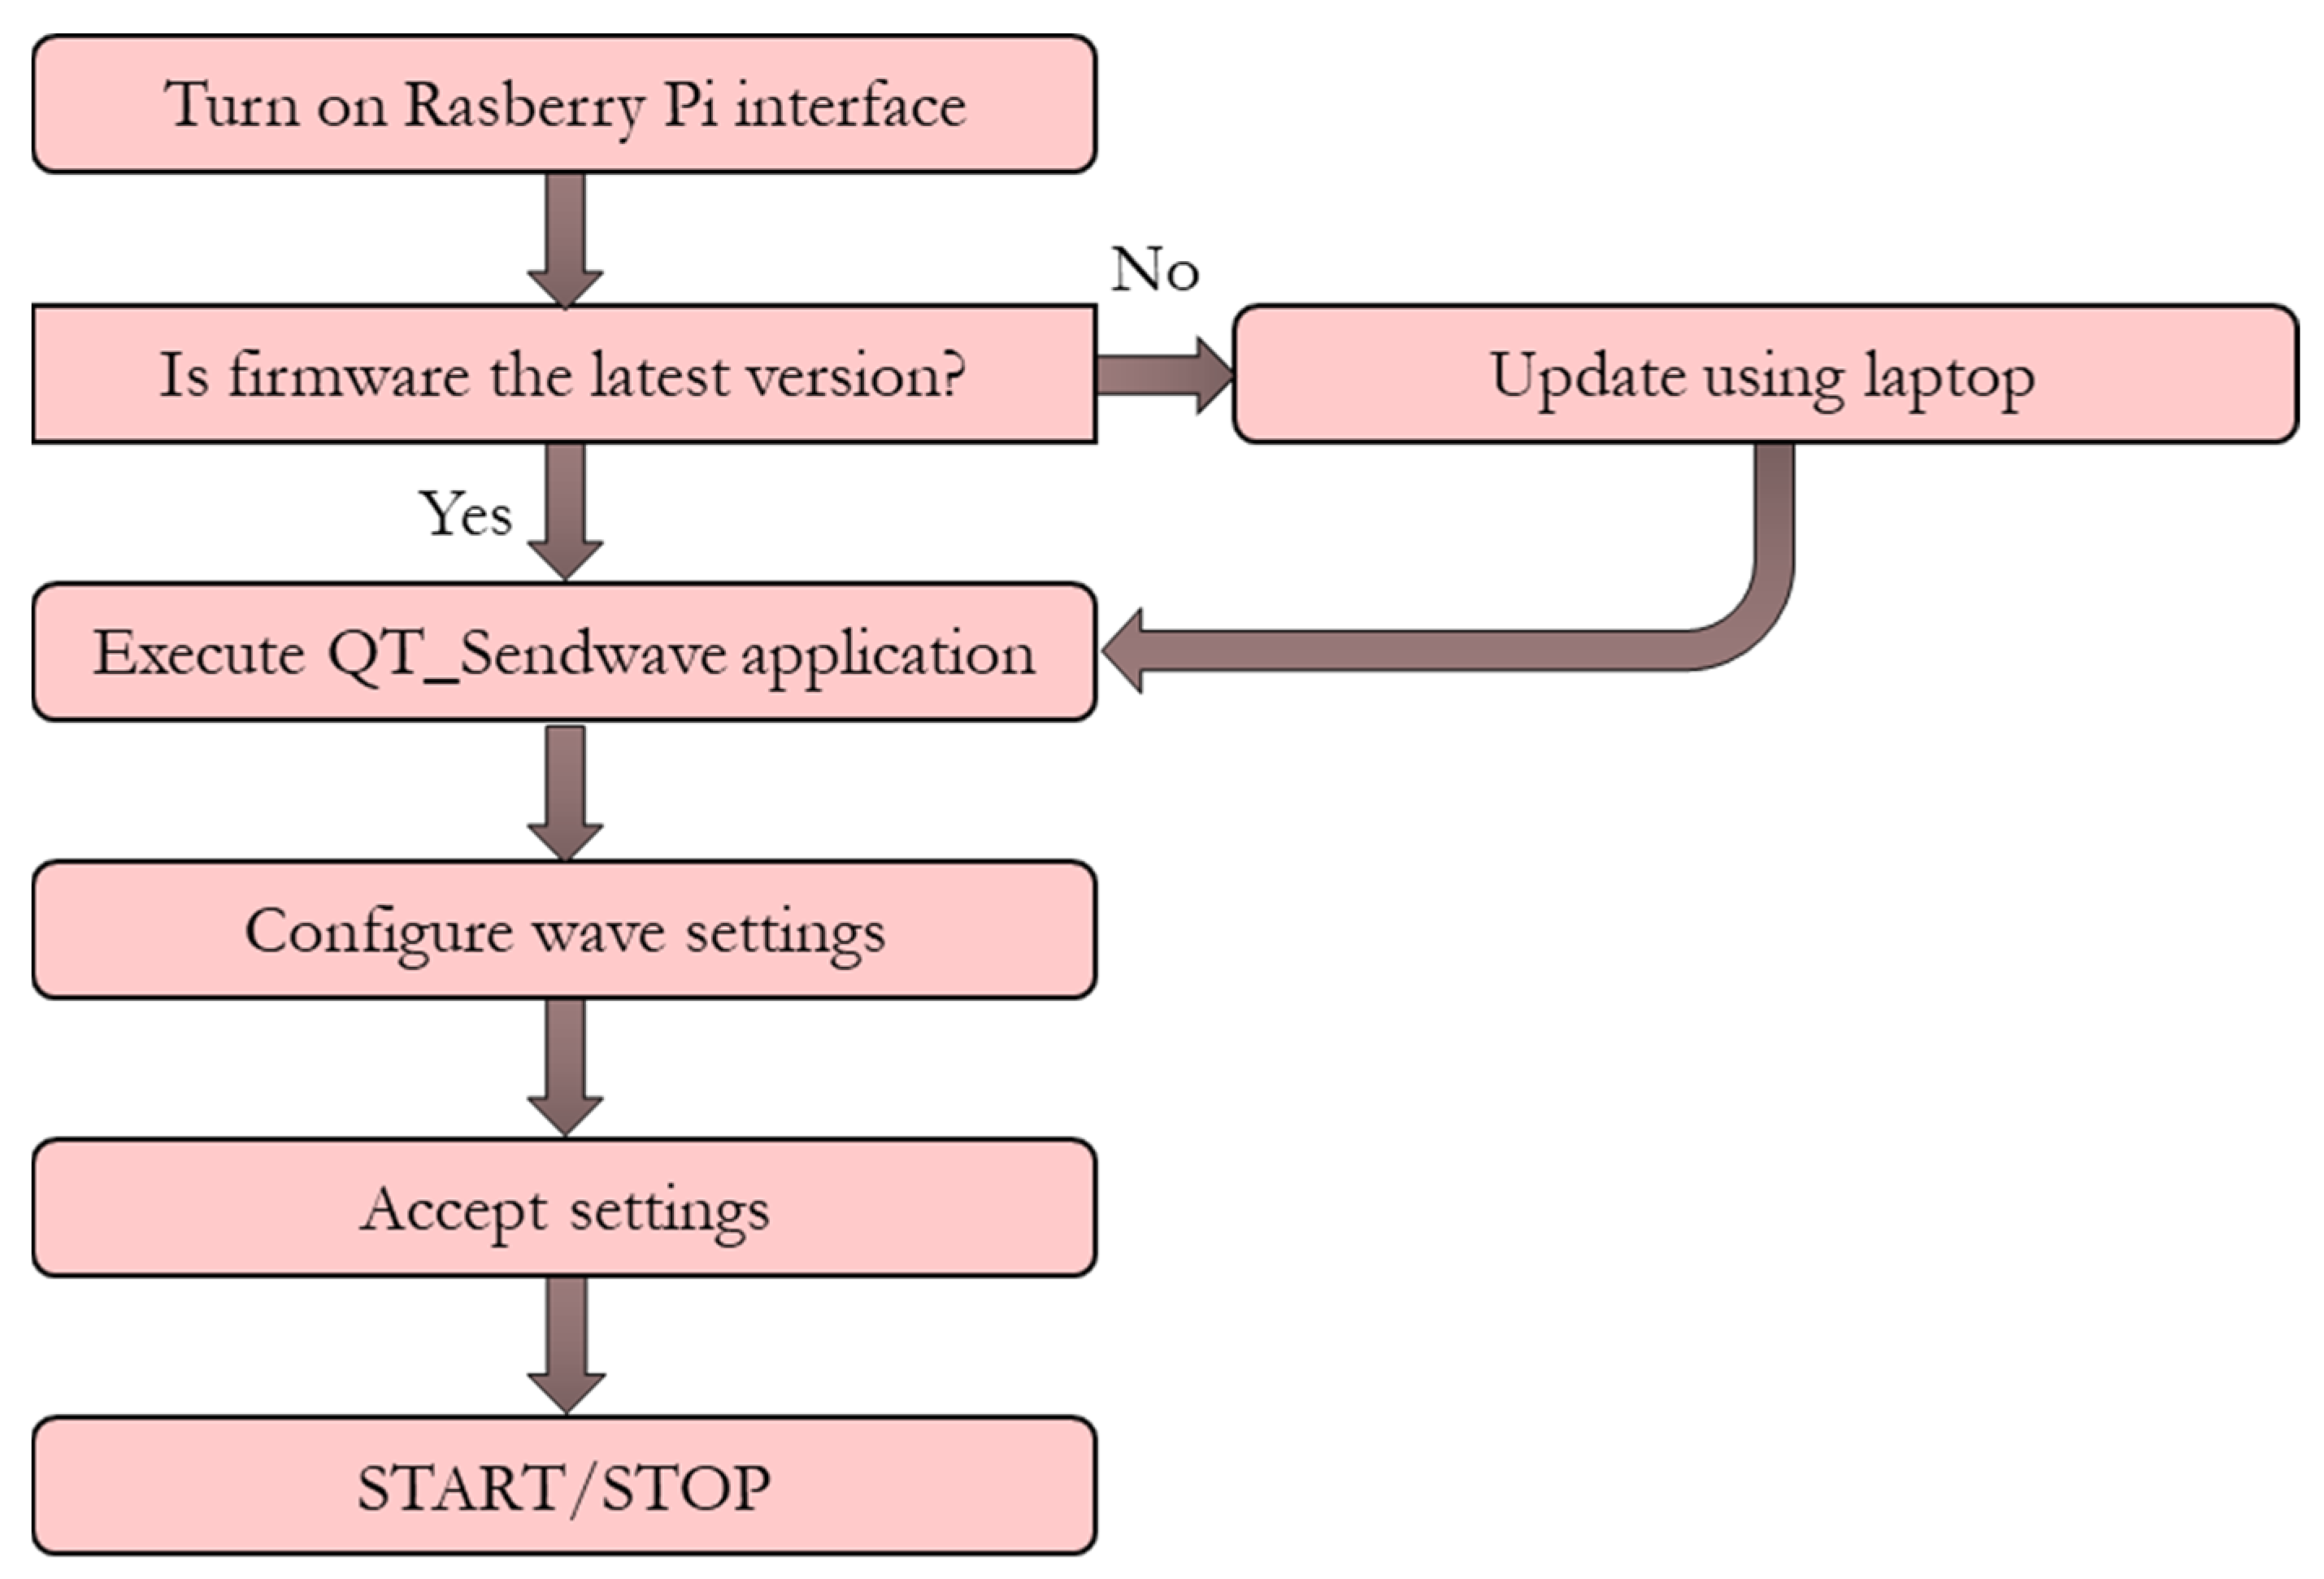
3.2. Power Ultrasonic Software
3.2.1. Software Architecture
- Maximum operating voltage 300 V and up to 5 AMPS
- Operation safety controlled by Load Box and power supply variation using Dimmer
- High Voltage supply used directly from mains supply and the use of isolation transformer to avoid shock hazards when operating the unit
- Load Box also used to match impedance of cleaning HPUTs
3.2.2. Functionality
- Signal generator and power monitor:
- Centered on STM32F407 chip using evaluation board providing a very cost-effective solution for the supported functions needed in this design
- Single board can handle 2 channels working simultaneously
- Board has 2 Digital-to-Analogue Converters (DAC) which can be programmed by software to generate arbitrary function
- System is designed for cleaning, so signals generated are sinusoidal and chirp signals
- 6 Analogue-to-Digital Converters (ADC) channels used for sequential monitoring functions
- Maximum operation signal generated is 100 kHz, limited by internal analog circuitry, but extended to 300 kHz by add on circuitry
- Boards operate dedicated custom firmware (BIC IP) that enables DAC and ADC programming functions together with communications with control software via USB
3.2.3. Control Computer
- Centered on Raspberry Pi 3 and 7-inch touch screen monitor
- Runs Raspbian Linux operation system with full graphical user interface (GUI)
- Dedicated application for controlling signal generation, monitoring, logging, and persistence functions
- 2 Port USB interface available on the box for I/O operation
- Wi-Fi support for internet and/or remote access
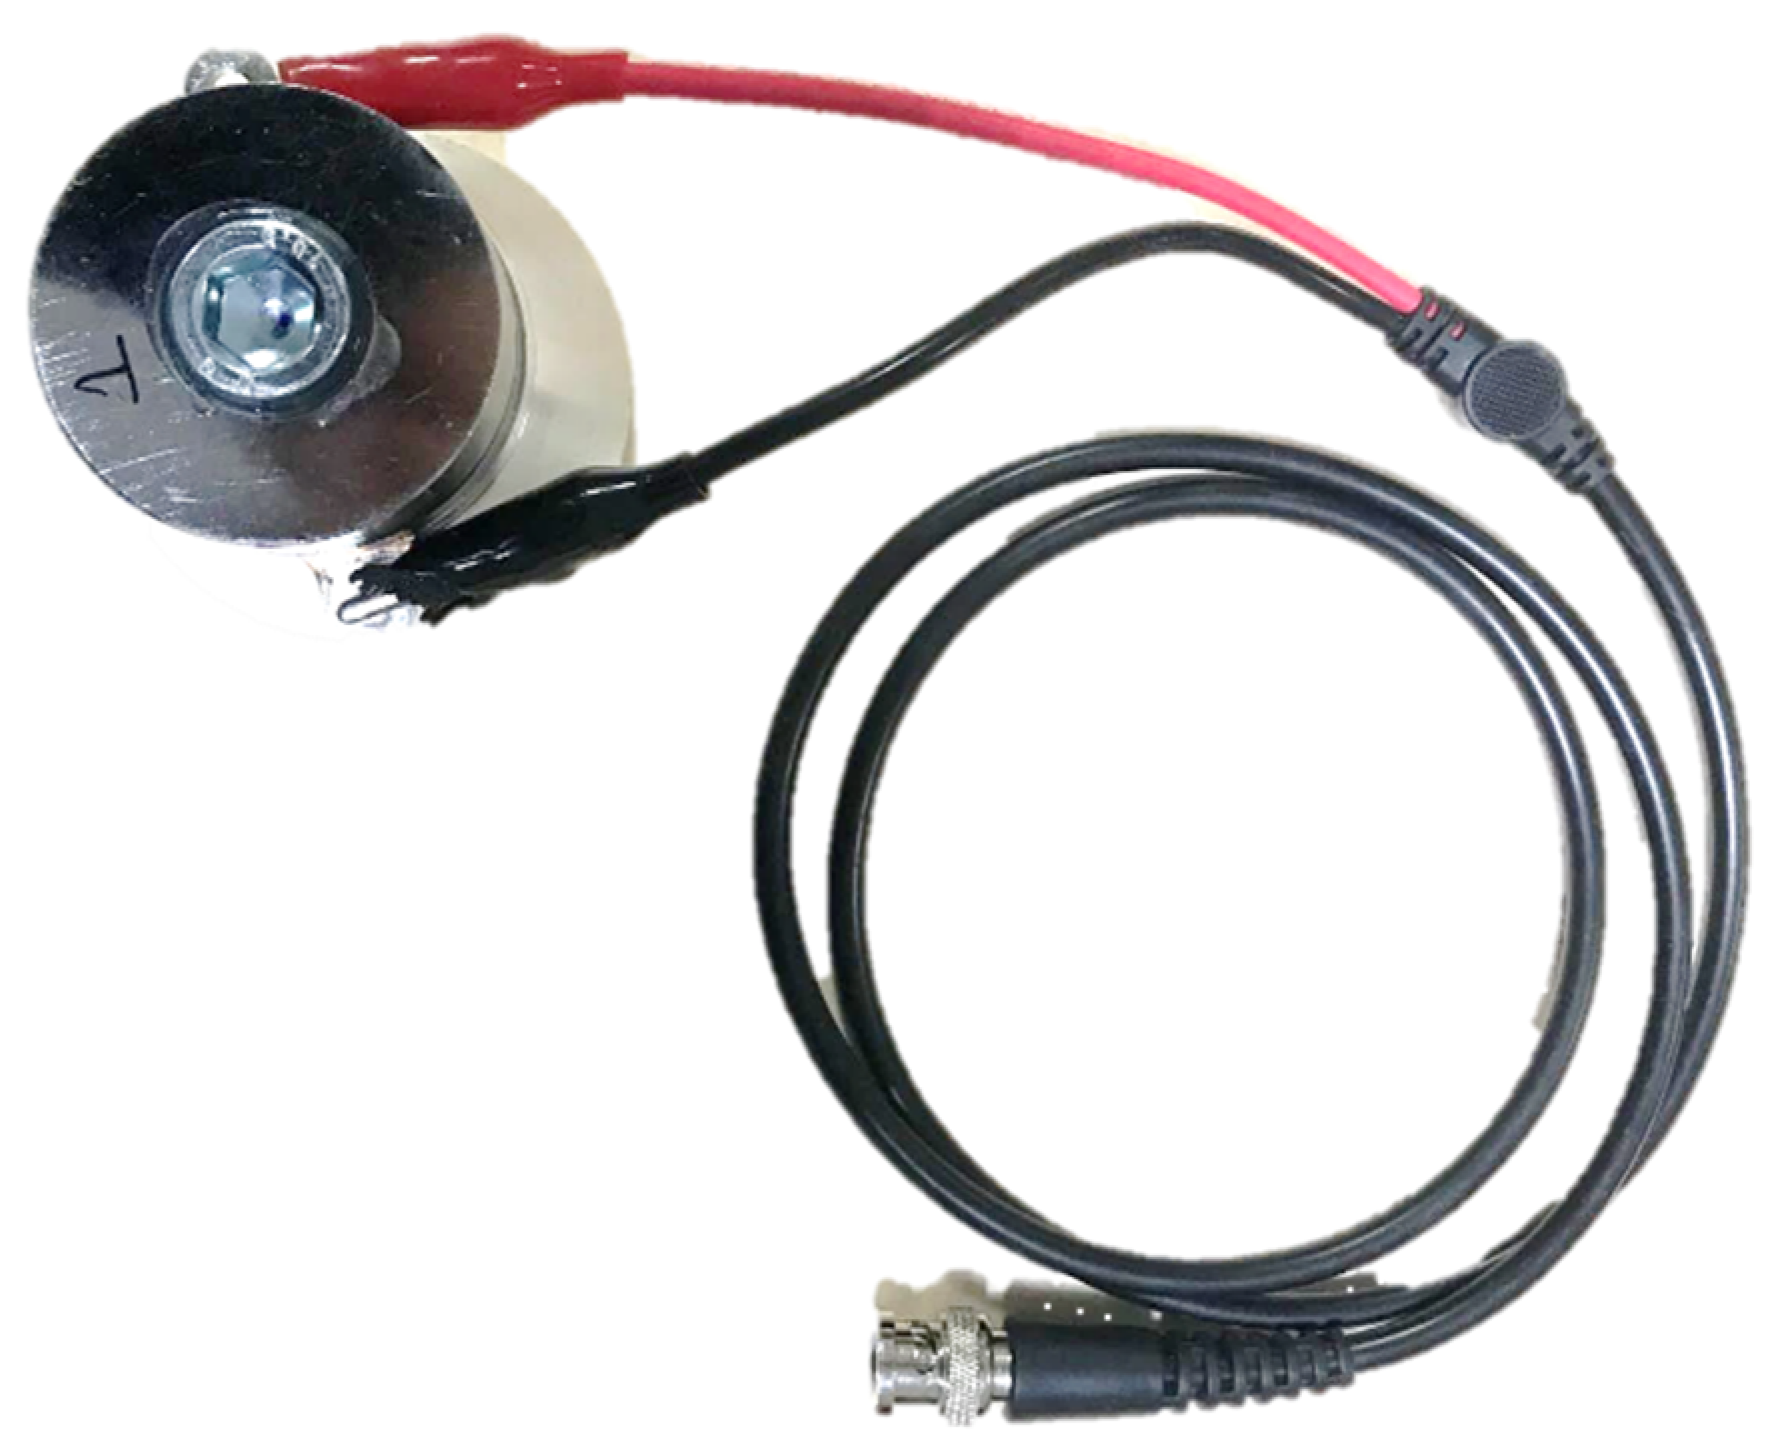
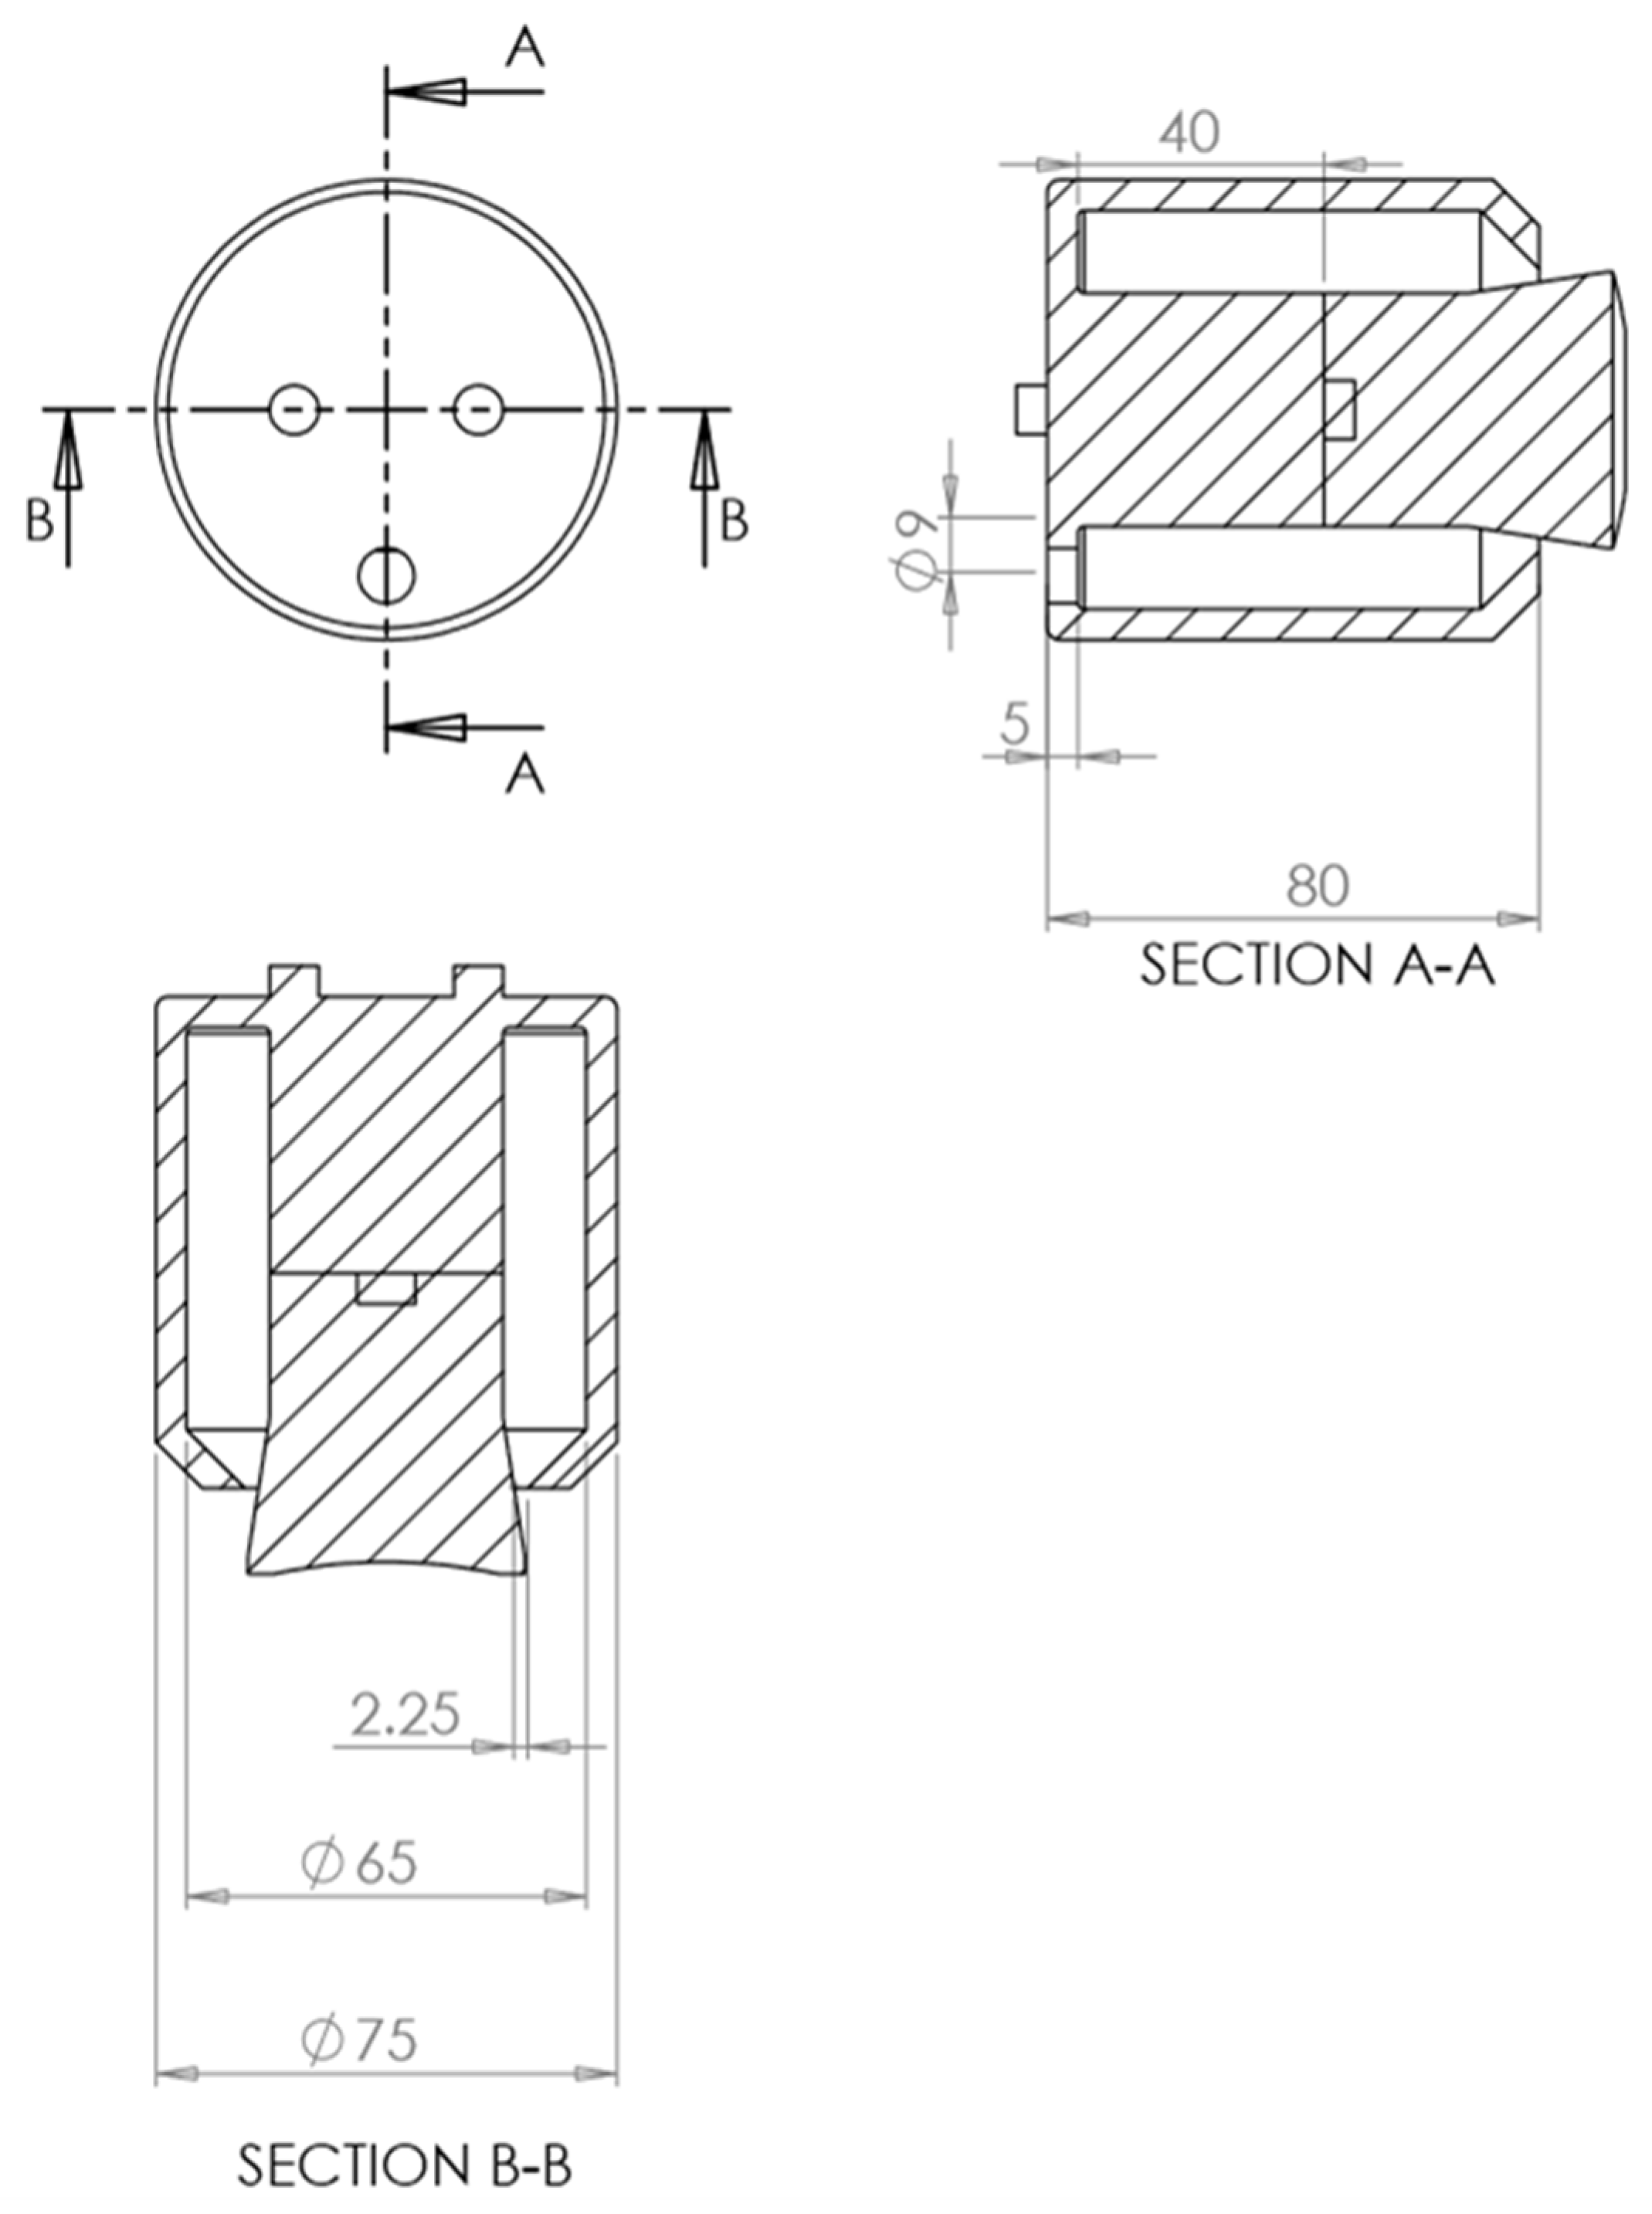
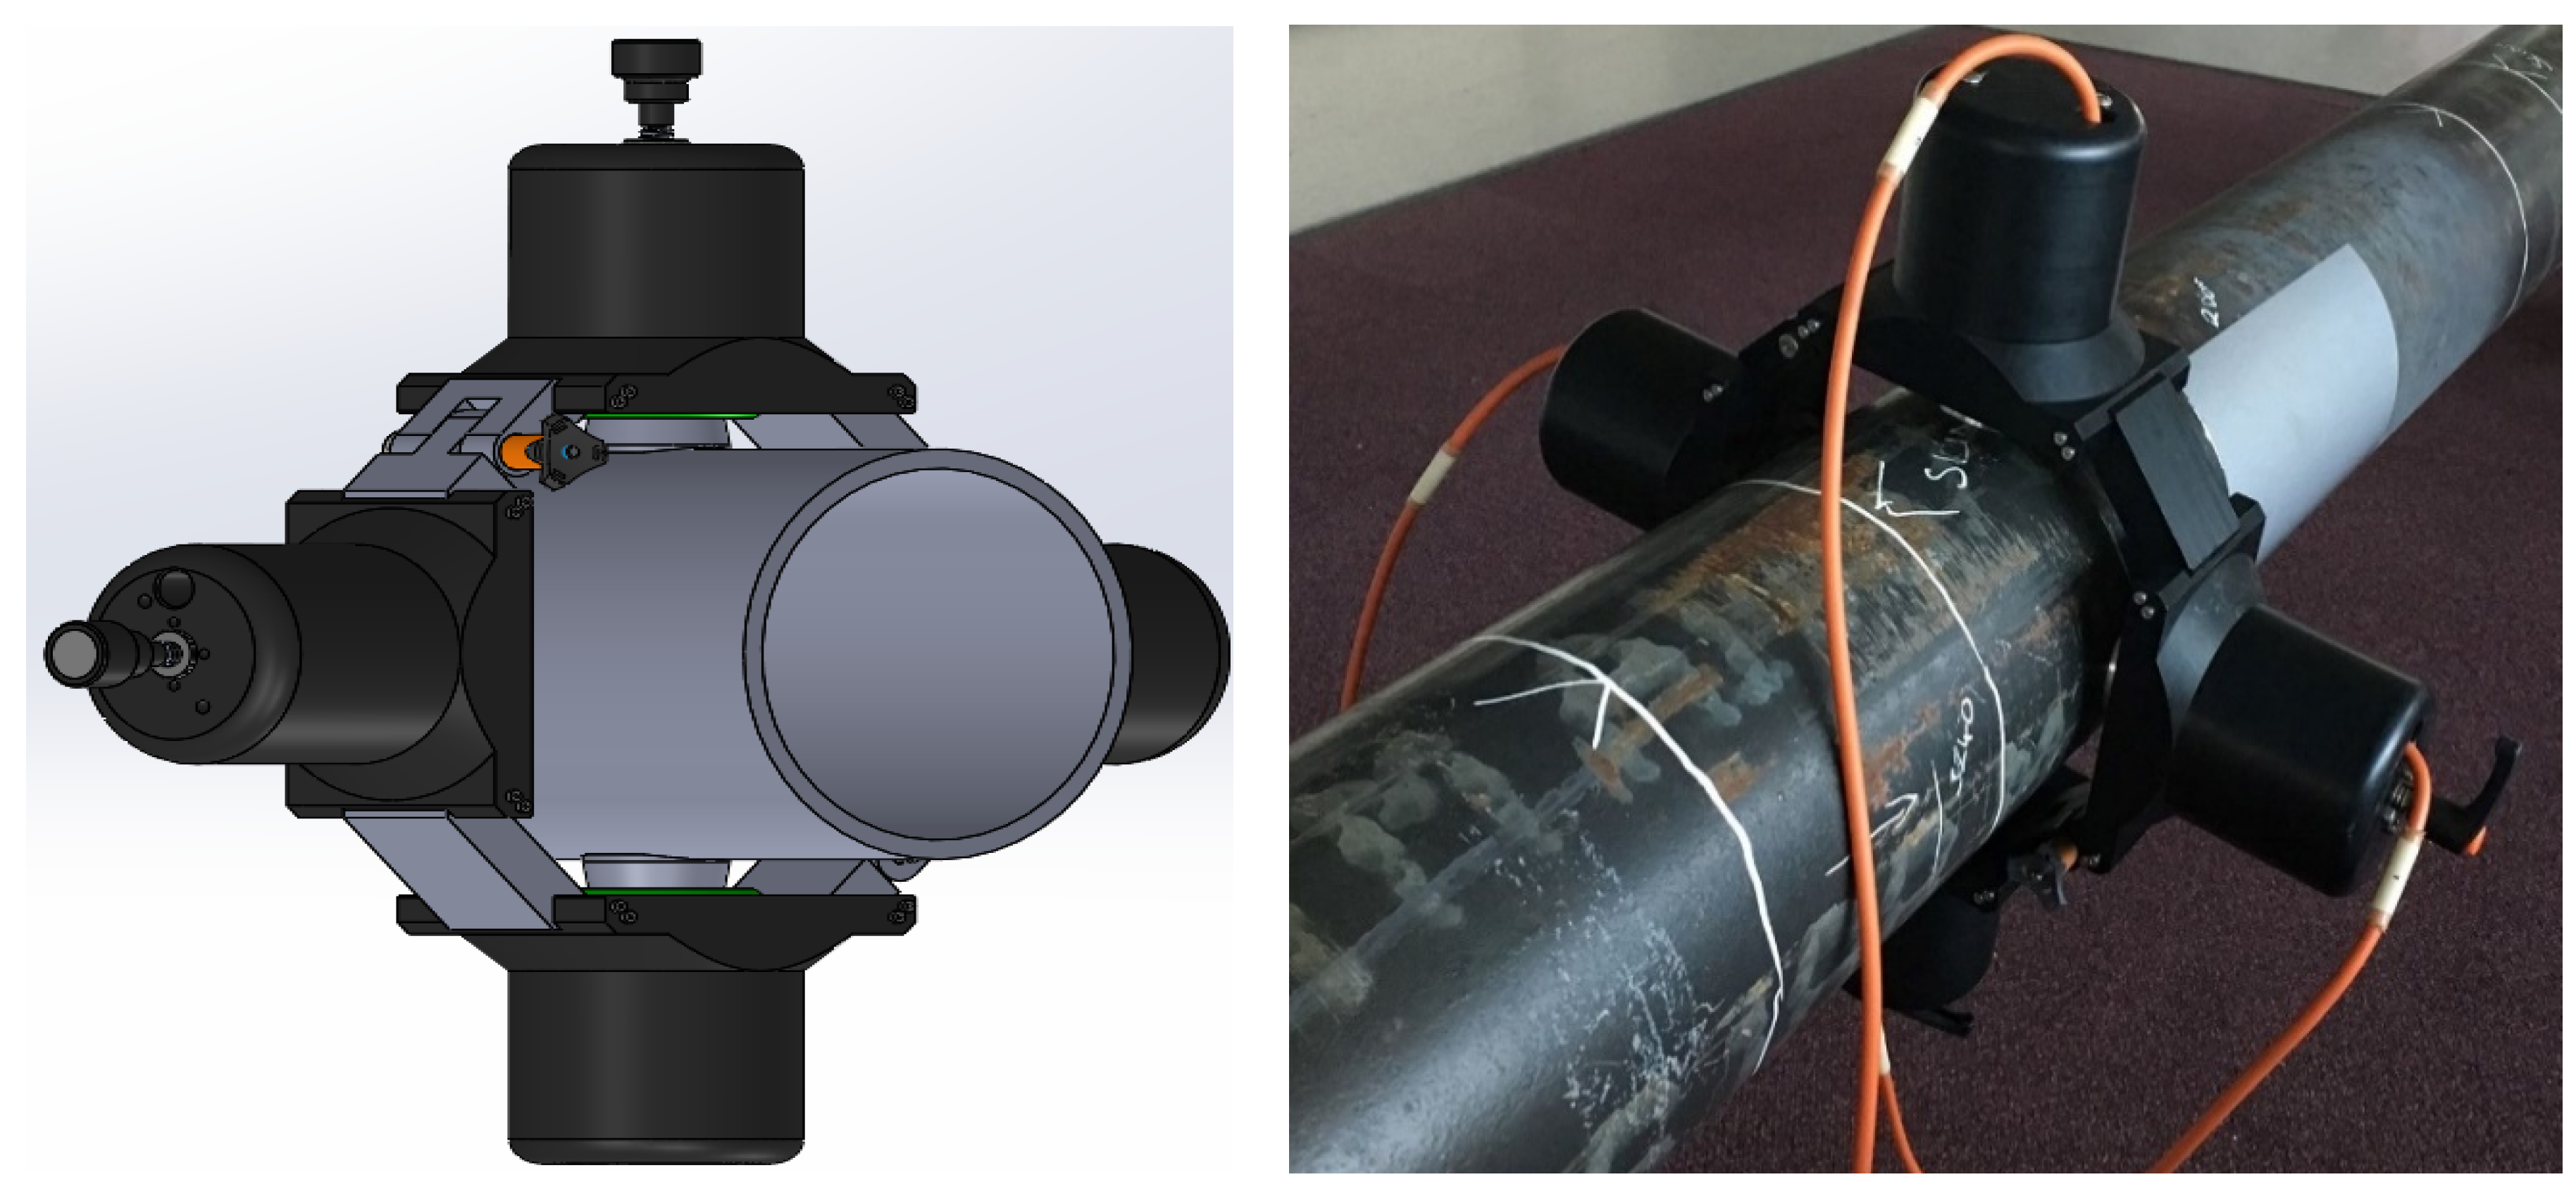
3.3. HPUT Collar
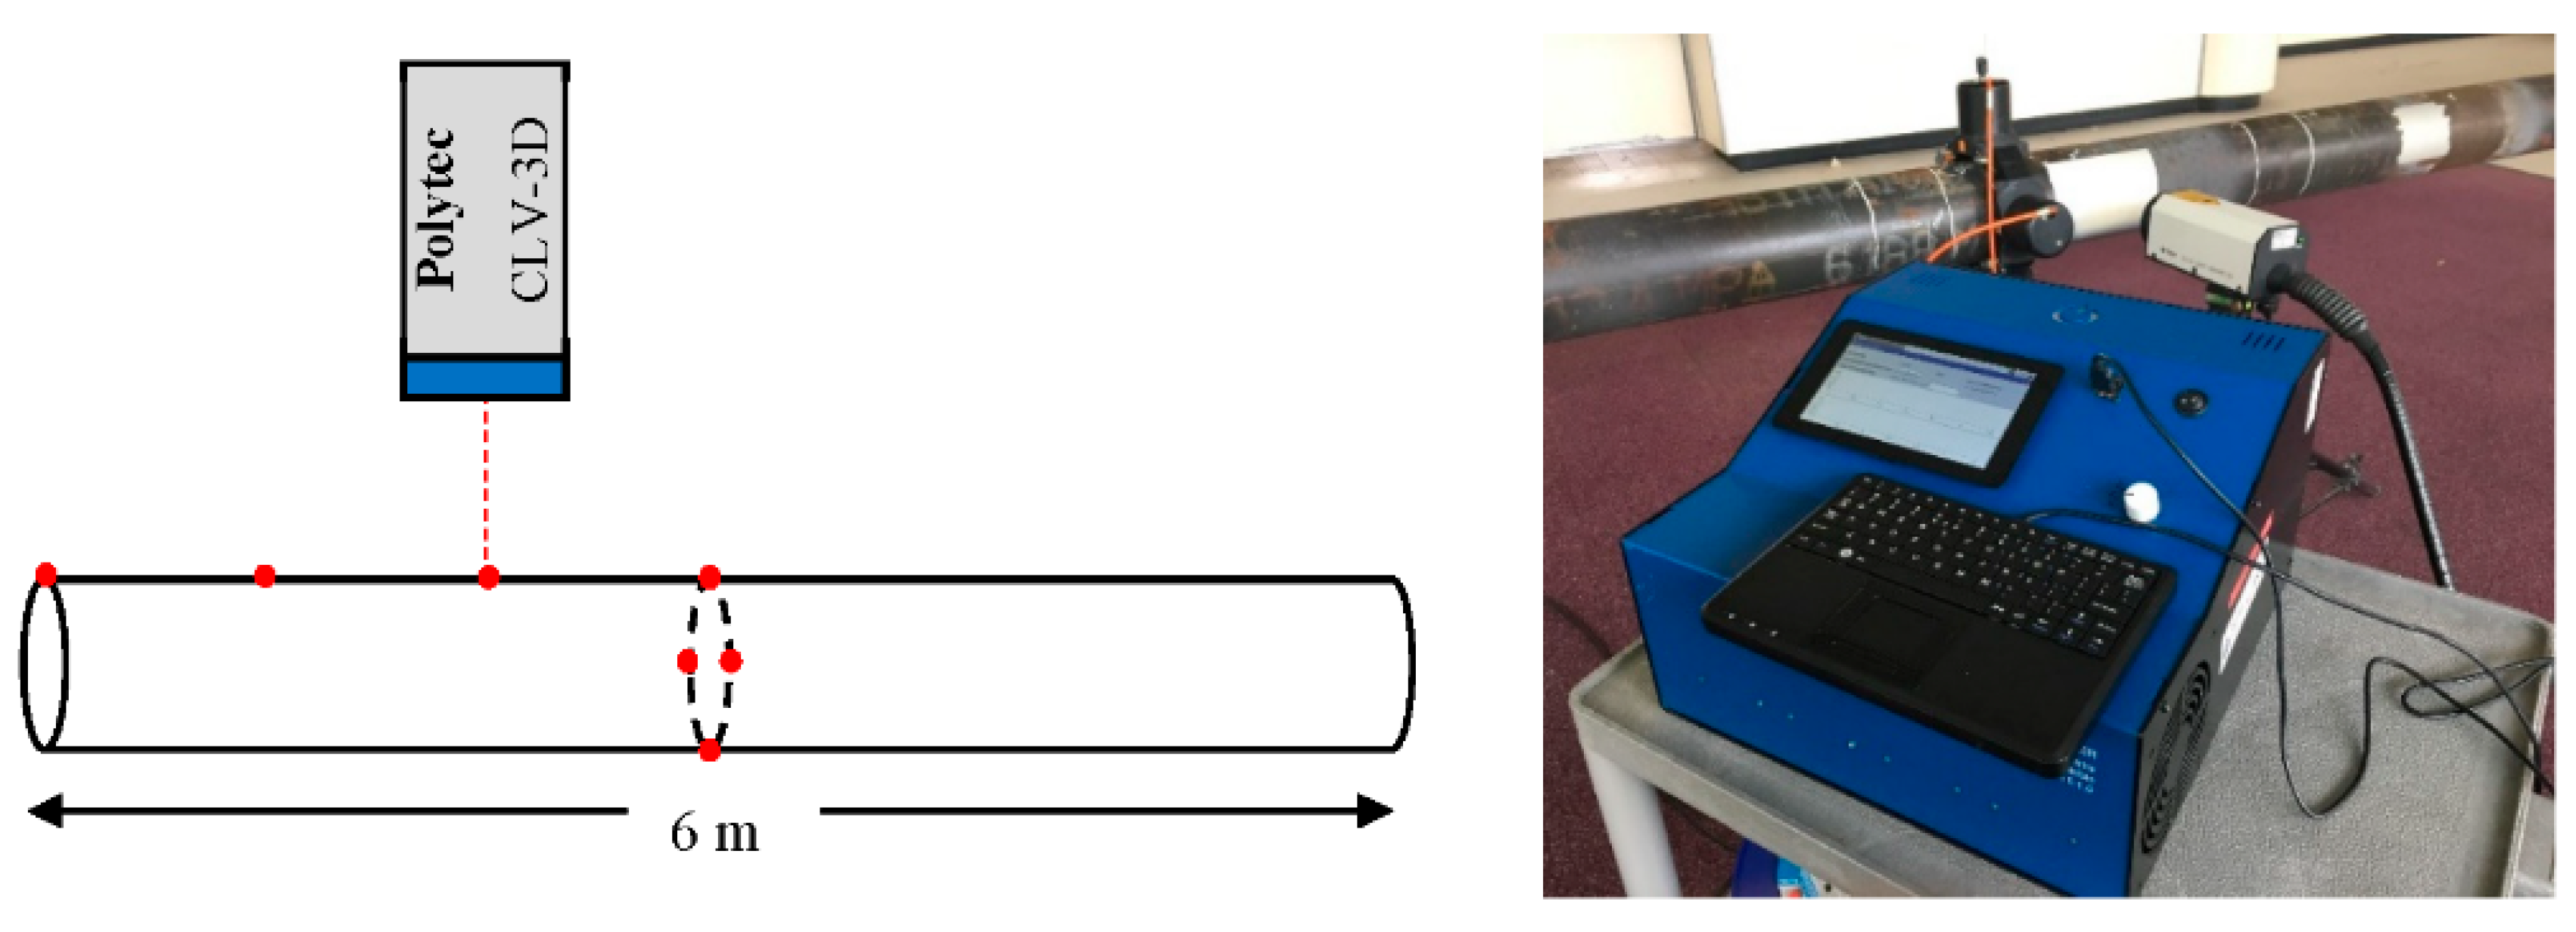
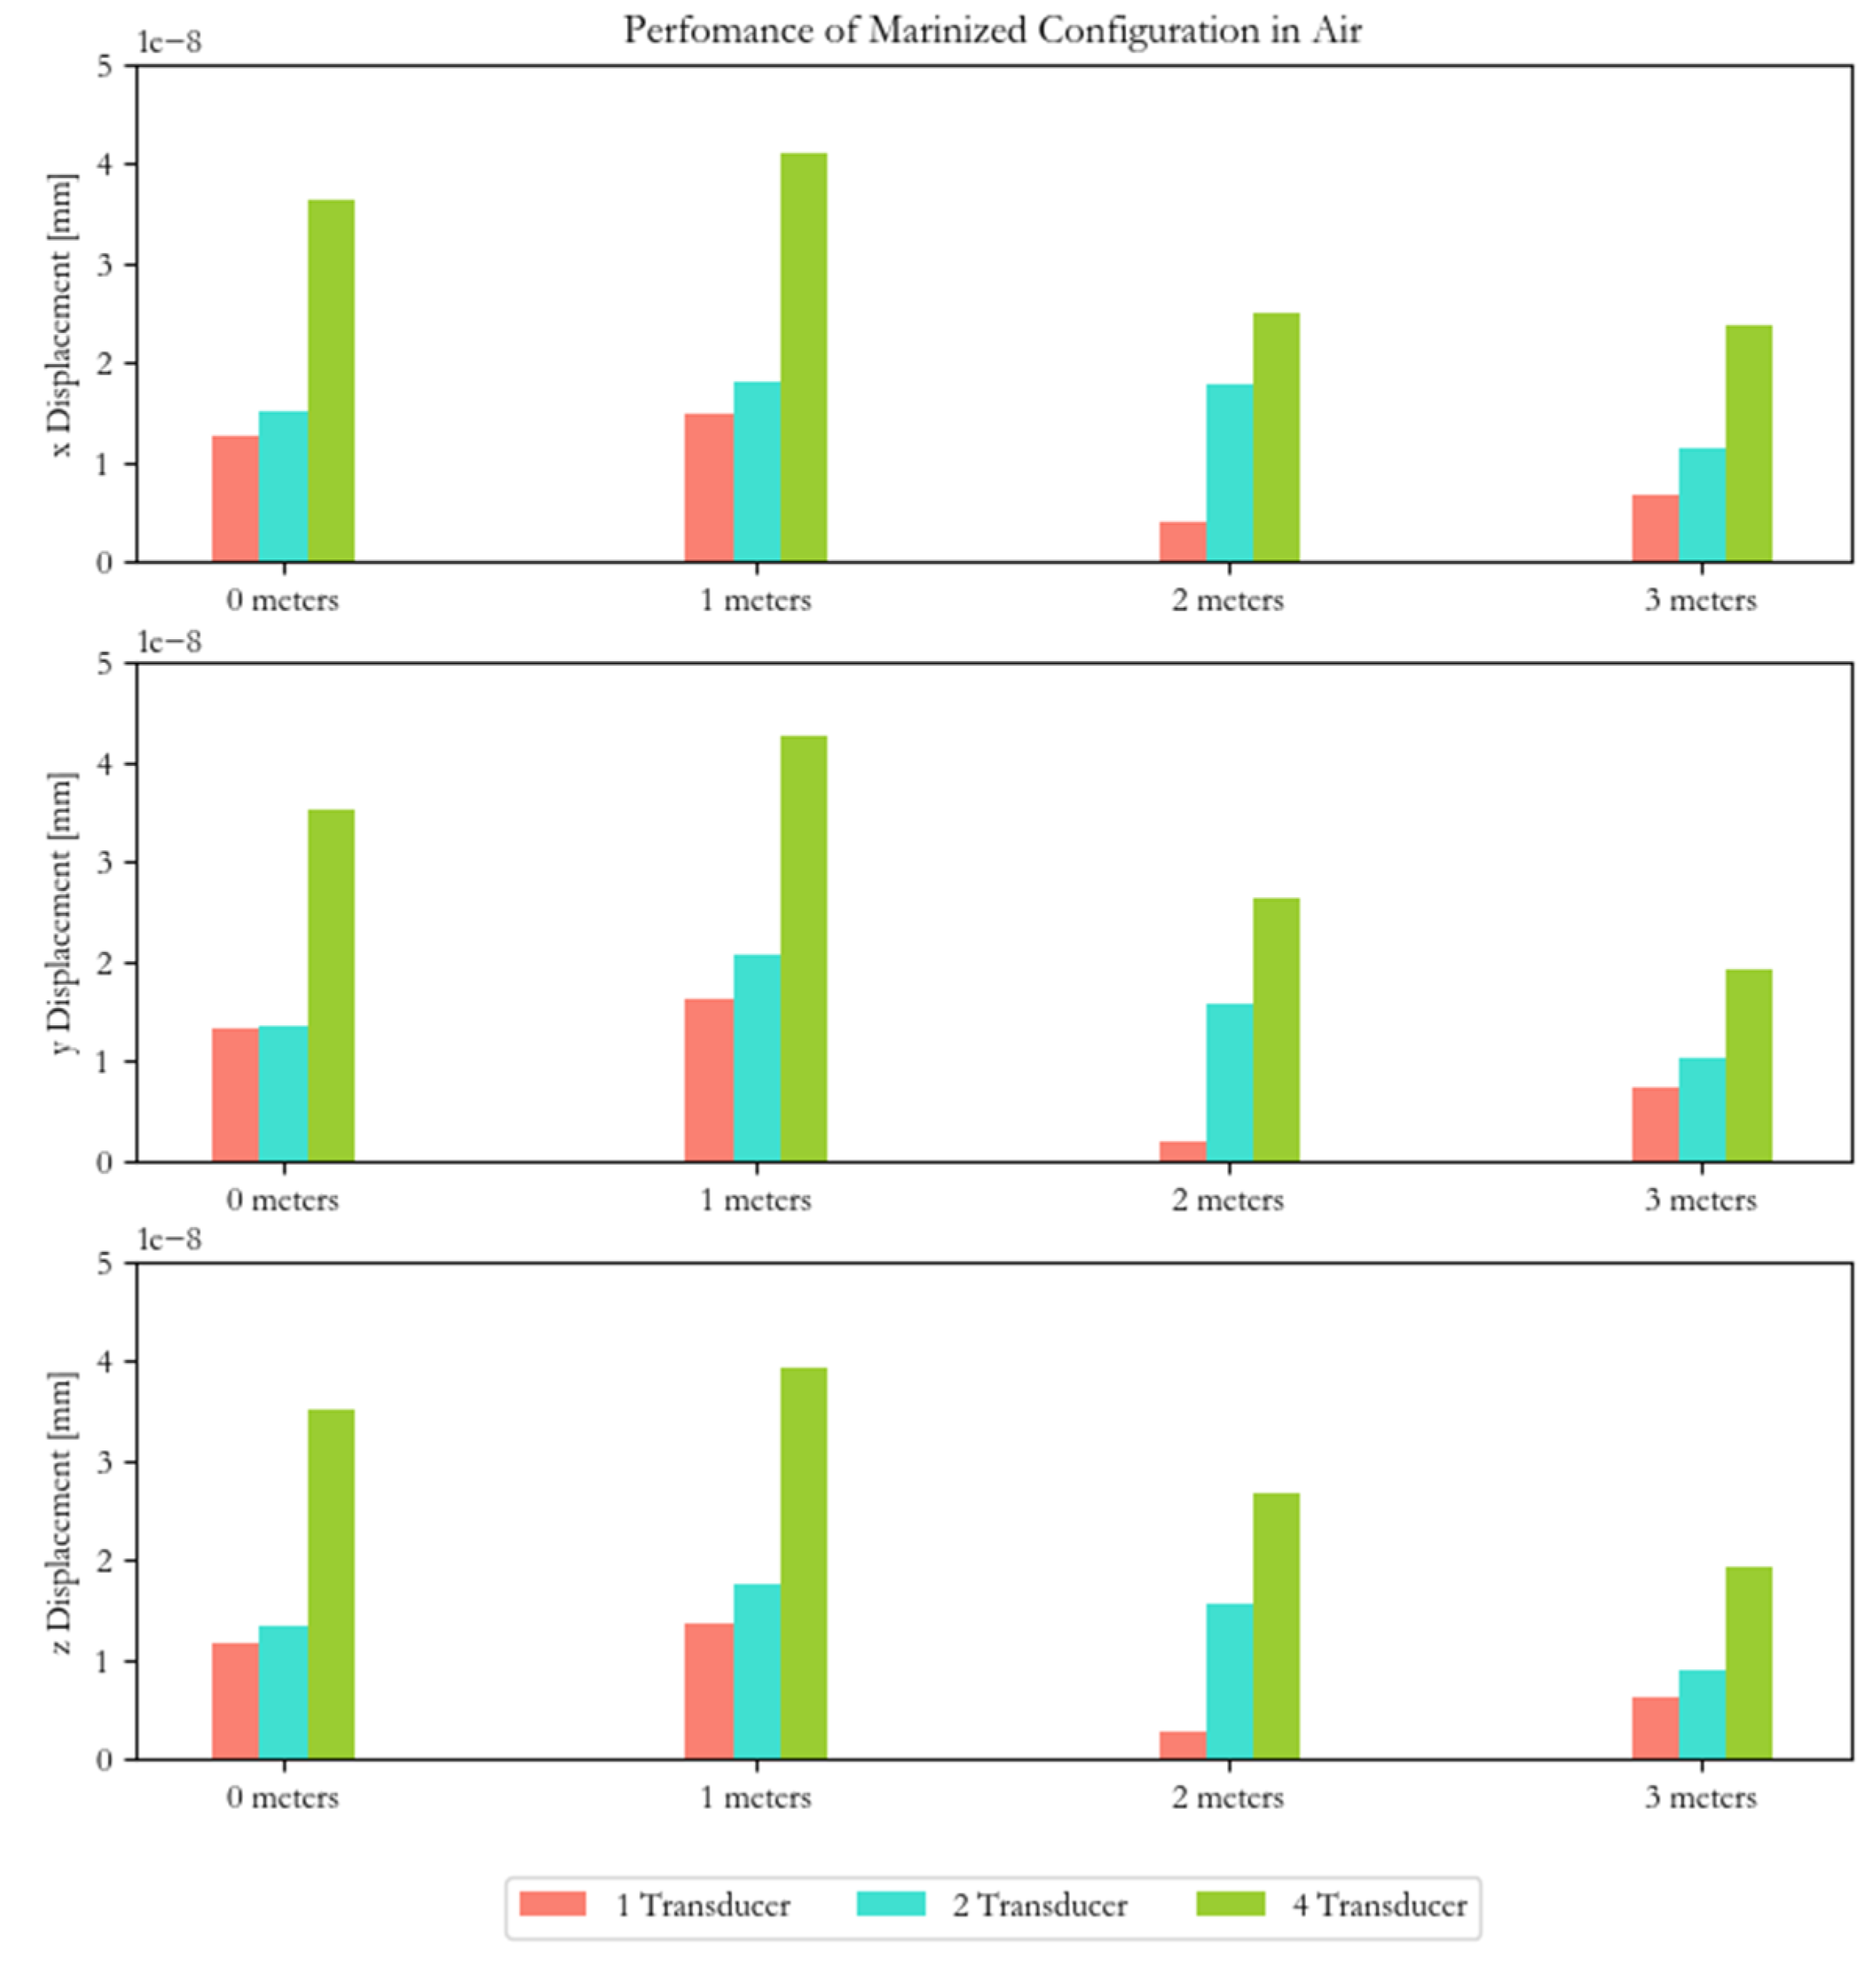
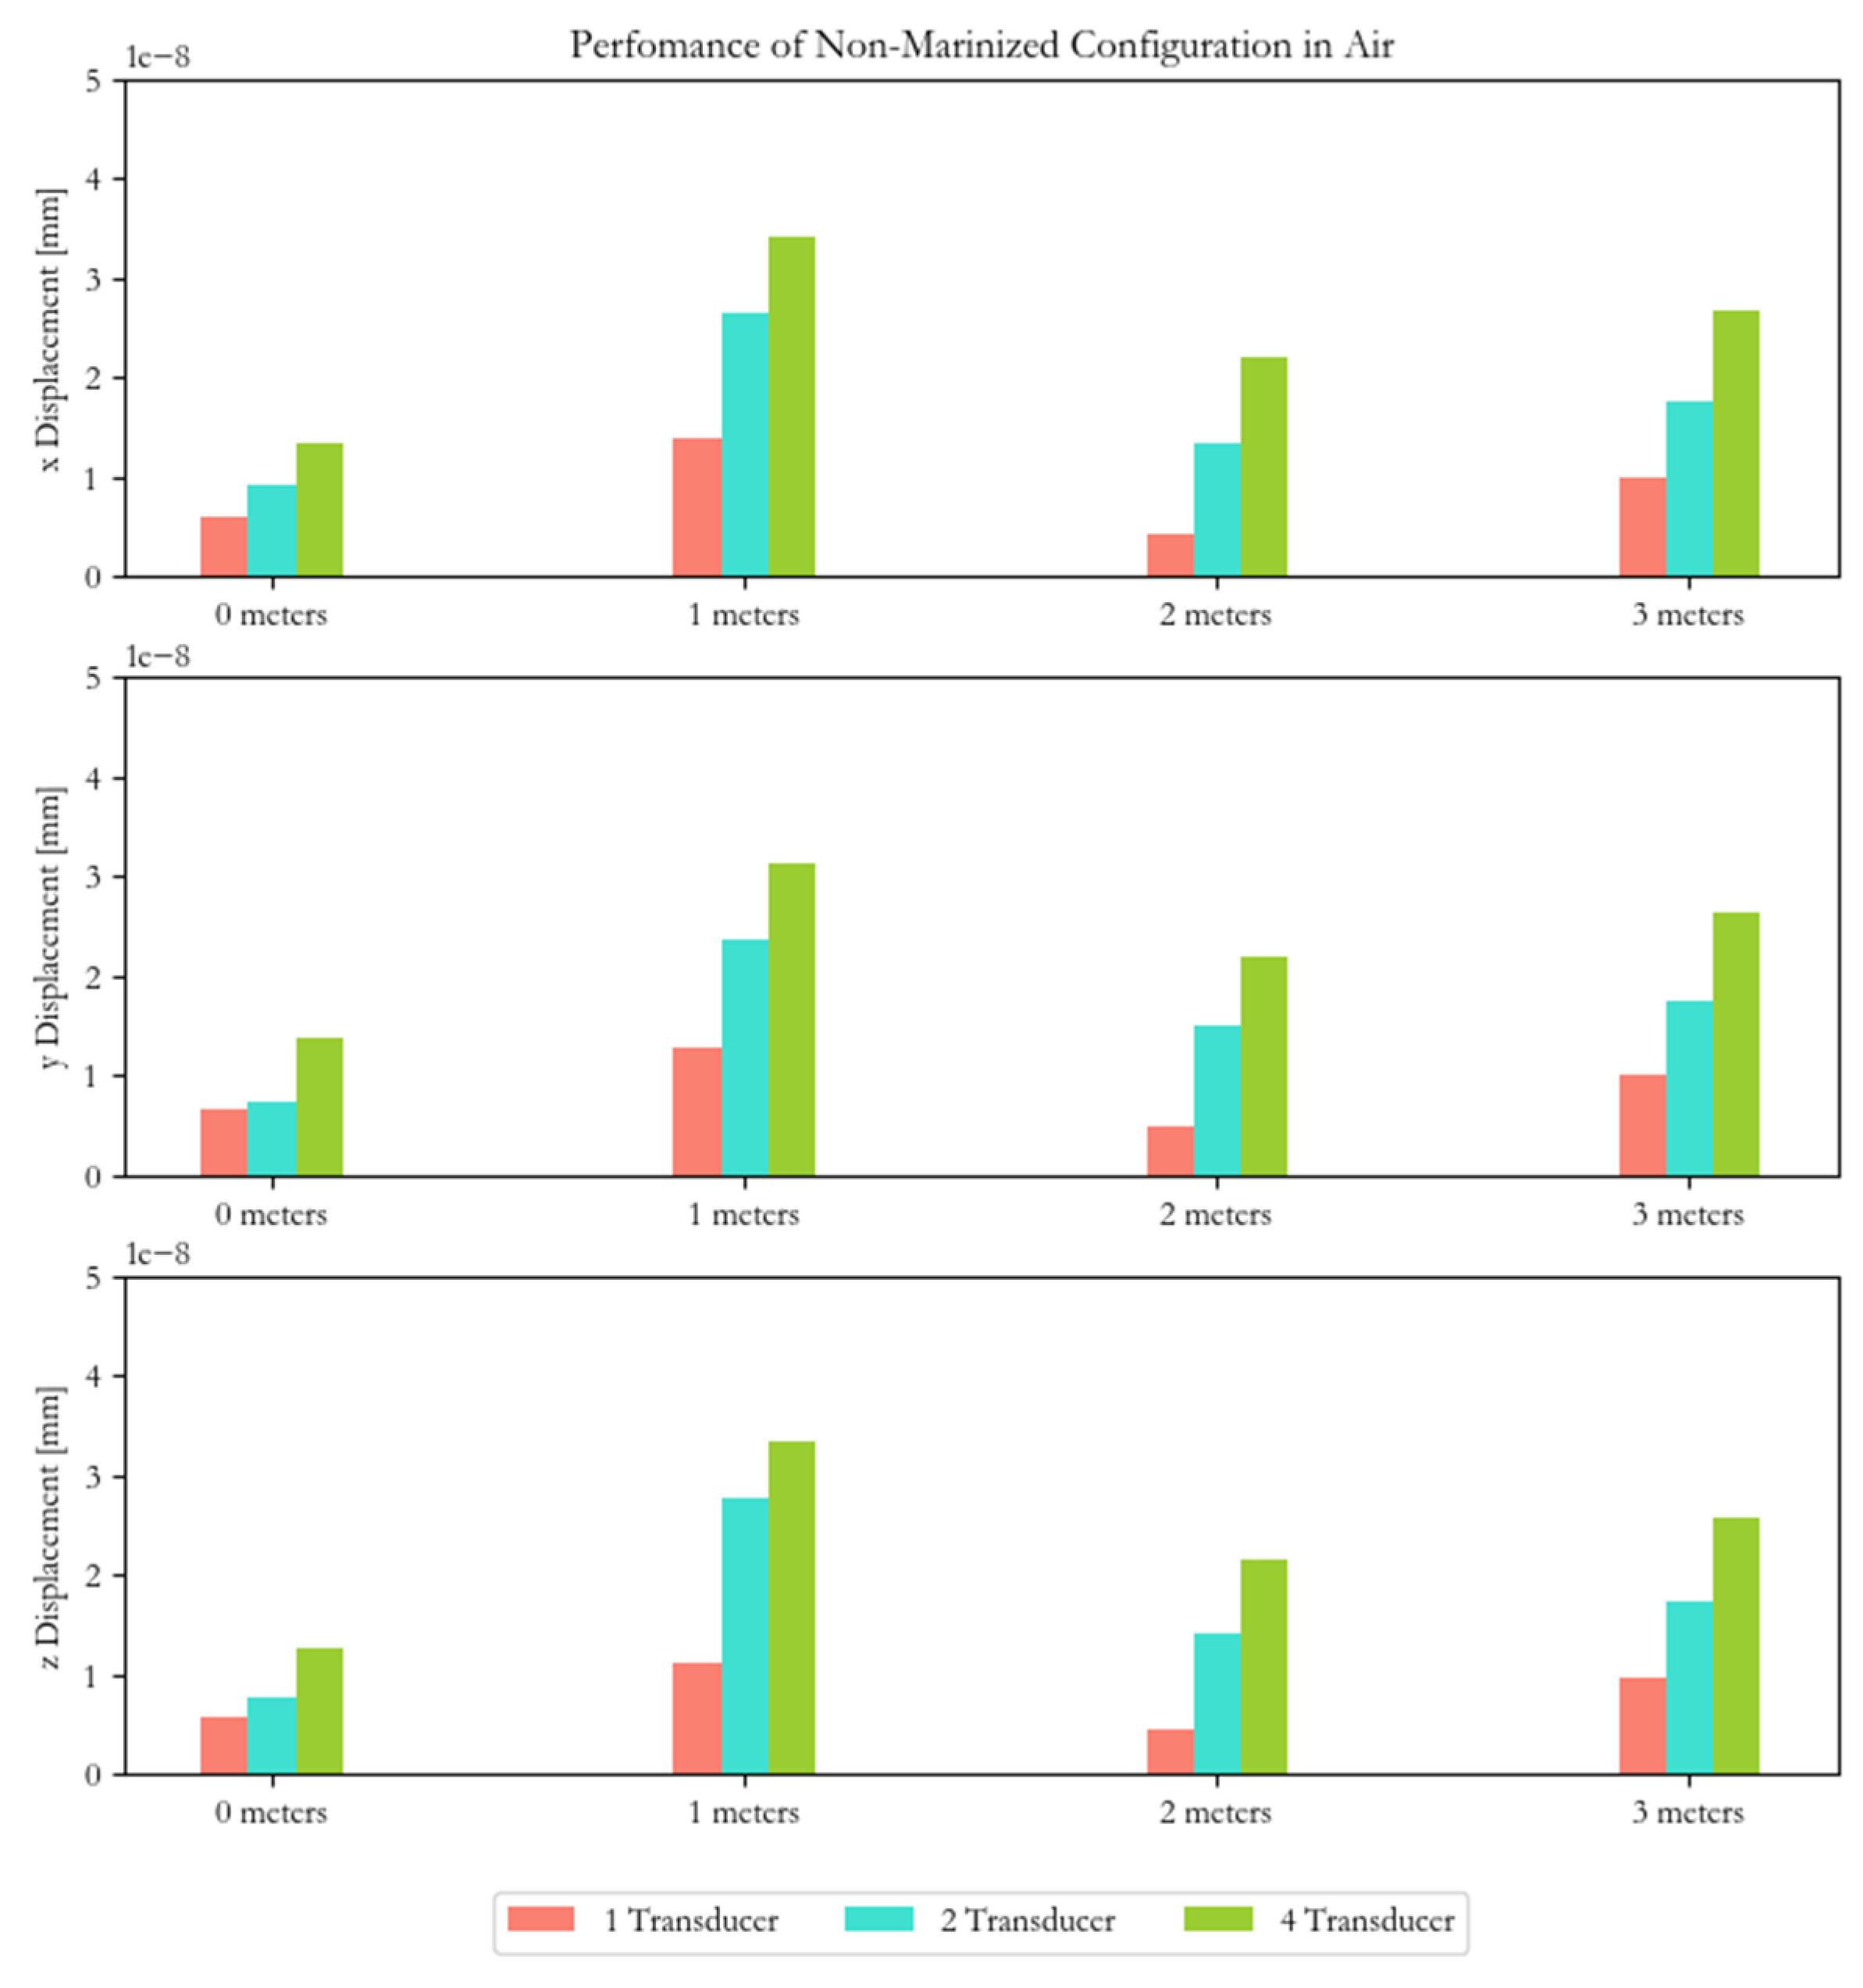
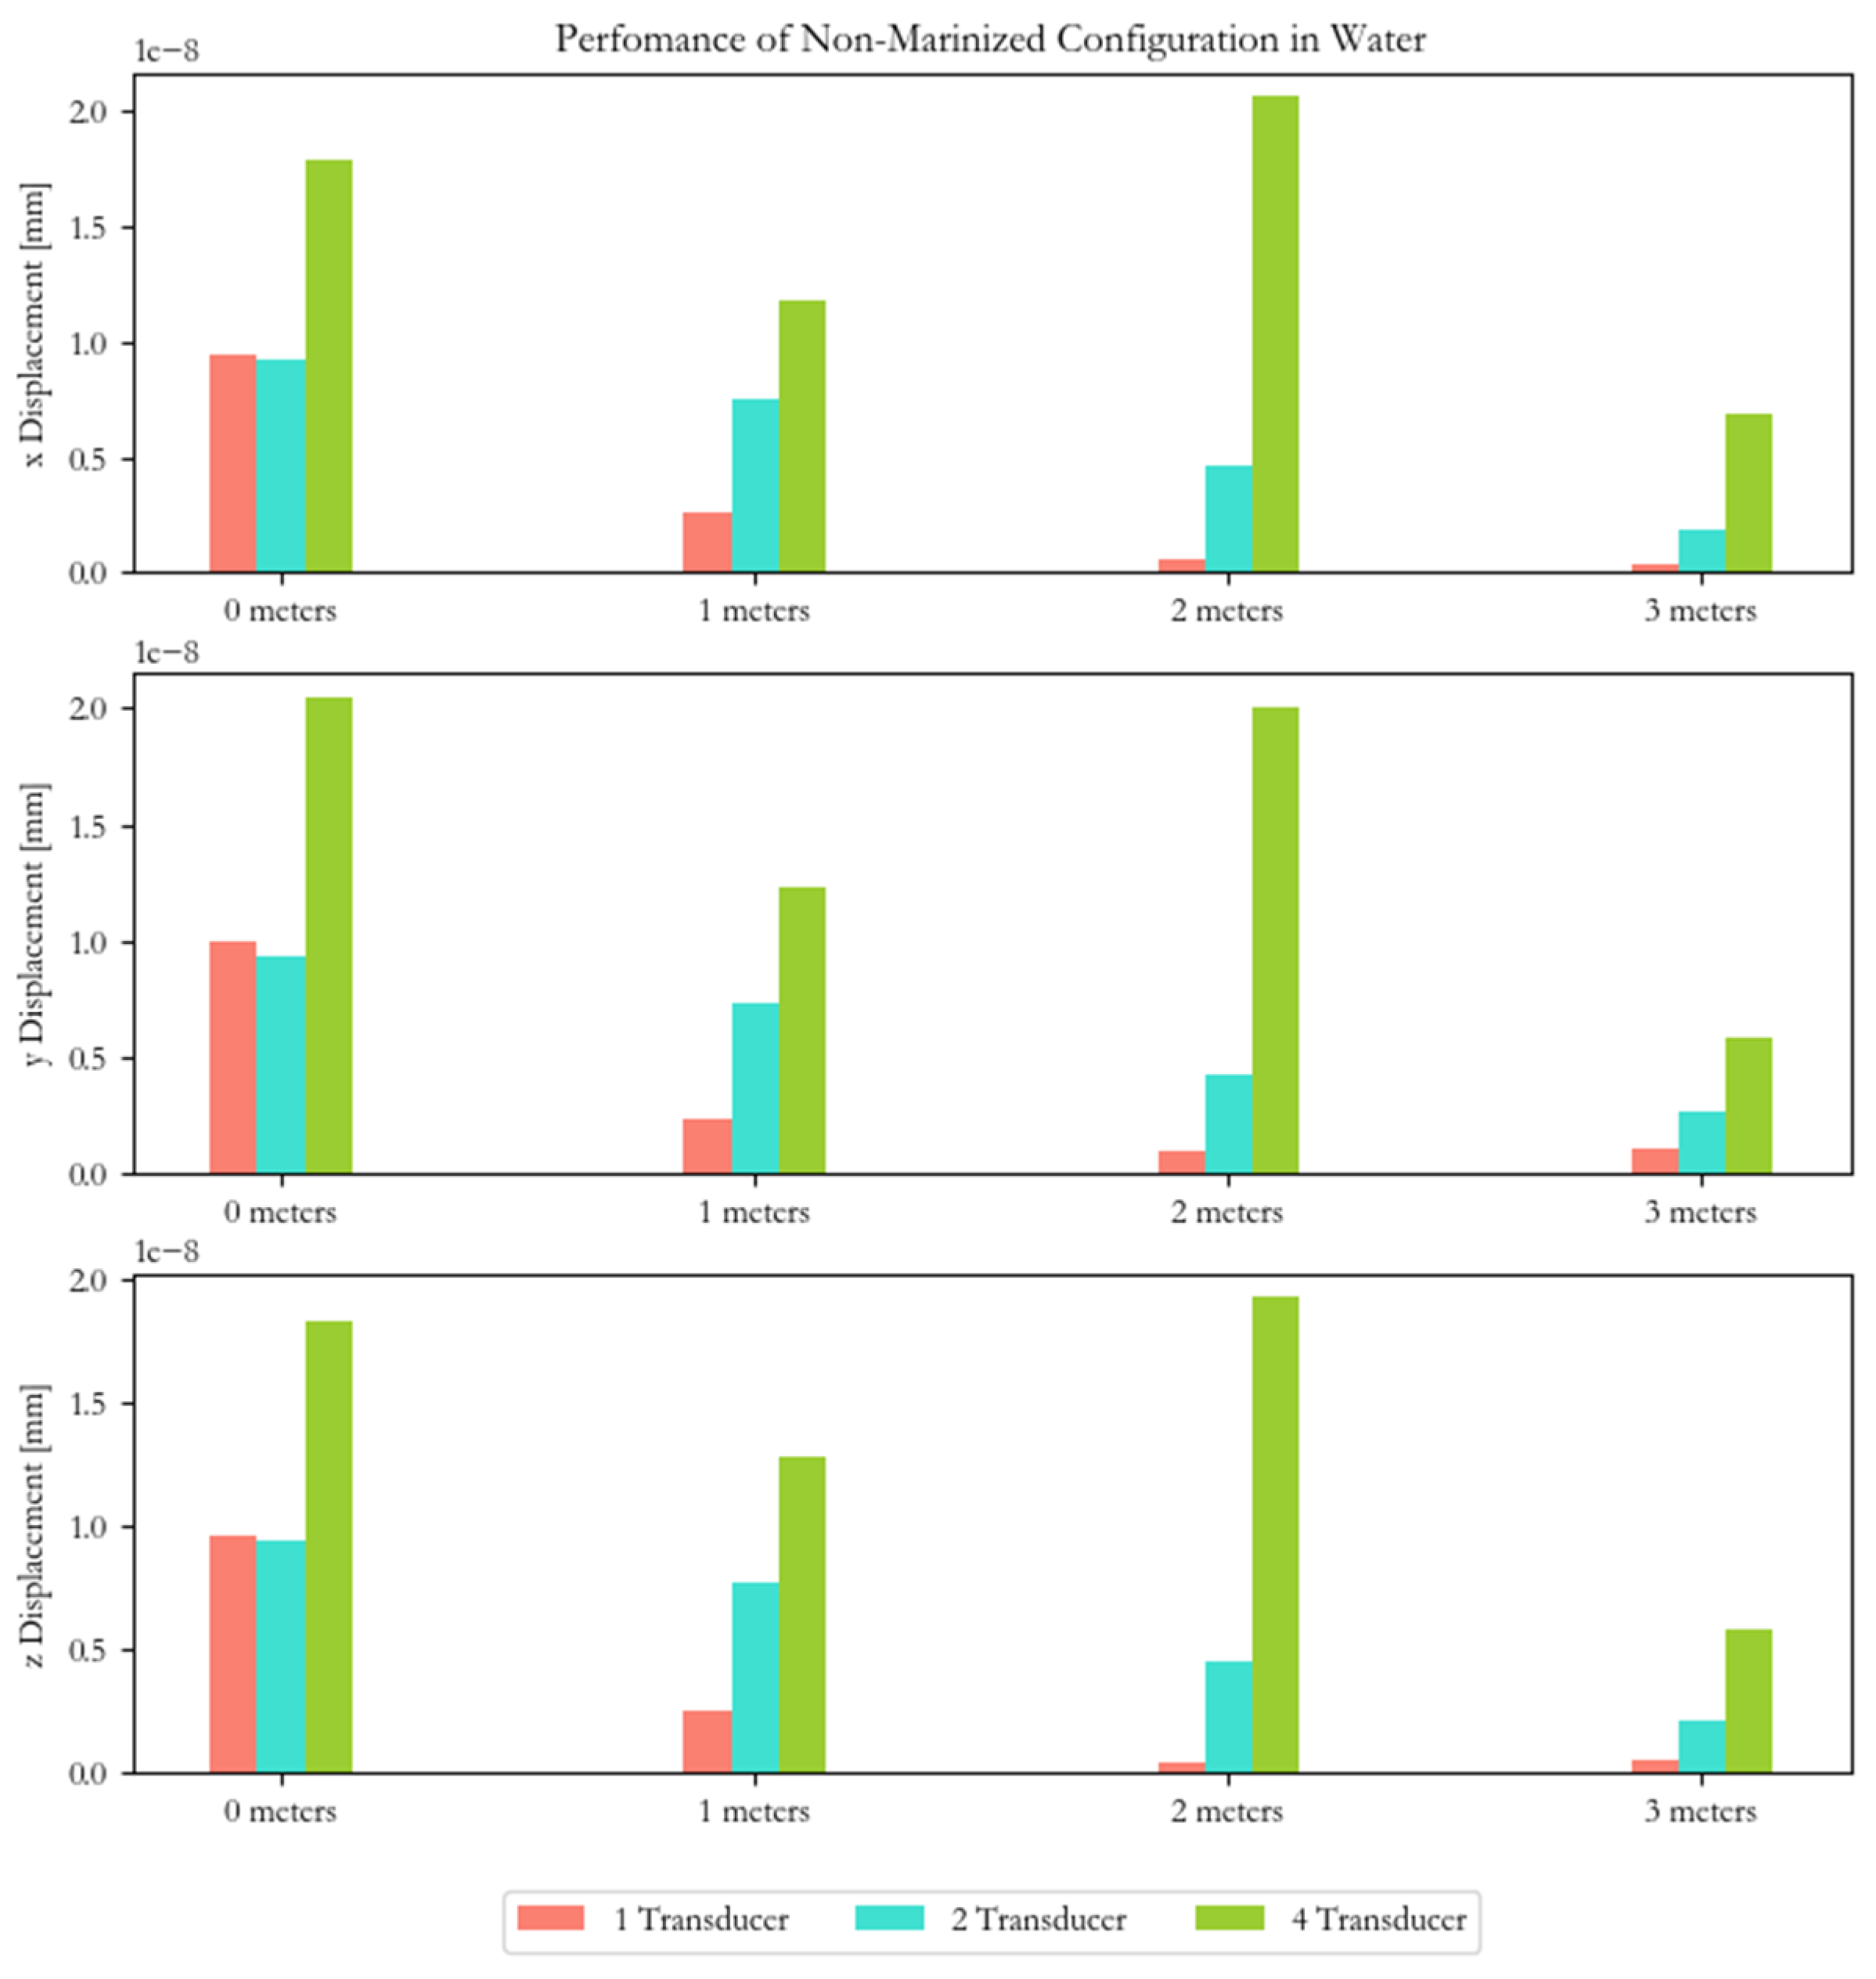
4. Transducer Array Validation
Results
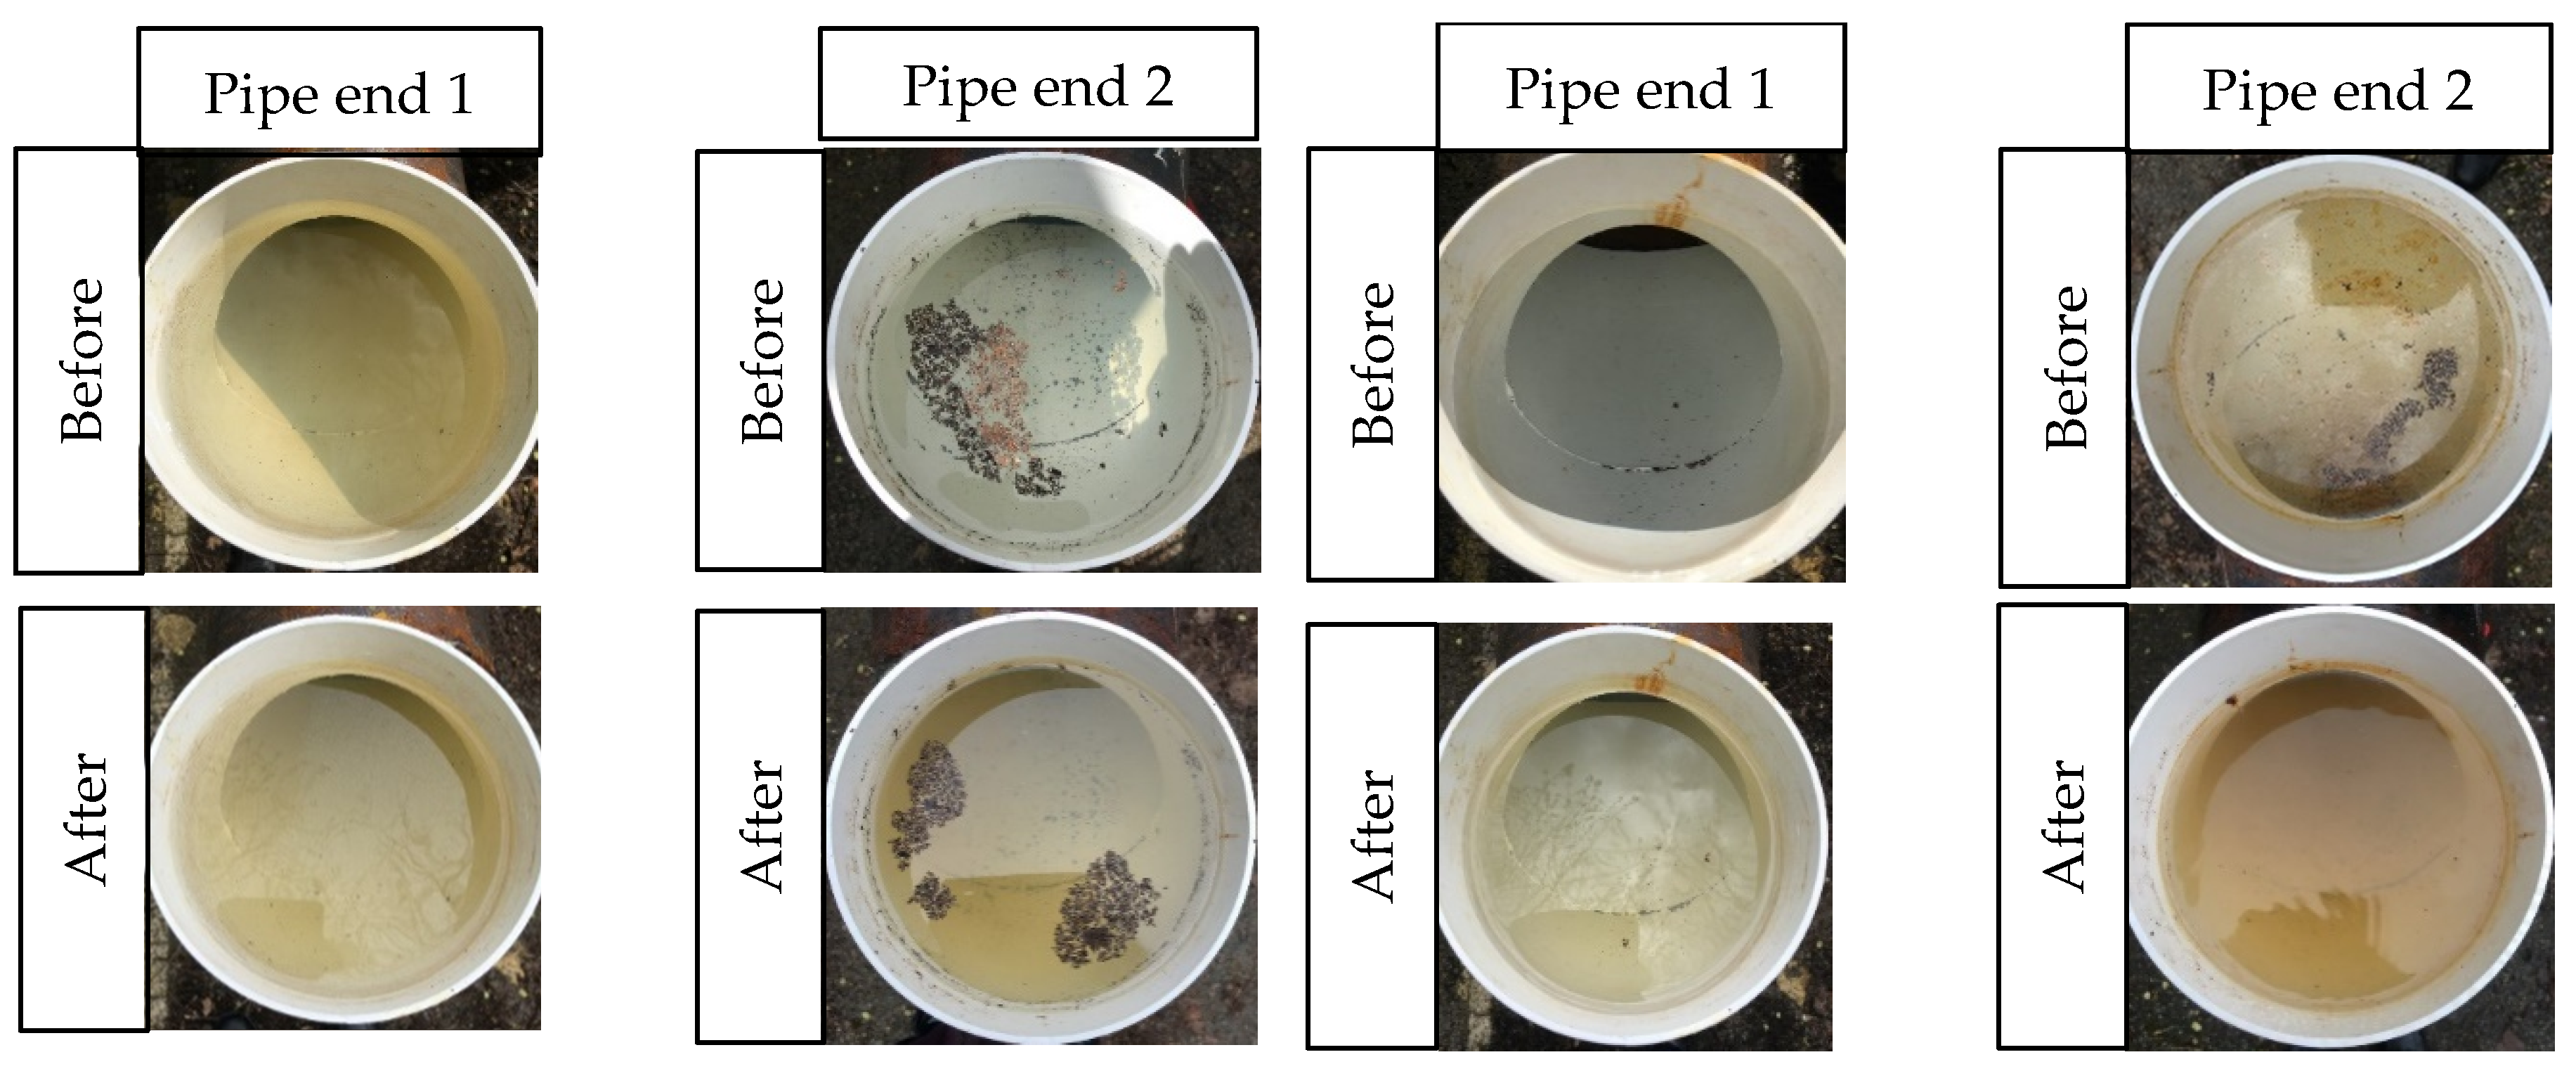
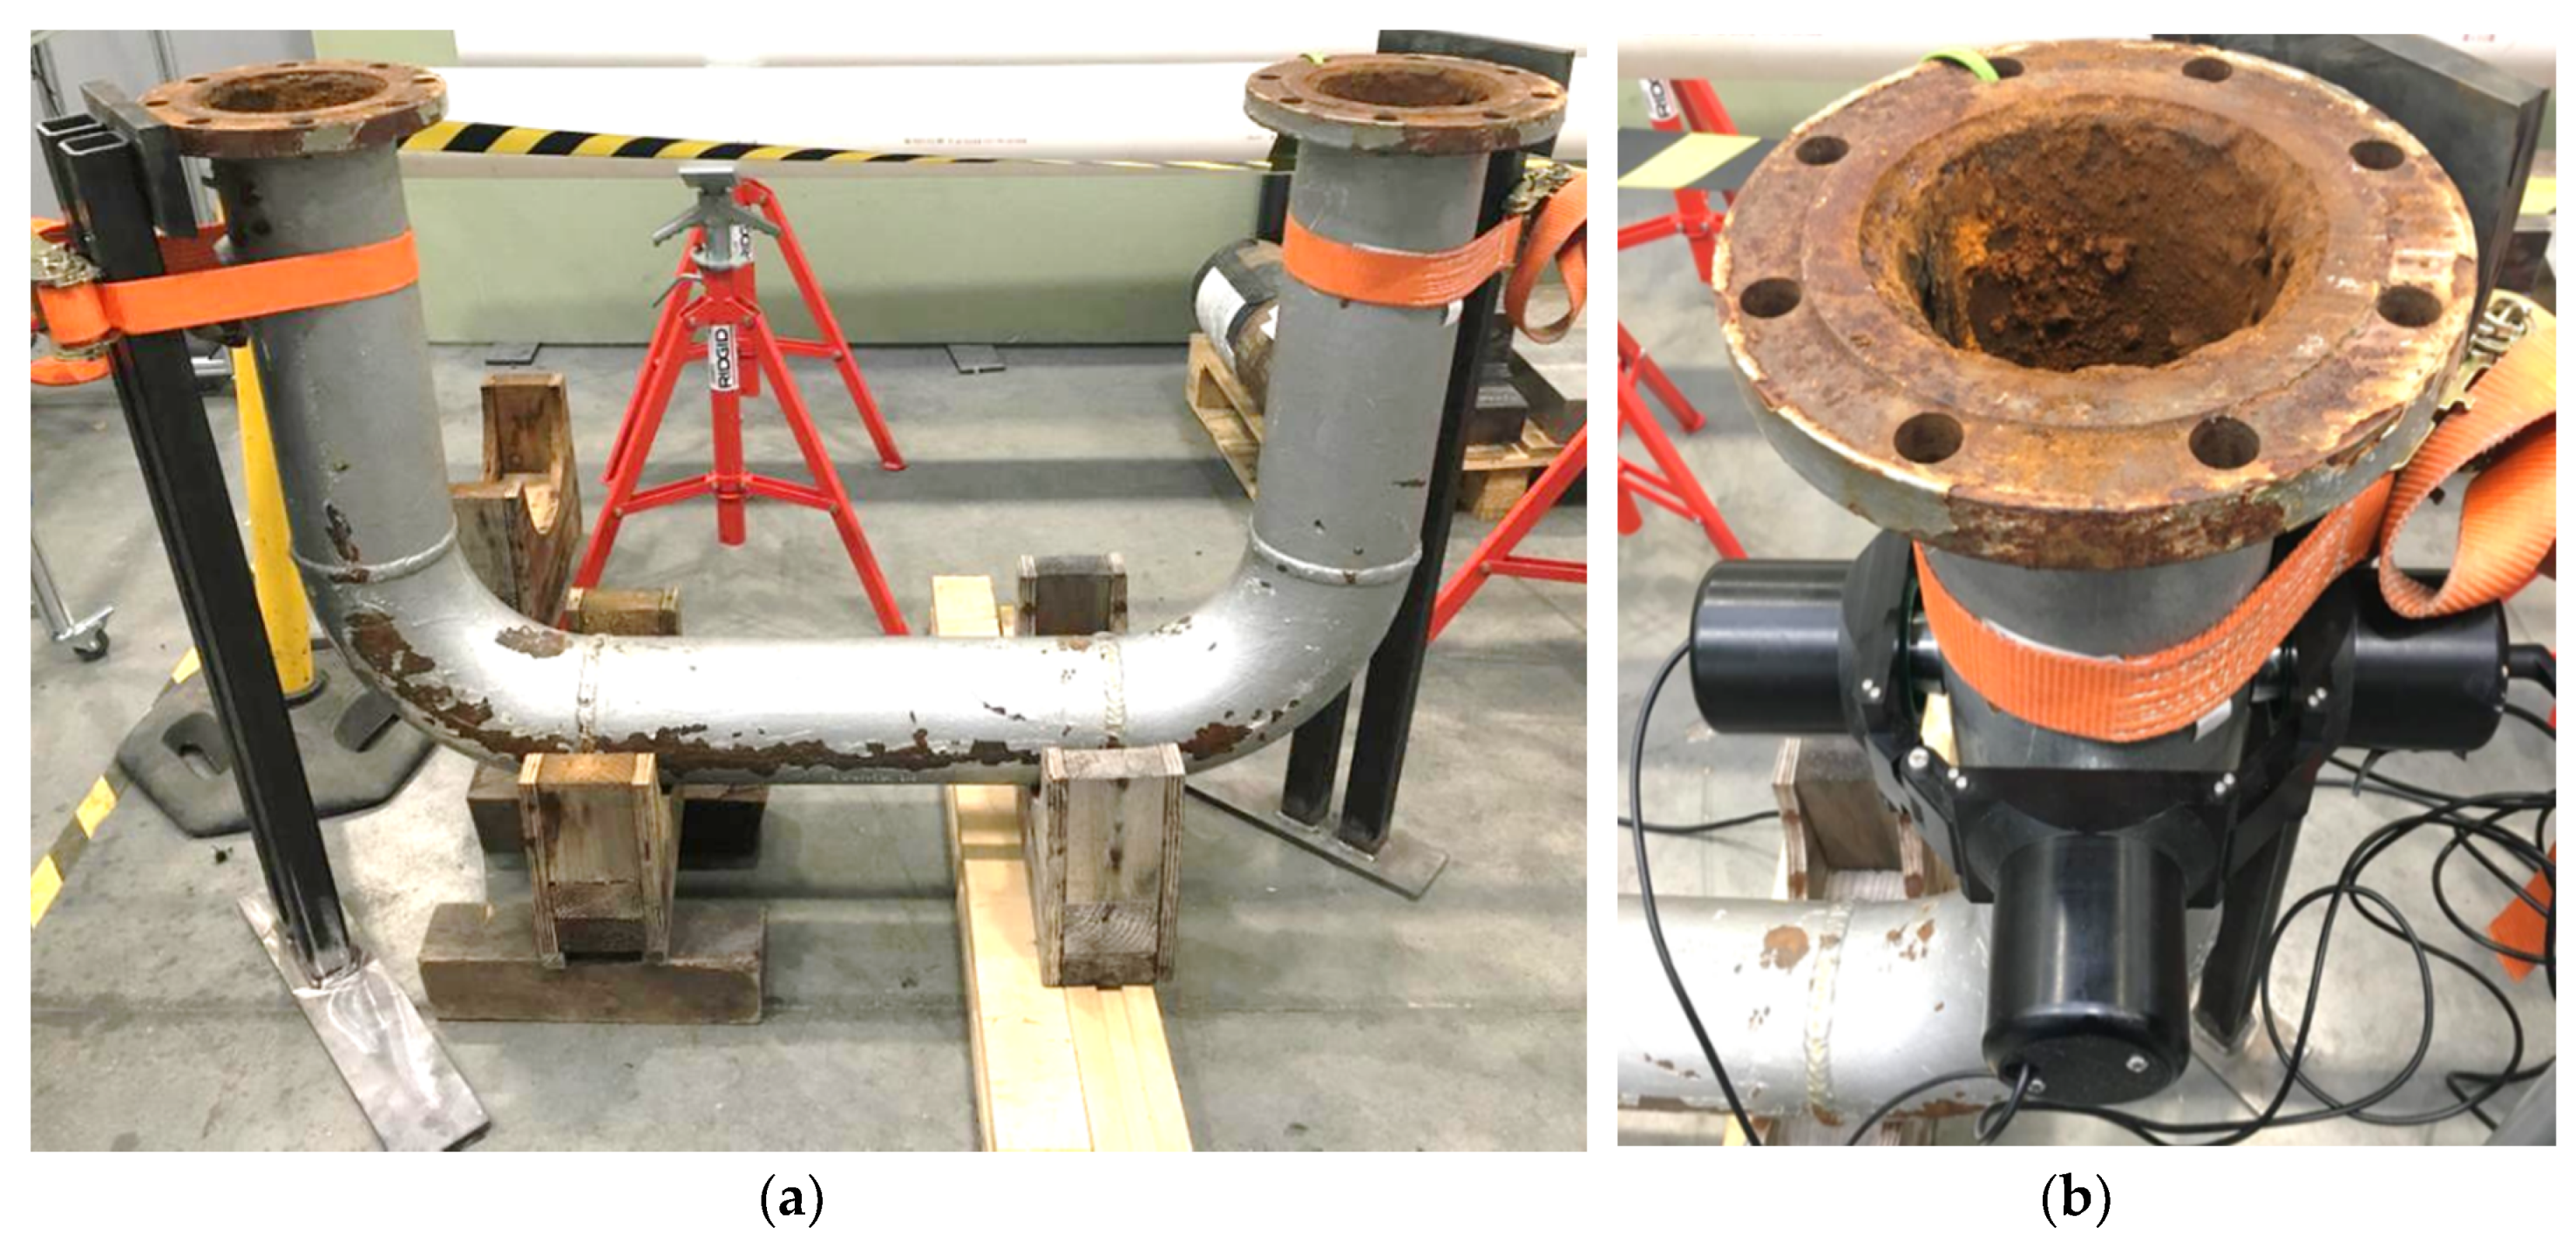
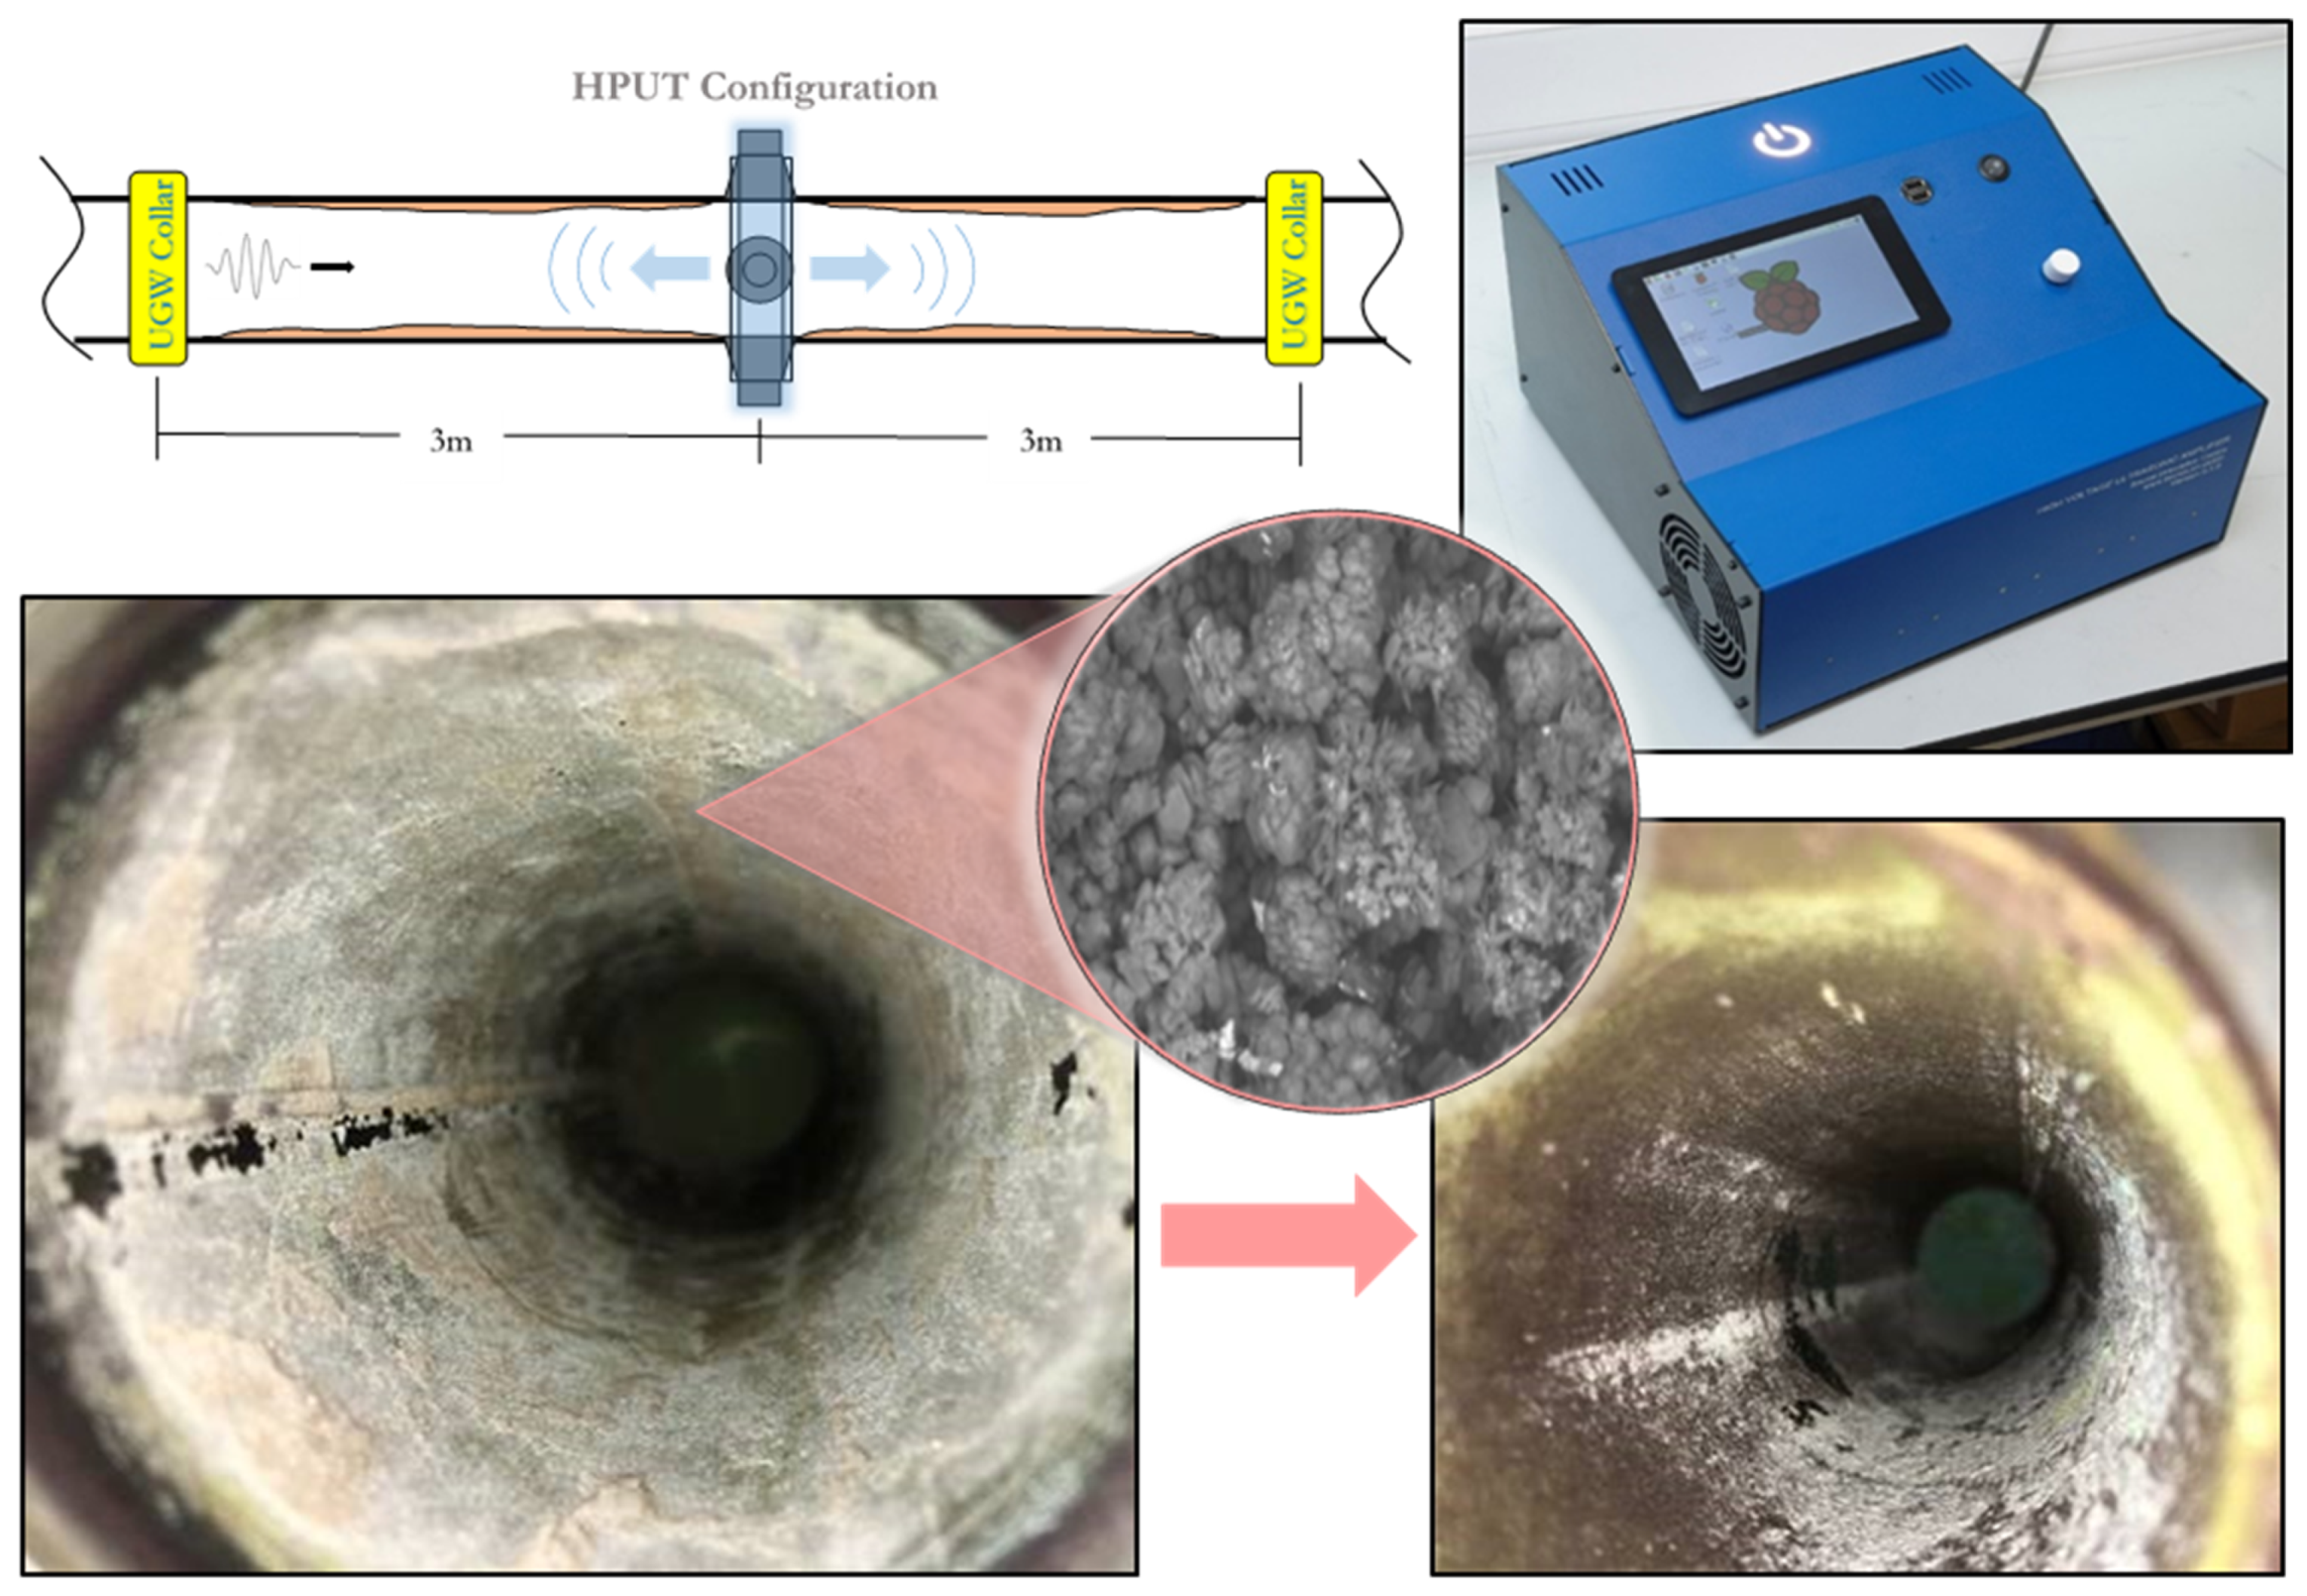
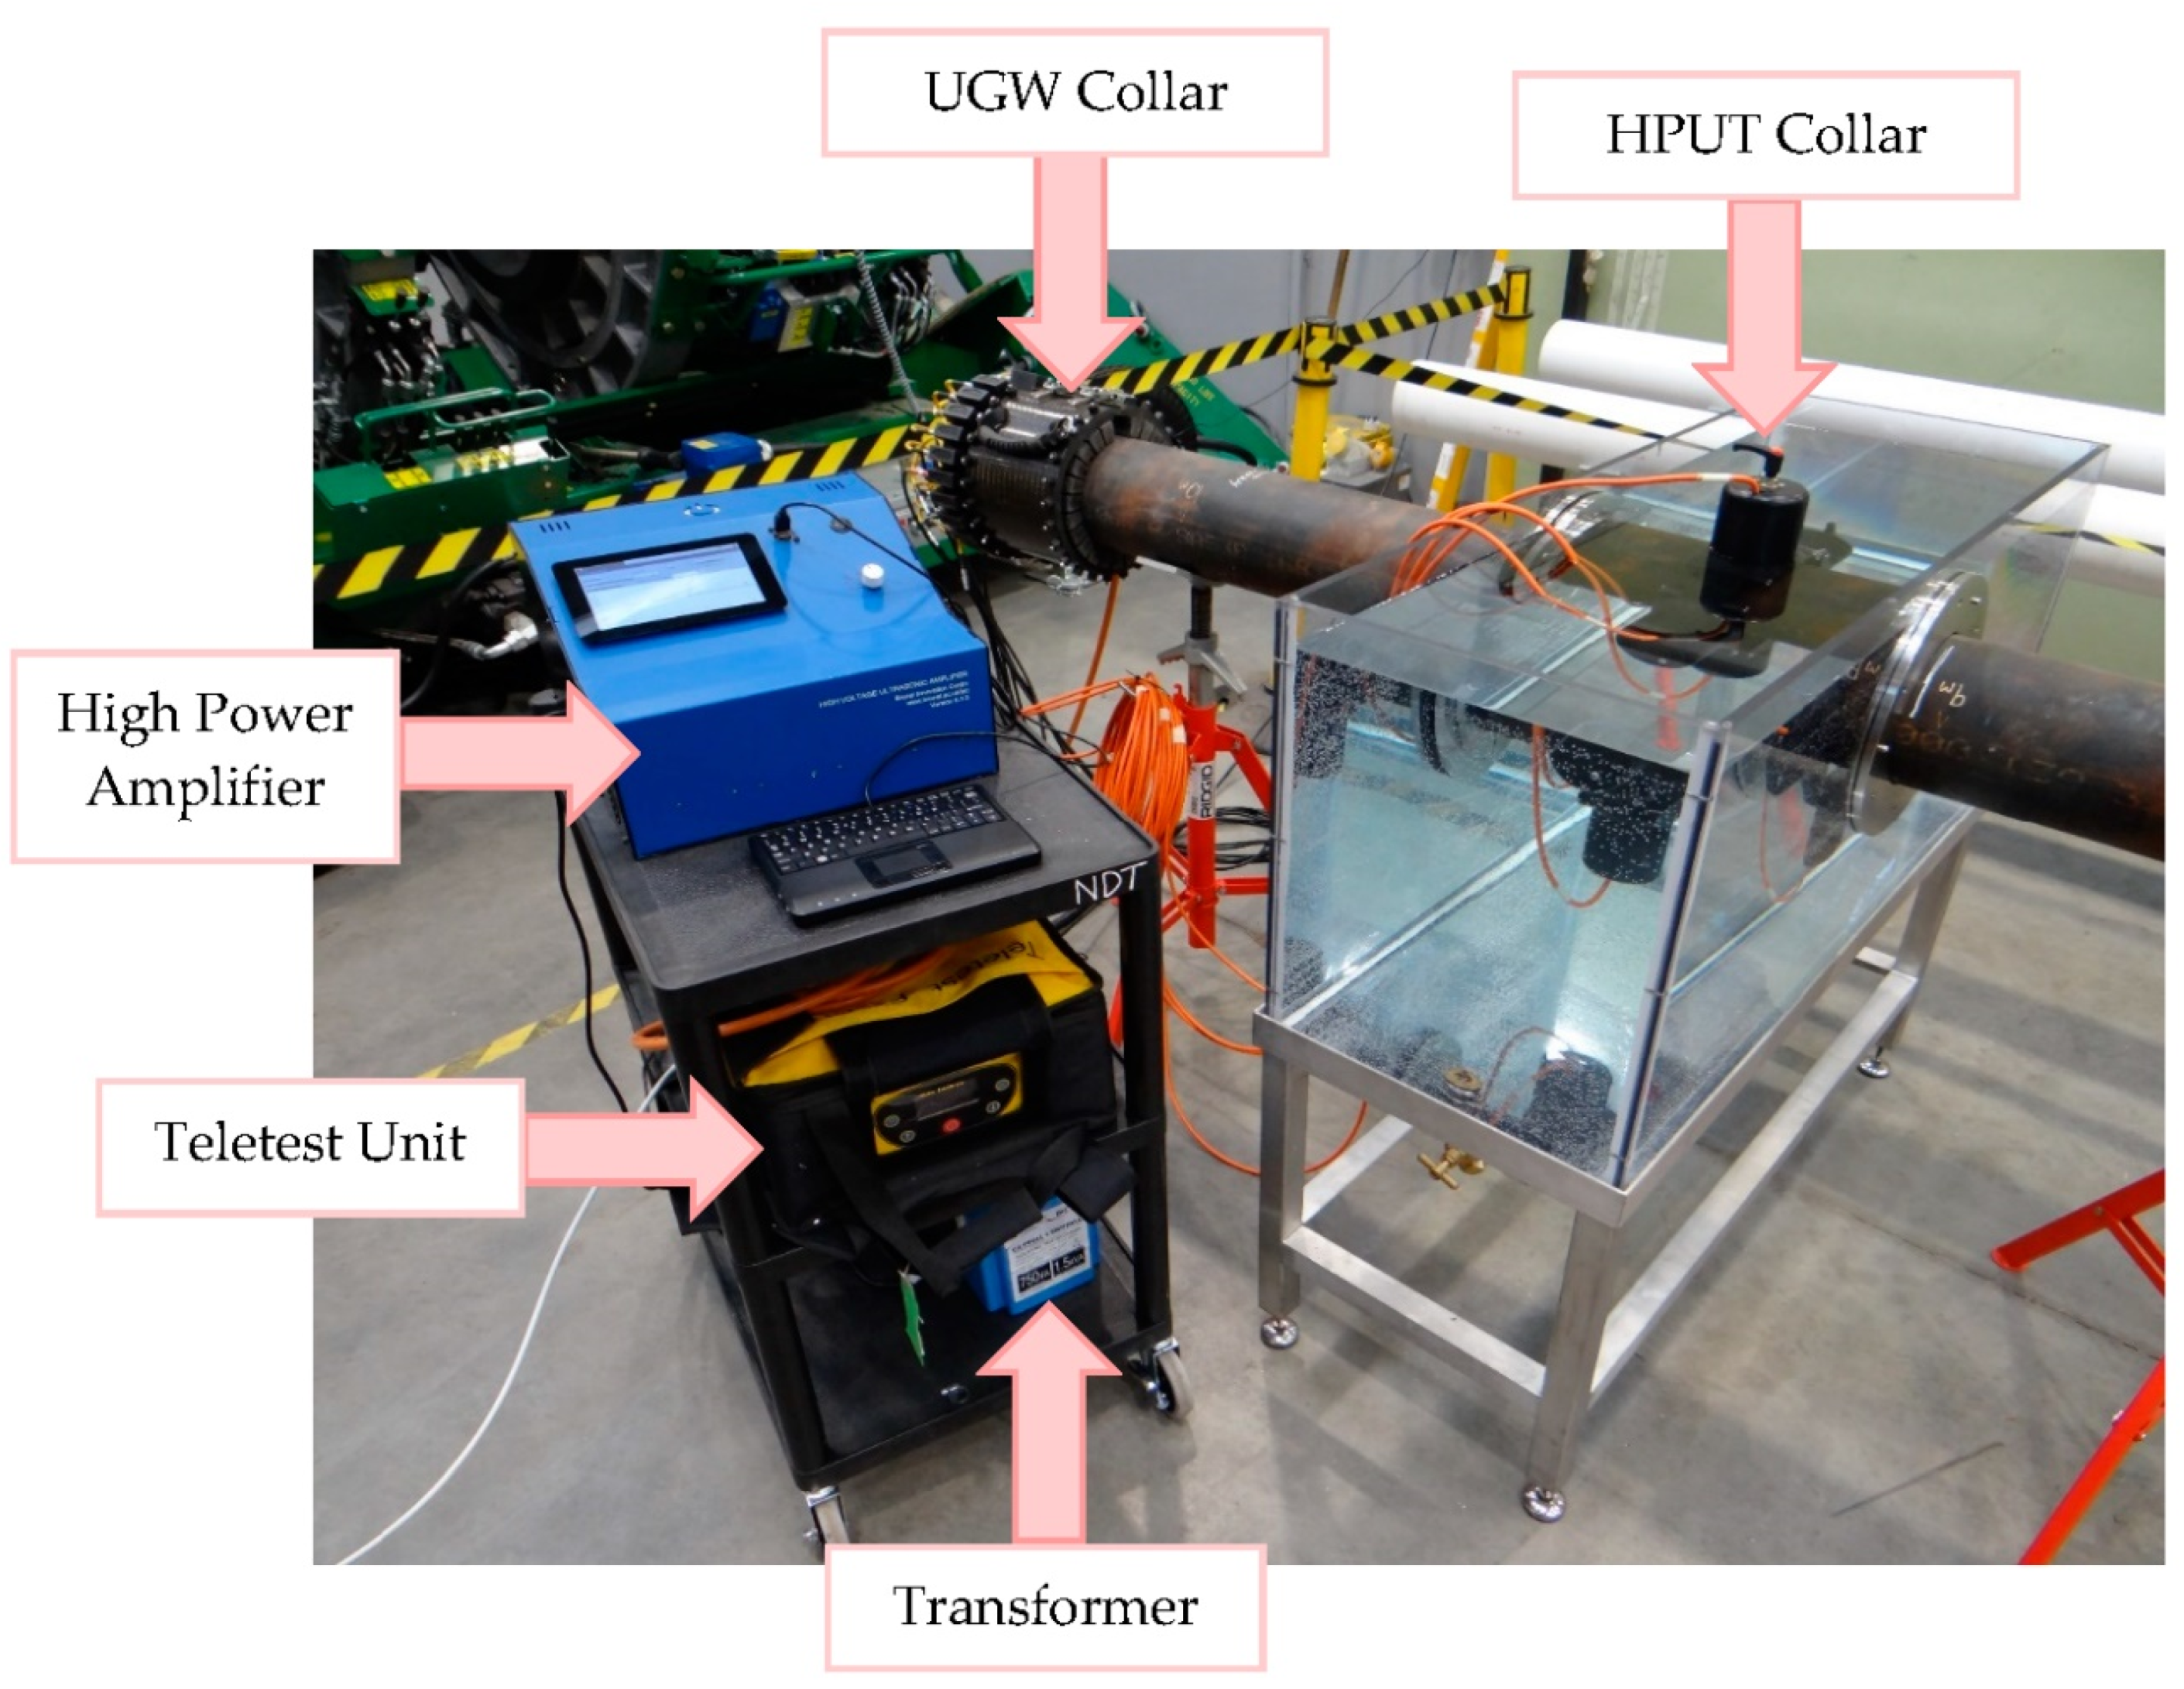
5. Field Trial
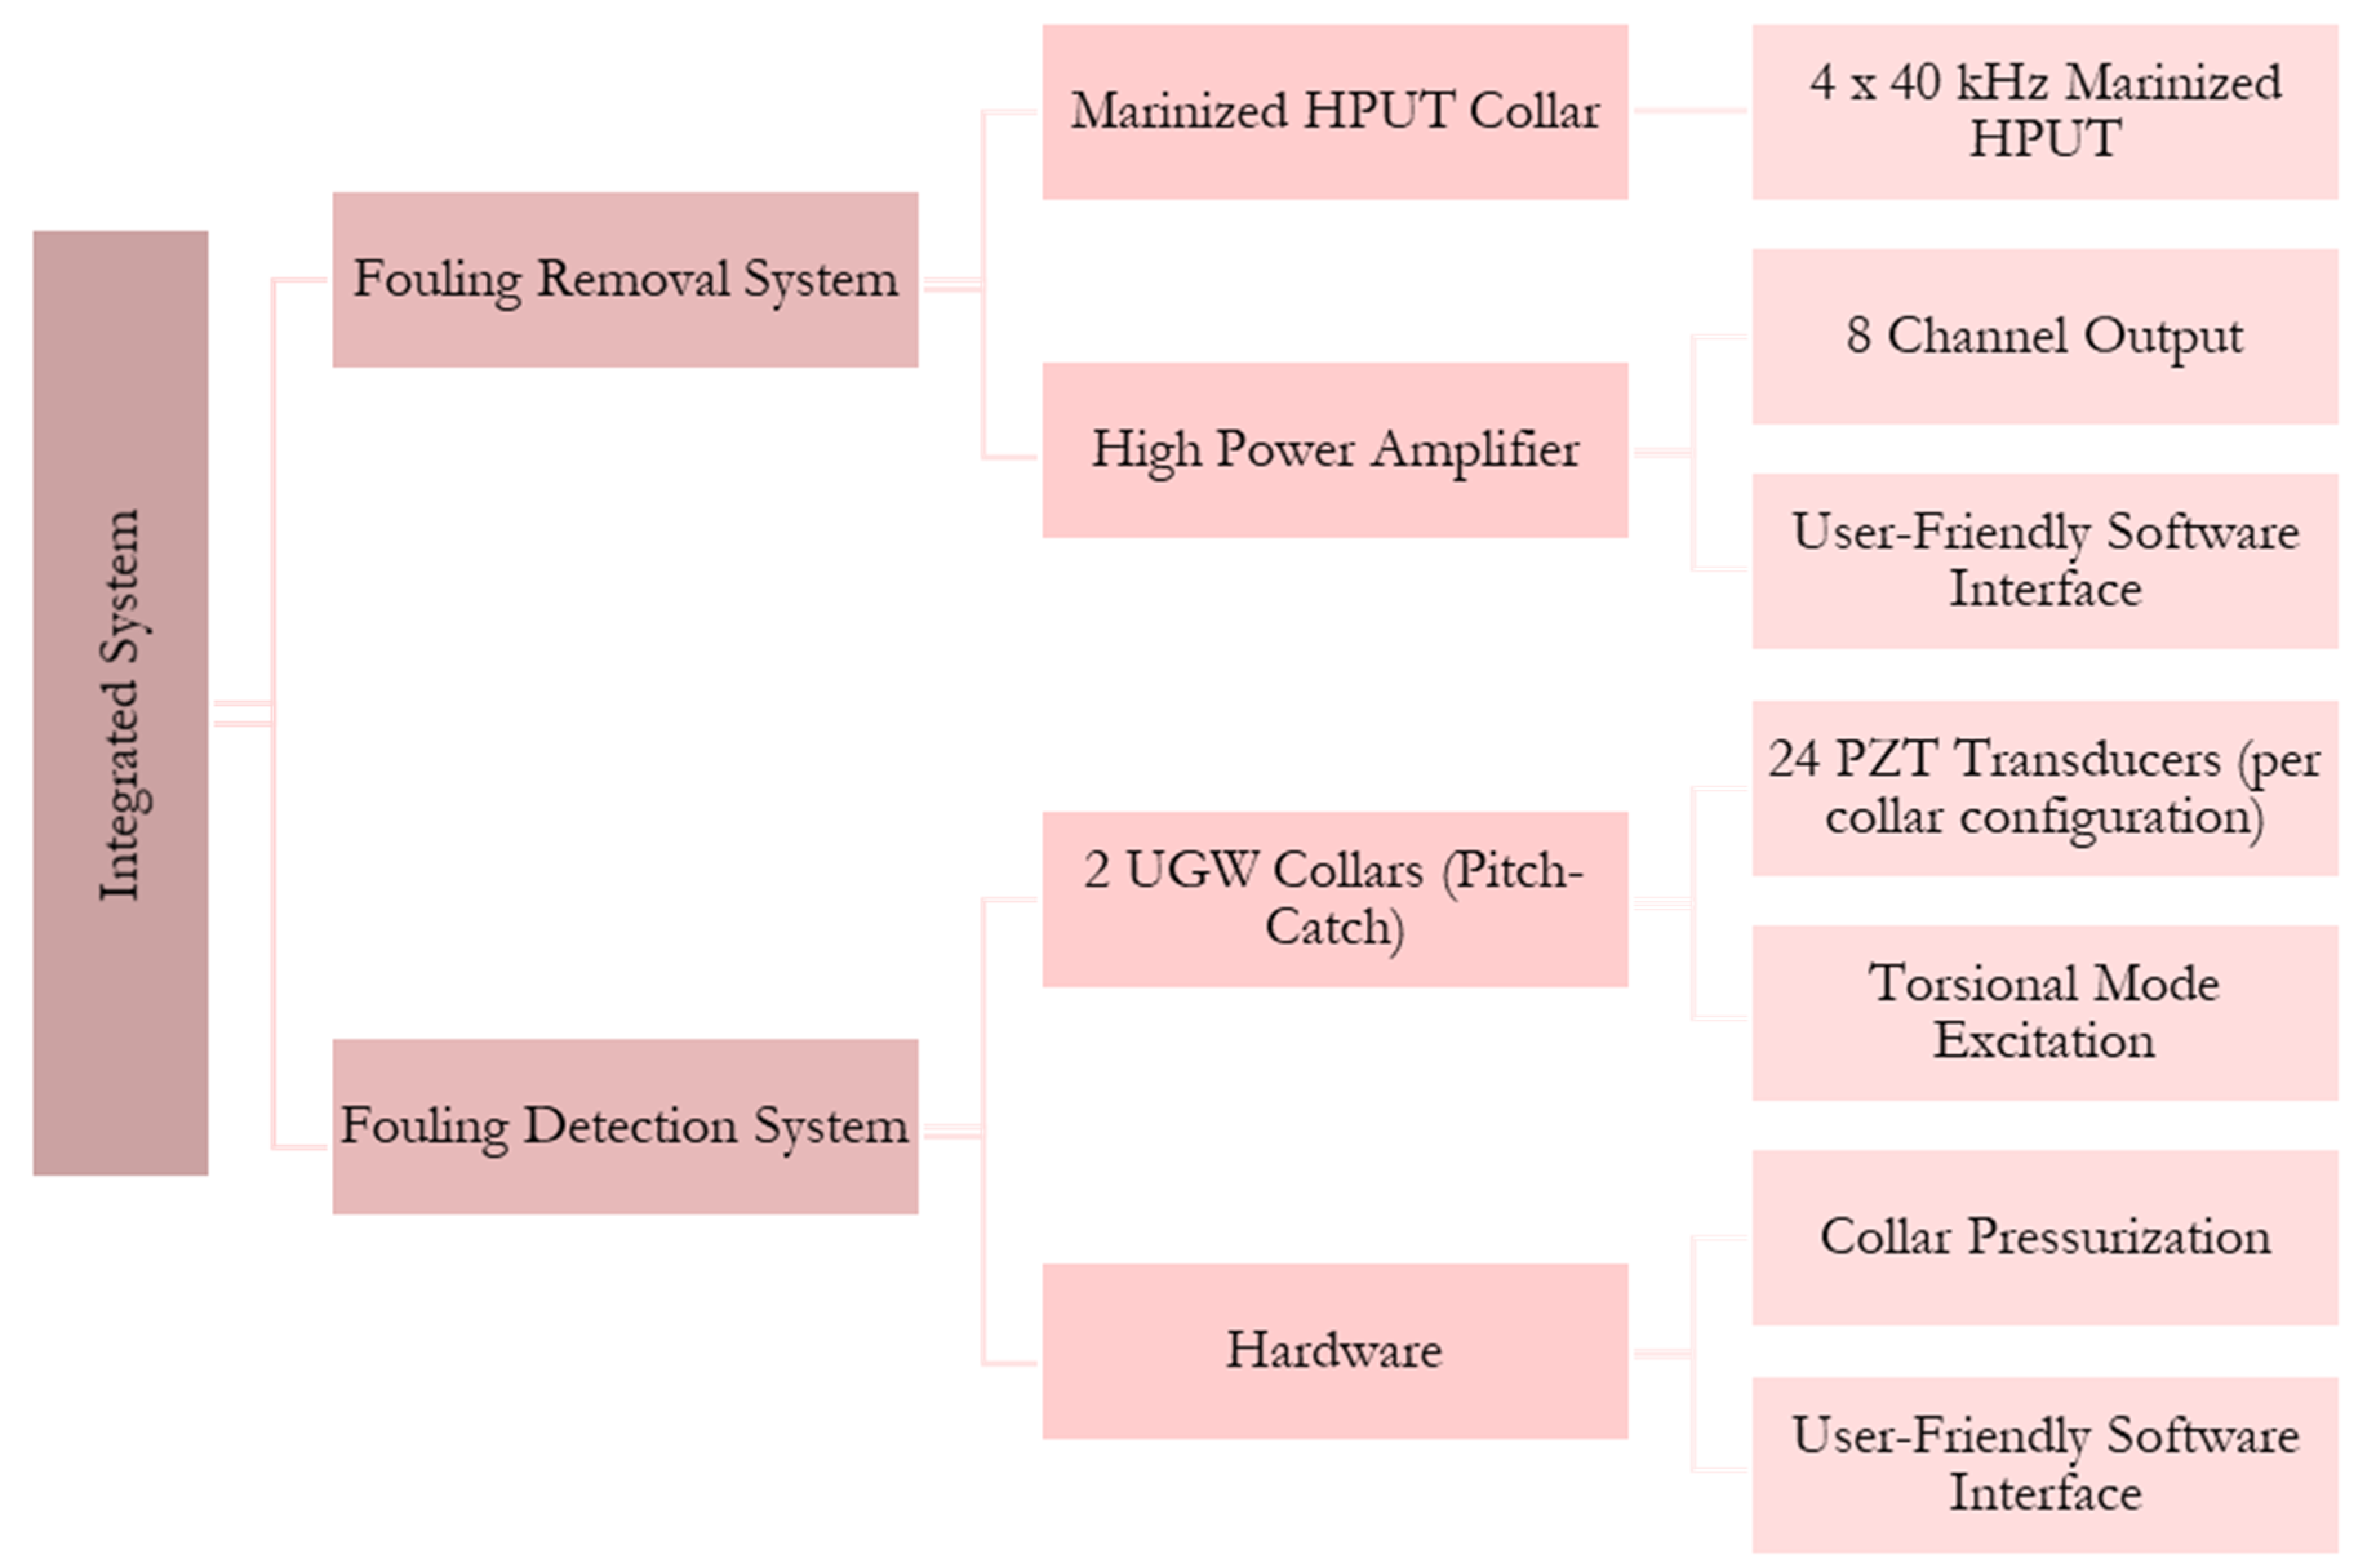
6. Complete System for Off-Shore Applications
7. Conclusions and Further Work
Underwater Demonstration
Author Contributions
Funding
Acknowledgments
Conflicts of Interest
References
- Creation of Stable and Transient Cavitation Bubbles. Available online: https://www.hielscher.com/wp-content/uploads/stable-transient-cavitation-Santos-et-al.-2009-opt.png (accessed on 25 January 2018).
- van der Werff, A.; BV, B.N. The Importance of Pipeline Cleaning: Risks, Gains, Benefits, Peace of Mind. In Proceedings of the Pipeline Technology Conference, Hannover, Germany, 25 April 2006. [Google Scholar]
- Standard Decommissioning Programme(s) Template. Available online: https://assets.publishing.service.gov.uk/government/uploads/system/uploads/attachment_data/file/760561/Non_Derogation_Decommissioning_Programme_Template_-_November_2018.pdf (accessed on 6 February 2019).
- UKCS Decommissioning 2018 Cost Estimate. Available online: https://www.ogauthority.co.uk/media/4999/decommissioning-a5-2018-pdf-version.pdf (accessed on 6 February 2019).
- Ilman, M. Kusmono. Analysis of internal corrosion in subsea oil pipeline. Case Stud. Eng. Fail. Anal. 2014, 2, 1–8. [Google Scholar] [CrossRef]
- Tawancy, H.; Al-Hadhrami, L.M.; Al-Yousef, F. Analysis of corroded elbow section of carbon steel piping system of an oil-gas separator vessel. Case Stud. Eng. Fail. Anal. 2013, 1, 6–14. [Google Scholar] [CrossRef]
- Li, S.; Grifoll, M.; Estrada, M.; Zheng, P.; Feng, H. Optimization on emergency materials dispatching considering the characteristics of integrated emergency response for large-scale marine oil spills. J. Mar. Sci. Eng. 2019, 7, 214. [Google Scholar] [CrossRef]
- Glater, J.; York, J.L.; Campbell, K.S. Scale Formation and Prevention; Academic Press: Cambridge, MA, USA, 1980; Volume 627. [Google Scholar]
- Tai, C.Y.; Chang, M.-C.; Shieh, R.-J.; Chen, T.G. Magnetic effects on crystal growth rate of calcite in a constant-composition environment. J. Cryst. Growth 2008, 310, 3690–3697. [Google Scholar] [CrossRef]
- Schoenbach, K.H.; Alden, R.W.; Fox, T.J. Biofouling prevention with pulsed electric fields. In Proceedings of the 1996 International Power Modulator Symposium, Boca Raton, FL, USA, 25–27 June 1996; pp. 75–78. [Google Scholar]
- Lais, H.; Lowe, P.; Gan, T.-H.; Wrobel, L.; Kanfoud, J. Characterization of the use of low frequency ultrasonic guided waves to detect fouling deposition in pipelines. Sensors 2018, 18, 2122. [Google Scholar] [CrossRef] [PubMed]
- Ocean Team Group, as. Available online:. Available online: http://www.oceanteam.eu/ (accessed on 14 March 2017).
- Lais, H.; Lowe, P.S.; Kanfoud, J.; Gan, T.-H. Application of High Power Ultrasonics for Fouling Removal in Submerged Structures. In Proceedings of the IEEE/MTS OCEANS 17 Conference, Aberdeen, UK, 19–22 June 2017. [Google Scholar]
- Lais, H.; Lowe, P.S.; Gan, T.-H.; Wrobel, L.C. Numerical modelling of acoustic pressure fields to optimize the ultrasonic cleaning technique for cylinders. Ultrason. Sonochem. 2018, 45, 7–16. [Google Scholar] [CrossRef] [PubMed]
- Lais, H.; Lowe, P.; Kanfoud, J.; Gan, T.-H. Advancements in fouling removal using high power ultrasonics for industrial applications. In Proceedings of the IEEE International Conference on Industrial and Information Systems (ICIIS), Peradeniya, Sri Lanka, 15–16 December 2017; pp. 1–6. [Google Scholar]
- Lais, H.; Lowe, P.S.; Gan, T.-H.; Wrobel, L.C. Numerical investigation of design parameters for optimization of the in-situ ultrasonic fouling removal technique for pipelines. Ultrason. Sonochem. 2019, 56, 94–104. [Google Scholar] [CrossRef] [PubMed]
- STS Defence. Available online: https://www.sts-defence.com/ (accessed on 7 August 2019).
- 4294A Precision Impedance Analyzer. Available online: https://www.keysight.com/gb/en/home.html (accessed on 18 May 2019).
- Brunel Innovation Centre. Available online: https://www.brunel.ac.uk/bic (accessed on 4 August 2019).
- InnoTecUK. Available online: https://www.innotecuk.com (accessed on 4 August 2019).
- Polytec CLV-3D Laser Vibrometer. Available online: https://www.polytec.com/uk/ (accessed on 18 May 2019).
- ESSAR. Available online: https://www.essar.com/ (accessed on 4 August 2019).
- Teletest Focus+. Available online: https://www.teletestndt.com/focus-guided-wave-inspection/ (accessed on 4 August 2019).


| Test | Result |
|---|---|
| Flammability | Not flame retardant |
| Volume Resistivity | 13–1510 ohm.cm |
| Surface Resistivity | 12.5–14.510 ohm.cm |
| Dielectric Constant | 3.1 |
| Breakdown Voltage | 20 KV/mm |
| Hardness | 70 Shore A |
| Tensile Strength | 3–4 MPa |
| Operating Temperature | −55 to 130 °C (application and geometry dependent) |
| Elongation at Break | 200% |
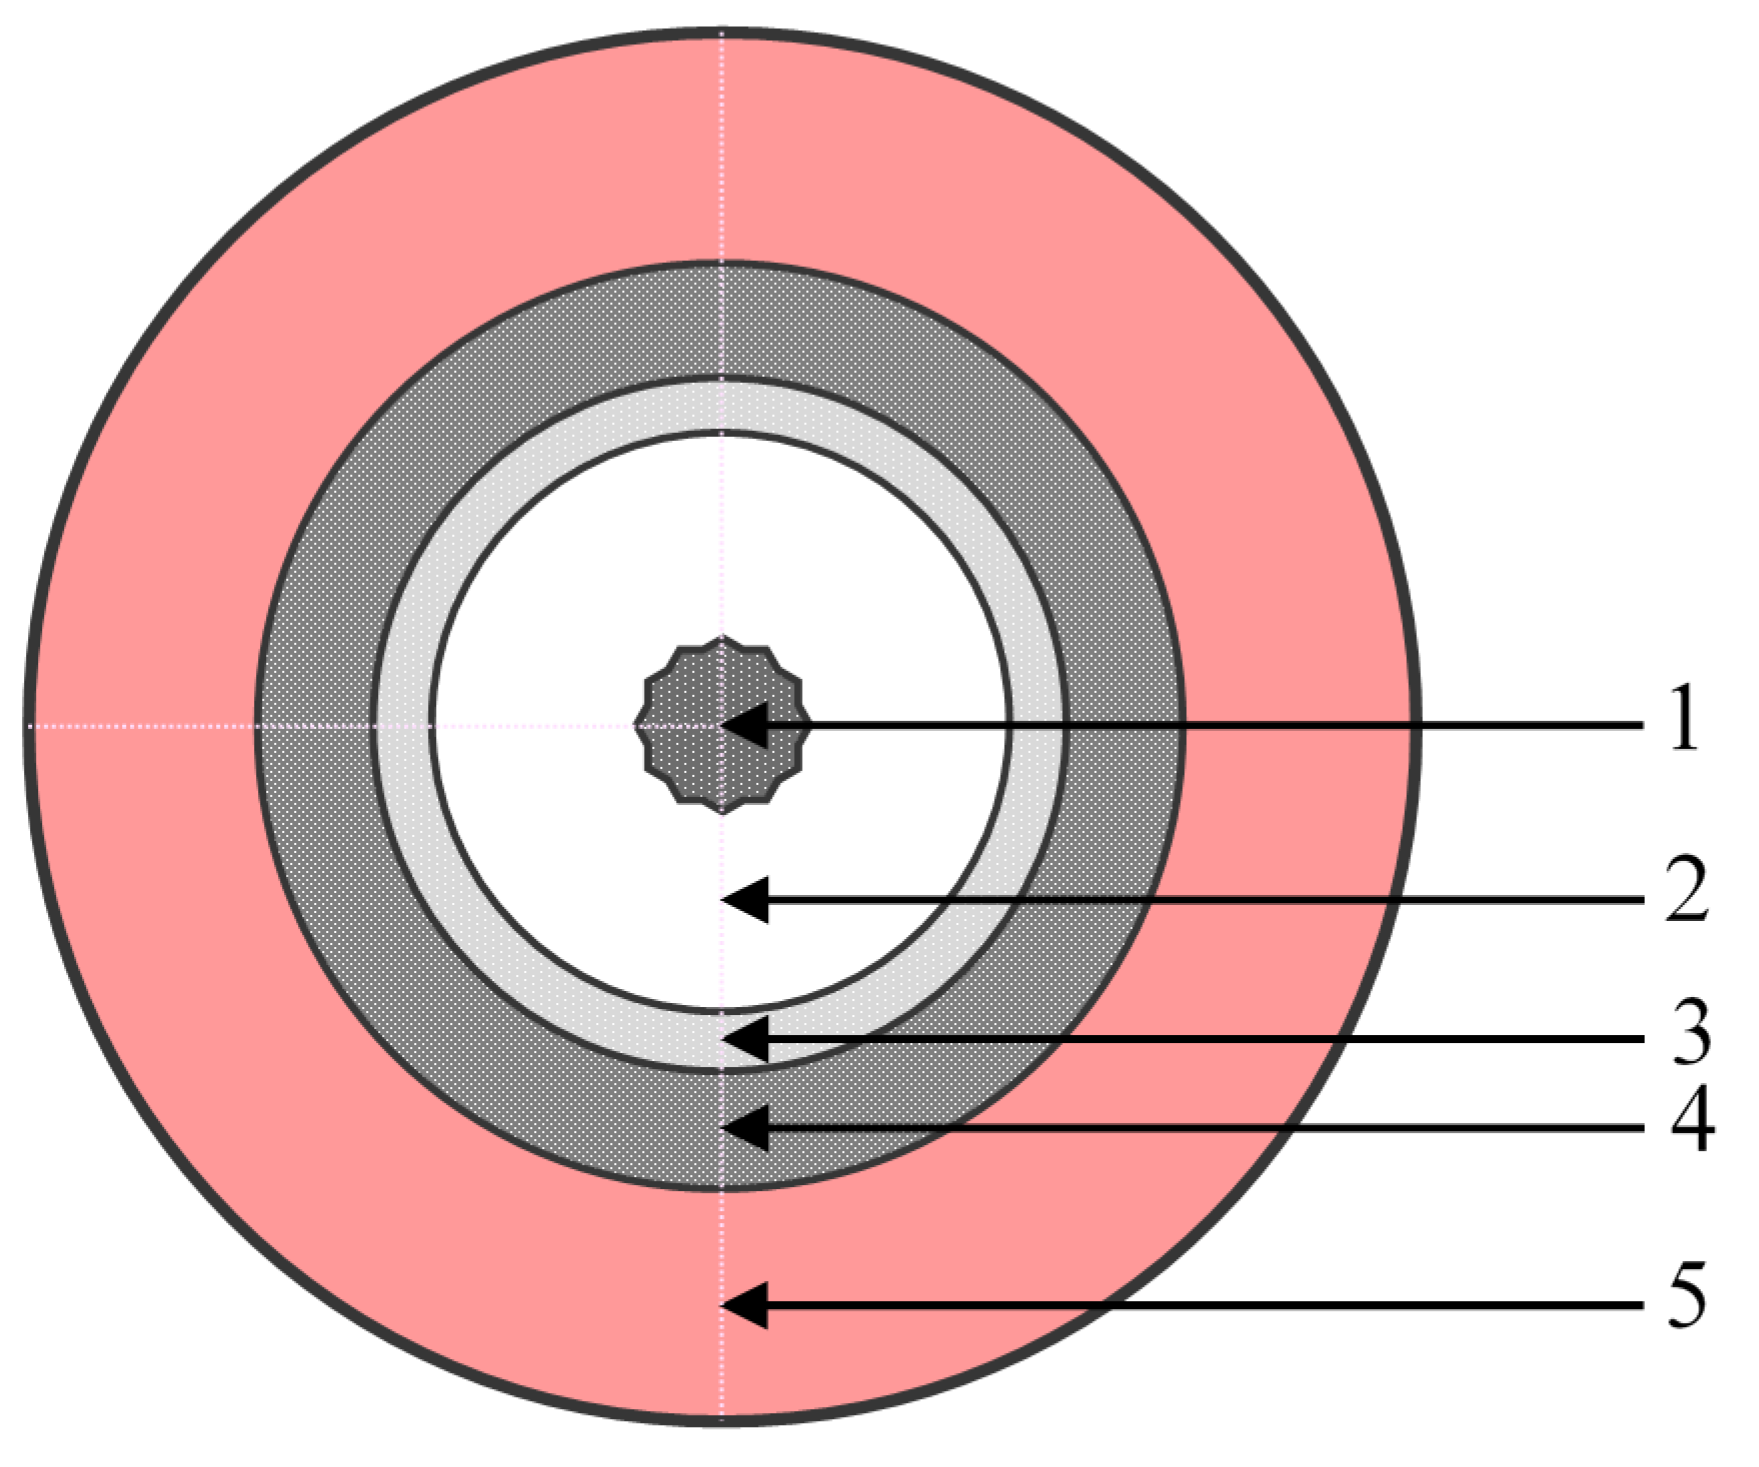
| # | Component | Material |
|---|---|---|
| 1 | Central Conductor | Tinned Copper |
| 2 | Dielectric | Solid Polyethylene |
| 3 | Outer Conductor | Tinned Copper Wire Braid |
| 4 | Inner Jacket | PVC TM2 |
| 5 | Outer Jacket | Polyurethane |
| Specimen | Quantity | Marinized Cabling | HPUT Marinization | 3D Printed Housing |
|---|---|---|---|---|
| 40 kHz HPUT | 4 | Connection from electrode plates to male BNC. Length of 10 m | Putty to cover electrodes and cabling—metal front mass of HPUT does not require marinization | HPUT housing to surround putty to be 80 mm in outer diameter |
| Feature | Specification | Prototype |
|---|---|---|
| Powered by | Mains | Mains |
| Voltage, V | 240 | 100–300 V |
| Dimensions (L × W × H), cm | 50 × 30 × 20 | 37 × 36 × 23 |
| Weight of the system, Kg | <10 Kgs | 1.5 Kgs |
| Number of channels | 4 | 8 |
| Inputs signal generators | 4 | 2 individual signal generators |
| Powered by | Mains | Mains |
| Feature | Prototype |
|---|---|
| Capabilities of the software, i.e., change the parameters based on the modeling results |
|
| Capability of driving the hardware | Yes |
| Level of user-friendliness | Basic (knowledge of ultrasonic cleaning process) |
| Data acquisition capabilities | Yes |
| Data storage | Yes—laptop |
| Reporting capabilities | Desirable |
| Parameter | Limitation | Performance Optimization |
|---|---|---|
| Fouling Thickness | Takes longer to breakdown fouling layer | Optimize cleaning time to account structural constraints. This will increase the cleaning time duration and may require wave input optimization to account for attenuation. |
| Pipe Wall Thickness | Reduction of delivery of power into liquid | |
| Structural Coating | Attenuation power delivery from HPUT into the metallic structure | |
| High-Power Amplifier Hardware | Power delivery into HPUT to compensate for power loss due to pipe thickness and coating | Improve power output and optimize wave generation, i.e., square wave |
© 2019 by the authors. Licensee MDPI, Basel, Switzerland. This article is an open access article distributed under the terms and conditions of the Creative Commons Attribution (CC BY) license (http://creativecommons.org/licenses/by/4.0/).
Share and Cite
Lais, H.; Lowe, P.S.; Wrobel, L.C.; Gan, T.-H. Ultrasonic Transducer Array Performance for Improved Cleaning of Pipelines in Marine and Freshwater Applications. Appl. Sci. 2019, 9, 4353. https://doi.org/10.3390/app9204353
Lais H, Lowe PS, Wrobel LC, Gan T-H. Ultrasonic Transducer Array Performance for Improved Cleaning of Pipelines in Marine and Freshwater Applications. Applied Sciences. 2019; 9(20):4353. https://doi.org/10.3390/app9204353
Chicago/Turabian StyleLais, Habiba, Premesh S. Lowe, Luiz C. Wrobel, and Tat-Hean Gan. 2019. "Ultrasonic Transducer Array Performance for Improved Cleaning of Pipelines in Marine and Freshwater Applications" Applied Sciences 9, no. 20: 4353. https://doi.org/10.3390/app9204353
APA StyleLais, H., Lowe, P. S., Wrobel, L. C., & Gan, T.-H. (2019). Ultrasonic Transducer Array Performance for Improved Cleaning of Pipelines in Marine and Freshwater Applications. Applied Sciences, 9(20), 4353. https://doi.org/10.3390/app9204353