Article

Particle Number Measurements Directly from the Tailpipe for Type Approval of Heavy-Duty Engines

1
European Commission, Joint Research Centre, Ispra 21027, Italy
2
Daimler AG, Mercedesstr. 120, 70372 Stuttgart, Germany
3
CNH Industrial, via Puglia 35, 10156 Torino, Italy
4
DAF Trucks N.V., Hugo van der Goeslaan 1, 5643 TW Eïndhoven, The Netherlands
5
MAN Truck & Bus AG, Vogelweiherstr. 33, D-90441 Nürnberg, Germany
6
Volvo Powertrain Engineering, 99 Route de Lyon, 69806 Saint-Priest, France
7
Scania, CV AB, 15187 Södertälje, Sweden
*
Author to whom correspondence should be addressed.
Appl. Sci. 2019, 9(20), 4418; https://doi.org/10.3390/app9204418
Submission received: 7 October 2019 / Revised: 15 October 2019 / Accepted: 16 October 2019 / Published: 18 October 2019
(This article belongs to the Special Issue Air Pollution)

Abstract

:

Featured Application

Particle number measurements directly from the tailpipe of heavy-duty engines are possible for type approval regulatory purposes.

Abstract

The type approval of heavy-duty engines requires measurement of particulates downstream of a proportional to the exhaust flow partial flow dilution system. However, for particle number systems, which measure in real time, this is not necessary and a fixed dilution could be used. In order to assess this dilution possibility, an inter-laboratory exercise was conducted, where a “Golden” system measuring directly from the tailpipe with “hot” (150 °C) fixed dilution was compared with the laboratory regulated systems. Additional “Golden” counters were measuring from 10 nm, below the current cut-off size of 23 nm defined in the regulation, in order to collect data below 23 nm and to confirm that the direct sampling is also possible for smaller sizes. Seven diesel engines and two CNG (compressed naturals gas) engines were used in six laboratories. The results of the “Golden” instruments were within 25% in most cases, reaching 40% in two laboratories for both >23 nm and >10 nm. The repeatability of the measurements (10% to 40%) remained the same for both systems with both cut-off sizes. One test with regeneration showed clear difference between the 10 nm systems, indicating that the thermal pre-treatment only with evaporation tube might not be adequate. Another system measuring from the tailpipe with a fixed “cold” (at ambient temperature) dilution gave differences of up to 50% in most cases (on average +26%). Dedicated tests with this system showed that the differences were the same with fixed or proportional dilution, indicating that it is not the concept that resulted in the overestimation, but the calibration of the system. The main conclusion of this study is that direct sampling with fixed dilution from the tailpipe can be introduced in the future regulation.

1. Introduction

Particulate matter (PM) is a mixture of particles and droplets in the air, consisting of a variety of components such as organic compounds, metals, acids, soil, and dust. Traffic, industrial activities, domestic fuel burning, but also natural dust and salt are the main contributors in urban PM. The concentrations of PM continue to exceed the European Union (EU) limit values in large parts of Europe [1]. The contribution of road traffic to PM concentrations is important: around 14–25% to the PM concentrations in Europe [2,3], but higher in Asia [2,4]. The share of heavy-duty vehicles’ emissions to the respective regional emissions inventories is significant and disproportionate to their activity. In 2008, heavy-duty vehicles, which represented <5% of the vehicle population in California, China and Brazil, contributed 44–57% of the road-traffic PM emissions [5].
The type approval of a heavy-duty engine with the aftertreatment system is conducted in an engine dynamometer where the engine revolutions and torque are varied following a prescribed test cycle. In Europe, since Euro VI (2013), for on-road engines the cycle is the WHTC (World Harmonised Transient Cycle). The test is conducted twice: with engine starting with coolant and oil temperature at ambient conditions (20–30 °C) and the engine starting warmed up (the results are weighted 14% and 86% respectively). Additionally, a stationary cycle is tested: the WHSC (World Harmonised Stationary Cycle). Other cycles are used in other regions of the world: for instance the FTP (Federal Test Procedure) in the United States of America (USA). For off-road engines the relevant cycle is the NRTC (Non-Road Transient Cycle).
The exhaust is diluted in a dilution tunnel with constant volume sampling (CVS), where samples of PM mass, solid particles number (SPN) and gases are taken. PM mass can also be measured with a proportional (to the exhaust flow) partial flow dilution (PD) system since November 2006 (Commission Directive 2005/78/EC) for transient cycles [6]. The proportionality is necessary for the filter method in order to mimic the full dilution tunnel (CVS), where the dilution changes inversely with the exhaust flow. However, for real time signals and instruments this is not necessary, because the emissions can be calculated in a second-by-second basis. Gaseous components can be measured directly from the tailpipe since 2006 for transient cycles. SPN measurements could also be made directly from the tailpipe, but at the moment this is not allowed. However, in 2021 SPN measurements will be conducted with PEMS (portable emissions measurement systems) for type approval and in-service conformity of vehicles, which have higher measurement uncertainty from the laboratory grade equipment and procedures [7]. The samples are taken from the tailpipe of the heavy-duty vehicles with fixed dilution. Thus, the main question that is raised is whether direct tailpipe measurements could be allowed for the type approval of engines in the engine dynamometers in the future regulations. The measurement uncertainty should remain at the same levels as with the full dilution tunnel or the proportional sampling. There are a few comparisons of the CVS or PD systems with the tailpipe systems for heavy-duty engines for SPN [8,9,10]. Nevertheless, a thorough investigation is missing.
The SPN limit for heavy-duty engines (6×10¹¹ p/kWh) (“p” will be used for particles from now on) was introduced in 2013 (Euro VI) for compression ignition (diesel) engines (Commission Regulation (EU) 582/2011) and in 2014 for positive ignition engines (Commission Regulation (EU) 133/2014). The methodology is based on the recommendations of the PMP (particle measurement programme) group which define sampling from the CVS or the PD system with hot (>150 °C) dilution of the sample, thermal pre-treatment in an evaporation tube at 350 °C and counting with a CPC (condensation particle counter) which has a 50% detection efficiency at 23 nm [11]. The question that is raised for the direct sampling is whether a pre-diluter at ambient temperature should be added upstream of the SPN system in order to mimic the PD, or direct hot sampling of the exhaust gas with hot dilution is equivalent. Direct hot sampling does not allow any nucleation or condensation to take place, thus minimises the risk of volatile particles being counted [12]. This could lead to differences when the crankcase ventilation emissions or emissions during regenerations are measured. In the first case lubricant oil particles will be present [13], in the second high molecular hydrocarbons for non-catalytic coated particulate filters [14].
In Europe there is the intention to decrease the 50% detection efficiency of the CPC from 23 nm to 10 nm [9]. The reason is that high concentrations of particles below 23 nm have been found for light-duty vehicles [15,16,17], but also for heavy-duty ones [18]. Measuring from lower sizes poses the risk of falsely measuring volatile particles that go through the evaporation tube or are re-nucleated downstream of the evaporation tube (i.e., volatile artefact) [19]. For this reason, a hot catalytic stripper in place of (or in addition to) the evaporation tube has been suggested [20]. Thus, it is also necessary to confirm that the direct tailpipe sampling would be applicable also for the sub-23 nm measurements.
The objective of this paper is to assess whether SPN measurements directly form the tailpipe are applicable for regulatory purposes. For this reason, the regulated procedure (PD with PMP system) will be compared with the direct tailpipe sampling methodology in many European laboratories. In order to cover the extreme case, the “Golden” system had catalytic stripper and sampled directly from the tailpipe with “hot” dilution (i.e., no cold dilution upstream). In some laboratories a system with a cold pre-diluter and an evaporation tube was used. The measurements were complemented with sub-23 nm particles (starting from 10 nm) in order to confirm the applicability for this lower cut-off size.

2. Materials and Methods

The main objectives of this campaign were (i) to investigate the possibility to use constant (fixed) dilution for SPN instruments sampling directly from the tailpipe of heavy-duty engines and (ii) to monitor the fraction of sub-23 nm particles of modern heavy-duty engines. For this reason, a “Golden” system that was sampling directly from the tailpipe was circulated to all participating laboratories. Additional instruments that counted below 23 nm were also provided. The OEMs (original equipment manufacturers) provided the engine, the proportional partial flow dilution systems (PD) and the PMP SPN systems. The typical experimental setup is depicted in Figure 1.
The PDs were the SPC 478 from AVL (Graz, Austria), Microtrol 6 from Nova (Roskow, Germany), PSS-20 from Control Sistem (Pianezza, Italy) and DMD from AVL. All PMP systems were the AVL particle counter (APC 489) which includes a hot dilution at 150 °C and an evaporation tube at 350 °C [21]. This configuration will be abbreviated as “PD(ET)”. All systems were maintained and calibrated within one year from the day of the testing as required by the regulation. In addition to the internal 23 nm CPCs (model 3790) from TSI (Shoreview, MN, USA) [22,23] included in the PMP systems, a “Golden” 10 nm CPC (model 3792 from TSI) was provided and connected in parallel to monitor the sub-23 nm particles [24].
The “Golden” tailpipe system was an APC 489 (AVL) with a catalytic stripper (CS) [25] instead of evaporation tube (ET) and a 10 nm CPC (model 3792 from TSI) internally in the device. For this reason, a 23 nm CPC (model 3790 from TSI) was also connected externally in parallel with the 10 nm CPC for this measurement campaign. This configuration will be abbreviated as “TP(CS)” from now on.
At some OEMs a second SPN system (SPCS) was used (provided by Horiba, Kyoto, Japan) [26]. This system is a PMP system with evaporation tube at 350 °C and a hot dilution at 190 °C connected to a pre-diluter which used filtered air at approximately ambient temperature. This concept will be abbreviated as TP(cET’) from now on and measured only above 23 nm. The hot dilution at 190 °C compared to the 150 °C of the “Golden” system should not have any effect at the results because both systems heat the sample at 350 °C at the next stage, so species of similar volatility will be evaporated. The catalytic stripper of the “Golden” system is also expected to oxidise any evaporated hydrocarbons [25]. The cold pre-diluter concept resembles more the PD(ET) as they both cool down the exhaust before thermally treating it in the PMP system. Their main difference is that the dilution is constant in the TP(cET’) case, while at the PD the dilution is inversely proportional to the exhaust flow. On the contrary, the direct “hot” dilution of the TP(CS) avoids any nucleation and condensation to take place [12,19]. Thus, it is possible that smaller or less particles are counted with the TP(CS) system.
The measurements took place at six OEMs (one measured twice) in nine engine dynamometers from October 2018 until July 2019. The OEMs in alphabetical order were: CNH (Italy), DAF (Netherlands), Daimler (Germany), MAN (Germany), Scania (Sweden), Volvo (France). In total seven diesel and two CNG (compressed natural gas) fuelled engines were tested. All engines were Euro VI, step C or D. The diesel engines were equipped with diesel oxidation catalyst (DOC), diesel particulate filter (DPF) and selective catalytic reduction (SCR) of NOx. Diesel fuel with 7% content of biofuel was used. One engine was additionally tested with 100% FAME (fatty acid methyl esters). The CNG engines were positive ignition with three-way catalyst (TWC) and with closed crankcase ventilation. All OEMs tested the regulated cycles for on-road heavy-duty engines WHTC (World harmonised transient cycle) with cold and hot start, and the WHSC (World harmonised stationary cycle). Additional tests included hot start cycles such as the US type-approval cycle FTP (Federal test procedure), the off-road engines cycle NRTC (Non-road transient cycle) and the CO2 mapping, in order to cover as many as possible transient cases and a big part of the engine map. Additional investigations included forced regeneration events and connection of the crankcase ventilation to the tailpipe. Since Euro VI regulation both regeneration events and crankcase ventilation emissions have to be included in the emissions of the engines. The objective of these tests though was to see differences of the systems with and without challenging aerosol (unburnt fuel and oil particles). Some additional tests with different length of the sampling line of the “Golden” system targeted in better defining the sampling conditions for possible future regulations. Some OEMs measured exchanging the position of the external “Golden” 10 nm and “Golden” 23 nm CPCs in order to compare them with the internal CPCs with the same cut-off sizes (parallel checks) (see results in Appendix A). The test protocol is summarised in Table 1.
The JRC (Joint Research Centre) of the European Commission provided and checked the “Golden” instruments at the beginning of the testing campaign, at the end, and twice in between the testing to confirm their proper operation. These tests and the parallel checks of the OEMs are discussed in Appendix A.
The SPN emissions measured with the systems connected to the proportional partial flow dilution systems were calculated according to the regulation. For the systems at the tailpipe the equation given in the RDE (real-driving emissions) regulation of light-duty vehicles was used replacing distance driven with engine work [27]. This calculation needs correct time alignment of the particles signal with the exhaust flow rate. Misalignment of ±1 second in our measurements resulted in differences of ±5% (up to ±10% in some cases), in agreement with others [28]. For all calculations the mean PCRF (particle number concentration reduction factor) as defined in current regulations was used (i.e., average of 30 nm, 50 nm, and 100 nm). This means that the 10 nm emission levels are underestimated, as losses below 30 nm are not considered in the calculations. The losses should be similar for all systems examined, thus the conclusions should be the same even correcting separately for the losses below 30 nm. If losses would be taken into account, the results of the 10–23 nm levels would need a correction of approximately 1.7, as explained elsewhere [16,27].

3. Results

3.1. Length of Heated Line

Figure 2 summarises the results of the tests where the length of the heated line to the “Golden” system TP(CS) varied between 0.5 and 4 m. The tests were conducted with three engines. When the length increased by 2.5–3.5 m, the differences to the partial flow dilution (PD) system increased by 10% to 50%. These differences can be attributed to losses in the sampling line.

3.2. Crankcase Emissions

Figure 3 plots the most important results with three diesel engines with and without the crankcase ventilation connected downstream of the aftertreatment devices. Beginning with DPF #4, the results are similar (i.e., within the repeatability of the measurements) with and without the crankcase ventilation connected, indicating no influence of the crankcase emissions on the absolute levels of both the >23 nm and >10 nm emissions. For DPF #1 and DPF #7 the crankcase emissions increased the absolute levels of the engine. The effect on the cold start WHTC was small, but much larger for the hot start cycles where the SPN emission levels were low compared to the cold start cycles. With the crankcase ventilation connected the emissions reached a level of 2 × 10¹¹ p/kWh due to the addition of semi-volatile oil particles. The 10–23 nm particles were approximately 50% to 100% of the >23 nm particles. What is important from these tests is that the ratio of sub-23 nm particles as measured with the PD(ET) and TP(CS) systems remained the same with and without crankcase emissions for the same engine (see inset of Figure 3) (slopes remained within 5%), indicating that evaporation tube and catalytic stripper had similar efficiency in removing the semi-volatile oil particles.

3.3. Regenerations

Figure 4 compares emissions of one hot start WHTC without regeneration (symbol nR) and two or three subsequent hot start WHTCs that regeneration took place (symbol R) for four diesel engines. For DPF #3 both the “Golden” system with the catalytic stripper (CS) and the PMP system with the evaporation tube (ET, bold) were connected to the proportional partial flow dilution system (PD, dark colour columns). For DPF #5 both systems were connected to the tailpipe (TP, light colour columns). For DPFs #4 and DPF #1 the ET system was connected to the PD and the CS system to the tailpipe.
For DPF #3, the regenerating cycles remained at the same levels as with the non-regenerating one. It is possible that the DPF was quite clean and there was not much soot to be burnt, or the regenerating emissions were much lower compared to the levels of the engines (e.g., crankcase emissions levels). For DPF #5 the emissions during the regenerating cycles gradually increased. The differences between the CS and ET systems for the 23 nm CPCs changed from 0% to −6%, while for the 10 nm CPCs from −19% to −1%. These changes have to do with the change of the size distribution and the losses inside the systems. For the non-regenerating cycle the sub-23 nm fraction was very high, thus small particles were emitted and it is possible that the CS system had higher particle losses at small sizes. During the regenerating cycles the majority of particles was >23 nm and consequently the losses were similar. DPF #4 and DPF #1 showed also an increase of the emissions with regenerations. The differences between the CS and ET remained similar with or without regenerations taking place for emissions >23 nm. For DPF #4, where the sub-23 nm data were available, there was a gradual increase of the differences between CS and ET. At the last regenerating cycle the 10 nm CPC connected to the CS measured 41% less than the ET system.
Figure 5 plots the 10 nm real time signals of the TP(CS) and PD(ET) systems for the last 600 seconds of the first (left panel) and the third (right panel) regenerating WHTC for DPF #4. While the agreement is excellent for the first regenerating cycle, high differences are seen for the third one. The most likely explanation is that volatile particles re-nucleated downstream of the evaporation tube (volatile artefact) [16]. The TP(CS) had PCRF 2000, while the PD(ET) only 100. The system with the catalytic stripper oxidised them so no re-nucleation occurred downstream of the catalytic stripper. Another explanation is that small particles existed during the regeneration that grew to sizes above 10 nm in the evaporation tube system due to condensation of volatile precursors on them, but remained below 10 nm in the catalytic stripper system because the volatile precursors were oxidised.

3.4. Sub-23 nm Fractions

Figure 6 plots the sub-23 nm percentages (10–23 nm emission levels compared to the >23 nm levels) for various cycles and engines. The tests with regeneration were not included because their differences were discussed previously. The percentages are similar (±15%) between the systems at the two different locations (TP or PD). There is one exception (DPF #5), where the percentage is higher at the PD(ET) system. It is very probable that the 23 nm CPC of the “Golden” system was underestimating more than 8% as assumed (see Appendix A). Another explanation is that most of the sub-23 nm particles were slightly bigger than 10 nm at the PD(ET) system, while slightly smaller (and not counted) at the TP(CS) system, as also discussed previously for the regenerating cycles. These results indicate that for the majority of cases the two systems are equivalent.

3.5. Emission Levels

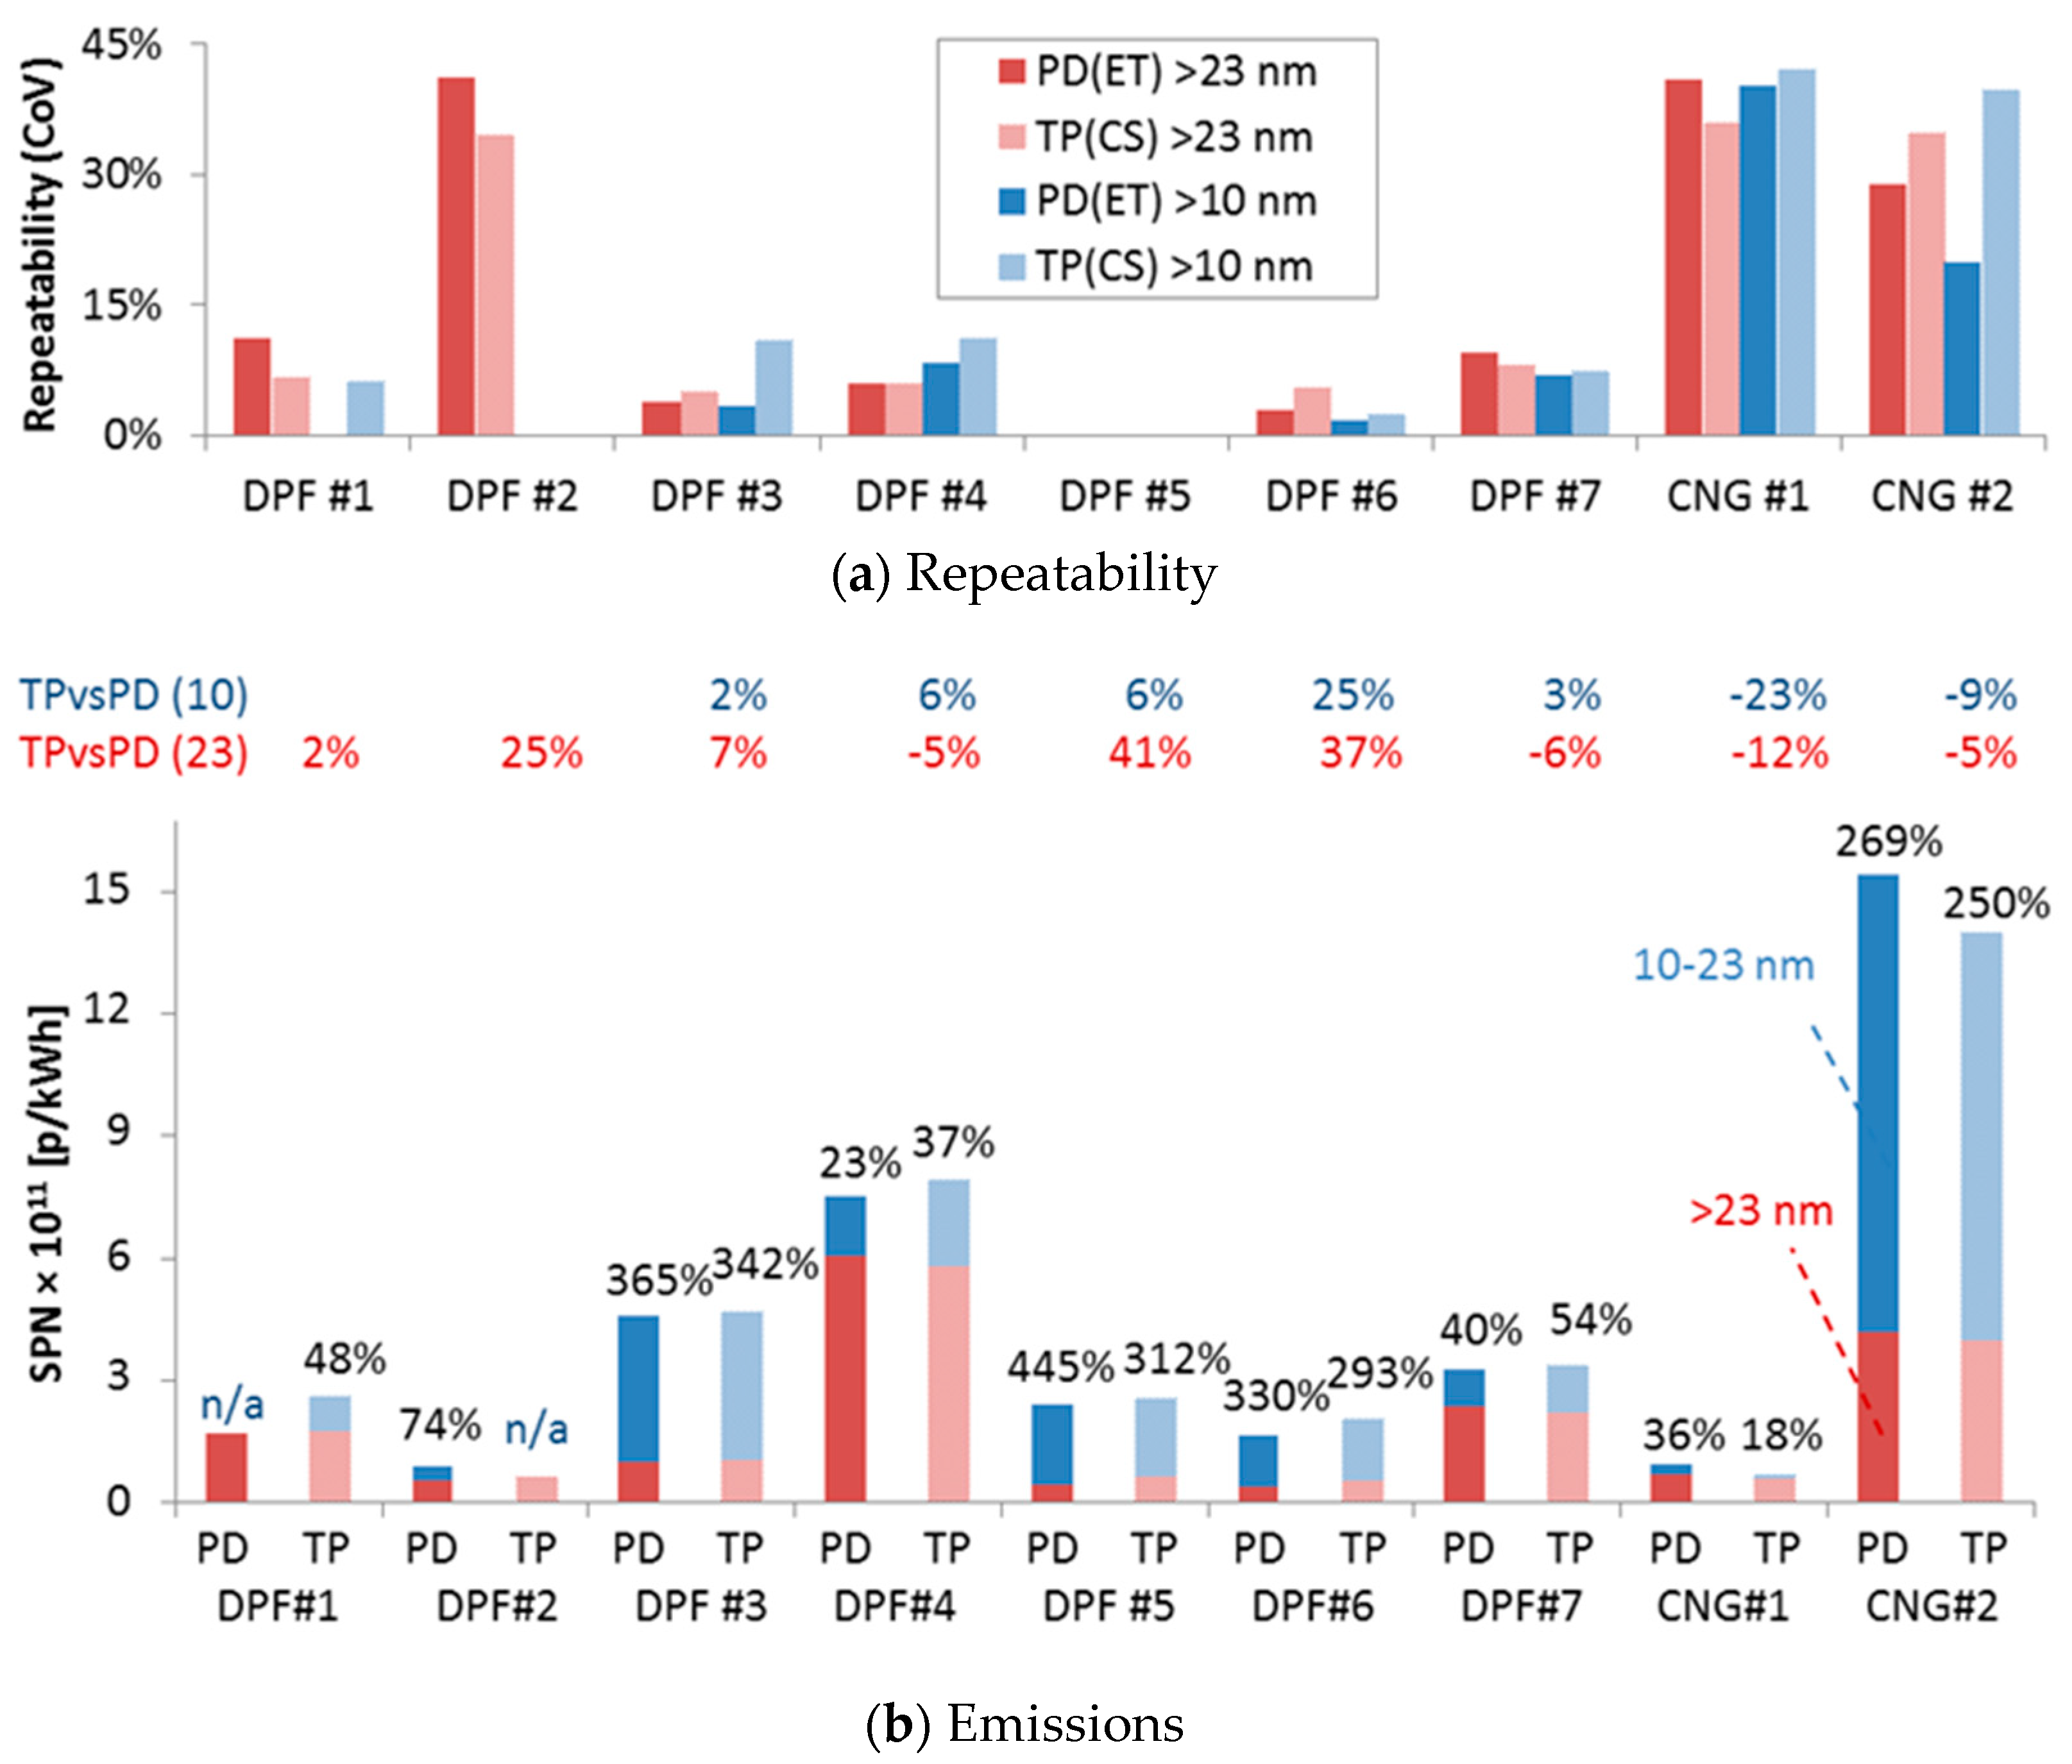
The results for the regulated cycle WHTC (weighted 14% for the cold start part and 86% for the hot start part) are summarised in Figure 7. It should be mentioned that in some cases the crankcase ventilation was accounted in the emissions (e.g., DPF #2, DPF #5), so the emission levels are not necessarily those of the type approval procedure. The results for all cycles are plotted in Appendix B. The lower panel plots for the various engines the emission levels >23 nm and 10–23 nm for the laboratories particle systems with evaporation tube (ET) connected to the proportional partial flow dilution system (PD) and the “Golden” particle system with catalytic stripper (CS) connected to the tailpipe (TP). Columns with dark colours are the PD(ET) systems, while with light colours the TP(CS) system. Emissions >23 nm in red, while 10–23 nm in blue.
The >23 nm emission levels vary from <1×10¹¹ p/kWh to 6×10¹¹ p/kWh, which is the current limit for heavy-duty engines. Considering the 10–23 nm emissions, two engines (DPF #4, CNG #2) would exceed the limit. The 10–23 nm emissions are from 18% up to 365% of the >23 nm levels. The percentages are independent of emissions levels and seem to depend mainly on the engine and aftertreatment technology. The difference of the TP(CS) system from the PD(ET) systems varied from −12% to +41% for >23 nm emissions and from −23% to +25% for the >10 nm emissions. The repeatability of the measurements (Figure 7, upper panel) varied from <10% to almost 45%. However, the levels were similar between TP(CS) and PD(ET) for both 23 nm and 10 nm measurements.

3.6. Tailpipe Comparisons

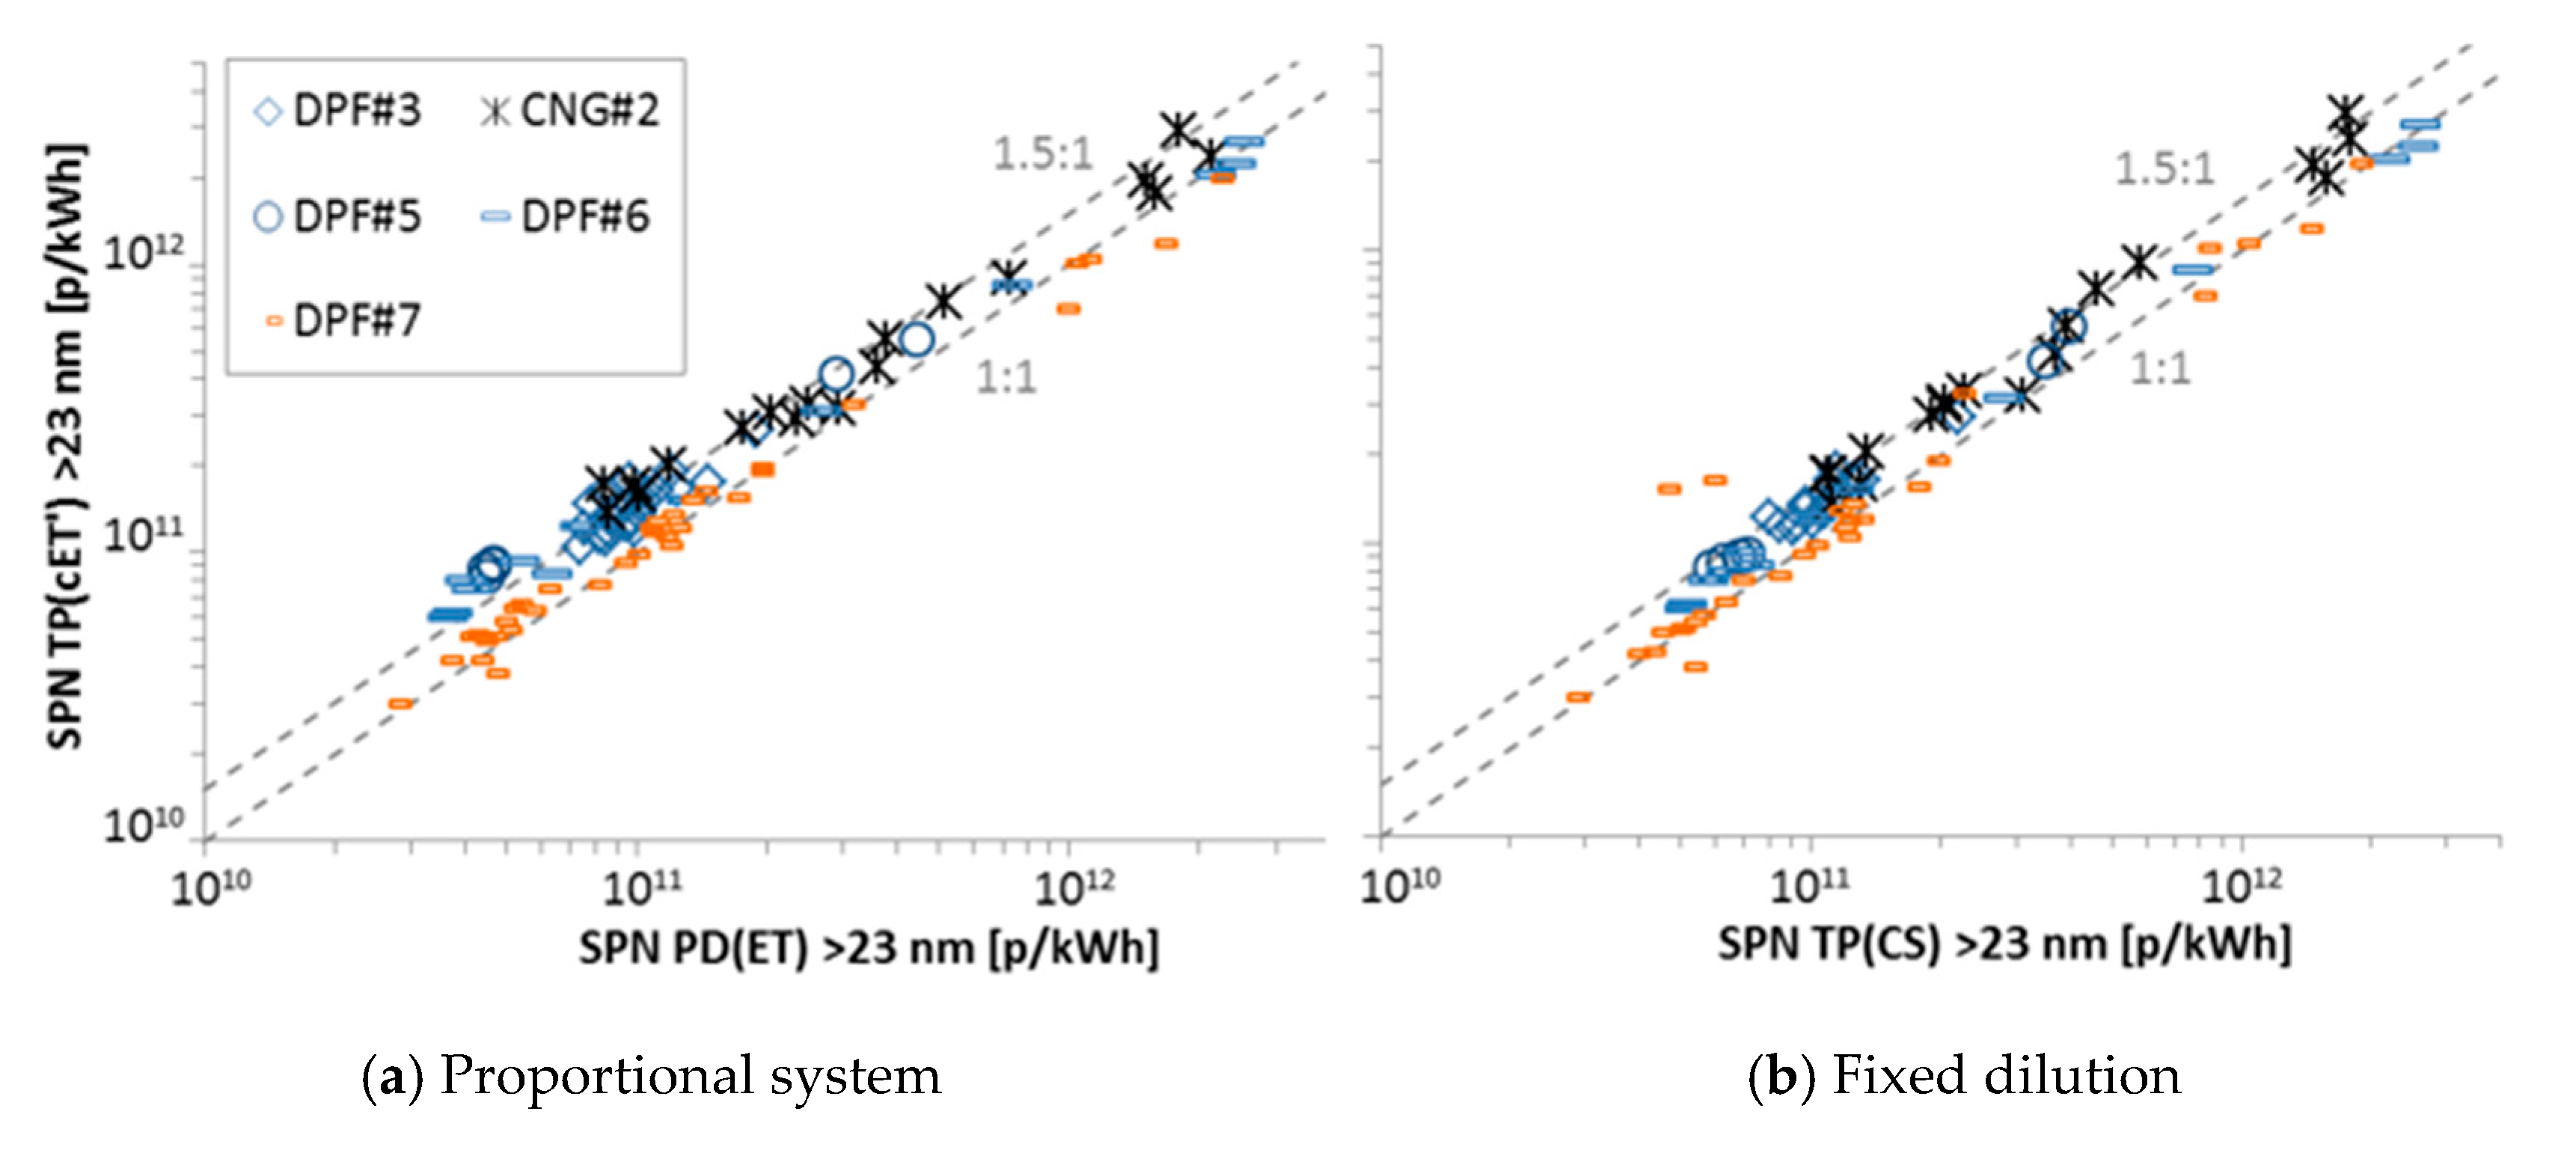
The comparison of the system with 10:1 fixed “cold” pre-dilution TP(cET’) (SPCS 2100 from Horiba) that was circulated at most laboratories compared to the proportional dilution PD(ET) or the “Golden” system with fixed 10:1 “hot” dilution is plotted in Figure 8. Most of the results are within 0% and +50%. The most probable explanation for this overestimation is that the cut-off size of the CPC was slightly below 23 nm, and thus the counting efficiency at 23nm was >50%, leading to overestimation of the emissions.
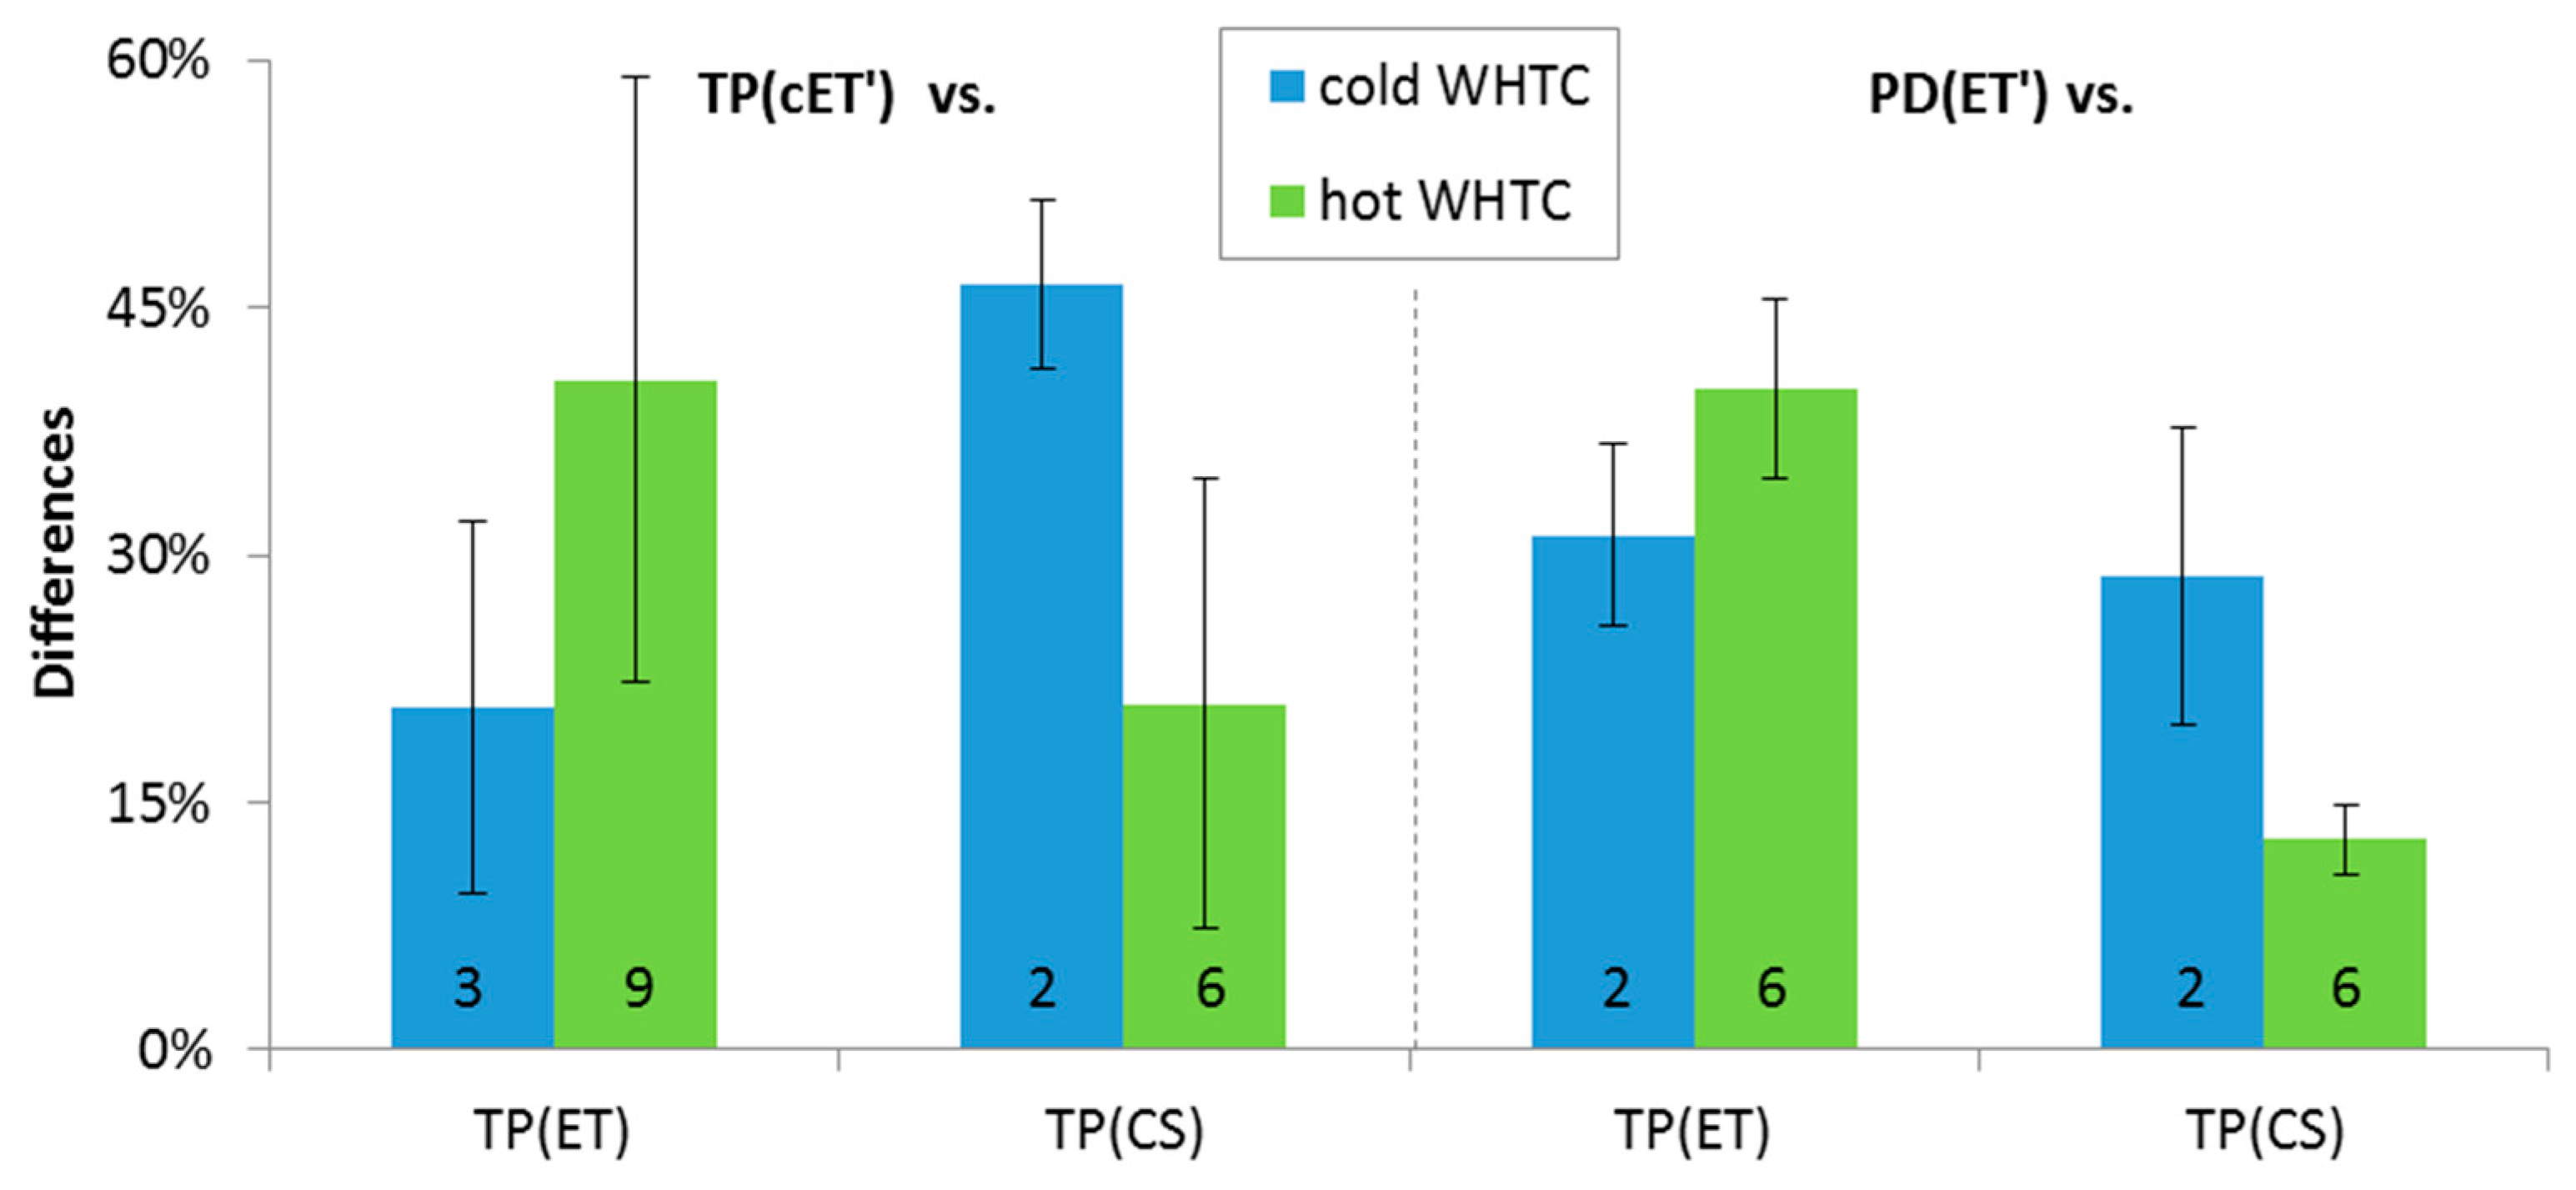
In order to confirm that the cold pre-diluter is equivalent to the proportional diluter, some dedicated tests were conducted with DPF #5. The PMP system with evaporation tube and a cold pre-diluter at the tailpipe TP(cET’) or at the proportional partial flow dilution system without pre-diluter PD(ET’) was compared with the PMP system of the laboratory with evaporation tube connected to the tailpipe TP(ET) or the “Golden” system with catalytic stripper connected to the tailpipe TP(CS) (Figure 9). The results for both cold start and hot start WHTCs are quite similar with differences in the range of 15% to 45%. What is important from this comparison is that the differences remain the same regardless of the diluter upstream of the PMP system (fixed cold pre-diluter or proportional partial flow system). This means that the concept of using a cold pre-diluter is equivalent to the proportional partial flow system.

4. Discussion

Current heavy-duty regulations for on-road and off-road engines require particulate measurements from the full dilution tunnel or partial flow dilution systems that take a sample proportional to the exhaust flow. This is necessary for the gravimetric method where a filter is taken for the whole test cycle, but not for real time instruments, such as the particle counters [6].
The main objective of this study was to assess whether particle number measurements directly from the tailpipe with fixed (constant) dilution are equivalent to the measurements with proportional dilution. There are two direct concepts: the first one is a “cold” dilution at ambient temperature; the second is “hot” dilution, typically >100 °C. The first one is closer to the proportional partial flow diluters currently used in the regulation. The second one avoids any condensation and nucleation to take place. Theoretically, the effect should be small because the particle number systems have a thermal pre-treatment unit that dilutes the sample at 150 °C and then evaporates the remaining semi-volatile particles in an evaporation tube at 350 °C. Thus, only solid (i.e., non-volatile) particles should be counted. The evaporation tube does not remove the volatile species; it only evaporates them. Thus, some condensation on existing solid particles can take place downstream of the evaporation tube and grow their size [19]. With high dilutions the concentration of the volatile species is reduced significantly and the growth is negligible. An experimental study estimated the growth to be <0.5 nm downstream of an evaporation tube [29]. Replacing the evaporation tube with (or adding) a hot catalytic stripper avoids this growth because volatiles are oxidised [25]. In addition, the risk for re-nucleation is minimised. This growth was irrelevant for older technologies with size distributions with count median diameters at 50 nm or higher, because the majority of the particles was already counted by the counters with cut-off size at 23 nm. However, for size distributions close to the 50% detection efficiency of the instruments, the effect can be significant. In this study, in order to check the biggest possible differences, the reference system that was chosen had fixed “hot” dilution and included a catalytic stripper. Additional measurements with another system with fixed “cold” dilution were also conducted. According to our knowledge, this is the first study to address the topic in depth. Some engine studies have conducted comparisons but only with one of the two additional fixed dilution concepts and only with one engine in most cases [8,10]. No study so far has examined particles < 23 nm.
The first investigation was the evaluation of the length of the sampling line before the first dilution. The length varied from 0.5 m up to 4 m, but the wall temperature was kept in all cases at 150 °C. The increase of the length resulted in losses of 10–20% for particles >23 nm and 20–50% for particles >10 nm. The expected diffusion losses of 10 nm for an increase of 3.5 m are 10%, thus the extremely high losses with the viton tube have to do either with the material or other unknown experimental uncertainties [30]. Based on these findings, stainless steel heated at 150 °C with a maximum length of 1 m should be allowed. This requirement is in line with the maximum length permitted for PD systems (1 m).
The second investigation was the crankcase emissions. They increased the emission levels of the diesel engines to 2–3×10¹¹ p/kWh, but above these levels their contribution to the engine emissions was not evident, i.e., any contribution was within the repeatability of the measurements. It is known that the emission levels depend on the DPF fill state. The first tests with DPF #4 without the crankcase ventilation connected were high because the DPF was relatively empty. At the next tests the emission levels were lower but the contribution of crankcase emissions brought them to similar levels. Interestingly, the levels >23 nm and the sub-23 nm fraction measured by the two concepts of proportional and fixed dilution were the same with and without the crankcase ventilation connected to the tailpipe. This can be explained by the size distributions typically found at the crankcase ventilation, which have the majority of particles >10 nm, and in most case even above 30 nm [31,32,33].
The third investigation was the regeneration. In most cases the SPN emissions increased when regeneration took place, in agreement with the literature, for instance References [34,35]. In one case the emissions remained at the same levels. This has also been shown before [14], or it could be that the crankcase emissions had a higher contribution. The comparisons of the two concepts were similar, even though the absolute levels of the emissions were increasing. In one test though, it was evident that the sub-23 nm levels increased more with the proportional diluter and the evaporation tube. As discussed above, it is possible that due to the low dilution (100:1) used re-nucleation occurred downstream of the evaporation tube or small solid pre-existing particles grew to the >10 nm range for that system, but remained <10 nm for the catalytic stripper one (dilution 2000:1). Regeneration tests have shown high concentrations of volatile particles [36,37,38] and even high molecular weight volatile organic compounds from the dilution tunnel [39]. In one case it was also shown that the dilution measurements can have differences compared to the tailpipe results for sub-23 nm measurements [40].
The results for the rest test cycles were promising: the differences between the “hot” fixed dilution and the proportional systems of six OEMs (with nine engines in nine different engine dynamometers) were mostly within −20% and +25%. There were some cases that reached +40%. The average difference of the two concepts for all laboratories for the official cycle was 9% for the 23 nm and 1% for the 10 nm counters. The ratio of 10 nm and 23 nm was also similar between the two concepts and remained within ±15% for a wide range of sub-23 nm fractions (up to seven times higher concentrations of particles below 23 nm to particles above 23 nm). Only in one case the difference was higher: for this case issue with the 23 nm counter in one of the systems is suspected. The results are in good agreement with the limited number of studies for heavy-duty engines (only >23 nm) [8,10] and light-duty vehicles (both >23 nm and >10 nm) [27].
The results with the fixed “cold” dilution were more difficult to interpret. There was an overestimation of the emissions of around 26% (average of five engines). In order to confirm that this was not due the concept, dedicated tests were conducted with the system at the tailpipe or the proportional dilution system. The overestimation remained similar regardless of the position confirming that the concept of fixed “cold” dilution is an acceptable alternative. It highlighted though the importance of correct calibration procedures. The CPC of the overestimating system was calibrated with soot particles, against a 23 nm reference CPC (same model) that was calibrated with emery oil. Although being similar CPC models, slight differences in the slope of the detection efficiency near the cut-off regime can lead to some deviations. Furthermore, after the end of the measurement campaign, the CPC was checked “as found”, and the 23 nm efficiency was 63.6% and the calibration factor +5%. Even though the overestimation seems small (+5%), the small change of the cut-off size in combination with the different penetration of the system compared to the others can result in high differences when many small particles exist. The calibration discrepancies have been discussed in the literature for both thermal pre-treatment systems [16] and condensation particle counters [22,41] and will not be repeated here.
Taking all comparisons together, the conclusion is that “cold” proportional dilution, fixed “cold” dilution, and fixed “hot” dilution are equivalent; at least for the majority of the cases that were examined. This was supported also by the fact that the repeatability of the measurements was similar. It should be noted that all comparisons were done with partial flow systems. More research with full dilution tunnel would be desirable. However the equivalency of partial and full flow systems has been shown in the past (e.g., [6,8,11,42]).
The data that were collected for concentrations of particles below 23 nm showed that there were engines with a small fraction, but also others with concentrations seven times higher, as also shown elsewhere [7]. This means that the current methodology with the 23 nm cut-off size in some cases captures only 12% of the emitted particles. Thus, for a better characterization of the emissions, a lower size (e.g., 10 nm as in this study) is recommended. However, a lower size has higher risk for higher differences between the various systems. This was not shown in the repeatability of the measurements that remained at the same levels for >23 nm and >10 nm measurements. Additionally, the differences between the two concepts of proportional and fixed “hot” dilution were in most cases within 25%. Thus, the different concepts seem equivalent also for the lower size of 10 nm. However, there might be cases where the fixed “hot” dilution with catalytic stripper measures lower concentrations. This can be either due to avoidance of nucleation and condensation in the first place, more efficient removal of the volatiles and less re-nucleation downstream of the evaporation tube, or smaller growth of particles that do not reach the lower size of the counters. However, the cases in which this happened were limited, not necessarily representative of reality and the evaporation tube systems were used with low dilution that can enhance the artefacts. Thus, the necessity of a catalytic stripper needs further studies. In general, the literature supports the use of a catalytic stripper, because the artefacts are minimised [16].

5. Conclusions

This study evaluated whether fixed dilution can be used for the measurement of solid particle number (SPN) emissions for the type approval of heavy-duty engines. The experiments were conducted in six engine manufacturers laboratories in Europe. Emission levels of particles >23 nm, as currently in the regulation, and >10 nm were monitored. The results from seven diesel engines and two compressed natural gas engines showed that the fixed dilution method (with cold or hot dilution) is equivalent to the proportional dilution method, currently prescribed in the regulation. Absolute emissions and repeatability were at the same levels for the two concepts for both size ranges. The system with the cold fixed dilution was overestimating on average, thus, attention should be paid to the calibration procedures, especially for the future 10 nm systems. During regeneration tests the system with catalytic stripper measured lower than the system with the evaporation tube for the sub-23 nm range. Further studies are needed to define the thermal pre-treatment of the particle systems as the use of catalytic stripper or evaporation tube might result in differences below 23 nm.

Author Contributions

Conceptualization, B.G. and H.L.K.; methodology, all; formal analysis, B.G.; writing—original draft preparation, B.G.; writing—review and editing, all.

Funding

This research received no external funding.

Acknowledgments

The authors would also like to acknowledge Horiba Europe GmbH and in particular Florian Huewe for providing their particle number system that was used in some of the laboratories. B.G. and E.T. would like to thank Davide Turco for the organization of the tests at CNH Industrial.

Conflicts of Interest

The authors declare no conflict of interest.

Disclaimer

The opinions expressed in this manuscript are those of the authors and should in no way be considered to represent an official opinion of the European Commission and the engine manufacturers. Mention of trade names or commercial products does not constitute endorsement or recommendation by the European Commission, the engine manufacturers and/or the authors.

Abbreviations

APCAVL particle counter
cCold
CNGCompressed natural gas
CoVCoefficient of variance
CPCCondensation particle counter
CSCatalytic stripper
CVSConstant volume sampling
DOCDiesel oxidation catalyst
DPFDiesel particulate filter
ETEvaporation tube
EUEuropean Union
FAMEFatty acid methyl esters
FTPFederal Test Procedure
hHot
JRCJoint Research Centre
nRNon-regenerating
NRTCNon-road transient cycle
OEMOriginal equipment manufacturers
PCRFParticle number concentration reduction factor
PDProportional partial flow dilution
PEMSPortable emissions measurement systems
PMParticulate matter
PMPParticle measurement programme
PNDParticle number diluter
RRegenerating
RDEReal-driving emissions
SCRSelective Catalytic Reduction for NOx
SPCSSolid particle counting system
SPNSolid particle number
TPTailpipe
TWCThree-way Catalytic Converter
WHSCWorld harmonised stationary cycle
WHTCWorld harmonised transient cycle

Appendix A

During the measurement campaign, the “Golden” instruments were periodically checked in order to ensure their stability. The “Golden” APC 489 (AVL particle counter) was checked at different PCRF (particle number concentration reduction factor) settings at JRC (Joint Research Centre) and they were found within ±4%. Thus no additional correction was applied. The differences of the external “Golden” CPCs (condensation particle counter) to the reference instruments are plotted in Figure A1. The checks at JRC were done with monodisperse soot aerosol (DNP 3000, from Palas, Karlsruhe, Germany) at 100 nm using as a reference a CPC model 3752 from TSI (Shoreview, MN, USA). The parallel checks at the OEMs (original equipment manufacturer) were done measuring engine exhaust and by connecting the 23 nm “Golden” CPC to their own PMP (particle measurement programme) system and the 10 nm “Golden” CPC to the “Golden” APC (see also Figure 1).
Beginning with the “Golden” 23 nm CPC, the monodisperse JRC results varied between −7% to −16%. The polydisperse checks with the internal 23 nm CPC of the OEMs systems gave differences from 0% to −15%. Regarding the 10 nm “Golden” CPC, the monodisperse JRC results were repeatable (differences −7% to −8%). The polydisperse checks with the internal 10 nm CPC of the “Golden” APC gave differences of −12% to −26%. This can be explained by the losses at the transfer line from the internal position to the external one. The peak of the polydisperse size distribution is not known, but since the percentage of particles for the specific engines was very high (200–400%), the high differences are actually losses of smaller particles. Based on these results a constant factor of 1.08 was used for both “Golden” CPCs and their variability is included in the results in the main text.
Figure A1. Comparisons of “Golden” CPCs with reference instruments at JRC using monodisperse graphite particles or with the PMP systems at OEMs using polydisperse engine soot. CPC = Condensation particle counter; OEM = Original equipment manufacturer; JRC = Joint Research Centre.
Applsci 09 04418 g0a1

Appendix B

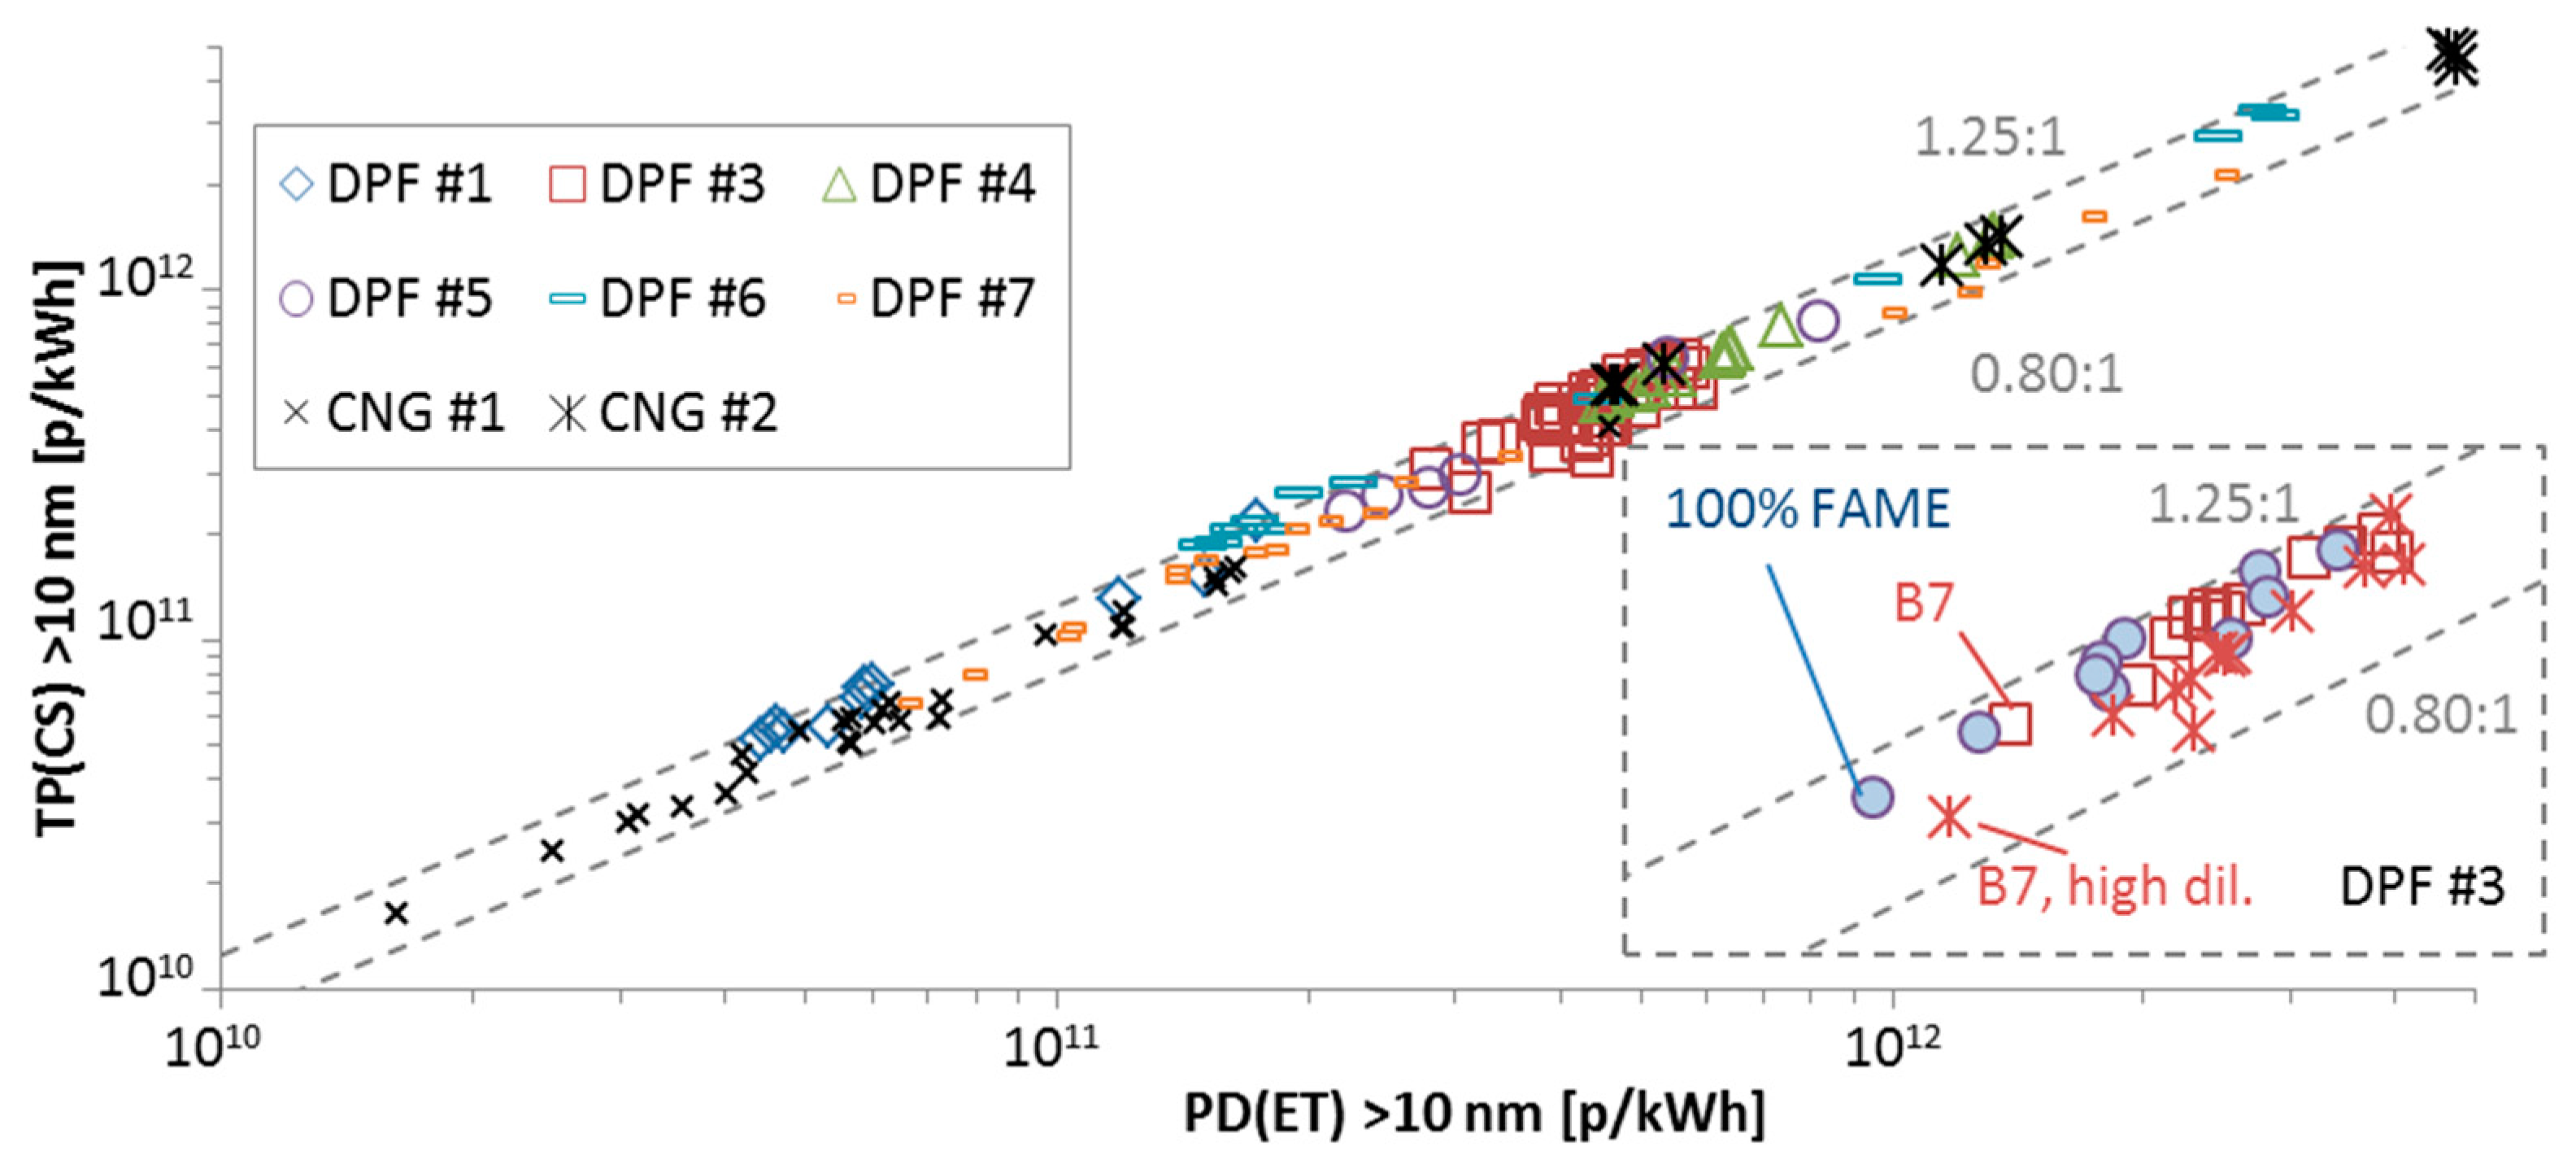
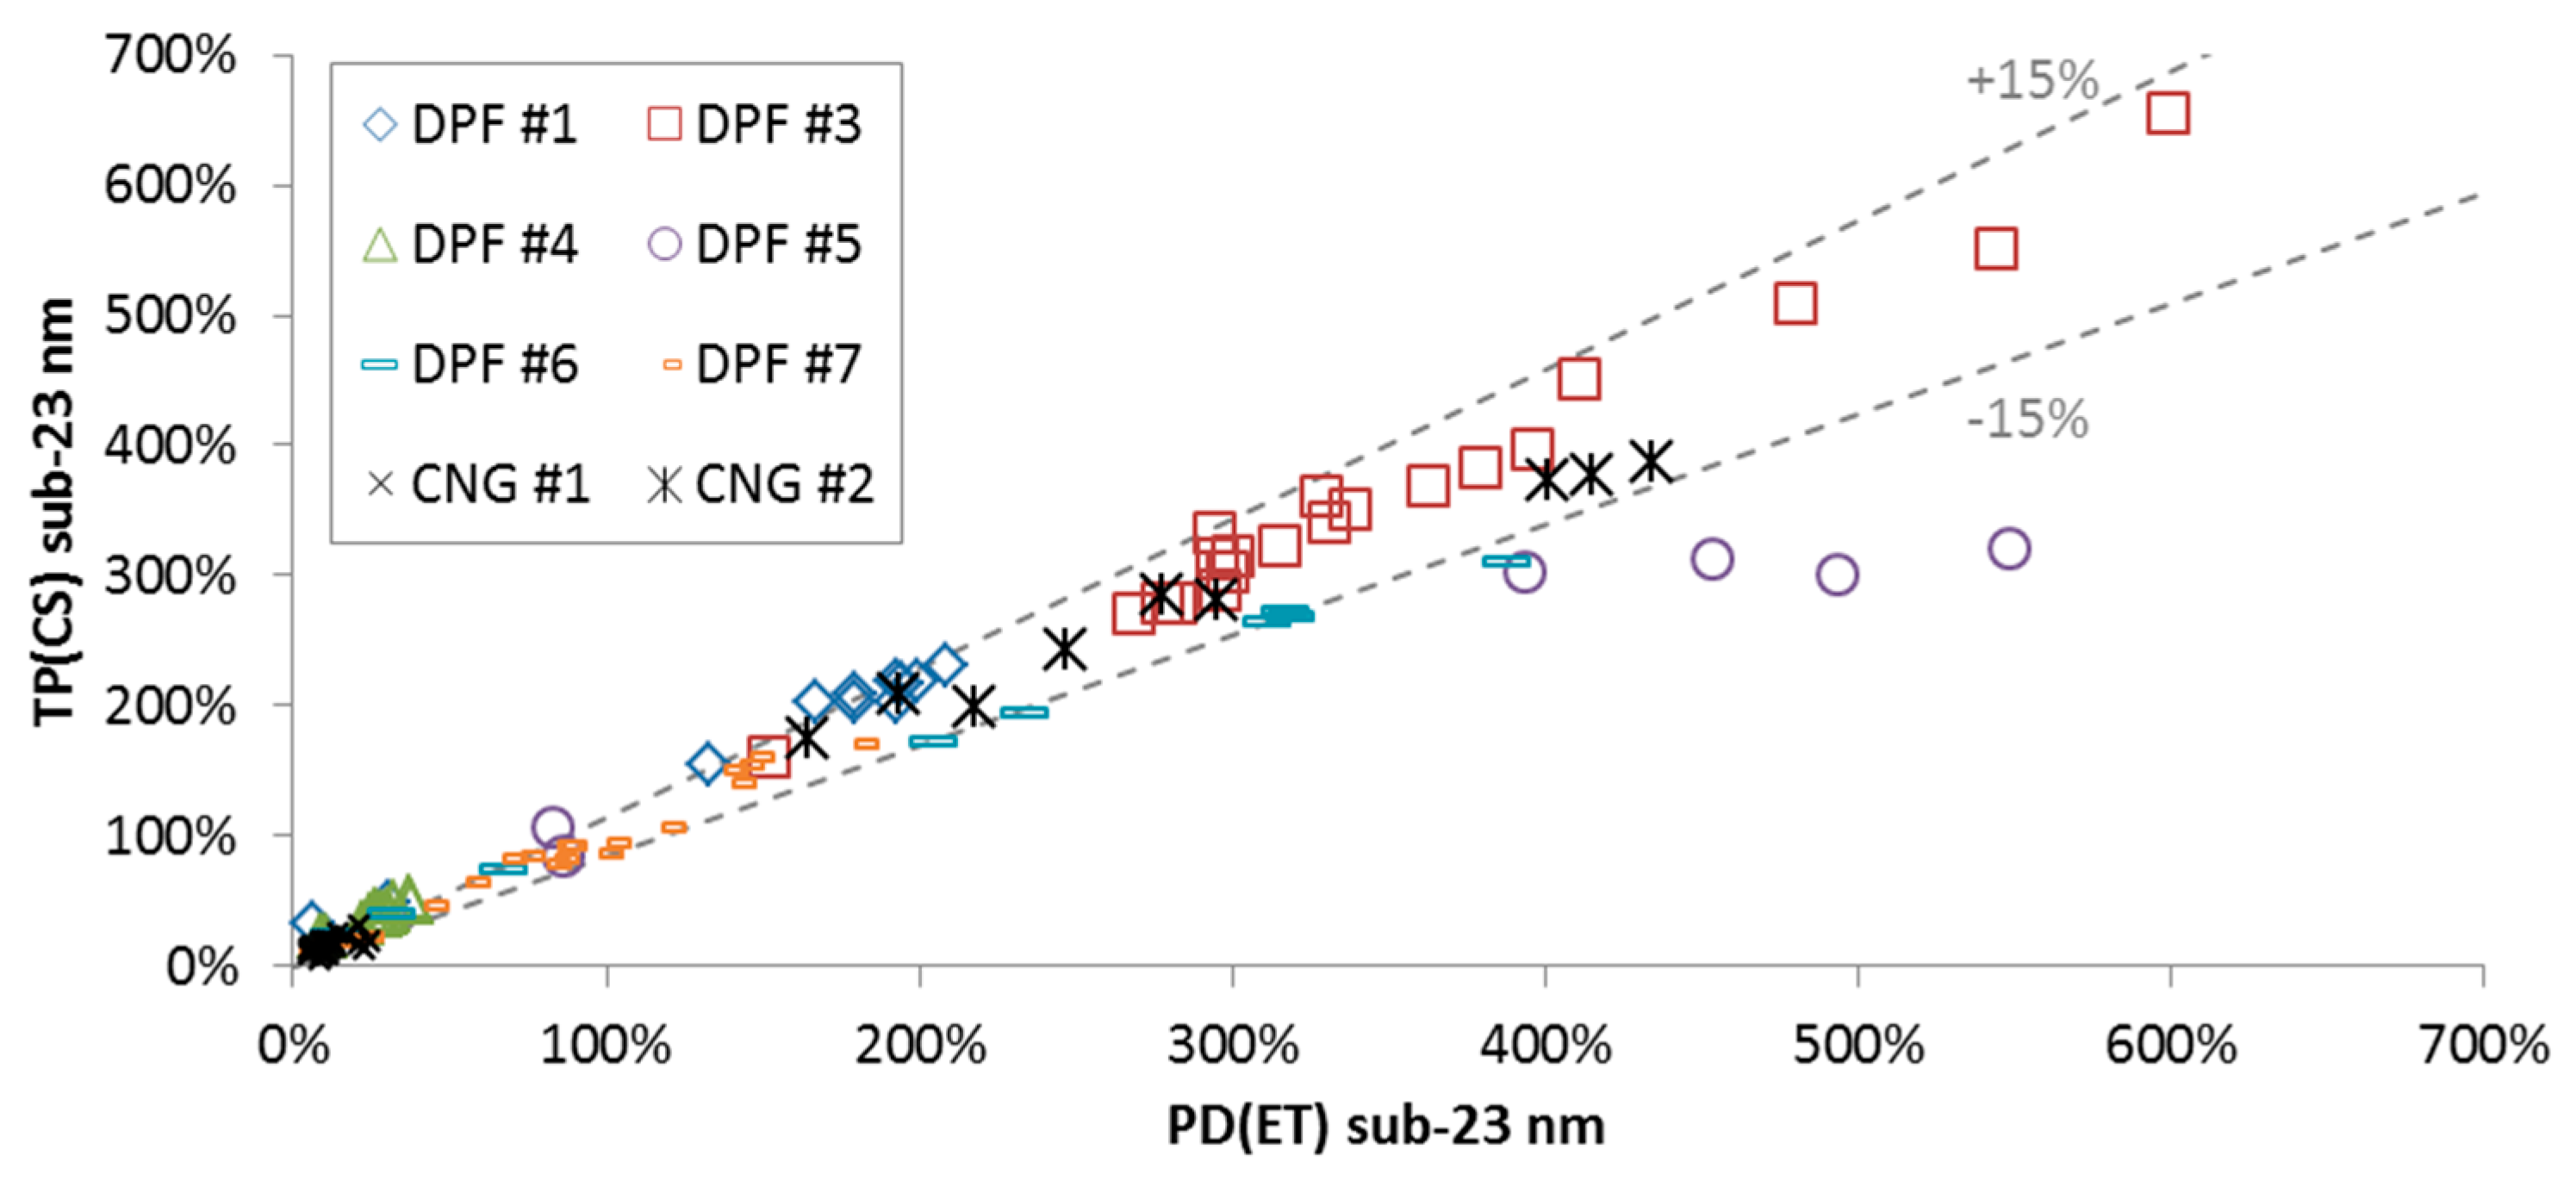
This section presents the correlation between the laboratories’ PMP systems with evaporation tubes connected to proportional partial flow dilution systems PD(ET) with the “Golden” particle counter with catalytic stripper connected directly to the tailpipe TP(CS). Figure A2 presents the results for particles >23 nm and Figure A2 for particles >10 nm. Each point is a test cycle (cold WHTC, hot WHTC, WHSC, NRTC, FTP, CO2 mapping).
Figure A2. Comparison of “Golden” system TP(CS) with instruments at proportional partial flow dilution systems PD(ET) with the CPCs measuring >23 nm. B7 = Diesel with 7% biofuel; CNG = Compressed natural gas; DPF = Diesel particulate filter; FAME = Fatty acid methyl esters.
Applsci 09 04418 g0a2
The differences were within −20% and +25% and there was no dependence on the cycle. For one engine the tests were further separated depending on the fuel that was used and the dilution factor (PCRF) of the TP(CS) system. For the >23 nm tests (Figure A2) there was no effect on the correlation from different fuel or dilution of the TP(CS) system. For the >10 nm tests (Figure A3) there was no effect of the fuel, but with higher PCRF the correlation moved to lower slope. Combining with Figure A2, this indicates that the sub-23 nm losses were higher with the higher PCRF. This means that, if future regulation keeps the definition of 30 nm, 50 nm, and 100 nm for the mean PCRF, the requirements for the sub-23 nm particle losses should be well defined. For the same PCRF though there was no influence of the fuels on the correlation between the two systems.
Figure A3. Comparison of “Golden” system TP(CS) with instruments at proportional partial flow dilution systems PD(ET) with the CPCs measuring >10 nm. Acronyms as Figure A2.
Applsci 09 04418 g0a3

References

  1. Guerreiro, C.; González Ortiz, A.; de Leeuw, F.; Viana, M.; Colette, A. European Environment Agency Air quality in Europe—2018 Report; Publications Office of the European Union: Luxembourg, 2018; ISBN 978-92-9213-989-6. [Google Scholar]
  2. Karagulian, F.; Belis, C.A.; Dora, C.F.C.; Prüss-Ustün, A.M.; Bonjour, S.; Adair-Rohani, H.; Amann, M. Contributions to cities’ ambient particulate matter (PM): A systematic review of local source contributions at global level. Atmos. Environ. 2015, 120, 475–483. [Google Scholar] [CrossRef]
  3. Thunis, P.; Degraeuwe, B.; Pisoni, E.; Trombetti, M.; Peduzzi, E.; Belis, C.; Wilson, J.; Clappier, A.; Vignati, E. PM2.5 source allocation in European cities: A SHERPA modelling study. Atmos. Environ. 2018, 187, 93–106. [Google Scholar] [CrossRef]
  4. Fang, X.; Li, R.; Xu, Q.; Bottai, M.; Fang, F.; Cao, Y. A Two-Stage Method to Estimate the Contribution of Road Traffic to PM2.5 Concentrations in Beijing, China. Int. J. Environ. Res. Public Health 2016, 13, 124. [Google Scholar] [CrossRef] [PubMed]
  5. Wagner, V.; Rutherford, D. Survey of Best Practices in Emission Control of in-Use Heavy-Duty Diesel Vehicles; The International Council on Clean Transportation: Washington, DC, USA, 2013. [Google Scholar]
  6. Giechaskiel, B.; Schindler, W.; Jörgl, H.; Vescoli, V.; Bergmann, A.; Silvis, W. Accuracy of Particle Number Measurements from Partial Flow Dilution Systems; SAE Technical Paper Series No. 2011-24-0207; SAE International: Warrendale, PA, USA, 2011. [Google Scholar]
  7. Giechaskiel, B.; Schwelberger, M.; Delacroix, C.; Marchetti, M.; Feijen, M.; Prieger, K.; Andersson, S.; Karlsson, H.L.; Massimo, M. Experimental assessment of solid particle number Portable Emissions Measurement Systems (PEMS) for heavy-duty vehicles applications. J. Aerosol Sci. 2018, 123, 161–170. [Google Scholar] [CrossRef]
  8. Andersson, J.; Mamakos, A.; Giechaskiel, B.; Carriero, M.; Martini, G. Particle Measurement Programme (PMP) Heavy-Duty Inter-Laboratory Correlation Exercise (ILCE_HD); Publications Office: Luxembourg, 2010; ISBN 978-92-79-17200-7. [Google Scholar]
  9. Giechaskiel, B.; Lähde, T.; Suarez-Bertoa, R.; Clairotte, M.; Grigoratos, T.; Zardini, A.; Perujo, A.; Martini, G. Particle number measurements in the European legislation and future JRC activities. Combust. Engines 2018, 174, 3–16. [Google Scholar]
  10. Khan, M.Y.; Sharma, S.; Liew, C.M.; Joshi, A.; Barnes, D.; Scott, N.; Mensen, B.; Cao, T.; Li, Y.; Shimpi, S.A.; et al. Comparison of Full Flow Dilution, Partial Flow Dilution, and Raw Exhaust Particle Number Measurements. Emiss. Control. Sci. Technol. 2018, 4, 103–112. [Google Scholar] [CrossRef]
  11. Giechaskiel, B.; Mamakos, A.; Andersson, J.; Dilara, P.; Martini, G.; Schindler, W.; Bergmann, A. Measurement of Automotive Nonvolatile Particle Number Emissions within the European Legislative Framework: A Review. Aerosol Sci. Technol. 2012, 46, 719–749. [Google Scholar] [CrossRef]
  12. Burtscher, H. Physical characterization of particulate emissions from diesel engines: a review. J. Aerosol Sci. 2005, 36, 896–932. [Google Scholar] [CrossRef]
  13. Sharma, V.; Uy, D.; Gangopadhyay, A.; O’Neill, A.; Paxton, W.A.; Sammut, A.; Ford, M.A.; Aswath, P.B. Structure and chemistry of crankcase and exhaust soot extracted from diesel engines. Carbon 2016, 103, 327–338. [Google Scholar] [CrossRef]
  14. Rothe, D.; Knauer, M.; Emmerling, G.; Deyerling, D.; Niessner, R. Emissions during active regeneration of a diesel particulate filter on a heavy duty diesel engine: Stationary tests. J. Aerosol Sci. 2015, 90, 14–25. [Google Scholar] [CrossRef]
  15. Giechaskiel, B.; Joshi, A.; Ntziachristos, L.; Dilara, P. European Regulatory Framework and Particulate Matter Emissions of Gasoline Light-Duty Vehicles: A Review. Catalysts 2019, 9, 586. [Google Scholar] [CrossRef]
  16. Giechaskiel, B.; Vanhanen, J.; Väkevä, M.; Martini, G. Investigation of vehicle exhaust sub-23 nm particle emissions. Aerosol Sci. Technol. 2017, 51, 626–641. [Google Scholar] [CrossRef] [Green Version]
  17. Giechaskiel, B.; Manfredi, U.; Martini, G. Engine Exhaust Solid Sub-23 nm Particles: I. Literature Survey. SAE Int. J. Fuels Lubr. 2014, 7, 950–964. [Google Scholar] [CrossRef]
  18. Giechaskiel, B. Solid Particle Number Emission Factors of Euro VI Heavy-Duty Vehicles on the Road and in the Laboratory. Int. J. Environ. Res. Public Health 2018, 15, 304. [Google Scholar] [CrossRef] [PubMed]
  19. Giechaskiel, B.; Drossinos, Y. Theoretical Investigation of Volatile Removal Efficiency of Particle Number Measurement Systems. SAE Int. J. Engines 2010, 3, 1140–1151. [Google Scholar] [CrossRef]
  20. Giechaskiel, B.; Martini, G. Engine Exhaust Solid Sub-23 nm Particles: II. Feasibility Study for Particle Number Measurement Systems. SAE Int. J. Fuels Lubr. 2014, 7, 935–949. [Google Scholar] [CrossRef]
  21. Giechaskiel, B.; Carriero, M.; Martini, G.; Bergmann, A.; Pongratz, H.; Joergl, H. Comparison of Particle Number Measurements from the Full Dilution Tunnel, the Tailpipe and Two Partial Flow Systems; SAE Technical Paper Series No. 2010-01-1299; SAE International: Warrendale, PA, USA, 2010. [Google Scholar]
  22. Giechaskiel, B.; Wang, X.; Horn, H.-G.; Spielvogel, J.; Gerhart, C.; Southgate, J.; Jing, L.; Kasper, M.; Drossinos, Y.; Krasenbrink, A. Calibration of Condensation Particle Counters for Legislated Vehicle Number Emission Measurements. Aerosol Sci. Technol. 2009, 43, 1164–1173. [Google Scholar] [CrossRef]
  23. Wang, X.; Caldow, R.; Sem, G.J.; Hama, N.; Sakurai, H. Evaluation of a condensation particle counter for vehicle emission measurement: Experimental procedure and effects of calibration aerosol material. J. Aerosol Sci. 2010, 41, 306–318. [Google Scholar] [CrossRef]
  24. Takegawa, N.; Sakurai, H. Laboratory Evaluation of a TSI Condensation Particle Counter (Model 3771) Under Airborne Measurement Conditions. Aerosol Sci. Technol. 2011, 45, 272–283. [Google Scholar] [CrossRef]
  25. Amanatidis, S.; Ntziachristos, L.; Giechaskiel, B.; Katsaounis, D.; Samaras, Z.; Bergmann, A. Evaluation of an oxidation catalyst (“catalytic stripper”) in eliminating volatile material from combustion aerosol. J. Aerosol Sci. 2013, 57, 144–155. [Google Scholar] [CrossRef]
  26. Wei, Q.; Oestergaard, K.; Porter, S.; Ichiro, A.; Adachi, M.; Montajir, R.M. Real-Time Measuring System for Engine Exhaust Solid Particle Number Emission—Design and Performance; SAE Technical Paper Series No. 2006-01-0864; SAE International: Warrendale, PA, USA, 2006. [Google Scholar]
  27. Giechaskiel, B.; Lähde, T.; Drossinos, Y. Regulating particle number measurements from the tailpipe of light-duty vehicles: The next step? Environ. Res. 2019, 172, 1–9. [Google Scholar] [CrossRef] [PubMed]
  28. Mohanta, L.; Iyer, S.; Mishra, P.; Klinikowski, D. Uncertainties in Measurements of Emissions in Chassis Dynamometer Tests; SAE Technical Paper Series No. 2014-01-1584; SAE International: Warrendale, PA, USA, 2014. [Google Scholar]
  29. Giechaskiel, B.; Chirico, R.; Decarlo, P.; Clairotte, M.; Adam, T.; Martini, G.; Heringa, M.; Richter, R.; Prevot, A.; Baltensperger, U.; et al. Evaluation of the particle measurement programme (PMP) protocol to remove the vehicles’ exhaust aerosol volatile phase. Sci. Total Environ. 2010, 408, 5106–5116. [Google Scholar] [CrossRef] [PubMed]
  30. Giechaskiel, B.; Arndt, M.; Schindler, W.; Bergmann, A.; Silvis, W.; Drossinos, Y. Sampling of Non-Volatile Vehicle Exhaust Particles: A Simplified Guide. SAE Int. J. Engines 2012, 5, 379–399. [Google Scholar] [CrossRef]
  31. Johnson, B.T.; Hargrave, G.K.; Reid, B.; Page, V.J. Crankcase Sampling of PM from a Fired and Motored Compression Ignition Engine. SAE Int. J. Engines 2011, 4, 2498–2509. [Google Scholar] [CrossRef] [Green Version]
  32. Uy, D.; Storey, J.; Sluder, C.S.; Barone, T.; Lewis, S.; Jagner, M. Effects of Oil Formulation, Oil Separator, and Engine Speed and Load on the Particle Size, Chemistry, and Morphology of Diesel Crankcase Aerosols. SAE Int. J. Fuels Lubr. 2016, 9, 224–238. [Google Scholar] [CrossRef]
  33. Bai, J.; Qiao, X. Crankcase gaseous and particle emissions in common rail diesel engine. Int. J. Engine Res. 2016, 17, 179–192. [Google Scholar] [CrossRef]
  34. Ruehl, C.; Smith, J.D.; Ma, Y.; Shields, J.E.; Burnitzki, M.; Sobieralski, W.; Ianni, R.; Chernich, D.J.; Chang, M.-C.O.; Collins, J.F.; et al. Emissions During and Real-world Frequency of Heavy-duty Diesel Particulate Filter Regeneration. Environ. Sci. Technol. 2018, 52, 5868–5874. [Google Scholar] [CrossRef]
  35. Giechaskiel, B.; Gioria, R.; Carriero, M.; Lähde, T.; Forloni, F.; Perujo, A.; Martini, G.; Bissi, L.M.; Terenghi, R. Emission Factors of a Euro VI Heavy-duty Diesel Refuse Collection Vehicle. Sustainability 2019, 11, 1067. [Google Scholar] [CrossRef]
  36. Quiros, D.C.; Yoon, S.; Dwyer, H.A.; Collins, J.F.; Zhu, Y.; Huai, T. Measuring particulate matter emissions during parked active diesel particulate filter regeneration of heavy-duty diesel trucks. J. Aerosol Sci. 2014, 73, 48–62. [Google Scholar] [CrossRef]
  37. Yoon, S.; Quiros, D.C.; Dwyer, H.A.; Collins, J.F.; Burnitzki, M.; Chernich, D.; Herner, J.D. Characteristics of particle number and mass emissions during heavy-duty diesel truck parked active DPF regeneration in an ambient air dilution tunnel. Atmos. Environ. 2015, 122, 58–64. [Google Scholar] [CrossRef]
  38. Smith, J.D.; Ruehl, C.; Burnitzki, M.; Sobieralski, W.; Ianni, R.; Quiros, D.; Hu, S.; Chernich, D.; Collins, J.; Huai, T.; et al. Real-time particulate emissions rates from active and passive heavy-duty diesel particulate filter regeneration. Sci. Total Environ. 2019, 680, 132–139. [Google Scholar] [CrossRef] [PubMed]
  39. Yamada, H.; Inomata, S.; Tanimoto, H. Mechanisms of Increased Particle and VOC Emissions during DPF Active Regeneration and Practical Emissions Considering Regeneration. Environ. Sci. Technol. 2017, 51, 2914–2923. [Google Scholar] [CrossRef] [PubMed]
  40. Giechaskiel, B. Differences between tailpipe and dilution tunnel sub-23 nm nonvolatile (solid) particle number measurements. Aerosol Sci. Technol. 2019, 53, 1012–1022. [Google Scholar] [CrossRef] [Green Version]
  41. Giechaskiel, B.; Bergmann, A. Validation of 14 used, re-calibrated and new TSI 3790 condensation particle counters according to the UN-ECE Regulation 83. J. Aerosol Sci. 2011, 42, 195–203. [Google Scholar] [CrossRef]
  42. Gao, Z.; Liu, S.X.; Mai, H.Z.; Hao, J.H. Research on the Full-Flow and Partial-Flow Dilution Sampling Systems for Exhaust Gas of Engine. Adv. Mater. Res. 2013, 718, 1394–1399. [Google Scholar] [CrossRef]
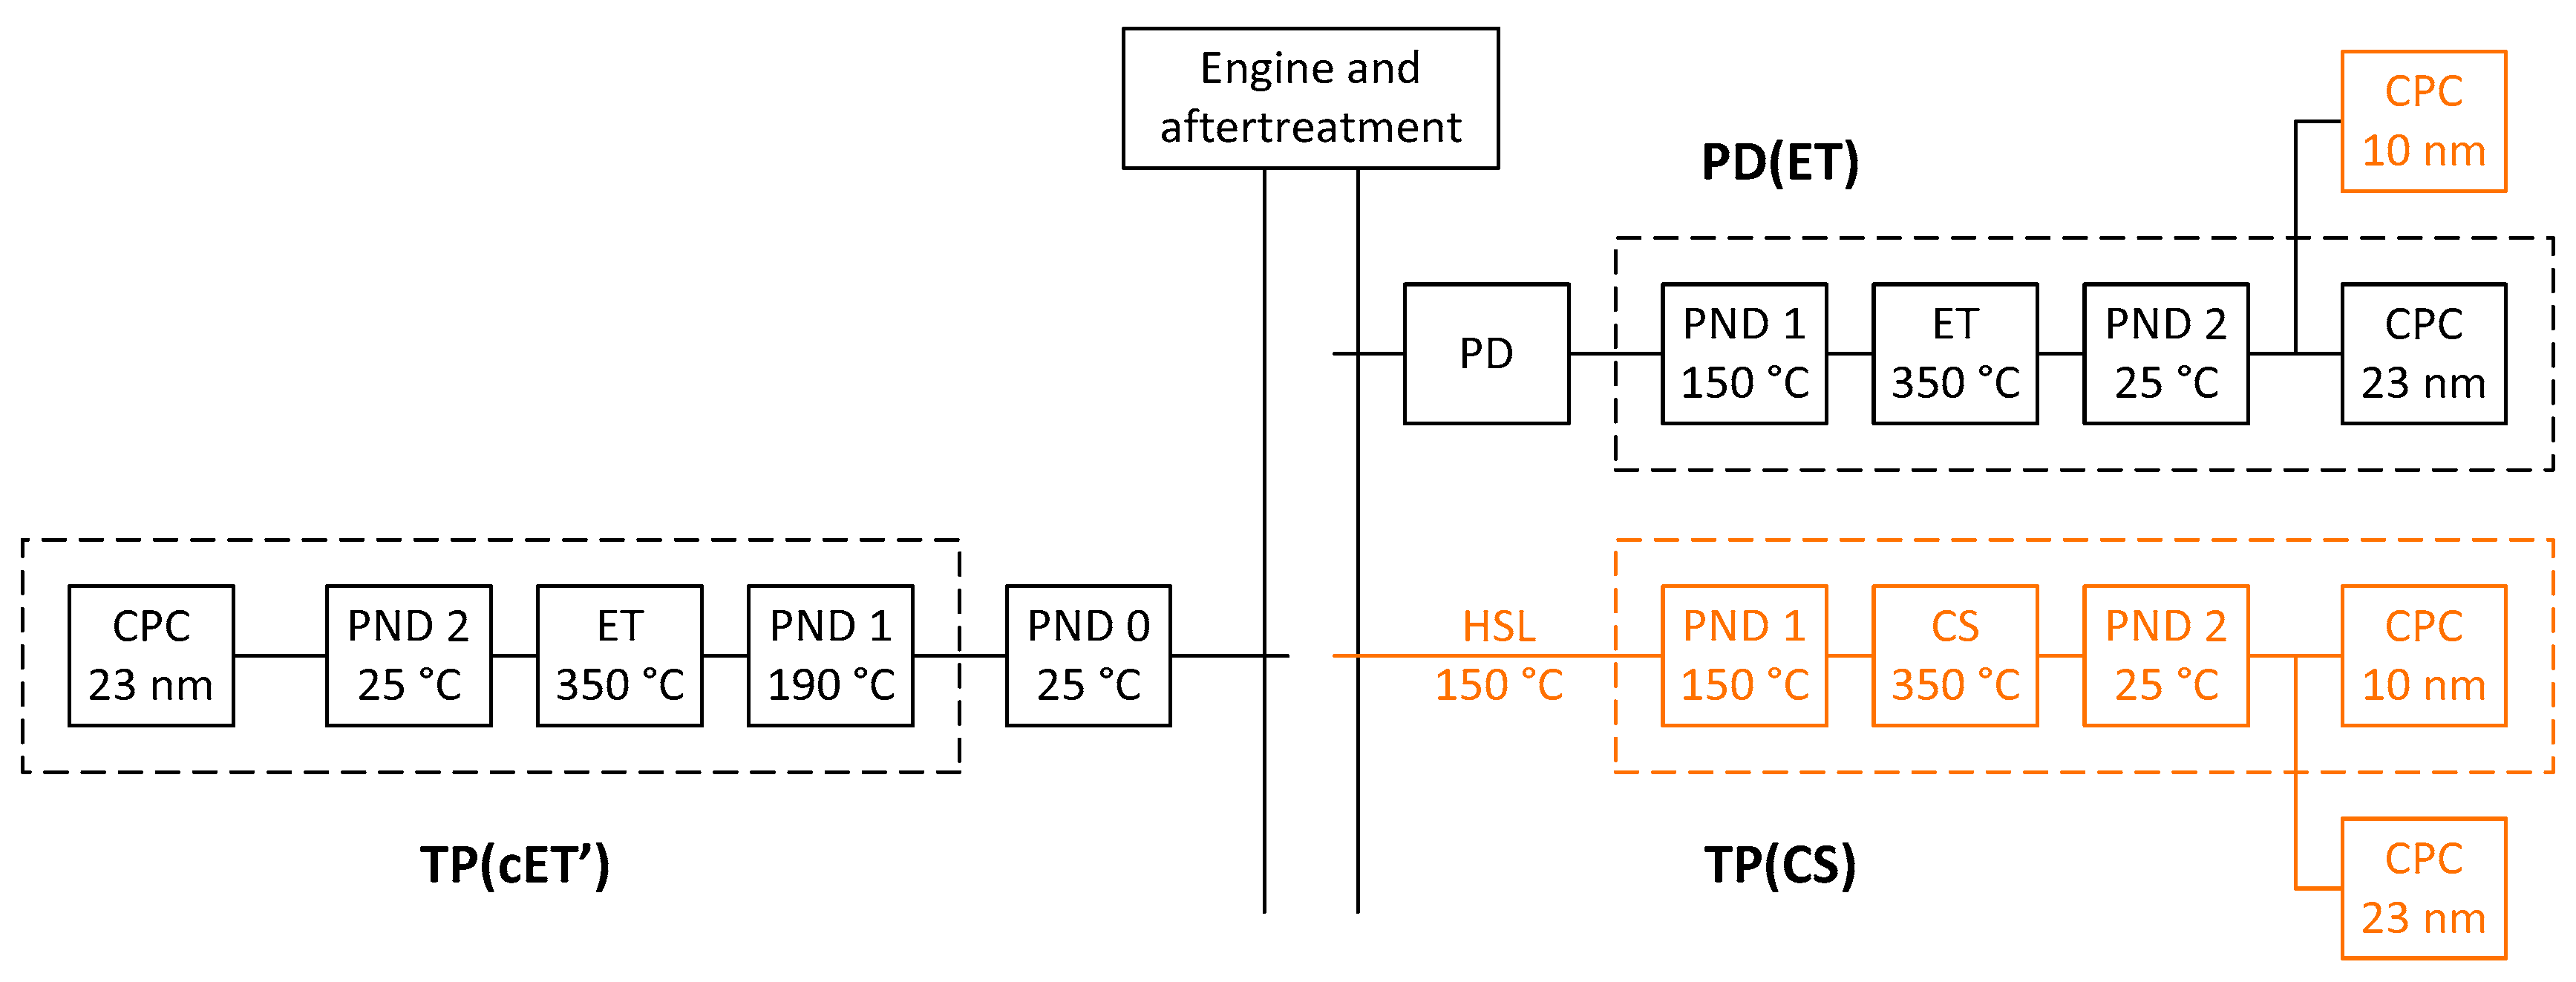
Figure 1. Experimental setup. “Golden” instruments in orange colour. CPC = Condensation particle counter; CS = catalytic stripper; ET = evaporation tube; PD = proportional partial flow dilution system; PND = particle number diluter.
Applsci 09 04418 g001
Figure 2. Differences of the “Golden” TP(CS) system to the OEMs’ PD(ET) systems for different lengths of the heated (150 °C) line upstream of the “Golden” system.
Applsci 09 04418 g002
Figure 3. Solid particle number (SPN) emissions with and without the crankcase ventilation connected downstream of the aftertreatment devices, as measured with the “Golden” TP(CS) system for three diesel engines. Numbers give the additional 10–23 nm particles compared to the >23 nm levels. Error bars show one standard deviation of 2–3 tests. The inset compares the sub-23 nm percentages of the TP(CS) and PD(ET) systems with and without the crankcase ventilation connected for DPF #4 and DPF #7. WHTC = World harmonised transient cycle; WHSC = World harmonised stationary cycle; h = hot; c = cold.
Applsci 09 04418 g003
Figure 4. Solid particle number (SPN) emissions during one non-regenerating (symbol nR) and 2 or 3 regenerating (symbol R) hot start WHTCs measured with the “Golden” system with catalytic stripper (CS) and the PMP system with evaporation tube (ET, bold) connected both at the proportional partial flow system (PD, dark colours) for DPF #3, both at the tailpipe (TP, light colours) for DPF #5, one at the tailpipe and the other at the PD for DPF #4 and DPF #1. Numbers give the difference of the CS system compared to the ET system for 23 nm and 10 nm measurements.
Applsci 09 04418 g004
Figure 5. Real time solid particle number (SPN) emissions > 10 nm (a) during the last 600 seconds the first and (b) third regenerating hot start WHTCs measured with the “Golden” system with catalytic stripper at the tailpipe TP(CS) and the PMP system with evaporation tube at the proportional partial flow system PD(ET) for DPF #4. PCRF = Particle number concentration reduction factor.
Applsci 09 04418 g005
Figure 6. Sub-23 nm percentages determined with the “Golden” system with catalytic stripper at the tailpipe TP(CS) and the PMP system with evaporation tube at the proportional partial flow system PD(ET) for various tests and engines.
Applsci 09 04418 g006
Figure 7. (a) Repeatability, expressed as coefficient of variance (CoV) of 2–3 repetitions, when available. (b) Solid particle number (SPN) emissions given by the laboratories particle system with evaporation tube (ET) connected to the proportional partial flow dilution system (PD) (columns with dark colours) and the “Golden” particle system with catalytic stripper (CS) connected to the tailpipe (TP) (columns with light colours). Emissions >23 nm in red and 10–23 nm in blue. Percentages in black give the 10–23 nm emissions compared to the >23 nm emissions. In the middle, numbers give the differences of the TP system compared to the PD system for the >23 nm and >10 nm emissions.
Applsci 09 04418 g007
Figure 8. Comparison of >23 nm emissions measured with the system with cold pre-diluter at the tailpipe TP(cET’) with (a) the PMP system with evaporation tube at the proportional system PD(ET), (b) the “Golden” system with catalytic stripper at the tailpipe TP(CS) for various tests and engines.
Applsci 09 04418 g008
Figure 9. Comparison of >23 nm emissions measured with the PMP system with evaporation tube and a cold pre-diluter at the tailpipe TP(cET’) or at the proportional partial flow dilution system without pre-diluter PD(ET’) with the PMP system of the laboratory with evaporation tube connected to the tailpipe TP(ET) or the “Golden” system with catalytic stripper connected to the tailpipe TP(CS). Error bars show one standard deviation of 2–9 repetitions (given by the number in the bars).
Applsci 09 04418 g009
Table 1. Test protocol. Y = Yes.
Investigated ConditionsDPF #1DPF #2DPF #3DPF #4DPF #5DPF #6DPF #7CNG #1CNG #2
Extra cyclesY-YYYYYY-
CrankcaseY--Y--Y--
RegenerationY-YYY----
Biofuel--Y------
Sampling line-YY-----Y
Extra tailpipe--Y-YYY-Y
Parallel check-YY-YY--Y