1. Introduction
There are three vision states for human beings, photopic vision with luminance values >5 cd/m
2, mesopic vision with luminance values from 0.005 to 5 cd/m
2, and scotopic vision with luminance values <0.005 cd/m
2 [
1]. The luminance of values of several scenes, like roads, tunnels, and dashboard lightings, likely fall in the mesopic vision range. To measure light source performances in mesopic vision states, the scotopic/photopic ratio (
S/
P ratio) is used [
2]. Effectively, this is the ratio of the luminous efficacy of radiation (LER) in scotopic and photopic vision. There are two photopic spectral sensitivity curves (SSCs): one is the Commission Internationale de l´Eclairage (CIE) 1924 2-degree standard observer SSC [
3] and the other is the CIE 1964 10-degree standard observer SSC [
4]. Some studies claim that the 10-degree SSC constitutes a better representation [
5]. Prior research studies on colour differences also show that 10-degree colour matching functions yield smaller colour differences than 2-degree colour matching functions [
6]. Another study [
7] suggested that there may be problems in the short-wavelength part of the 2-degree SSC. In road lighting, visual tasks sometimes require large visual fields, while peripheral vision is also important [
8,
9,
10]. The rod photoreceptors are mainly distributed in the part of the retina associated with peripheral vision. We may thus conclude that both the 10- and 2-degree systems should be considered for uses in various applications [
11].
CIE recommended mesopic vision models for road lighting [
2] and published guidelines on how to use the model [
12]. However, CIE did not recommend which SSC should be adopted for calculation, implying that either SSC type can be used in applications. In most of the published research studies and practical applications, the 2-degree SSC system has been used. Berman [
13] reported S/P ratios of 16 typical light sources in the range from 0.23 to 2.47. Lita et al. [
14] reported a light source with an S/P ratio of 2.56 at a correlated colour temperature (CCT) of 5368 K. Nizamoglu et al. [
15] reported a white-light emitting diode (WLED) with an S/P ratio of 3.04 at the extremely high CCT of 45000 K. Guo et al. [
16] proposed light-emitting diodes (LEDs) for CCTs from 2700 K to 45000 K with
S/
P ratios in the range from 1.83 to 3.84. Zan et al. [
17] reported WLEDs that reached S/P ratios from 1.54 to 3.84, which corresponded to CCTs in the range from 2700 K to 7580 K. Li et al. [
18] reported two-hump quantum-dot-based LEDs that reached an
S/
P ratio value of 2.09 at 4038 K, and a four-hump LED that reached an
S/
P ratio value of 3.08 at 5015 K. Zhang et al. [
19] optimised hybrid white LEDs for high
S/
P ratios at varying CCTs that reached high colour rendition, and compared their differences. Despite the fact that in some studies it has not been mentioned which SSC was used, we rechecked the spectra in the literature and have confirmed that most studies have used 2-degree SSCs. To date, no study has compared the differences of the calculations of
S/
P ratios using these two SSCs. In practical applications, there are urgent needs for large-scale assessments of urban lighting [
20] and nightscape lighting. However, there are some unsolved technical issues to assure photopic adaptation luminance [
21,
22], which may cause inaccuracy in assessments.
In this study, we examined the differences of the calculated
S/
P ratios with two SSCs based on tests with more than 300 light sources [
23] with CCTs from 2000 K to 8000 K, and with blackbody radiant (BR) light sources with CCTs from 10000 K to 45000 K. We calculated the mesopic luminance levels at photopic adaptation luminance levels from 0.005 to 5 cd/m
2 based on the use of the two tested SSCs and compared the differences. Conversion coefficients between the S/P ratio and mesopic luminance calculated using 2- and 10-degree SSCs were proposed. The work may help elucidate the S/P ratios and mesopic luminance differences calculated with these two different SSCs in research studies, and provide convenient conversions in practical applications.
2. S/P Ratio of Monochromatic Spectra
The
S/P ratio was calculated by dividing the LER in scotopic vision (LER
s) by that in photopic vision (LER
p). LER
p was defined by Equation (1), LER
s was defined by Equation (2), and the
S/
P ratio, which can also be expressed as a quotient in the form of
Rsp [
12], was defined with the use of Equation (3). Herein,
P(
λ) represents the spectral power distribution (SPD) of the light source,
Km is the maximum photopic luminous efficacy of 683 lm/W at 555 nm, and
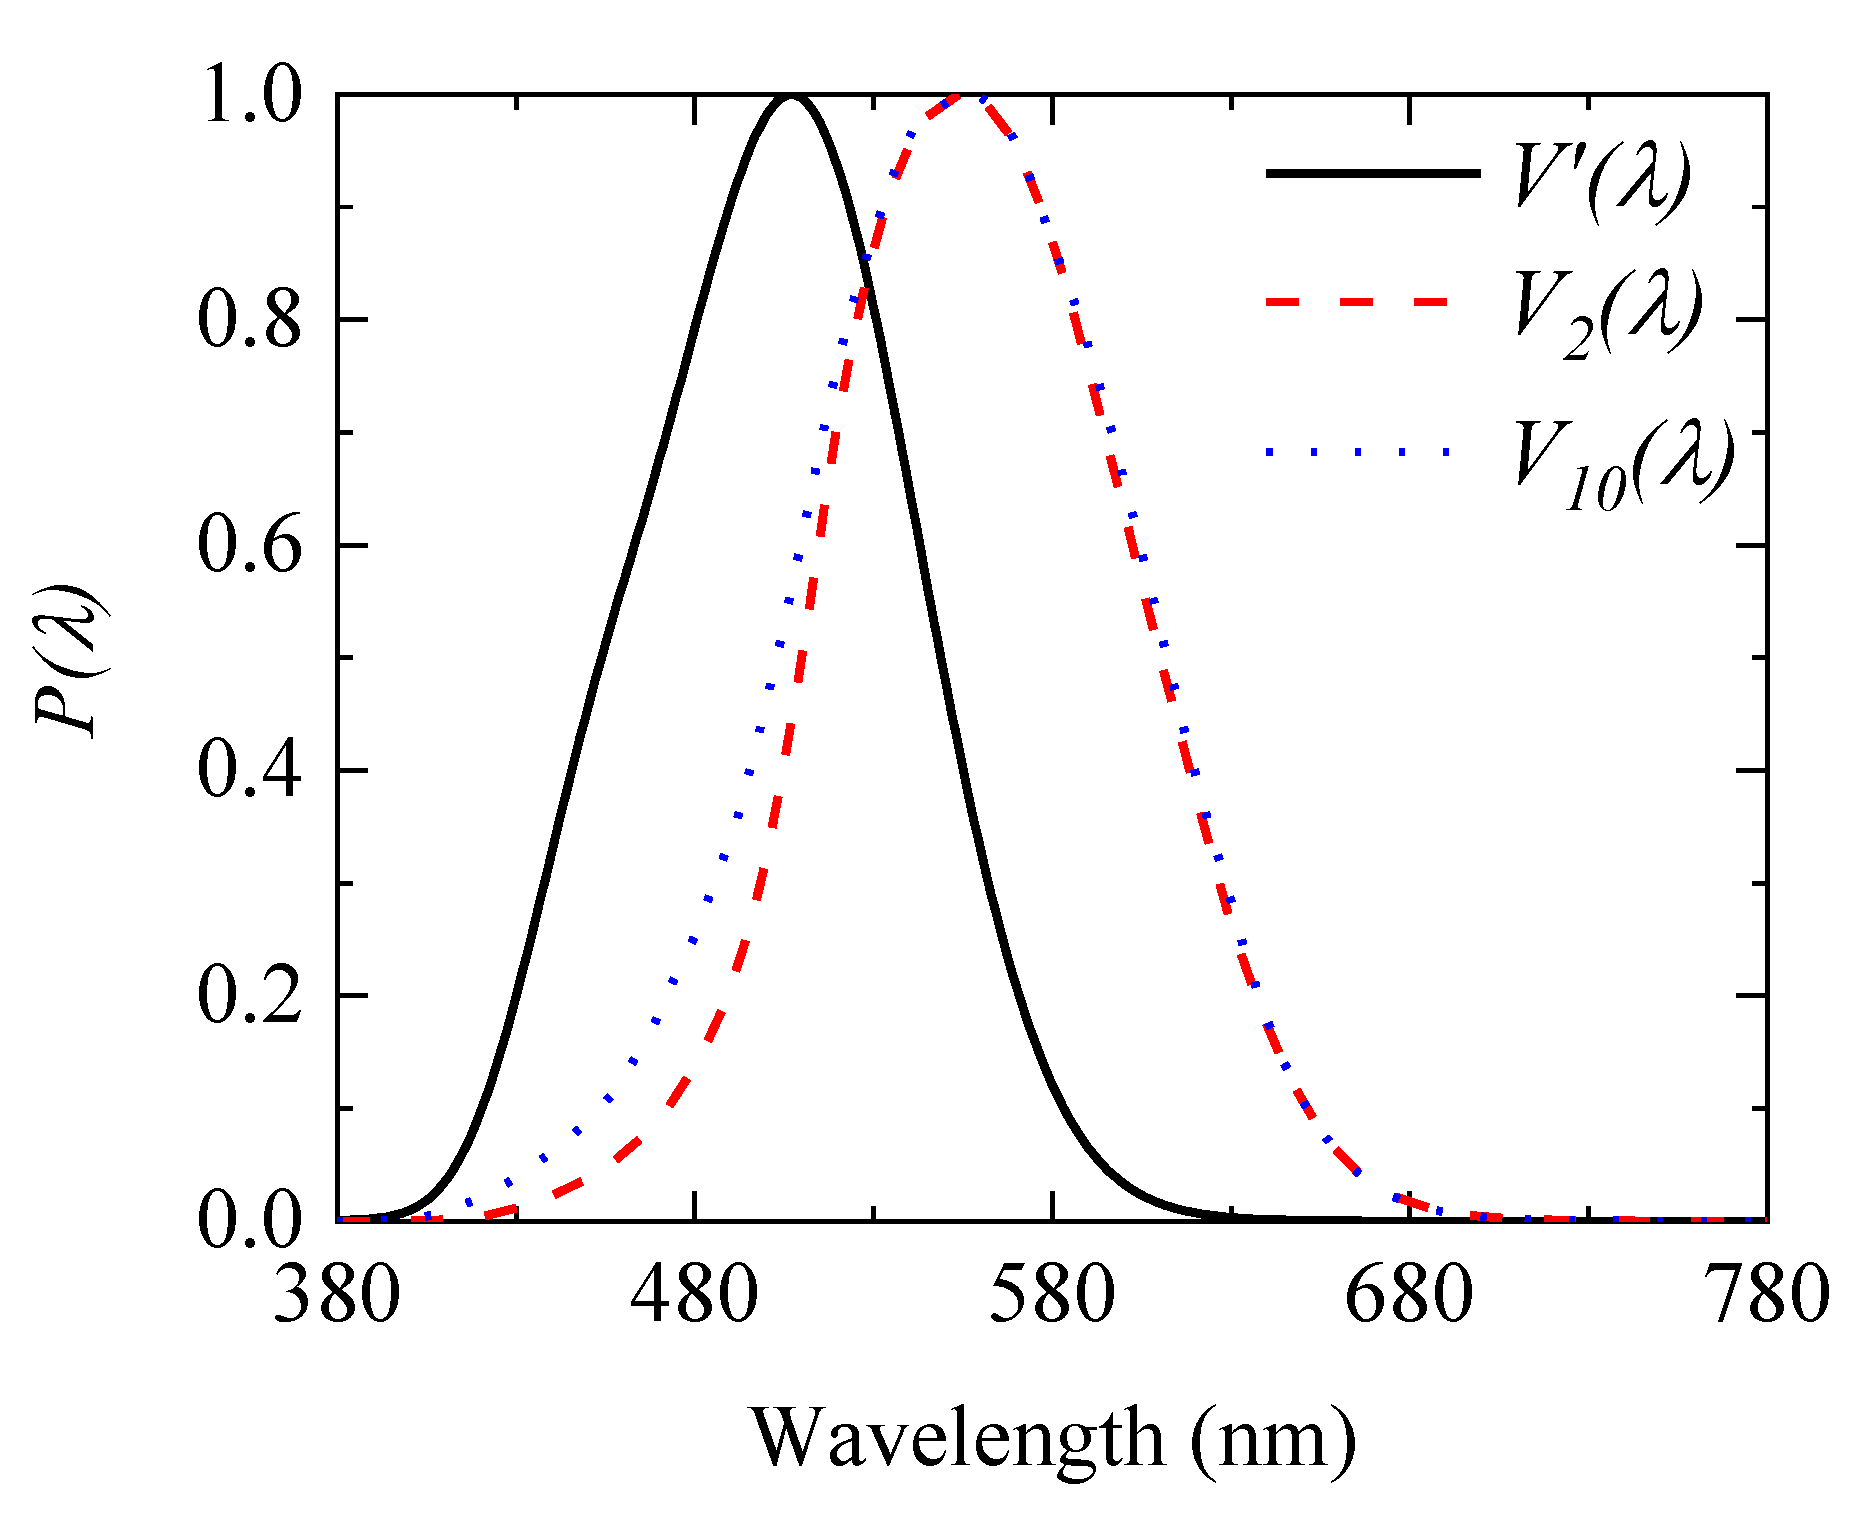
Km is the maximum scotopic luminous efficacy of 1700 lm/W at 507 nm. Accordingly,
V(
λ) is the SSC for photopic vision. Therefore, in the calculations, we used
V2(
λ) to denote the 2-degree and
V10(
λ) to denote the 10-degree systems, respectively.
V’(
λ) is the SSC for scotopic vision. Both
V(
λ) and
V’(
λ) are shown in
Figure 1.
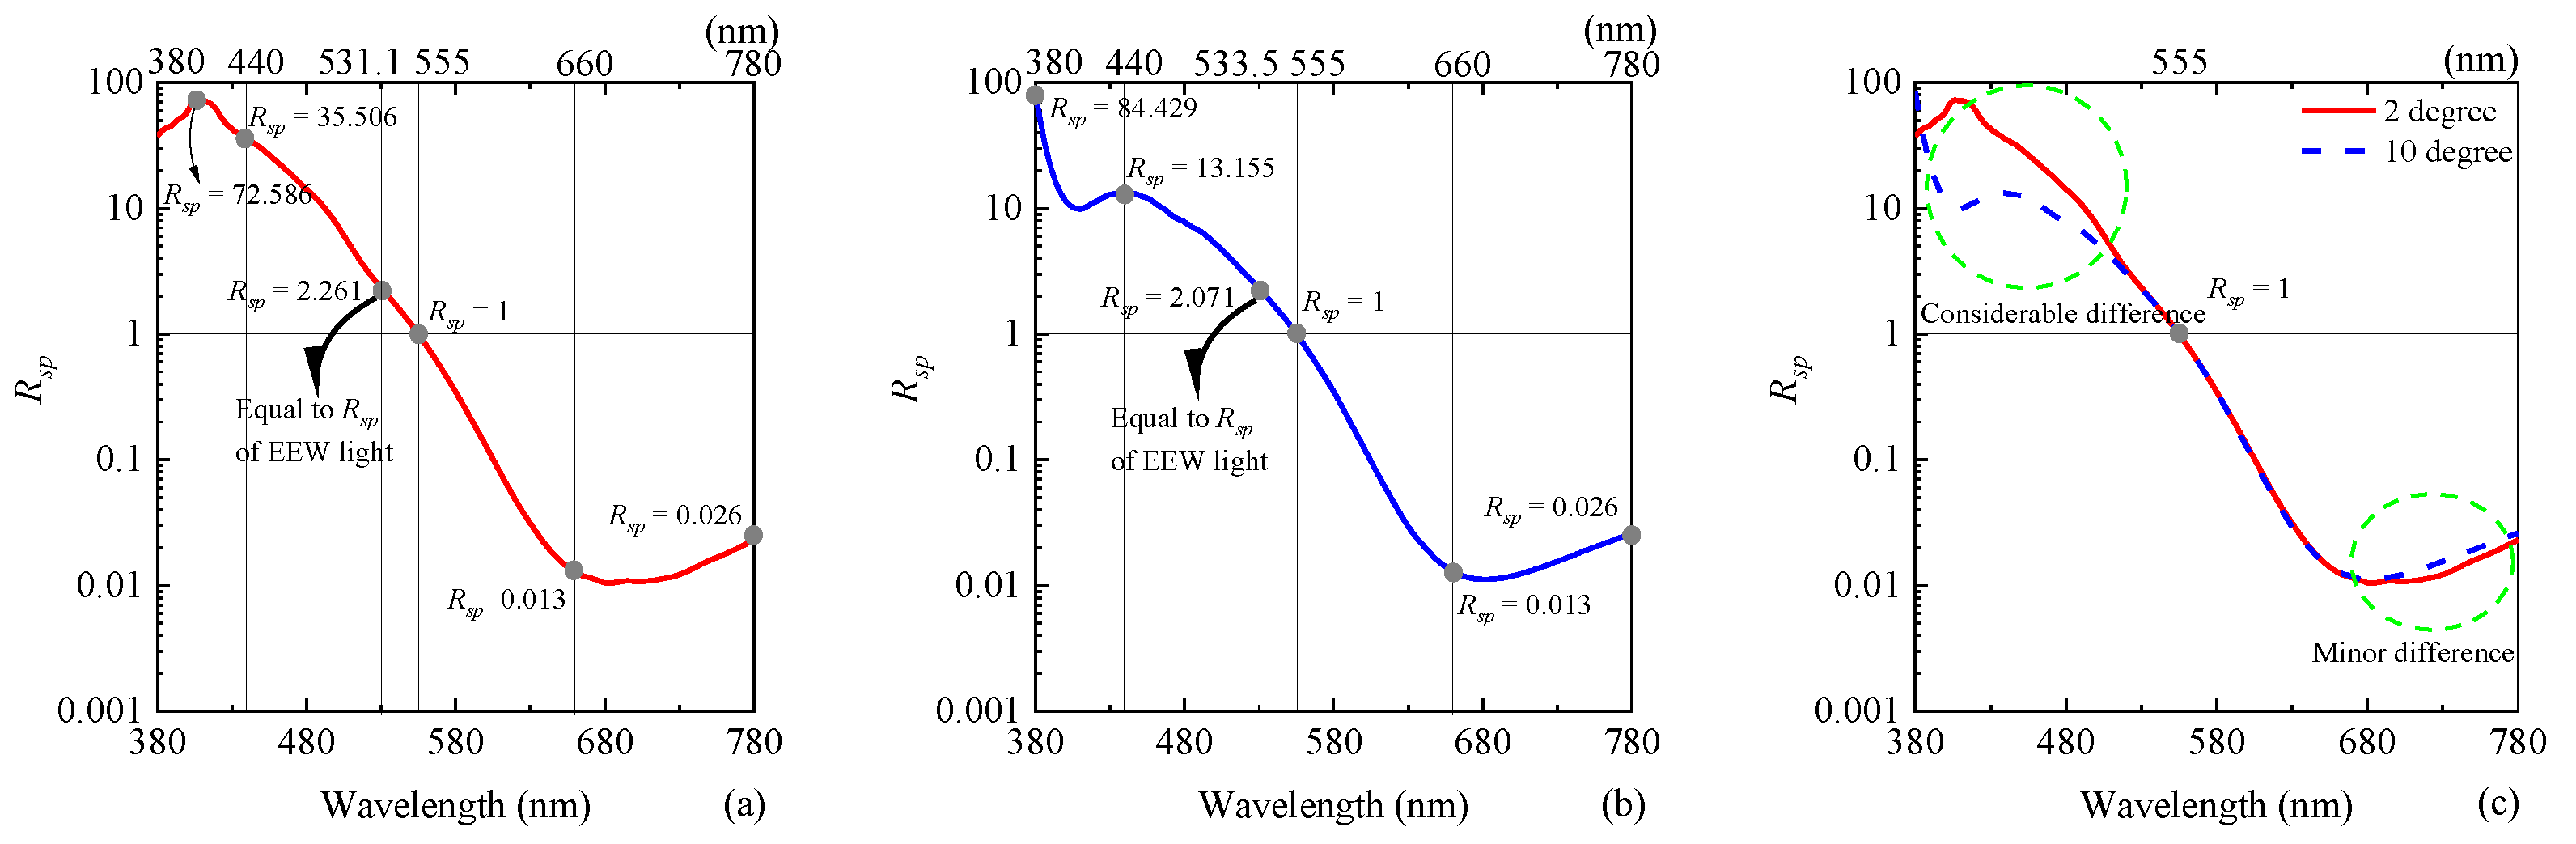
To compare the
S/
P ratio differences at each wavelength, we calculated the
S/
P ratios of monochromatic wavelengths for a full width at half maximum (FWHM) distance of 1 nm, from 380 to 780 nm, as shown in
Figure 2. The
S/
P ratio of an equal energy white (EEW) light calculated using 2-degree SSC is 2.261 and 10-degree is 2.071, and the difference is approximately 9%. It is clearly noted that the main differences appear in the short-wavelength range (<500 nm).
3. Relation of S/P Ratios of Light Sources Using 2-degree and 10-degree SSCs
Monochromatic spectra calculated for the
S/
P ratios in
Section 2 are considered extreme conditions. In this section, we investigated a set that contained more than 300 light sources. Most of these were commercial light sources. These light source data were presented in the Illuminating Engineering Society of North America (IES-30-15. 2015), including incandescent lamps, fluorescent lamps, high-intensity discharge lamps, and LEDs. The CCTs of these light sources ranged from 2000 to 8000 K. The SPDs were normalised to a maximum intensity of unity. The mean SPD is shown in
Figure 3. We calculated
S/
P ratios of these light sources using both 2- and 10-degree SSCs.
Figure 4 shows that the
S/
P ratio was calculated in the plot of the 10-degree against the 2-degree SSC system. The relation is fitted well by a linear function with a high coefficient of determination, R
2 = 0.999. The slope of the linear function is approximately equal to the ratio of the EEW light, which is equal to 2.071/2.261 0.916. We can use 0.916 as the conversion coefficient for the transformation of the results calculated with the use of the 2- and the 10-degree SSCs.
Due to the fact that there are no differences in the responses for scotopic vision, the S/P ratio difference is caused by the difference of LERp. Although considerable differences may exist for S/P ratios, the differences for mesopic luminance values may not be as considerable. We should further examine the mesopic luminance values transformed from photopic adaptation luminance levels in mesopic vision states.
7. Discussion and Conclusion
In many applications, the 2-degree SSC was used for the calculation of the LER and S/P ratio. However, in some applications, a large visual field was required, and a 10-degree SSC was more reasonable. We analysed the difference between these two SSCs based on an investigation of more than 300 light sources and extremely high CCT BR sources.
Comparison of the S/P ratios calculated using monochromatic light sources yielded considerable differences in the short-wavelength region (<500 nm). Light sources operating at high CCT values will likely cause considerable differences. In the very short-wavelength range (<430 nm), the S/P ratio increased abruptly. However, human eyes are not sensitive to changes in this region, and the precision of SSCs cannot guarantee the precision of the extremely high S/P ratio.
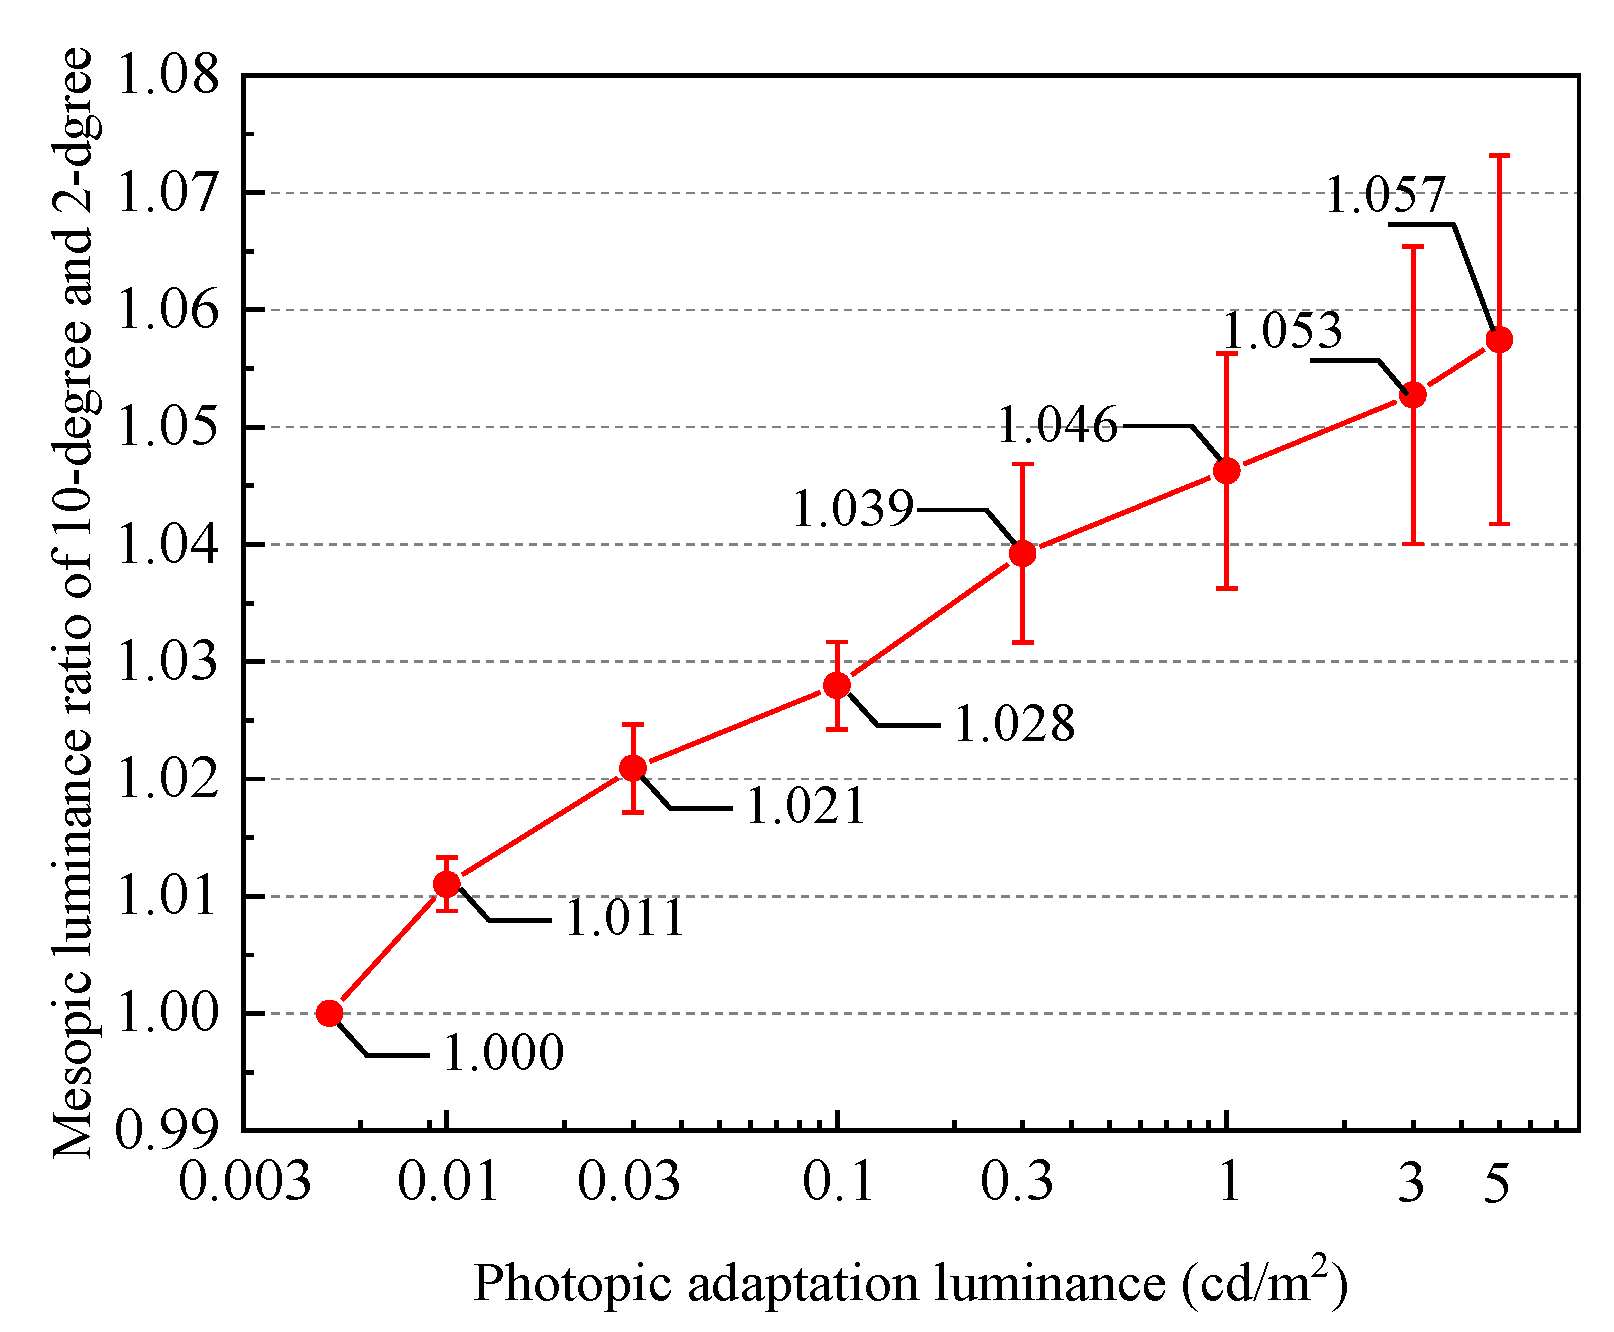
In the mesopic vision range, the differences in the mesopic luminance values of the 300 light sources calculated with the two SSCs increased as the photopic adaptation luminance values increased. In the scotopic vision cases, the same SSC V’(λ) was applied and there were no differences. In photopic vision cases, the average difference reached a value of ~6%. For some practical road lighting applications with luminance values less than 1 cd/m2 and with moderate CCTs at approximately 4000 K, the difference of the corrected mesopic luminance values based on the two different SSCs studied herein was approximately 3%. For high CCT values (>6000 K), light sources, and high luminance levels (>1 cd/m2), the difference may reach 5%.
Accordingly, as the differences of the two SSCs increase, the CCTs of the light sources also increased. The differences were relatively small and with values <5% for light sources operating with CCTs in the range from 2000 to 8000 K. For CCTs > 10000 K, the error at some mesopic luminance levels reached values >10%. In some research work, CCT light sources with extremely high S/P ratios have been reported. The S/P ratios for these light sources calculated using the two SSCs are so different that they require further analyses. For some special applications, like dashboard illumination in driving cabins and landscape lightings, blue LEDs might be used. Accordingly, considerable differences may be evoked. However, a few light sources applied in functional lighting operate at extremely high CCTs.
Generally, the average difference of the S/P ratio is approximately 8% for light sources operating at CCTs in the range from 2000 to 8000 K. The mesopic luminance values, which are related to both the photopic adaptation luminance and CCT, do not yield considerable S/P ratio differences. For functional lighting, the photopic adaptation luminance is the main reason for the evoked differences.
In summary, several valuable inferences were drawn based on the findings of this study. Firstly, in most conditions, to transform the S/P ratio calculated using the 2- and 10-degree SSC outcomes, a conversion coefficient equal to 0.916 should be used. Secondly, in most practical applications, the difference of the calculated mesopic luminance using 2- and 10-degree SSCs was approximately in the range of 3%–5%, and the conversion coefficients ranged from 1.03 to 1.05. Thirdly, for applications with CCTs > 10,000 K, and for luminance values >1 cd/m2, the differences may be >10%, and mesopic luminance should be calculated using suitable SSCs.
Most urban lighting scenes, such as road lighting and tunnel lighting, are in the mesopic vision range, and in the nightscape lighting. Most of these lighting scenes require large visual field, while others may require small visual fields to observe. Applying the suitable SSC to reach more precise assessments could help improve the lighting design, yield a smaller energy consumption, and reduce the risk of potential light pollutions.
There are some limitations associated with this study. Firstly, it is difficult to determine a very precise photopic adaptation luminance for complex luminance distributions because adaptation luminance may be related to luminance distributions, eye movements, and surrounding luminance effects [
21]. Secondly, the adaptation luminance determined from 2-degree and 10-degree visual fields should be different, because the visual angles and adaptation fields [
12] are different. The CIE TN 007:2017 recommends the adaptation field to be taken as the design area, and the adaptation luminance as the average luminance of the adaptation field. This is not applicable to designing suitable adaptation fields for each observation point when assessing a large-scale urban lighting scene. There is no feasible way at present to apply a suitable adaptation luminance for the entire road. Therefore, in this work, we only consider the SSC as the factor influencing photopic adaptation luminance and adopt a local photopic adaptation luminance for each observation point.

