Abstract
The use of heavy metals in technological applications has led to detrimental effects on human health and the environment. Activated carbon and ion-exchange resins are commonly used to remove pollutants but they are expensive. Therefore, the research of low-cost alternatives derived from natural resources and organic wastes is being considered. The aim of this study considers the use of Calcium Alginate/Spent Coffee Grounds (CA–SCGs) composite beads to adsorb heavy metals from aqueous solutions, particularly, the removal of Ni2+ or Cd2+ at concentrations from 10 ppm to 100 ppm. CA–SCGs beads were made of equal proportions of alginate and spent coffee grounds and compared with calcium alginate beads (CA beads) and spent coffee grounds (SCGs) in terms of capacity and rate of adsorption. Three cycles of adsorption/desorption were done. The beads were characterized by Scanning Electron Microscopy coupled with an energy-dispersive X-ray spectroscopy (SEM–EDX), Fourier-transform infrared spectroscopy (FT–IR), Raman spectroscopy, and point of zero charge. Langmuir, Freundlich, and Sips models, and a pseudo-second-order kinetic equation were used. Sips model showed the best correlation with the adsorption of CA–SCGs beads with capacities of adsorption of 91.18 mg/g for cadmium and 20.96 mg/g for nickel. CA–SCGs beads had a greater adsorption than the CA beads, achieving adsorption percentages close to 100% than alginate alone, showing their effectiveness in heavy metal removal.
1. Introduction
Heavy metals can be described as metallic elements that have a relatively high density compared to water, but the definition also includes metalloids, such as arsenic. The use of heavy metals in industrial, domestic, agricultural, medical, and technological applications have led to their release in the environment with potential effects on human health and the environment [1]. Known heavy metals are cadmium, chromium, mercury, lead, cobalt, nickel, and so forth; these metallic ions are toxic and pose severe effects on human health. Cadmium is released to the environment in industrial processes such as smelting, alloy manufacturing, and pesticides. Anthropogenic activities such as improper disposal of unused paints, fertilizers, and Ni/Cd batteries are also sources of cadmium contamination [2]. Cadmium affects cell proliferation, differentiation, and apoptosis, therefore interacting with DNA repair mechanisms, the generation of reaction oxygen species (ROS) and the induction of apoptosis [3]. On the other hand, nickel does not raise the same environmental concern than cadmium and it is widely used, mainly in stainless steel. Nevertheless, nickel compounds are classified as human carcinogens based on increased respiratory cancer risks [4]. The International Agency for Research on Cancer (IARC) has determined that some nickel compounds are carcinogenic to humans and that metallic nickel may possibly be carcinogenic to humans. The Environmental Protection Agency of the United States (EPA) has determined that nickel refinery dust and nickel subsulfide (Ni3S2) are human carcinogens. EPA recommends that drinking water should contain no more than 0.1 milligrams of nickel per liter of water (0.1 ppm) [5]. EPA has set the limits of cadmium in drinking water in 0.005 ppm.
Activated carbon and ion-exchange resins are commonly used to remove pollutants but they are expensive materials, therefore the elimination of pollutants from water has been focusing recently in the research of low-cost alternatives, such as forestry wastes, agricultural residues, marine materials, accessible minerals, or waste minerals. Waste minerals from construction work such as dolomite (cadmium sorption of 89.9 mg/g) are inexpensive adsorbents and they do not have any other practical application [6]. In the same way, synthetic mineral adsorbents made from waste material such as zeolite synthetized from fly ash product of power generation by coal (copper sorption of 4.99 mg/g) is another example of a raw material without additional applications [7]. Accessible clay minerals such as glauconite (cadmium sorption of 2.596 mg/g) have the advantage that are natural, locally available, commonly occurring materials and could be reused as a sustainable and environment-friendly building material [8]. A good adsorbent should have high surface area, high adsorption capacity, mechanical stability, and an easy regeneration. The research in low-cost adsorbents could bring a good adsorbent that is an inexhaustible, cheap, and, mostly, a non-hazardous material [9]. The agricultural residues are an example of low-cost adsorbents; the agricultural by-products are another cause of environmental concern because their disposal requires careful treatment as other pollutants. Coffee drinks are one of the most popular beverages worldwide; therefore, a significant quantity of by-products is generated. A significant amount of literature on sorption of pollutants by coffee residues is available, but comparative analysis between studies is difficult due to the absence of a uniform protocol. However, one characteristic that is always observed is the rapid initial phase of adsorption that is predominant throughout the process [10]. This is an added value of the use of coffee residues for the removal of pollutants. Finally, the research in low-cost adsorbents can lead to creation of novel low-costs adsorbents with the addition of innovative materials such as titanium dioxide (TiO2) to the basic structure of the low-cost adsorbents with the capacity to remove different kinds of pollutants in a single step (heavy metals and surfactants) [11].
The use of waste material as adsorbent of pollutants represents a double advantage over the use of other adsorbents because beside the removal of the pollutant, a recycling of waste material is being carried out. The coffee industry is responsible for the production of more than 2 billion tons of by-products such as spent coffee grounds (SCGs) [12]. The coffee spent grounds are a pollutant by themselves and most of them are wasted in landfills. Spent coffee grounds are discarded into landfills and they create methane, which is a greenhouse gas [13]. The chemical composition of SCGs is based on hemicellulose, cellulose, fat, proteins, polyphenols, minerals, and products from Maillard reaction during the roasting process, such as melanoidins [13]. Major components of the SCGs, namely polysaccharides cellulose and hemicellulose, and the polymeric compound lignin can be used to remove heavy metals from water because they have functional groups as −OH, −COOH and phenolic groups which are able to adsorb heavy metals from aqueous solutions. SCGs have been used for the removal of heavy metals from water [14].
Alginic acid or alginate is an acidic polysaccharide from the cell walls of brown algae. Usually it is used as calcium alginate (CA) that is insoluble and created with the addition of an aqueous solution of sodium alginate to an aqueous solution of calcium chloride. During the reaction, Na+ ions are replaced with Ca2+ ions to create the insoluble CA. CA beads have been used for the adsorption of heavy metals, due to their good affinity for the bivalent metal ions [15]. Alginic acid is composed of β-D mannuronic acid(M) and α-L-glucuronic acid (G), but only the G-blocks of alginate are believed to participate in intermolecular cross-linking with divalent cations (e.g., Ca2+) to form hydrogels [16].
SCGs have been encapsulated before in CA in our previous study, showing greater adsorption capacity for Cu2+ in water and improved kinetics than CA alone at concentrations between 10 to 100 ppm of copper at pH 4 and 30 °C [17]. In the previous study, the larger adsorption by CA–SCG beads in comparison to the CA beads was seen in the lower range of concentrations (10 to 30 ppm). At these concentrations, the percentages of adsorption were closer to 100% versus the CA alone, approaching the goal of total metal removal from the water [17]. Most of the contamination by heavy metals in water is at levels of trace concentrations. Adsorbents with a capacity of total metal removal at a lower concentration are more significant than adsorbents with larger capacities of adsorption but that cannot remove all the dissolved metal no matter the concentration, taking into consideration that heavy metals can be dangerous even at low concentrations.
The analysis of the CA beads prepared in this study focuses the performance of this matrix alone versus the composite beads (CA–SCGs beads) and the SCGs alone. The synthesis of CA beads was kept simple without any further step to improve the adsorption of metals besides the addition of SCGs. CA beads and CA–SCGs beads were prepared under the same conditions. The aim of this research was to study the performance of the CA–SCGs beads in the removal of Ni2+ or Cd2+ from water at concentrations from 10 ppm to 100 ppm.
2. Materials and Methods
2.1. Spent Coffee Grounds (SCGs)
SCGs were collected from Café Colegial (Mayaguez, Puerto Rico), the campus coffee shop. SCGs were collected and immediately dried at 50 °C for five days. After drying, SCGs were sieved through a #35 ASTM sieve (500 µm). Previous experiments in metal removal, where the employed coffee was only washed with deionized water, showed that this adsorbent continued to release soluble coffee material on subsequent exposure to aqueous solution [18]. Therefore, the SCGs were pretreated with 0.1 M NaOH (Fisher Chemical, Fair Lawn, NJ, USA) to remove the soluble materials as described in Dávila-Guzmán, N.E. et al. [19]. The SCGs were washed repeatedly with deionized water after the pre-treatment with NaOH until a value of pH close to 6 was achieved. Then, the SCGs were dried again at 70 °C for 24 h.
2.2. Preparation of the Calcium Alginate Beads and the Calcium Alginate/Spent Coffee Grounds Composite Beads
Three grams of SCGs were added to 100 mL of deionized water. After this, 3 g of sodium alginate (ACROS ORGANICS, Morris, NJ, USA) were added. A laboratory paddle stirrer was used to stir the solution. One hundred milliliters of water were added again to achieve a volume of 200 mL. This 200 mL solution, with 3 g of sodium alginate (1.5% w/v sodium alginate) and 3 g of SCGs, was used to make CA–SCGs beads. The CA beads were prepared using the same procedure, but without SCGs.
Three hundred mL of a 0.2 M CaCl2 solution (Fisher Chemical, Fair Lawn, NJ, USA) were prepared in another beaker. The solution of sodium alginate/SCGs was added dropwise to the solution of 0.2 M CaCl2. A bead was formed with each drop. The formed beads were maintained at constant stirring with a magnetic stirrer for two additional hours for hardening. Finally, the beads were washed with deionized water and dried in an oven at 40 °C for four days.
2.3. Adsorption Experiments and Kinetic Experiments
Solutions of 100 mL of Cd2+ and Ni2+ were prepared from commercial stock solutions of 1000 ppm (Sigma-Aldrich, Saint Louis, MO, USA). An initial volume of stock solution was diluted in 70 mL of deionized water. The working solutions were prepared in triplicate for each concentration. The pH was adjusted to 6 with diluted solutions of NaOH (Fisher Chemical, Fair Lawn, NJ, USA) or HNO3 (Sigma-Aldrich, Saint Louis, MO, USA). After the pH adjustment, the solution was brought to a volume of 100 mL with deionized water to obtain the desired concentration of metal. Each working solution was added to a plastic bottle of 120 mL for the experiment. Each bottle had 100 mL of metal solution and 0.5 g of adsorbent. The adsorbents were CA beads, CA–SCGs beads, or SCGs. The final metal concentrations of these solutions were 10 ppm, 20 ppm, 30 ppm, 60 ppm, 80 ppm, and 100 ppm.
The bottles were placed in an orbital shaker at 30 °C, at 250 rpm. For adsorption experiments, samples were taken at 0 and 24 h. For kinetic experiments, samples were taken at 0 min, 30 min, 60 min, 90 min, 120 min (2 h), 180 min (3 h), 240 min (4 h), 360 min (6 h), 720 min (12 h), and 1440 min (24 h). Kinetic experiments were done only for the concentrations of 10 ppm and 100 ppm. The sampling procedure for SCGs was slightly different because the adsorbent is not a bead, but a powder. A sample was taken from the plastic bottle in the orbital shaker at the specific time, centrifuged for 5 min at 3200 rpm, and then a specific volume from the supernatant was taken. All the samples were diluted with 2% v/v nitric acid and refrigerated prior to the analysis for conservation of the sample. The dilution factor was taken into consideration in all the samples. The samples were analyzed for Cd2+ or Ni2+ content by inductively coupled plasma optical emission spectrometry (Pelkin–Elmer ICP-OES Optima 8000, Perkin–Elmer, Billerica, MA, USA).
The adsorption capacity of Cd2+ or Ni2+ at equilibrium (qe) was calculated using Equation (1) [20]:
where C0 (mg/L) is the initial metal concentration, Ce (mg/L) is the equilibrium concentration; V is the volume of the solution of Cd2+ or Ni2+ ions (L) and W is the adsorbent weight added to the solution (g). The time of equilibrium was 1440 min (24 h).
qe = (C0 − Ce)V/W
For the kinetic experiments, the adsorption capacity of Cd2+ or Ni2+ at time t (qt) was calculated from Equation (2) [21]:
where Ct is the concentration of Cd2+ or Ni2+ at time t.
qt = (C0 − Ct)V/W
2.4. Adsorbent Dose Effect (Beads)
The effect of different doses of CA beads and CA–SCGs beads in the adsorption of Cd2+ or Ni2+ ion were measured with 0.025 g, 0.050 g, 0.150 g and 0.500 g of beads in 100 mL at a concentration of 20 ppm of Cd2+ or Ni2+ for 24 h as the equilibrium time.
2.5. Adsorption/Desorption Studies
CA beads and CA–SCG beads were subjected to metal ion recovery experiments using 0.1 M HNO3 solution. Three cycles of adsorption/desorption experiments were conducted. The initial concentration at each cycle of Cd2+ or Ni2+ was 80 ppm. The adsorption step was under the same conditions explained in Section 2.3. After each adsorption step, the metal loaded beads were filtered from the metal solution and suspended in 100 mL of 0.1 M HNO3 solution in a plastic bottle. The bottles were placed in an orbital shaker at 30 °C, at 250 rpm for three hours. During the first cycle of desorption, samples were taken at 0.5, 1, 2, and 3 h. During the second and third cycle of desorption, samples were only collected at 3 h. After each desorption cycle, the beads were washed with deionized water and dried at 50 °C for 24 h. The percent of desorption was calculated with Equation (3) [22]:
where Cdes (mg/L) is the concentration of metal ions in solution after desorption.
%D = (Cdes/C0)∗100
2.6. Characterization
The point of zero charge, pHpzc, was measured by the pH drift method [23]. The pHpzc test was performed by adjusting pH of 50 mL 0.1 M NaCl solution to a value between 3 and 10 with HCl and NaOH. The adsorbent, CA beads or CA–SCGs beads, were added to the solution (0.5 g). The solutions were placed in an orbital shaker at 25 °C, at 200 rpm and the final pH was measured after 48 h under agitation. The pHpzc is the point where pHinitial − pHfinal = 0.
Raman measurements were carried out using a laser beam with a wavelength of 532 nm with an excitation power of 30 mW at the sample. The laser was focused on the sample using a microscope setup equipped with a 50× objective. The instrument used was a Renishaw InVia Raman Microscope (Renishaw plc, Gloucestershire, UK). The analysis was restricted from 500 cm−1 to 2000 cm−1 because the most important bands of carbohydrates and polyphenols are in this region. Unwanted fluorescence background was removed by Renishaw proprietary intelligent fitting software.
Fourier-transform infrared (FT–IR) spectra of the CA beads and CA–SCGs beads and SCGs were obtained using an Agilent Cary 630 FT–IR Spectrophotometer (Agilent, Santa Clara, CA, USA), Attenuated Total Reflection (ATR). Transmission spectra were obtained in the range of 4000–450 cm−1. An air background was used as a blank for all spectra collected. The most important peaks were identified at its specific wavenumber to see which peaks are characteristic of the CA, of the spent coffee grounds, or both.
Scanning Electron Microscopy coupled with an energy-dispersive X-ray spectroscopy (SEM–EDX) was used to see the elemental surface composition and morphology of the beads before and after of the adsorption of each metal in a solution of 100 ppm of Cd2+ or Ni2+. The instrument used was a JEOL JSM-6480LV SEM with energy-dispersive X-ray analysis (JEOL Ltd., Peabody, MA, USA). In EDX spectroscopy, an incident beam excites an electron in an inner shell, ejecting it from the shell and creating an electron hole where the electron was. An electron from an outer, higher-energy shell then fills the hole, and the difference in energy between the higher-energy shell and the lower energy shell may be released in the form of an X-ray. The X-ray lines in EDX spectroscopy are identified by a capital Roman letter indicating the shell containing the inner vacancy (K, L, or M). In this study, the X-ray line L was used for Cd2+ and Ni2+. The X-ray line K was used for the other elements. The accelerating voltage used was 20 kV.
3. Results and Discussion
3.1. Point of Zero Charge (pHpzc)
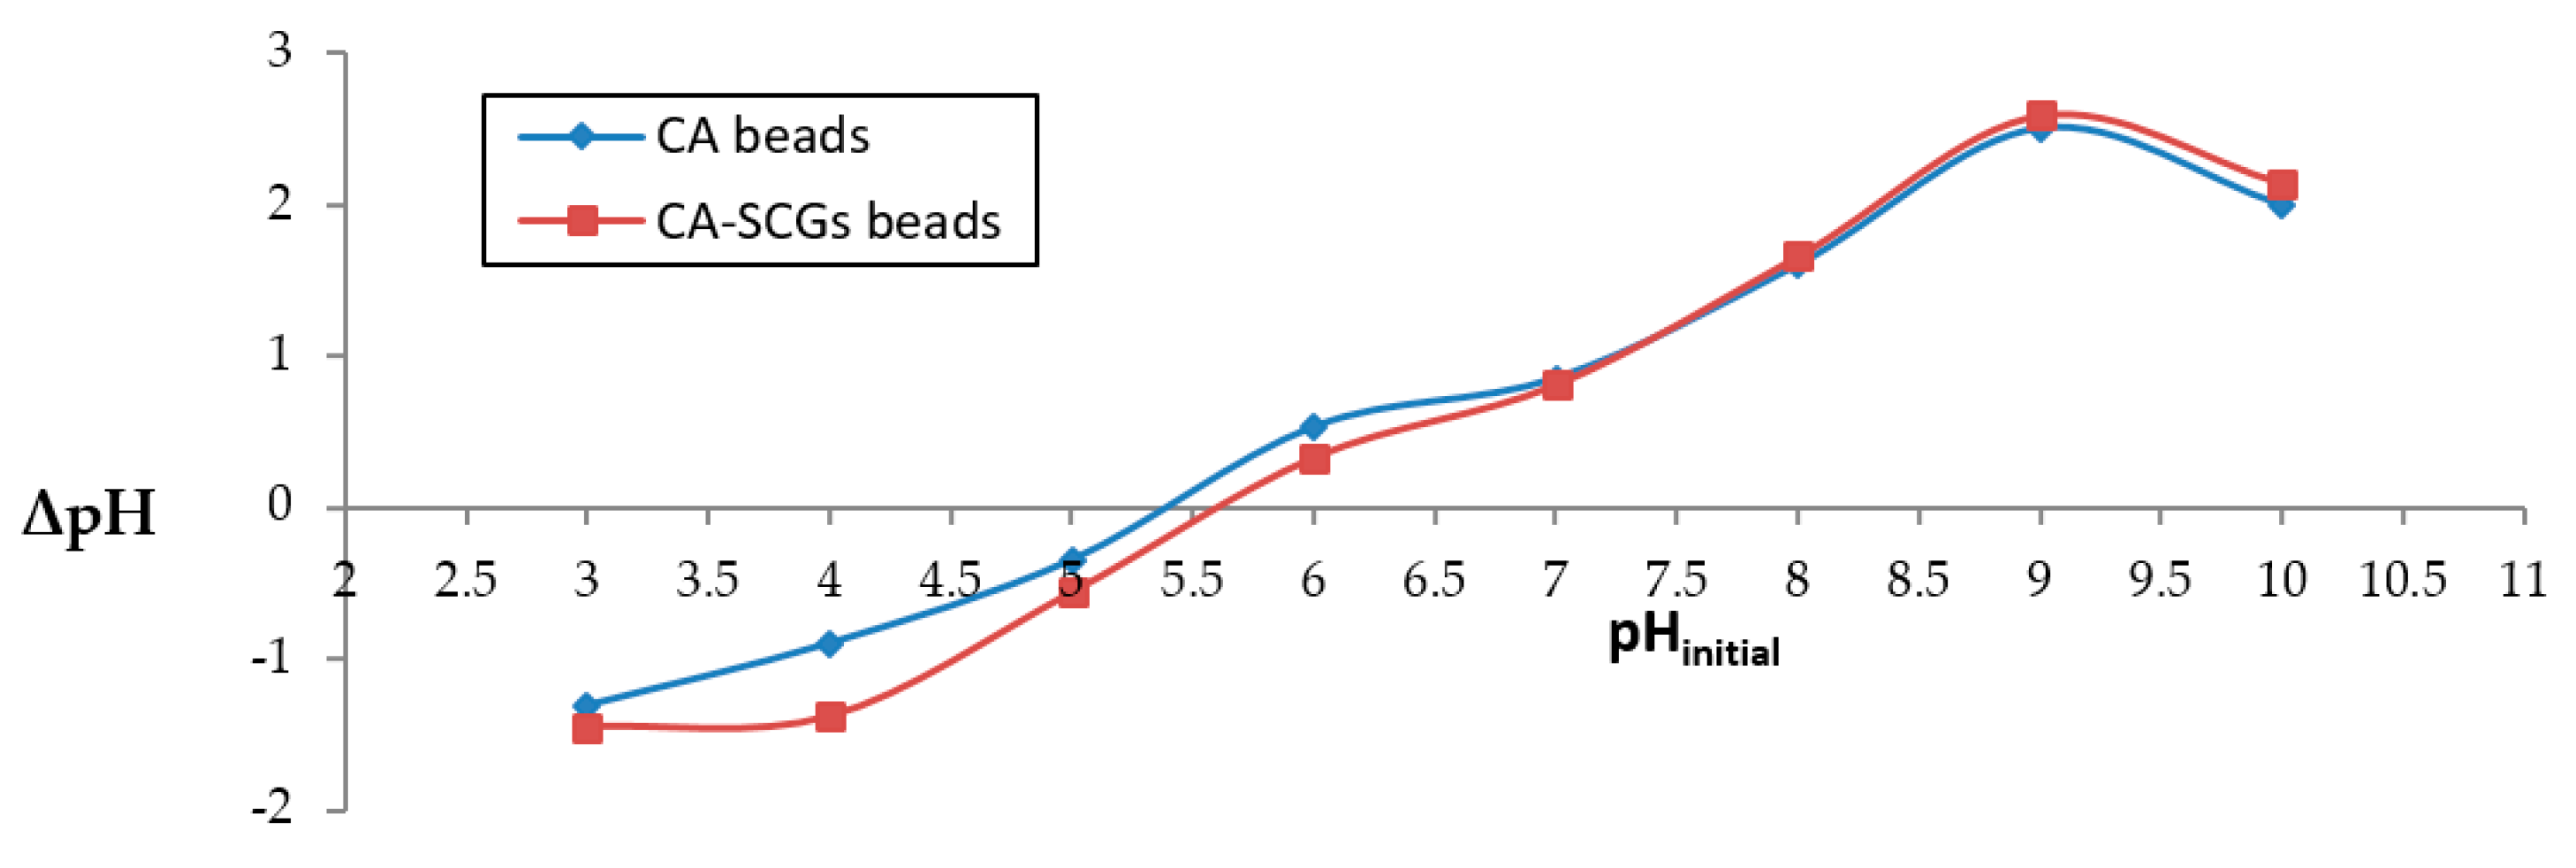
The plot in Figure 1 was used to calculate pHpzc. The values of pHpzc for CA beads and CA–SCGs beads were 5.4 and 5.6, respectively. Therefore, there was a negatively charged surface of both adsorbents at a pH of 6.0.
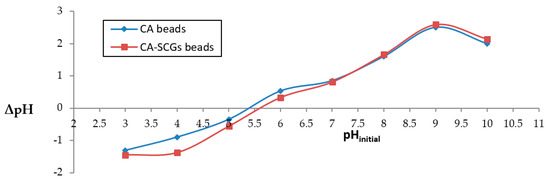
Figure 1.
Determination of pHpzc using pH drift method.
3.2. Characterization of CA Beads, CA–SCGs Beads, and SCGs by Raman Spectroscopy
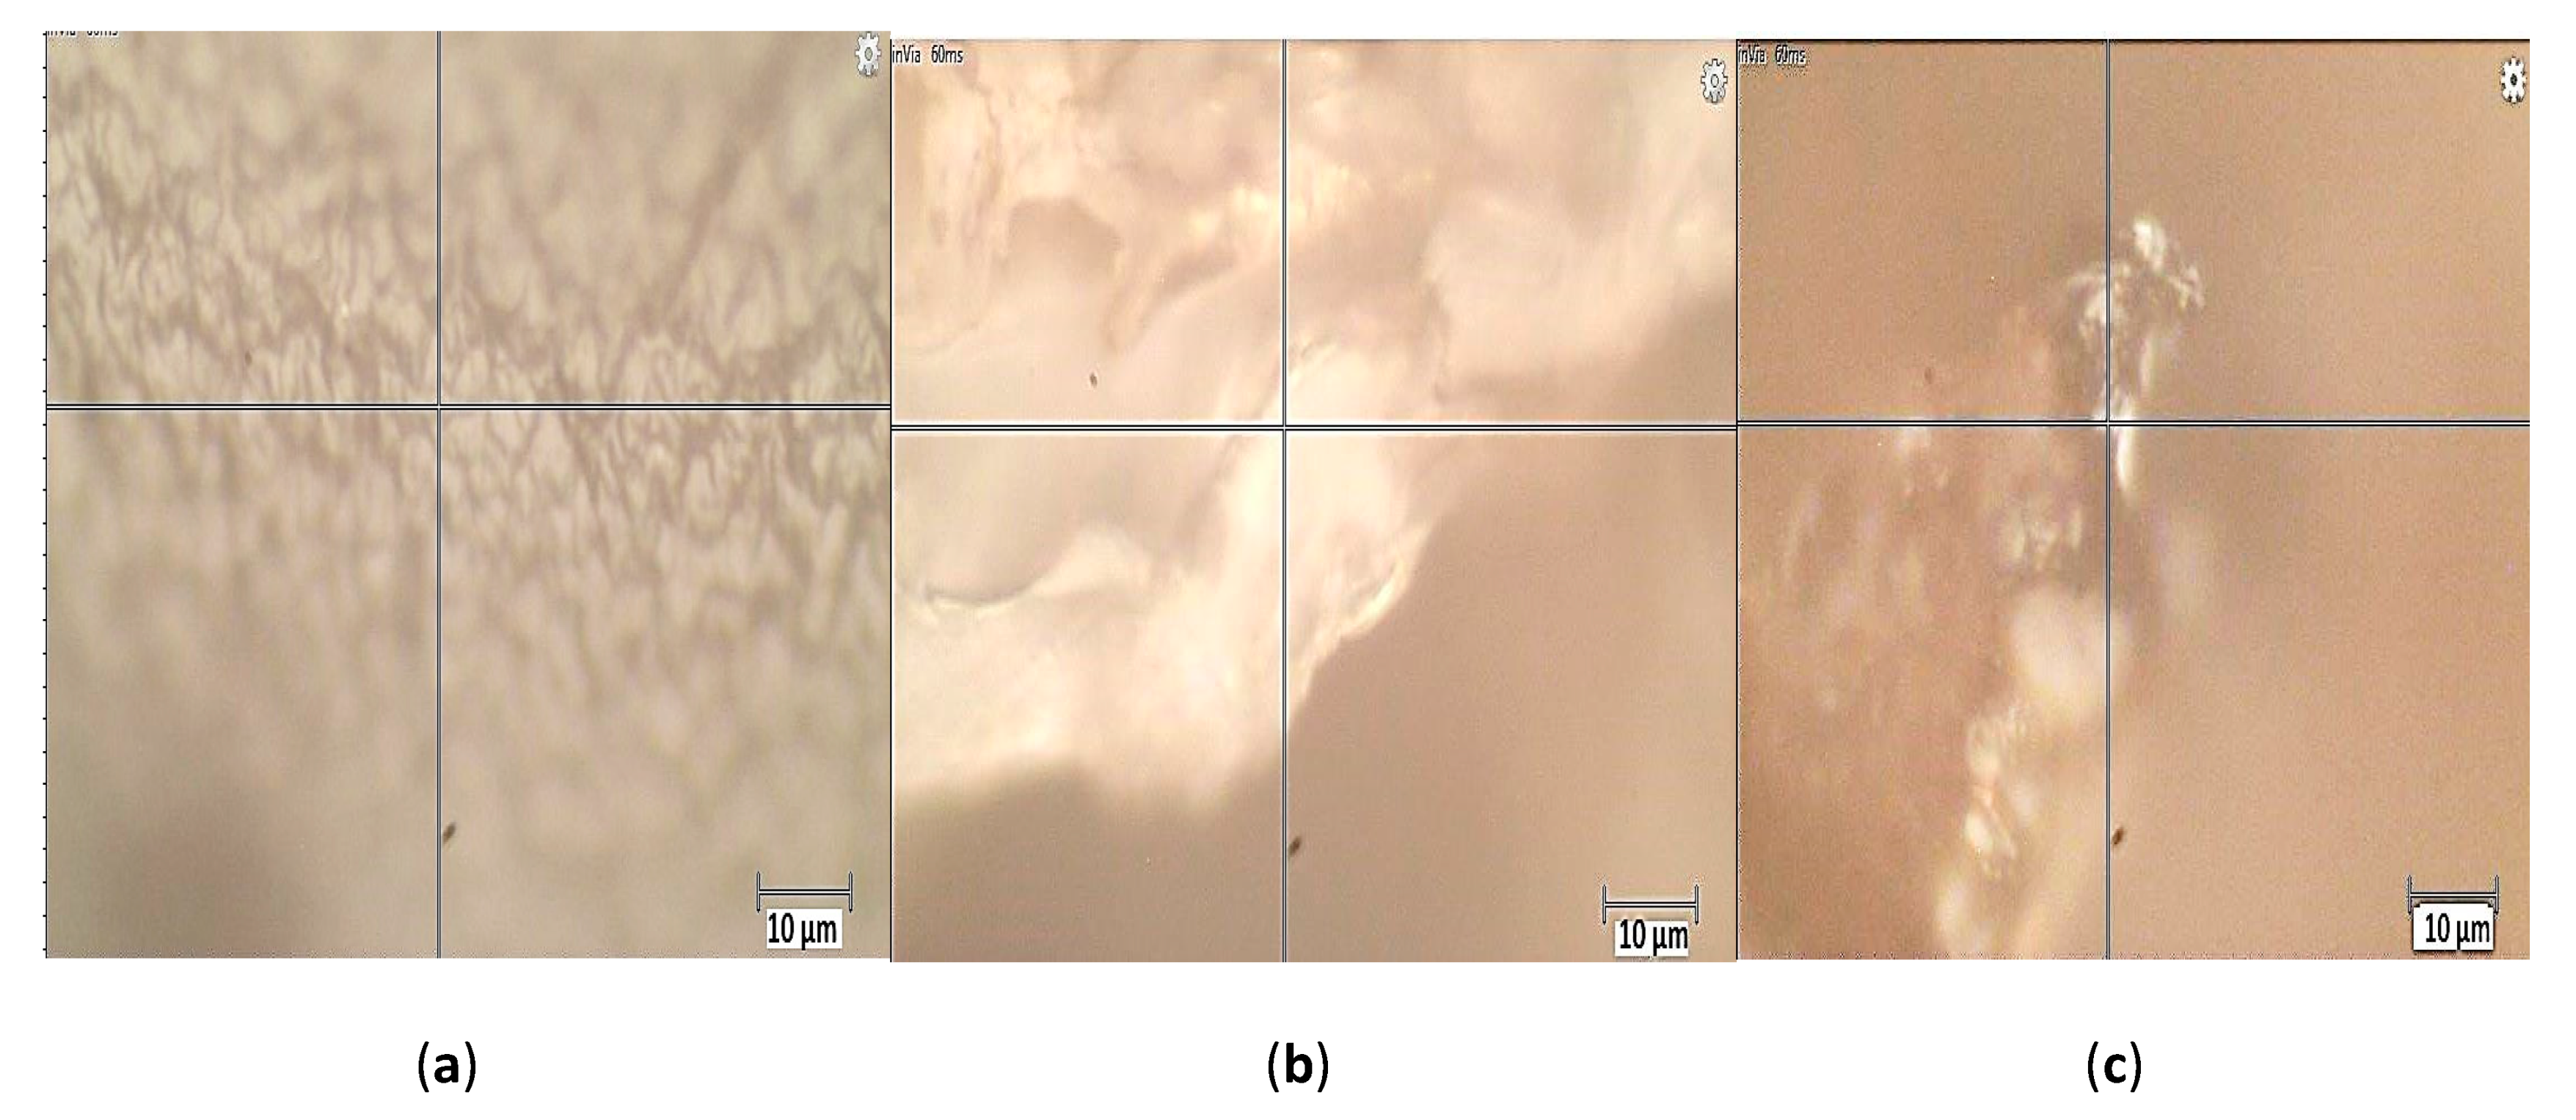
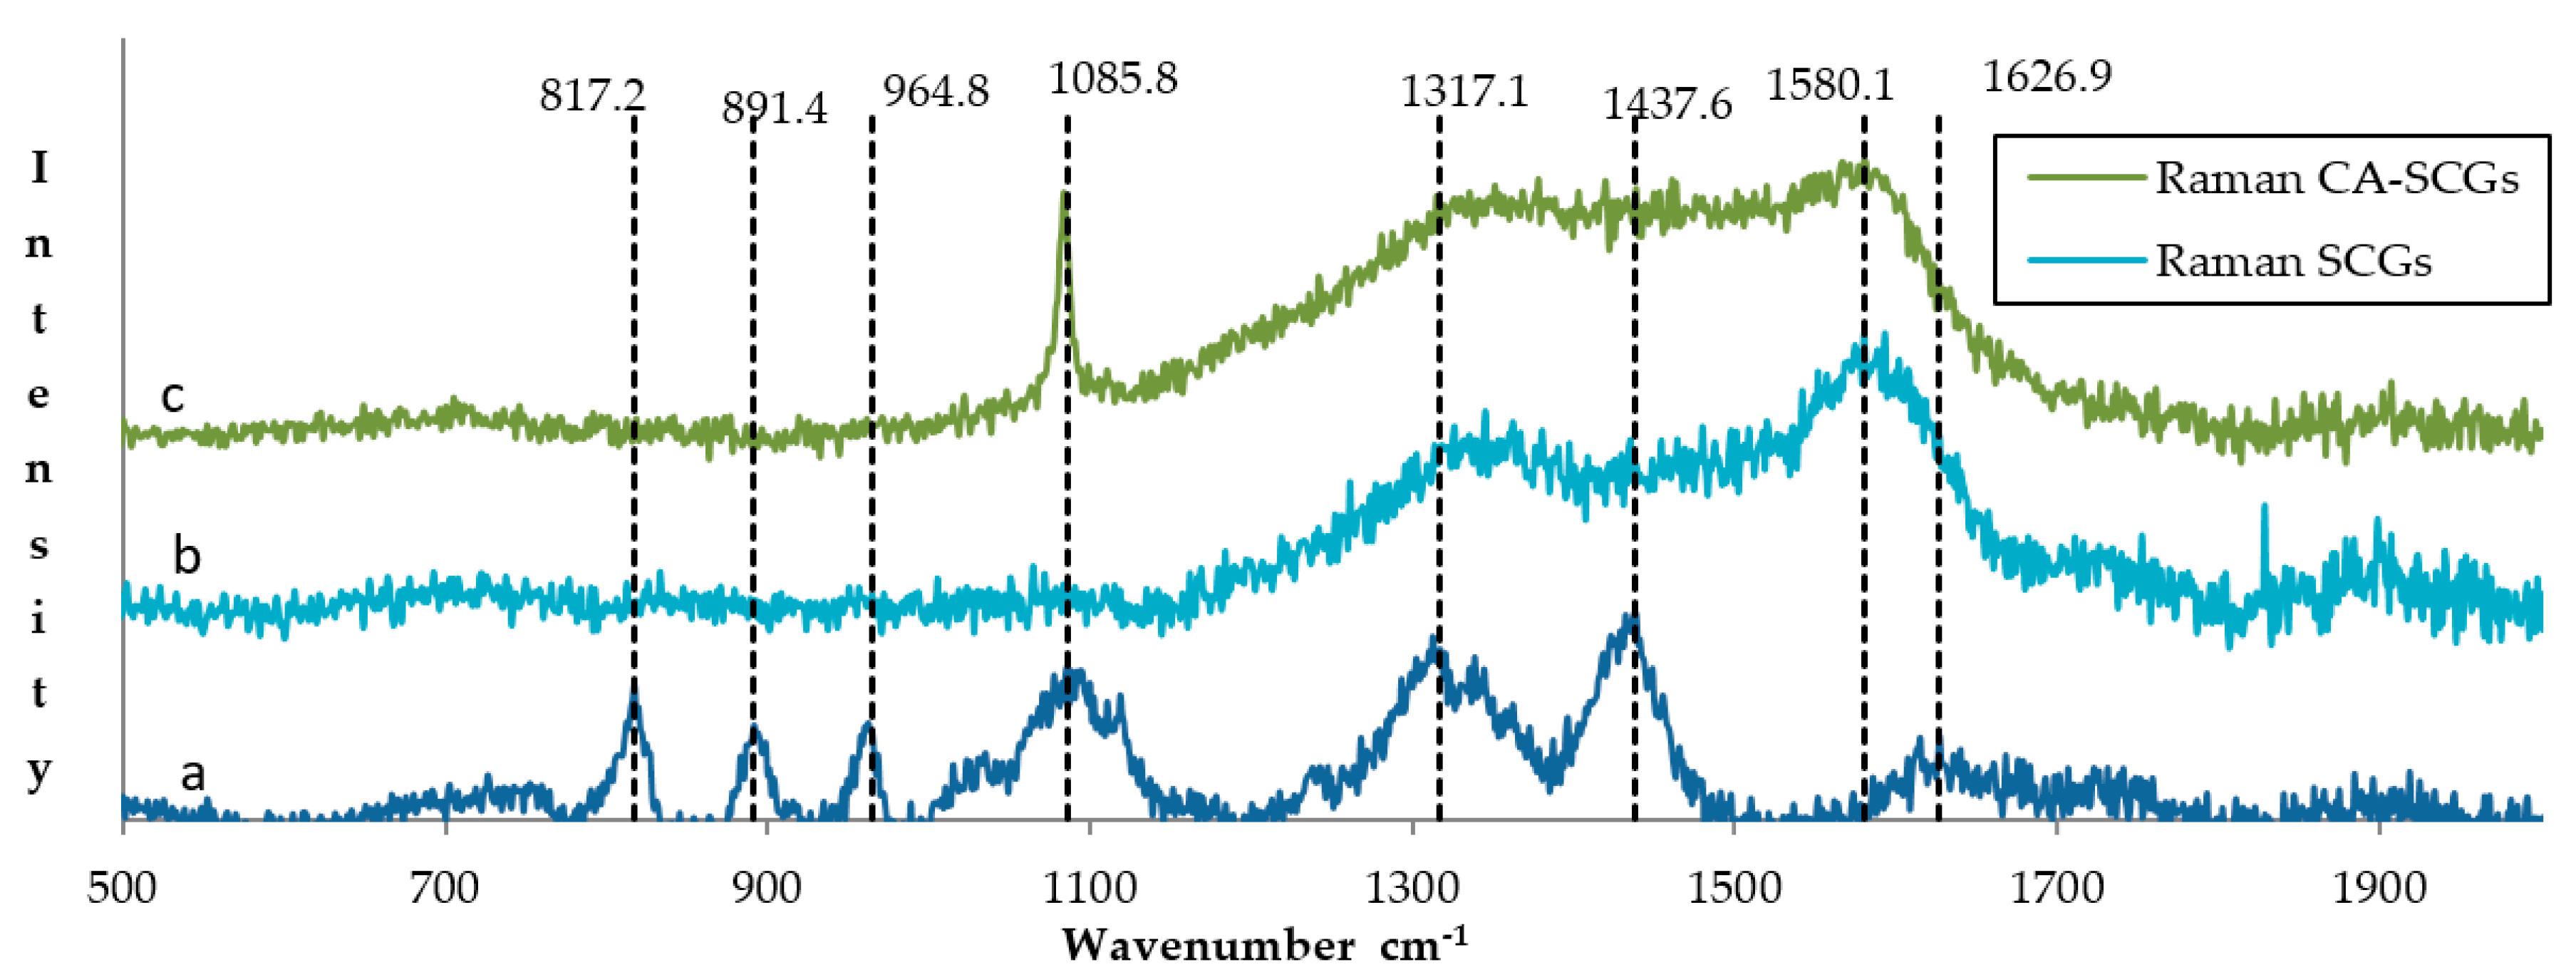
The photos of Figure 2 reveal a more uniform structure for the CA beads while the CA–SCGs beads have a more heterogeneous structure with differences in bead texture and color. The Raman spectrum of CA beads in Figure 3 shows bands in 817.2, 891.4 and 964.8 cm−1. These bands can be attributed to skeletal C–C, C–O stretching, and C–C–H, C–C–O bending modes [24]. The spectra of CA beads and CA–SCGs beads show a band at 1085 cm−1; this band is associated with the glycosidic ring breathing mode [24]. The Raman spectrum of CA beads shows bands in 1317.1 cm−1 (carboxylate stretching vibration: symmetric stretching or C–O single bond stretching vibration) and 1437.6 cm−1 (symmetric carboxylate stretching vibration) [24]. These bands could be present in the spectrum of CA–SCGs beads, but they could be overlapping with other bands. The CA bead spectrum has a band at 1626.9 cm−1 (asymmetric carboxylate stretching vibration), this band could also be present in CA–SCGs beads. The presence of carboxylate groups and glycosidic rings in both kinds of beads is confirmed by the IR spectra. The most significant differences can be observed at 1580.1 cm−1 and 1085 cm−1. At 1580.1 cm−1, the CA–SCGs beads and SCGs show strong intensity, whereas the CA beads do not. Regarding the 1085 cm−1 wavelength, the CA–SCGs beads and CA show strong intensity, whereas the SCGs do not, which is characteristic of the glycosidic ring. Bands around 1600 cm−1 are related to lignin [25], specifically to C=C bonding in the polyphenols of lignin. Therefore, the presence of this band confirms the presence of polyphenols in CA–SCGs beads and their absence in CA beads. This component could be the main difference in the adsorption by CA–SCGs beads in comparison with CA beads. Lignin is a main component of SCGs, values of 23.90 and 26.51% w/w have been reported [26,27]. Lignin contains two main types of adsorption sites attributed to carboxylic- and phenolic-type, but the phenolic sites have a higher affinity for metal ions than the carboxylic sites [28]. This could be the reason of why the adsorption sites of CA–SCGs and SCGs have a greater affinity for the adsorption of metals, achieving values of adsorption closer to 100%, especially at the lower range of concentration of metal. Although CA beads have more adsorption sites for metals because they have more carboxylic groups than CA–SCGs beads, the CA–SCGs beads have a combination of carboxylic groups and phenolic groups; this combination resulted in a greater affinity to the adsorption of metals than if only the carboxylic groups were considered to be adsorption sites in the study of Guo, X. et al. [28]
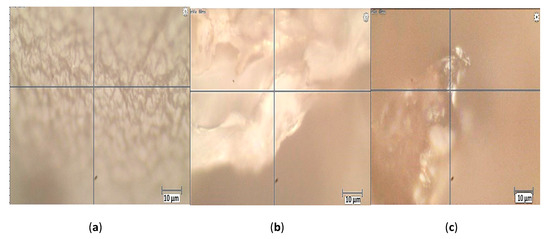
Figure 2.
Photos of the analyzed regions by Raman spectroscopy: (a) CA beads, (b) CA–SCGs beads (c) SCGs.
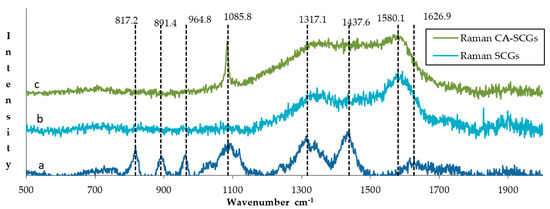
Figure 3.
Comparison of the Raman spectra of (a) CA beads, (b) SCGs and (c) CA–SCGs beads.
3.3. Characterization of CA Beads, CA–SCGs Beads, and SCGs by Fourier-Transform Infrared Spectroscopy (FT–IR)
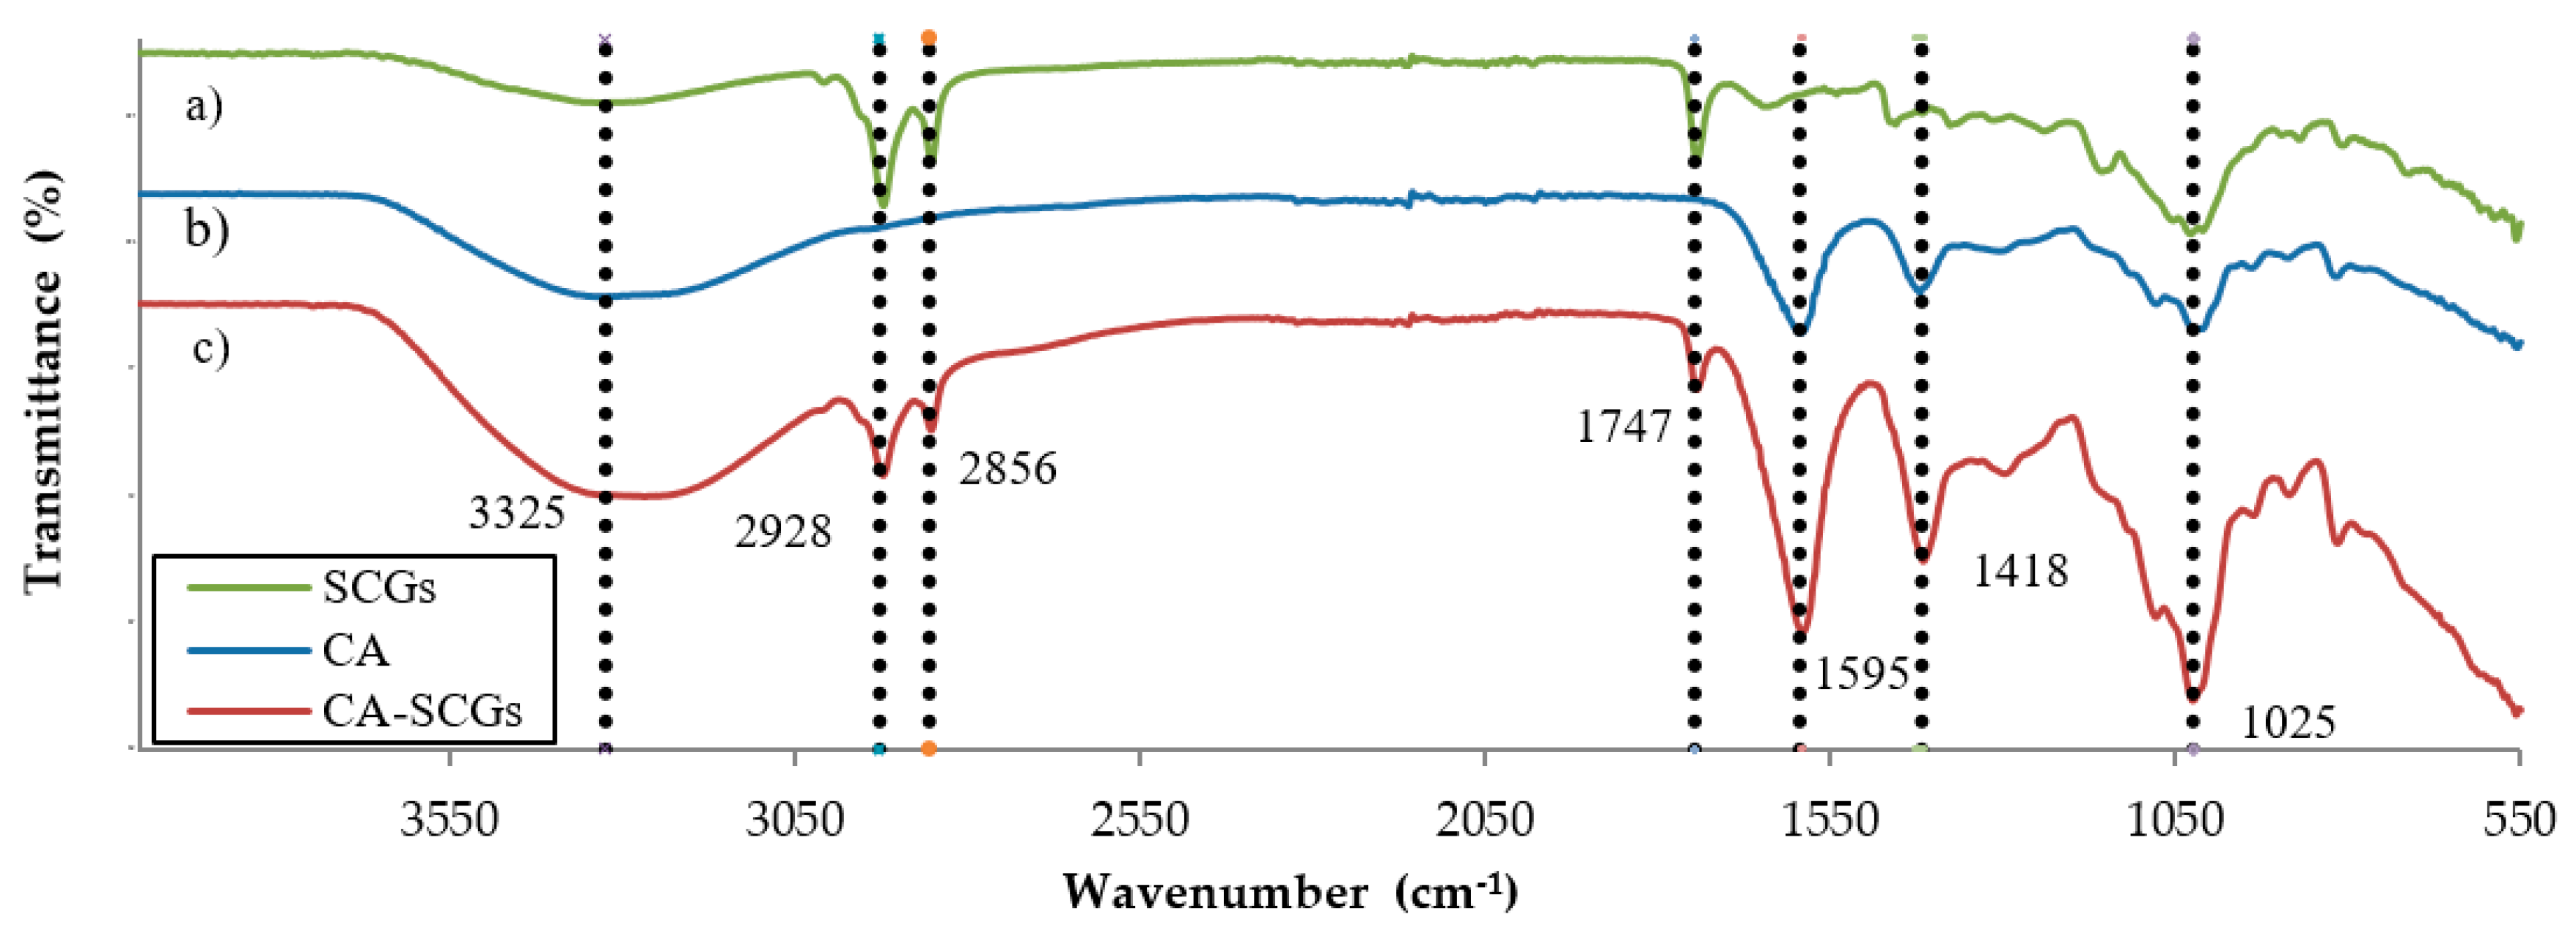
The FT–IR spectra (Figure 4) shows a broadband approximately at 3325 cm−1 in CA beads and CA–SCGs beads, and with less intensity in SCGs. It is attributed to the presence of –OH groups. The bands at 2928 cm−1 and 2856 cm−1, present only in CA–SCGs and SCGs, can be attributed to asymmetric and symmetric stretching of C–H bonds in aliphatic chains.
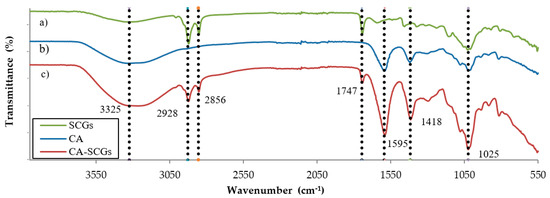
Figure 4.
Comparison of the FT–IR spectra of (a) SCGs, (b) CA beads and (c) CA–SCGs beads.
The band at 1744 cm−1, also only present in CA–SCGs beads and SCGs, can be attributed to a carbonyl vibration (C=O) in aliphatic esters or in triglycerides [27]. The bands at 1595 cm−1 and 1418 cm−1 can be attributed to −COO− (asymmetric stretching) and –CH2 (bending), they are mostly present in the spectra of CA beads and CA–SCGs beads [29]. The band at 1025 cm−1 can be attributed to C–O–C (stretching) vibrations [27,29] and it is present in the spectra of CA beads, CA–SCGs beads, and SCGs.
The bands at 2928 cm−1 and 2856 cm−1 are attributed to C–H bonds in aliphatic chains and the band at 1747 cm−1 can be attributed to a carbonyl vibration (C=O) in aliphatic esters or in triglycerides. For this reason, these bands are attributed to lipids in SCGs [27]. These hydrophobic components do not have the capacity of metal adsorption, but the presence of these components could have an indirect effect in the location of the polar hydrophilic groups responsible for the metal adsorption in the SCGs and the CA–SCGs beads. During the instant precipitation of the CA–SCGs beads, the hydrophobic groups will stay away from the water as much as possible, occupying sites further away from water, deeper in the structure of the bead. These deeper locations will be not occupied by polar hydrophilic groups responsible for the metal adsorption, instead these groups will be closer to the water that is inside and outside of the bead during the instant process of precipitation. The CA beads have a homogeneous composition without hydrophobic groups. The distribution of the adsorption sites will be uniform through the bead and will be not affected due to the presence of water. Therefore, the hydrophobic groups will be cause heterogeneity in the adsorption by CA–SCGs beads. Some regions of a CA–SCGs bead will adsorb more metal than others. Also, structural changes caused by the swelling of the bead and the gradual entrance of water inside the bead during the adsorption could change the location of these adsorption sites. The uniformity of the CA bead structure and the heterogeneity of the CA–SCGs bead structure are confirmed by the photos taken during the Raman and SEM analyses.
3.4. Characterization of CA Beads and CA–SCGs Beads by SEM–EDX Spectra
The SEM images (Figure 5 and Figure 6) showed differences in the surface morphology of the beads. Before adsorption, the CA beads had a round shape with a smoother surface without much porosity (Figure 5a). After the adsorption of any of the two metals, the surface texture of the CA beads changed showing marks and scratches (Figure 5b,c). The CA–SCGs beads had a more irregular shape than the CA beads with a rough surface and more porosity (Figure 6a). After the adsorption process, the surface texture of the CA–CSGs beads did not change (Figure 6b,c). Figure 7 shows an example of the EDX spectra obtained from the beads.

Figure 5.
SEM images of CA beads: (a) before adsorption; (b) after adsorption at 100 ppm Cd2+ and (c) after adsorption at 100 ppm Ni2+.

Figure 6.
SEM images of CA–SCGs beads: (a) before adsorption; (b) after adsorption at 100 ppm Cd2+ and (c) after adsorption at 100 ppm Ni2+.

Figure 7.
EDX spectrum of CA–SCGs bead after adsorption at 100 ppm Ni2+ (X-ray lines K or L for each element).
The EDX spectra of CA beads and CA–SCGs beads before adsorption showed a significant presence of Cl−. This could suggest that although the beads were washed several times with deionized water after synthesis to remove the excess of CaCl2, the removal was not complete. The CA beads and CA–SCGs beads showed the expected peak of Ca2+. Carbon and oxygen were found in the largest proportion, as was expected. Other elements were detected at level of traces (less than 1 wt. %), these elements such as S and Al have been seen before in spectra of alginate beads and can be products of algae components or impurities associated with the alginate extraction step [16].
Table 1 shows the values of wt. % obtained for Ca2+, Cd2+ and Ni2+ in the EDX spectra for six beads, before and after metal adsorption. The data presents the Ca2+ content and release, also the adsorption of Cd2+ and Ni2+ in the analyzed bead volume. The average (Ave.), standard deviation (S. D.), median (Med.) and median absolute deviation (M.A.D.) are also included in Table 1. The set of data does not have a normal distribution; therefore, the median is more appropriate than the average to describe a representative value. Likewise, the M.A.D. is more appropriate than the standard deviation as a measure of how spread out is the set of data.

Table 1.
Values of wt. % for six beads.
Table 1 shows patterns for each bead type, before and after adsorption. The first pattern is the content of Ca2+ before adsorption. The EDX spectra of CA beads before adsorption showed a higher median for Ca2+ content than the CA–SCGs beads (20.03 wt. % versus 8.56 wt. %). The CA–SCGs beads had a higher M.A.D. for the Ca2+ content (4.49 wt. % versus 2.53 wt. %), while the content of Ca2+ was more heterogeneous in the CA–SCGs beads.
The second pattern seen in the data is the Ca2+ content after adsorption of Ni2+ or Cd2+. The CA–SCGs beads showed a higher median for Ca2+ content of versus the content of Ca2+ in the CA beads after adsorption of Ni2+ (1.04 wt. % versus 4.76 wt. %) or Cd2+ (2.87 wt. % versus 6.49 wt. %). This could suggest a lesser release of Ca2+ by the CA–SCGs beads during the adsorption of Ni2+ and Cd2+.
Finally, the third pattern is related to the content of Ni2+ and Cd2+ in the CA beads and the CA–SCGs beads after metal adsorption. The CA–SCGs beads have a higher median of Ni2+ (2.80 wt. % versus 2.25 wt. %) and Cd2+ (0.87 wt. % versus 4.31 wt. %) content. The difference in the Cd2+ bead content was greater than the difference seen in the adsorption of Cd2+ from the solution. The CA–SCGs beads showed a Cd2+ content four times larger than the CA beads. The difference is less for Ni2+, possibly because as it will be discussed later in Section 3.6, Ni2+ has a lesser affinity to alginate and lignin versus Cd2+. Another possible reason could be the swelling of the bead after adsorption of Ni2+.
The depth of EDX analysis ranges from 100 nm to 1 μm, depending on the type of material and the acceleration voltage chosen [30]. The depth of 1 μm represents a small portion of a bead with an approximate diameter of 1 mm. The analyzed area is close to the surface of the bead. Metal adsorbed at a depth of more than 1 μm will not be detected. Therefore, the metal seen in the spectra was adsorbed at a depth of less than 1 μm. The lower levels of Ni2+ and Cd2+ detected in the CA beads after adsorption could be due to uniform adsorption throughout the CA bead because of their homogeneous composition of sugar acids with the polar groups responsible for the adsorption, which are equally distributed through the bead. The composition of the CA–SCGs beads is not homogeneous because of hydrophobic groups, such as lipids. These hydrophobic groups will not adsorb metals but will stay away from the water, occupying positions further inside the bead. Therefore, the adsorption of metals will be lower in deeper regions of the bead and greater at the first depth micrometer. Adsorption sites that are more accessible allow for more contact between the metal and the adsorption sites. If the adsorption sites are deeper in the structure of the bead, these sites will be less accessible and part of the metal could stay dissolved, no matter the concentration of metal.
3.5. Adsorbent Dose Effect (Beads)
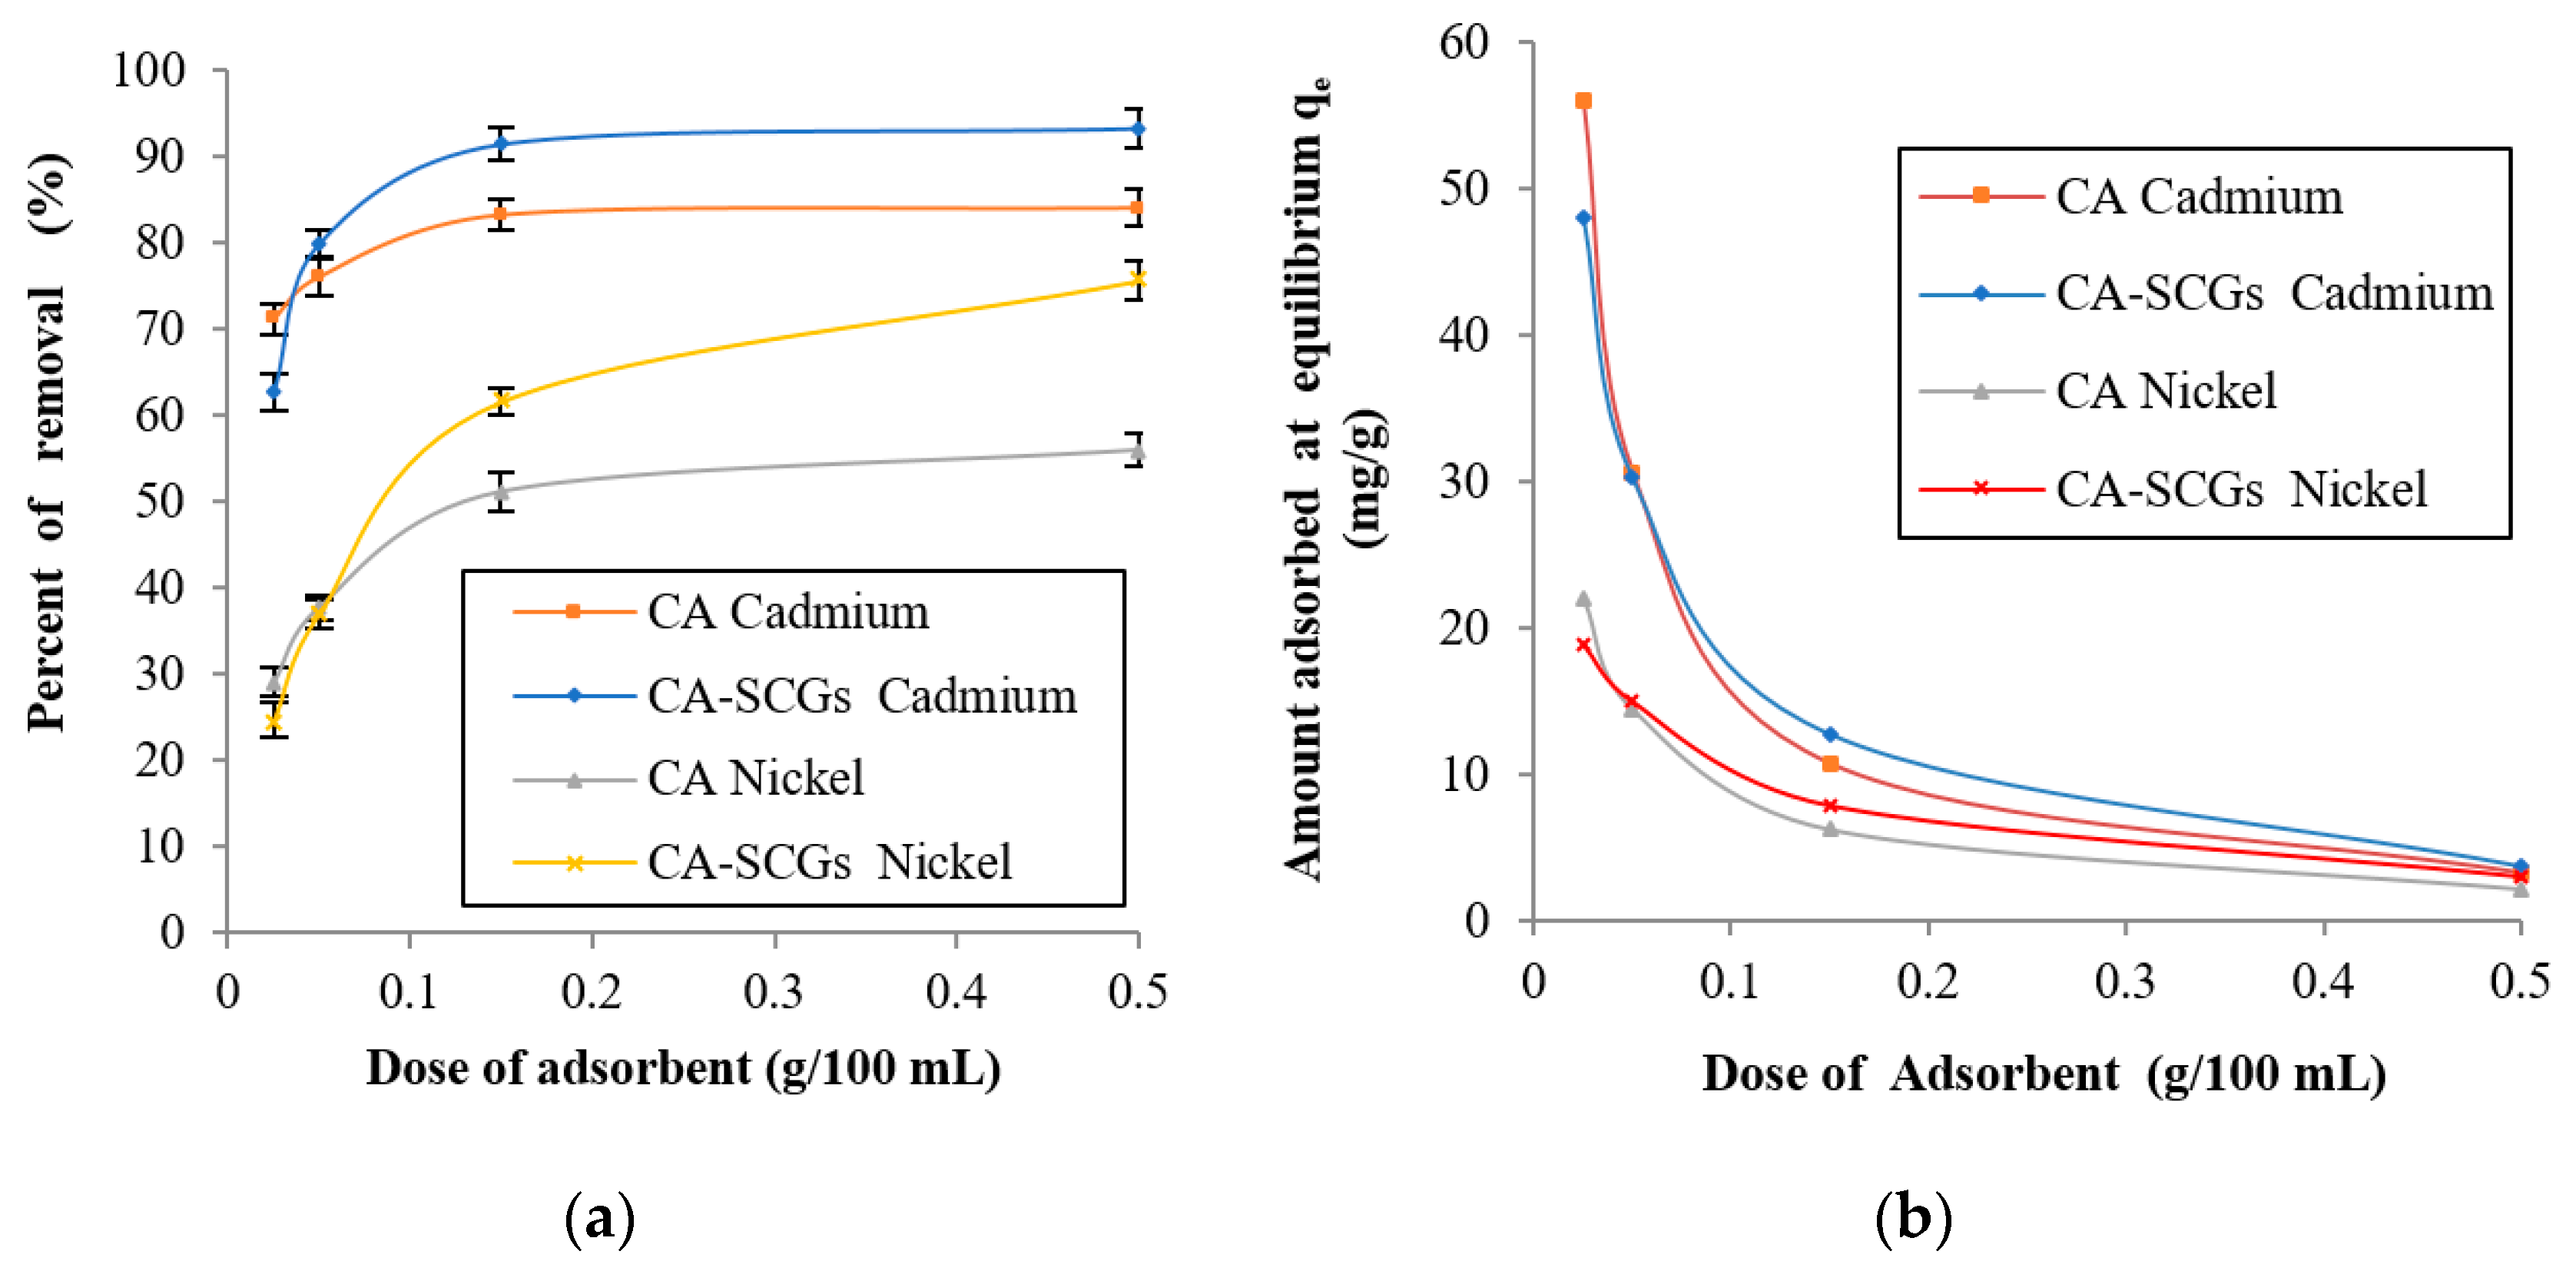
In Figure 8, at the lowest dose of adsorbent, 0.025 g in 100 mL of a solution with a concentration of 20 ppm of metal, the CA beads showed a larger adsorption capacity than the CA–SCGs beads (s = standard deviation). At 0.025 g of adsorbent, the CA beads reached an absorption of cadmium of 71.15% (s = 1.83%), whereas the adsorption for CA–SCGs beads was 62.67% (s = 2.13%). The values for adsorption of nickel were 29.11% (s = 1.71%) for the CA beads and 24.67% (s = 2.01%) for the CA–SCGs beads. This result was expected because the CA beads have a uniform structure with a larger number of carboxylic functional groups. Nevertheless, when the dose of adsorbent increased at the same concentration of metal, the CA–SCGs beads reached higher levels of adsorption.
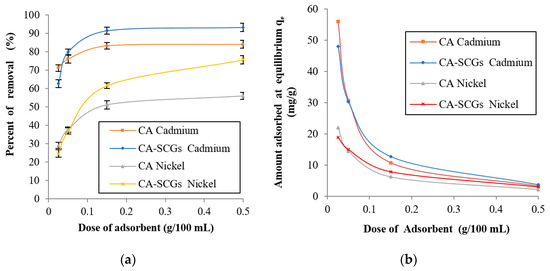
Figure 8.
Effect of adsorbent dose at a concentration of 20 ppm of metal at 24 h: (a) % of removal of metal and (b) Amount adsorbed at equilibrium (qe).
At 0.500 g of adsorbent, CA–SCGs beads reached an adsorption of cadmium of 93.29% (s = 2.25%), while adsorption for the CA beads was 84.08% (s = 2.05%). The values for adsorption of nickel at this dose were 75.62% (s = 2.31%) for CA–SCGs beads and 55.97% (s = 1.92%) for CA. Even though the CA beads have more adsorption sites in their structure, the adsorption sites of the CA–SCGs beads have more affinity to the metal than the adsorption sites of the CA beads. As was discussed earlier, the presence of phenolic groups in CA–SCGs can explain the greater affinity of these beads and their better performance when the adsorbent dose increased. As a result, the metal solution had a greater affinity with the adsorption sites of the CA–SCGs beads during the experiment, and at higher doses of CA–SCGs beads, the number of adsorption sites did not pose a problem.
3.6. Adsorption Experiments
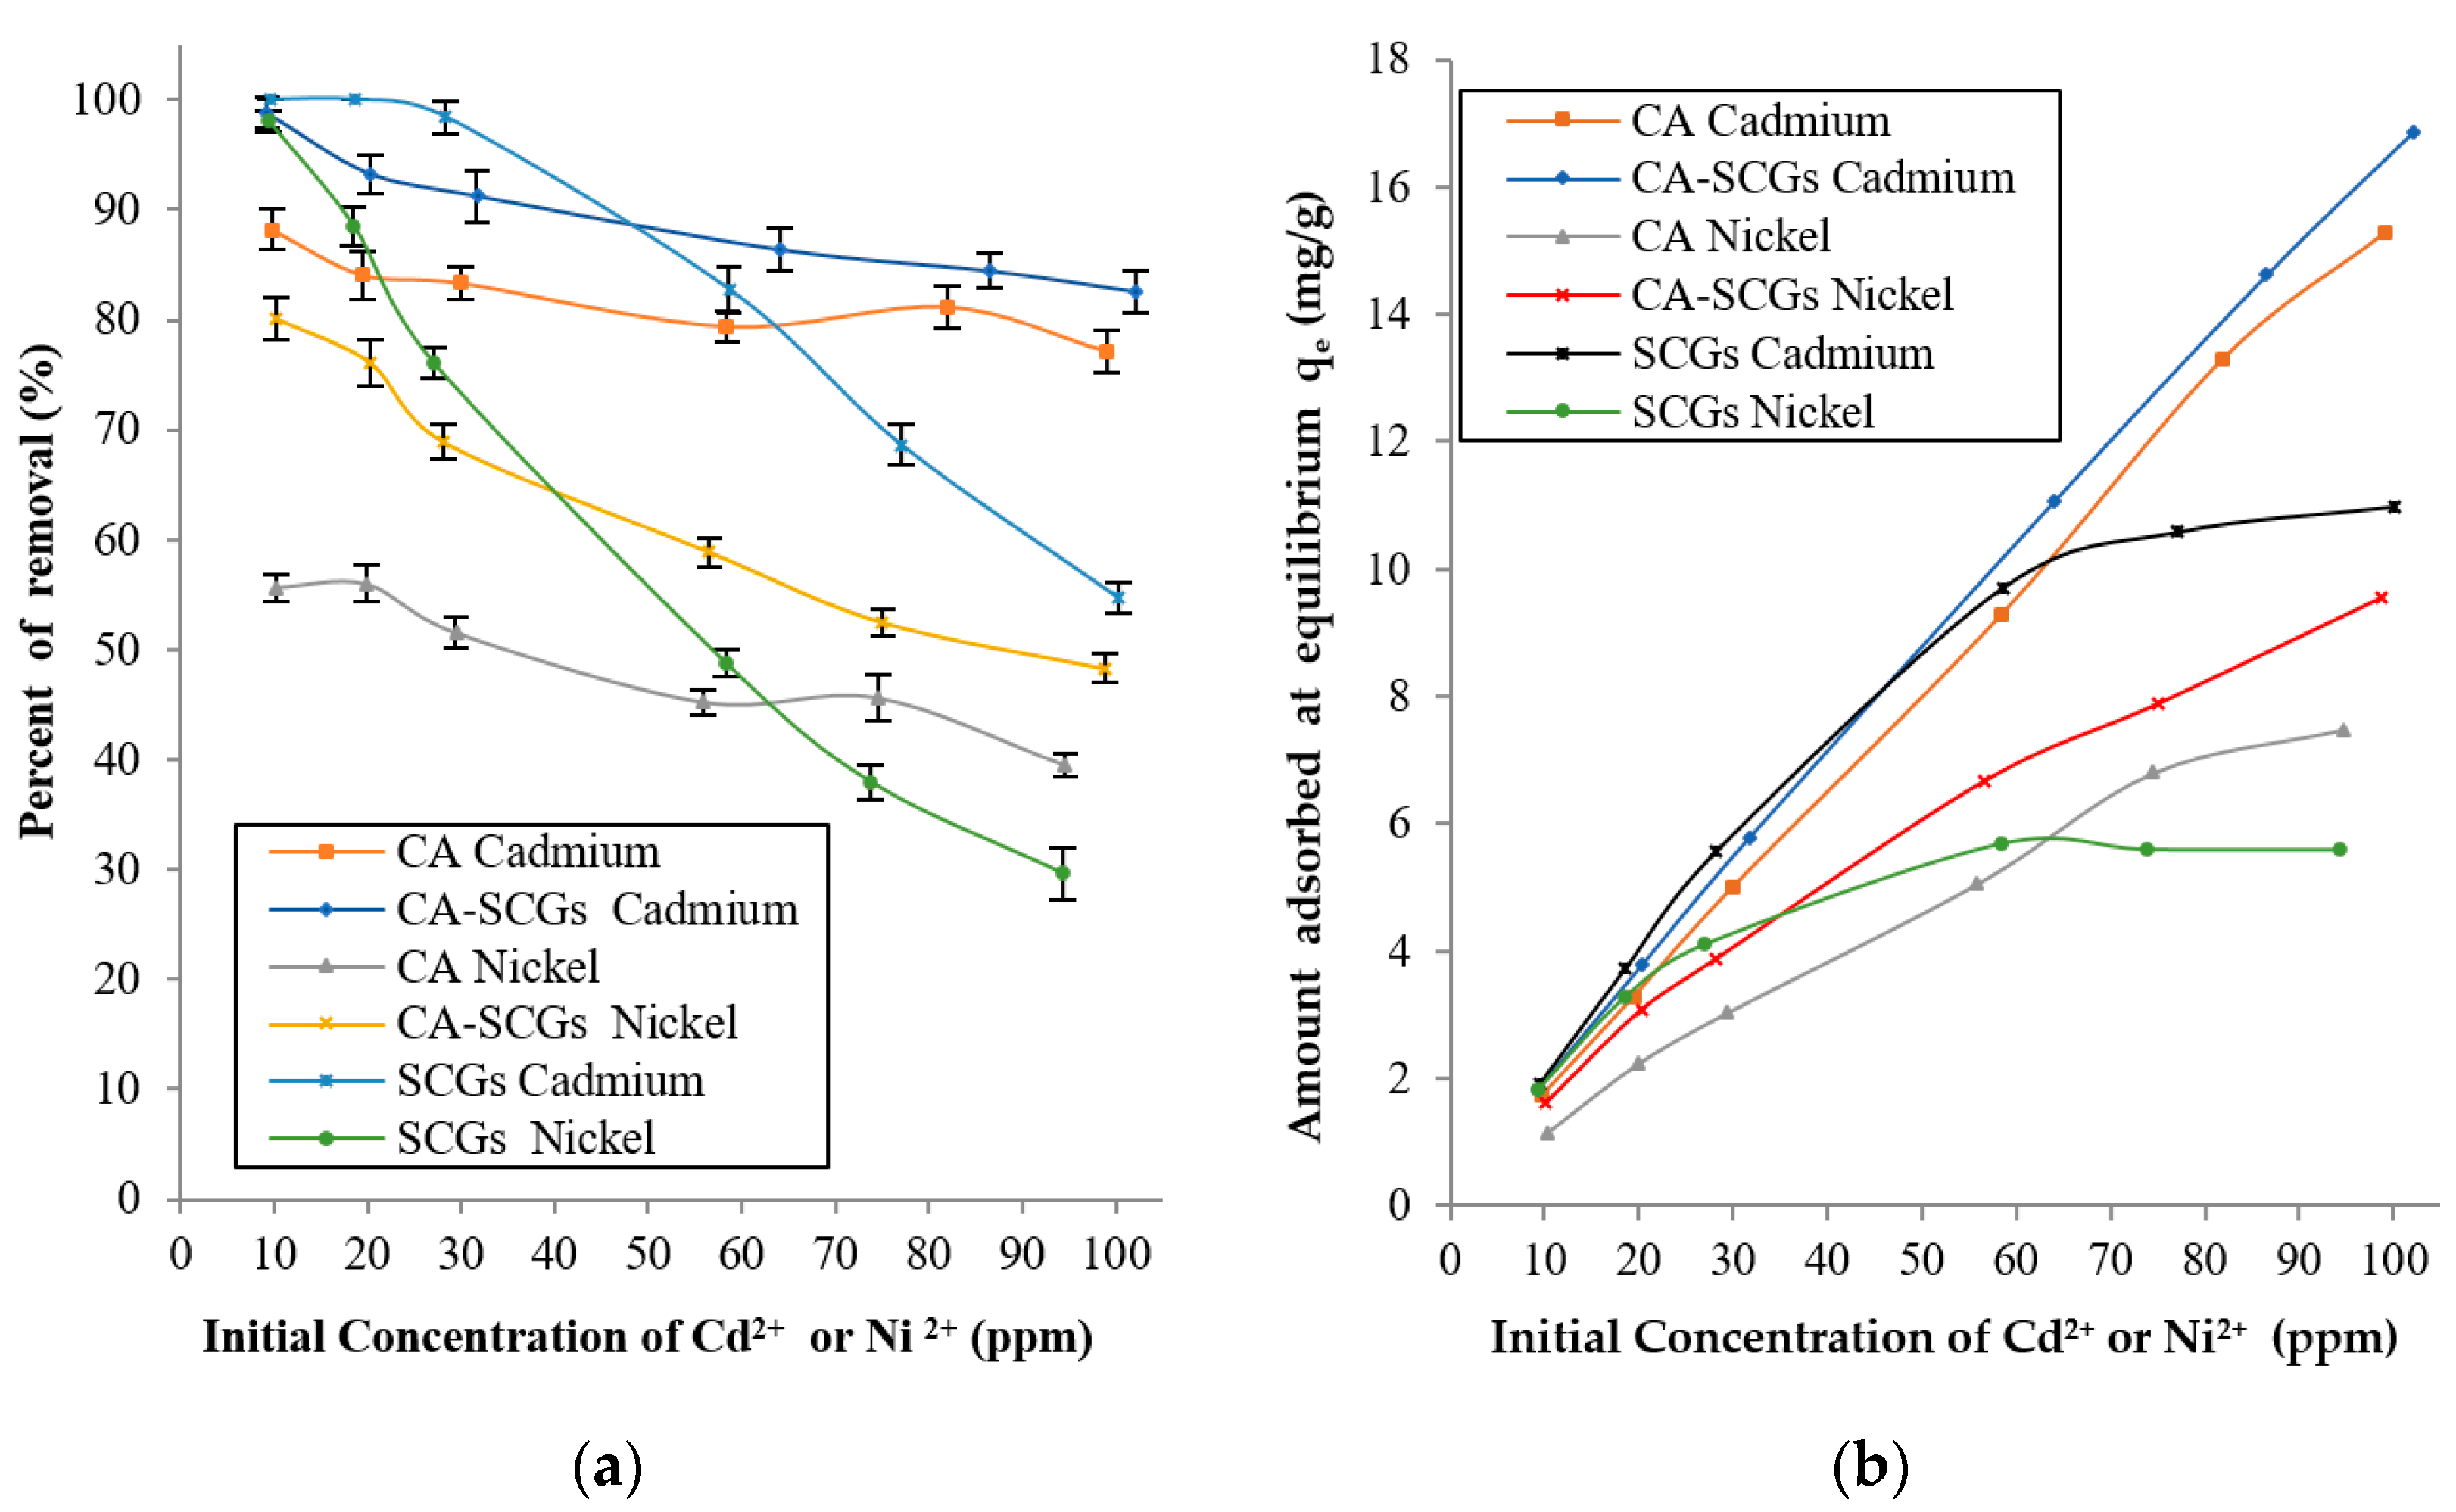
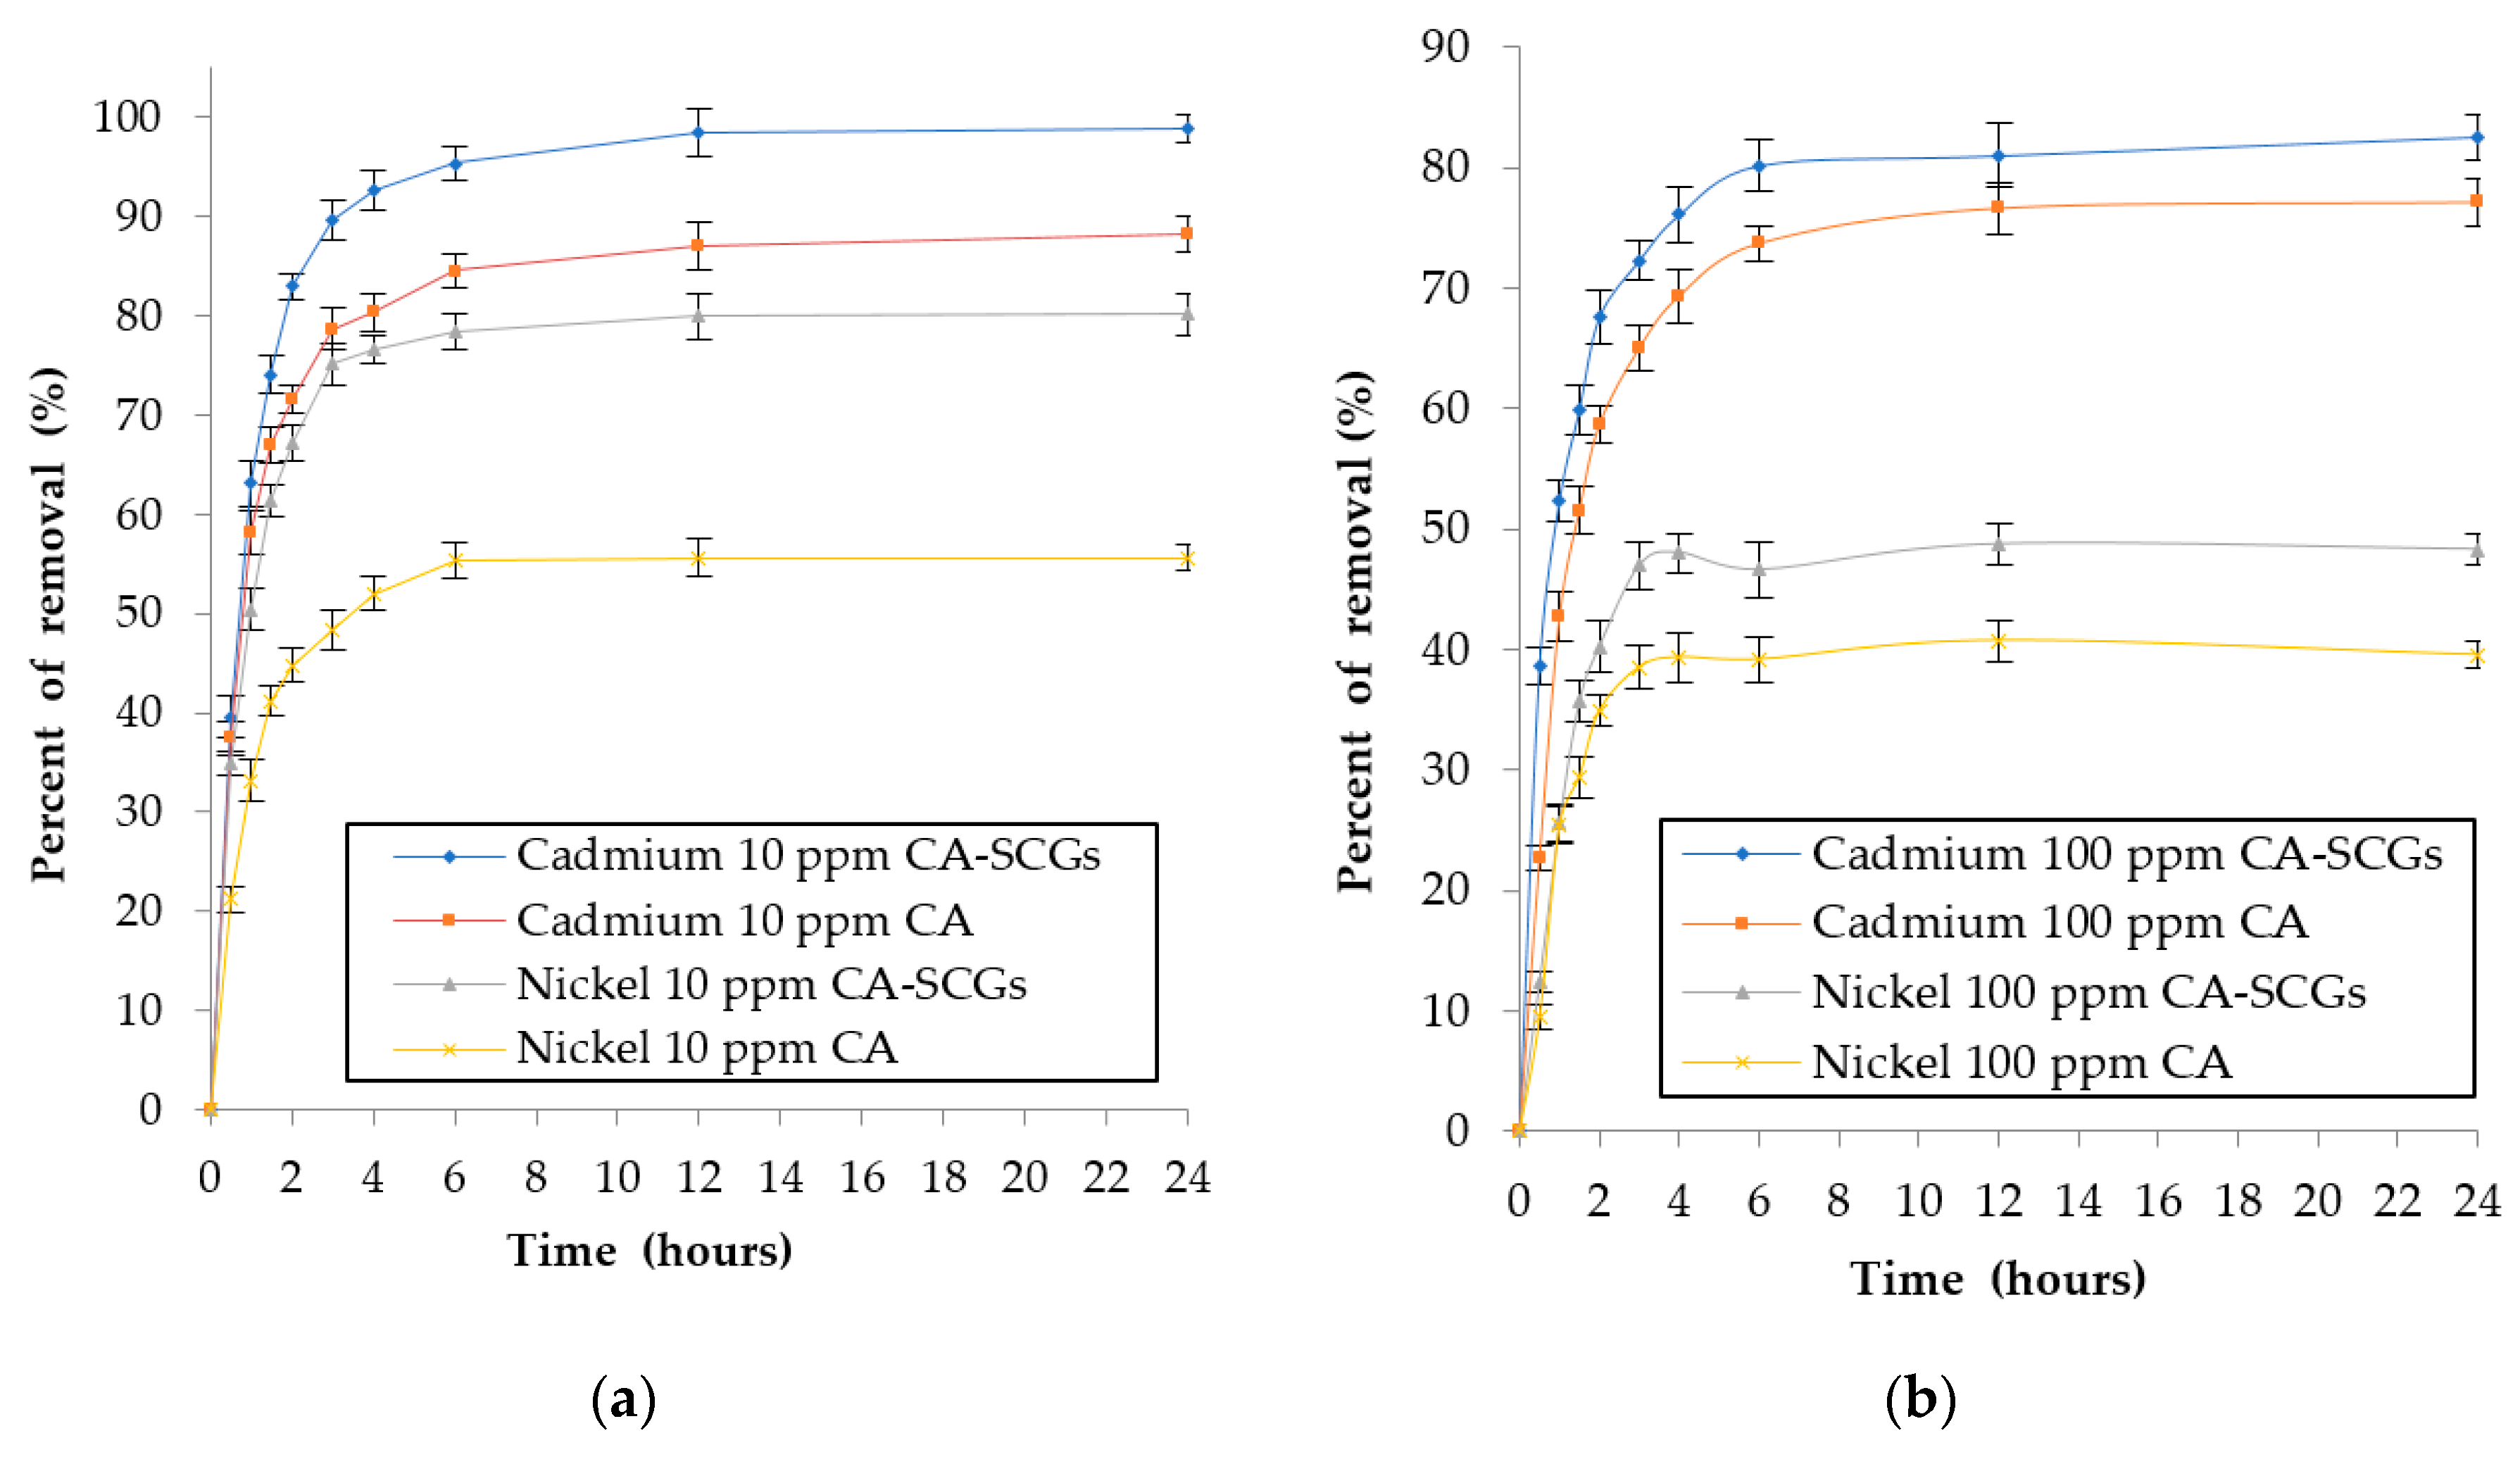
Figure 9 shows that at concentrations of 10 and 20 ppm, SCGs achieved total removal of Cd2+ and 98.07% (s = 0.95%) of removal of Ni2+ at 10 ppm. Nevertheless, the CA beads without SCGs had percentages of removal of 88.23% (s = 1.81%) for Cd2+ and 55.66% (s = 1.25%) for Ni2+ at metal concentrations of 10 ppm. The CA–SCGs beads had percentages of removal of 98.81% (s = 1.41%) for Cd2+ and 80.15% (s = 1.94%) for Ni2+ at 10 ppm. The CA–SCGs beads almost achieved total removal of Cd2+ and showed an improvement of 24.49% in the average of removal of Ni2+ at metal concentrations of 10 ppm. The adsorbent SCGs reached a level of saturation of 10.98 mg/g (s = 0.15 mg/g) for Cd2+ and 5.6 mg/g (s = 0.08 mg/g) for Ni2+. Below that level of saturation, SCGs reached levels of removal closer to 100%. That was not the case for CA beads; the CA beads did not reach the saturation level at metal concentrations between 10 to 100 ppm, nor did they reach average levels of adsorption above 90%. This means that in the equilibrium of metal adsorption by CA beads, part of the dissolved metal will stay in the solution, so the only way to increase the metal adsorption is to increase the concentration of metal in the solution. Possibly, parts of the metal ions do not have enough affinity with the adsorption sites of the CA beads and are prone to stay in solution instead of being adsorbed by the CA beads. The addition of SCGs to the matrix of CA allowed for percentages of removal closer to 100% beyond of the saturation level of SCGs for metal concentrations of 10 to 100 ppm.
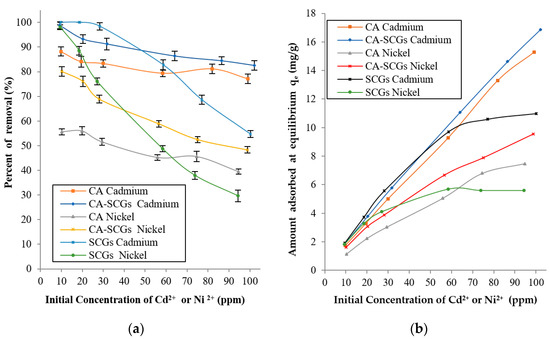
Figure 9.
Amounts Cd2+ or Ni2+ absorbed 2+2+at 24 h for each initial concentration of metal: (a) Percentages of removal at 24 h and (b) Experimental amounts of metal adsorbed at equilibrium (qe).
3.7. Analysis of Adsorption Isotherms
In this study, three models were used: Langmuir, Freundlich, and Sips. The Langmuir model is the most commonly used model of adsorption isotherm and it assumes monolayer adsorption (the adsorbed layer is one molecule in thickness). The adsorption can only occur at a finite (fixed) number of definite localized sites that are identical and equivalent. The non-linear Langmuir model is described in Equation (4) [15]:
where qmax is the maximum monolayer coverage capacity (mg/g) and bL is the Langmuir isotherm constant (L/mg) related to the affinity.
qe = (qmax × bL × Ce)/(1 + bL × Ce)
Freundlich model is applied to multilayer adsorption, with non-uniform distribution of adsorption heat and affinities over the heterogeneous surface. The stronger binding sites are occupied first, until adsorption energy is exponentially decreased upon the completion of adsorption process. The non-linear Freundlich model can be represented by Equation (5) [31]:
where Kf is the adsorption capacity (mg/g)(L/mg)(1/n) and 1/n is the adsorption intensity, which also indicates the relative distribution of the energy and the heterogeneity of the adsorbate sites, becoming more heterogeneous as its value gets closer to zero.
qe = Kf × Ce1/n
Sips model is a combination of the Langmuir and Freundlich models. The non-linear Sips model is described in Equation (6) [32]:
where qe is the adsorbed amount at equilibrium (mg/g), Ce is the equilibrium concentration of the adsorbate (mg/L), qmax is the Sips maximum adsorption capacity (mg/g), bS is the Sips equilibrium constant (L/mg), and 1/n is the Sips model exponent. Values for 1/n <1 indicate heterogeneous adsorbents, while values closer to 1.0 indicate a material with homogenous binding sites. If 1/n =1, the Sips model is reduced to the Langmuir equation [33].
qe = (qmax × bS × Ce1/n)/(1 + bS × Ce1/n)
Non-linear equations were used for the three models; therefore, all model parameters were evaluated by non-linear regression using an optimization routine of the Microsoft Excel solver tool. The objective was to minimize the sum of squared errors (SSE) in the concentration range used in adsorption experiments. This method seeks to minimize the value of SSE between observed and calculated values of the dependent variable. The value of SSE was calculated from Equation (7) [34]:
where qexp is the experimental data, and qmodel is the value predicted by the model at the corresponding Ce. To compare the applicability of isotherm equations and fitting it to the data, non-linear chi-square test χ2 was calculated from Equation (8) [33]:
where qe.exp is the equilibrium sorption capacity found from the batch experiment, qe.model is the prediction from the isotherm model for corresponding to Ce, and n is the number of observations. Table 2 and Table 3 show the results of the adsorption models for each adsorbent.

Table 2.
Adsorption isotherm constants and chi-square test χ2 values for each model (Cd2+).

Table 3.
Adsorption isotherm constants and chi-square test χ2 values for each model (Ni2+).
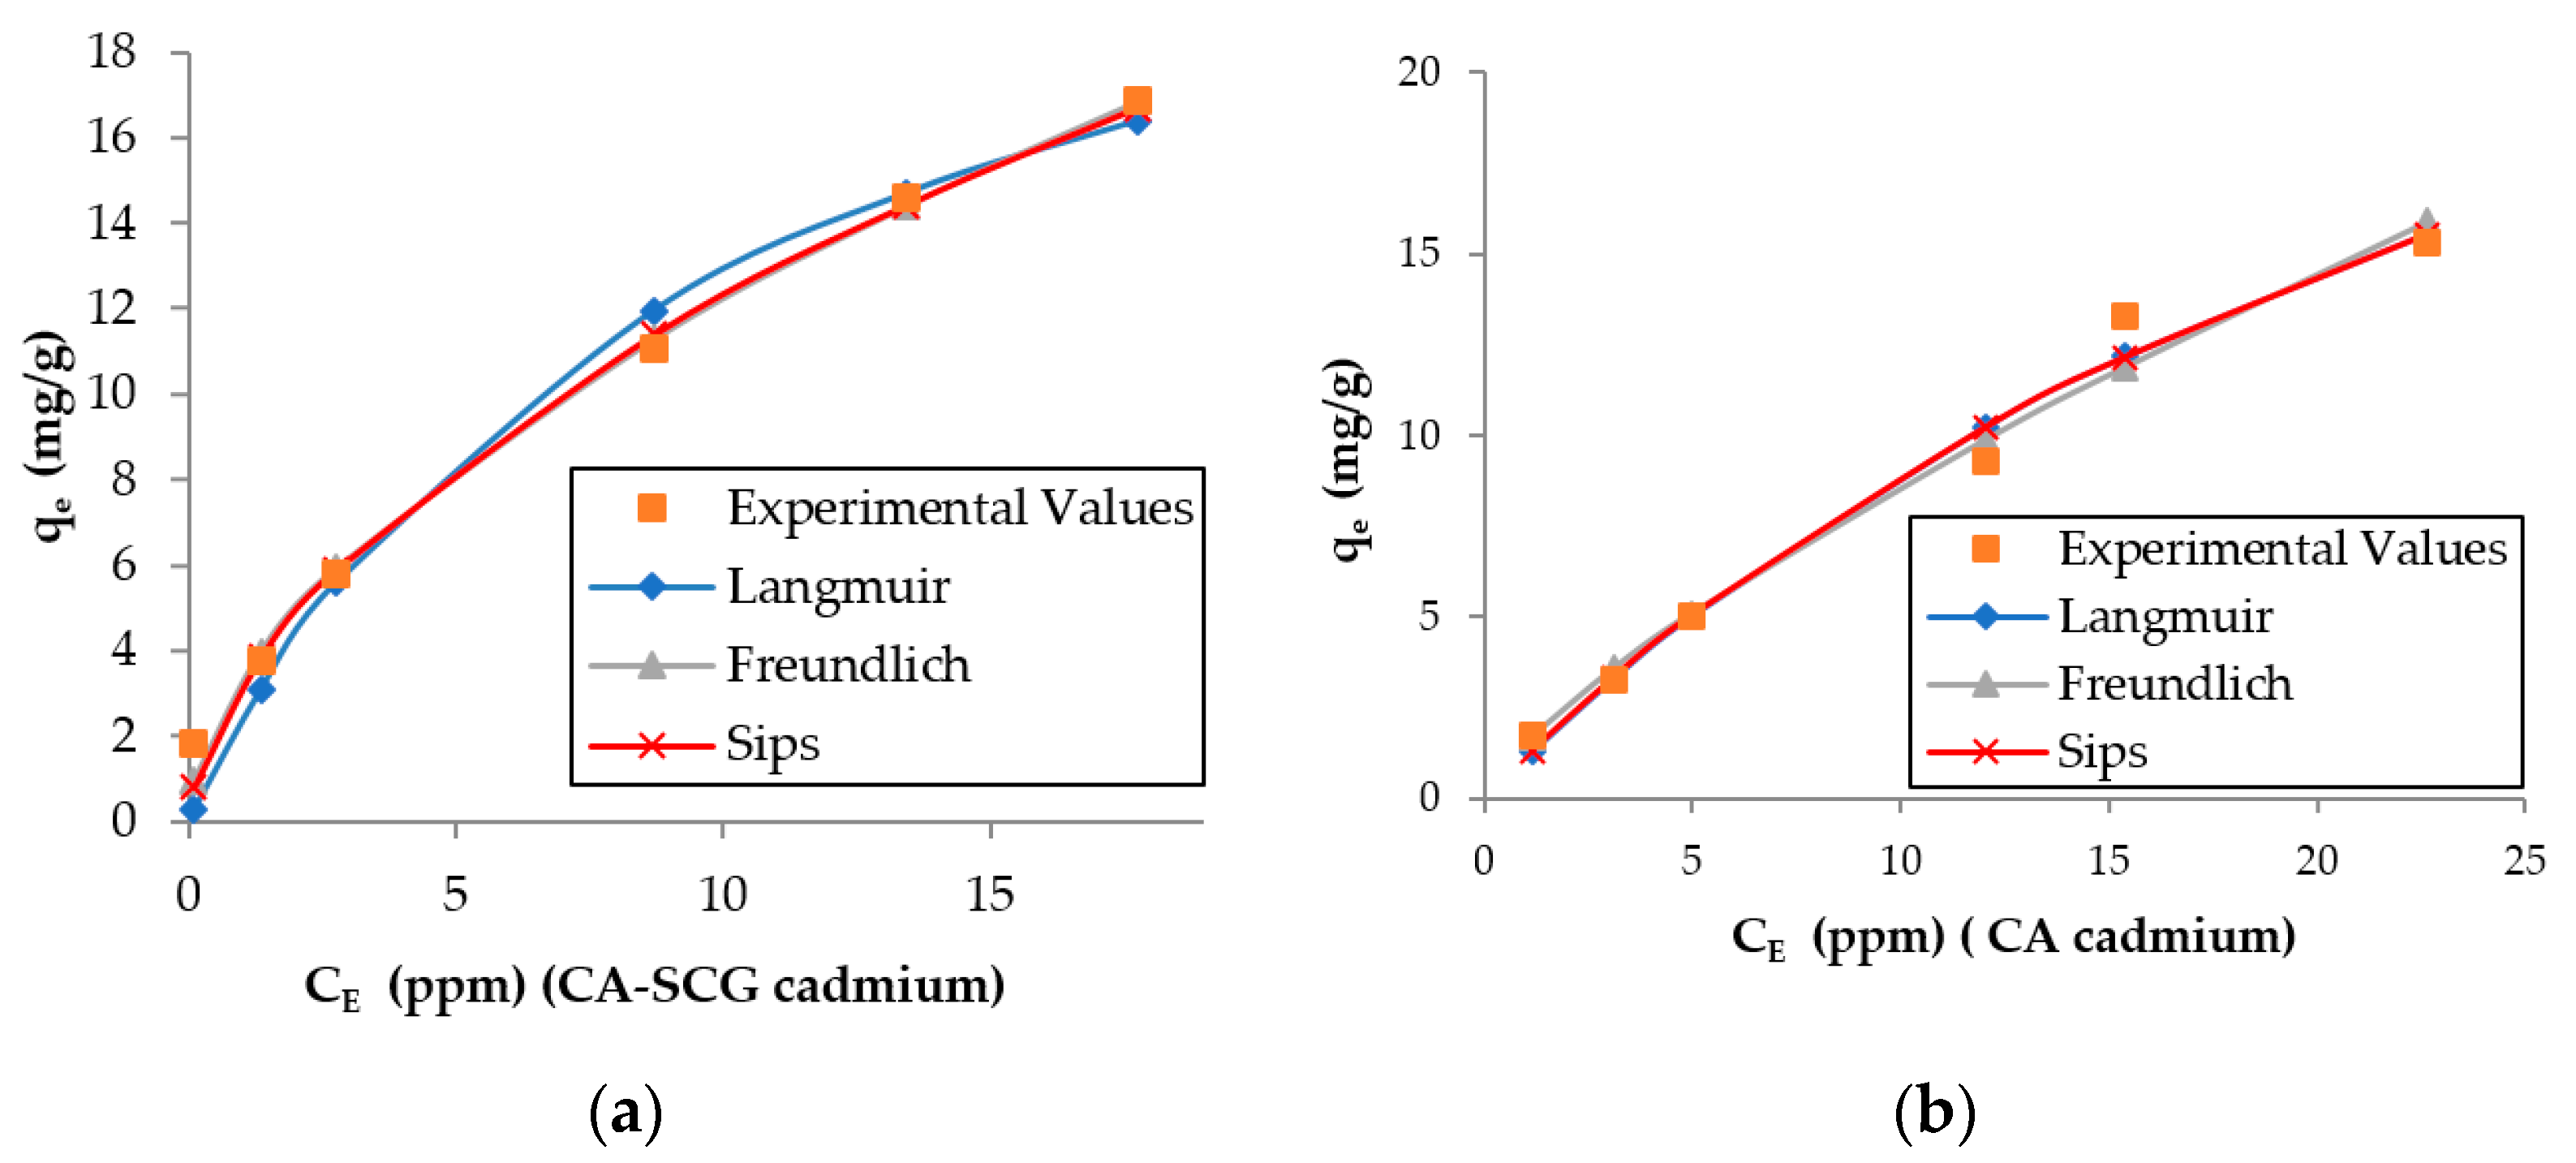
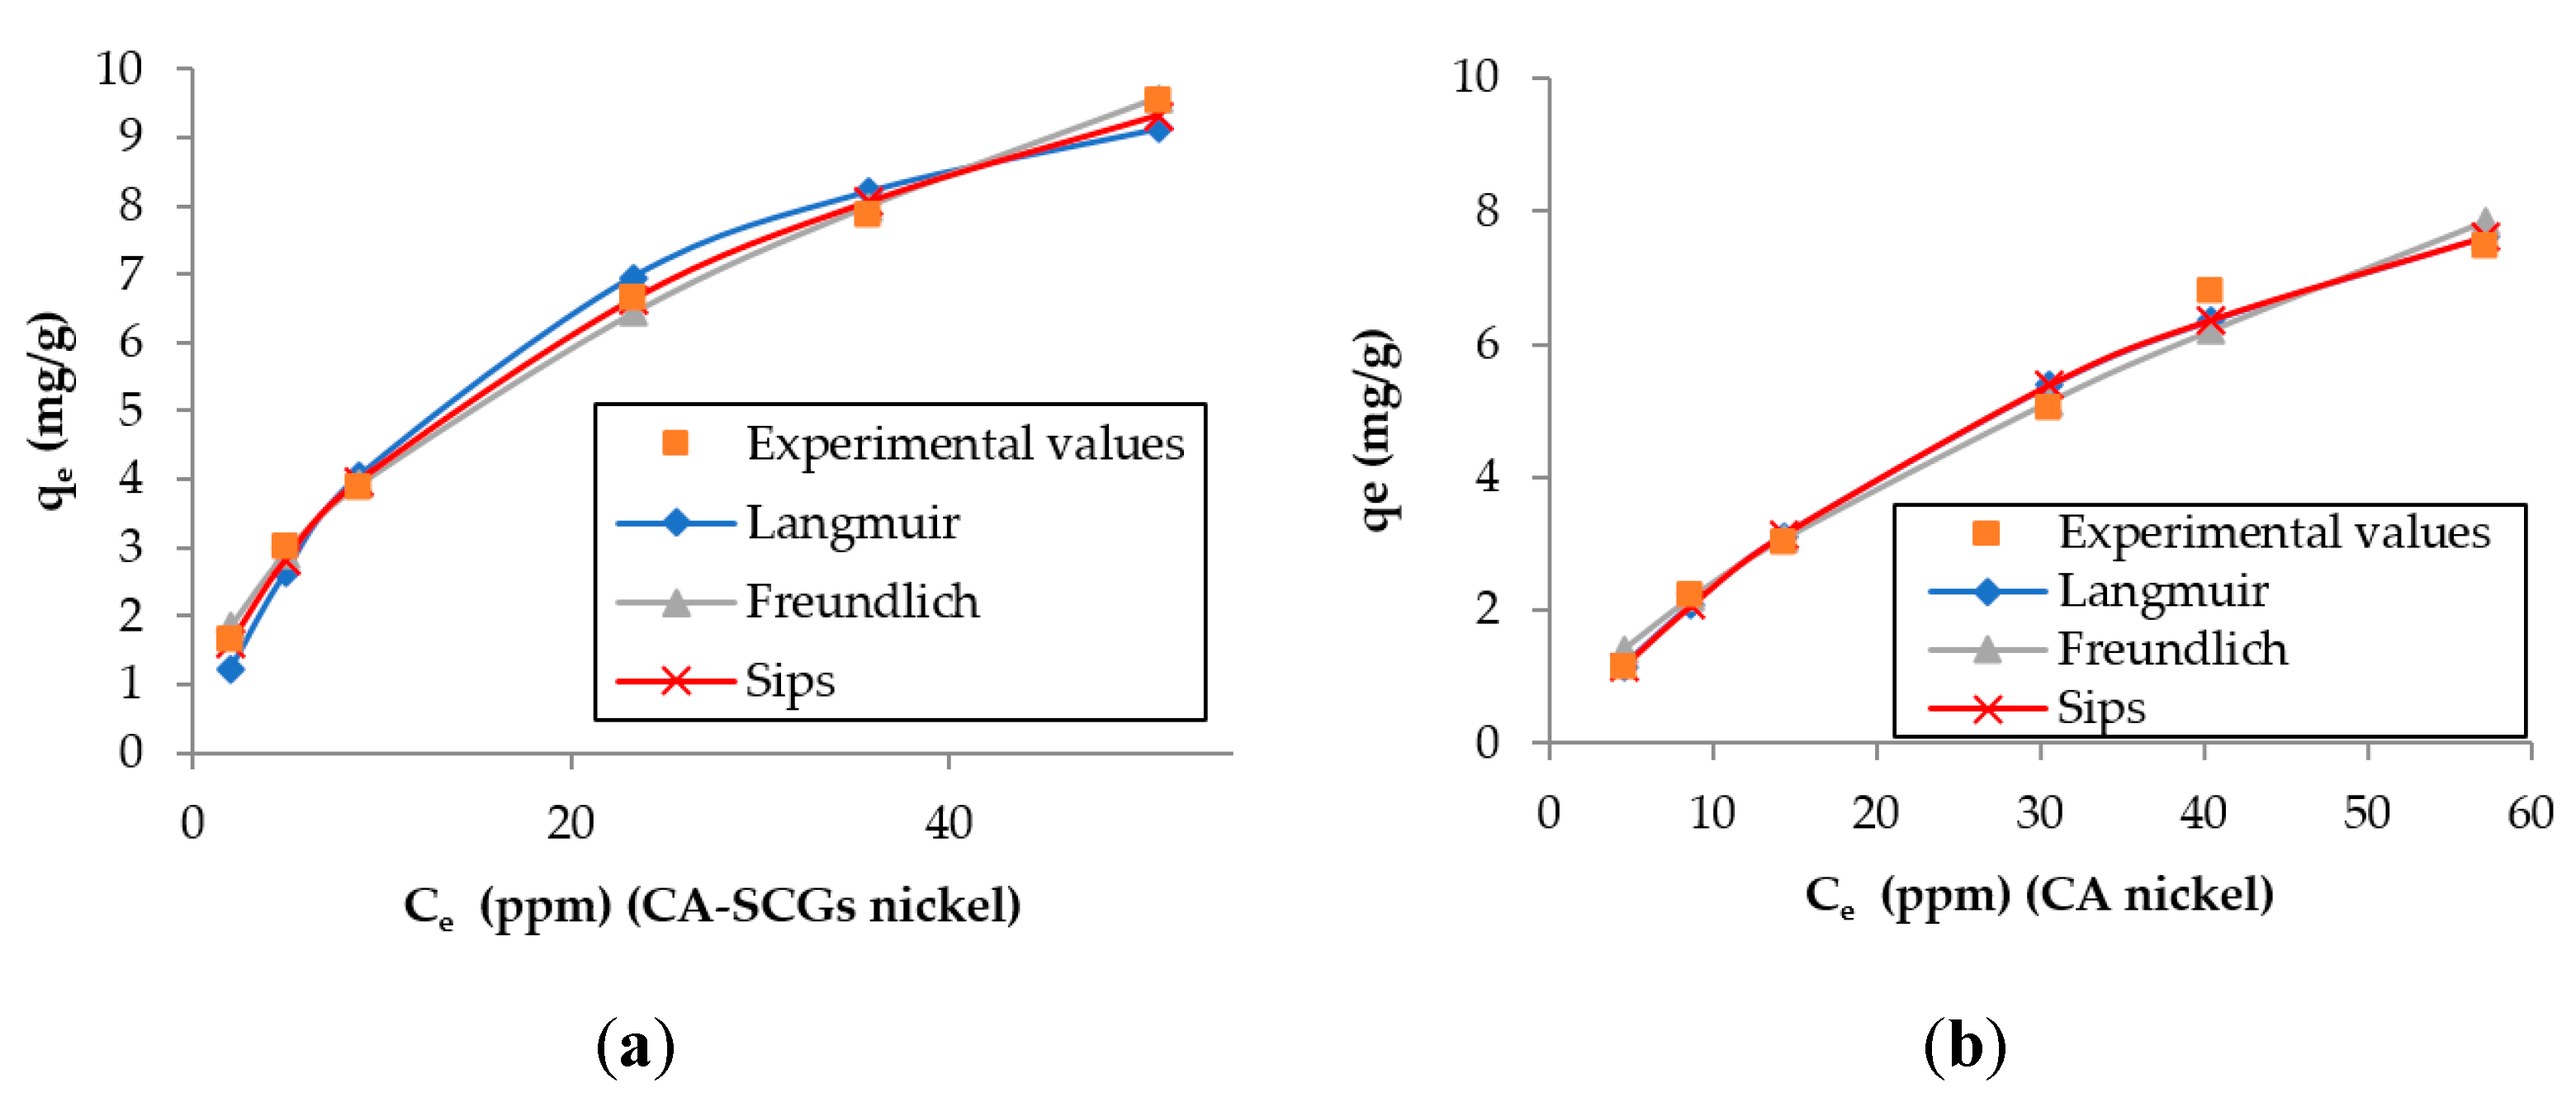
The larger values of non-linear chi-square tests χ2 for the Langmuir model of the CA–SCGs beads indicate a more heterogeneous adsorption by CA–SCGs beads than by CA beads (Table 2 and Table 3). Likewise, the experimental values of qe of CA–SCGs beads in the plots of both metals fit better with the expected values of the Freundlich and Sips models (Figure 10 and Figure 11), which describe heterogeneous adsorption. The obtained heterogeneity index (1/n) of the Sips model of CA–SCGs beads are 0.633 for Cd2+ and 0.698 for Ni2+ (more heterogeneous), while the heterogeneity index (1/n) of CA beads are about 1.0 for Cd2+ and Ni2+ (almost homogeneous adsorbent). Thus, for the CA beads, the Sips equation is reduced to the Langmuir model, indicating the preferential binding of metals on all sites of the adsorbent, which act as a homogenous surface. Therefore, the models support the idea that the adsorption sites of CA–SCGs beads are not uniformly distributed through the bead and some adsorption sites are preferred than others. The EDX spectra suggest that at a depth of 1 μm, the CA–SCGs beads have a greater proportion of adsorption sites in comparison to the CA beads.
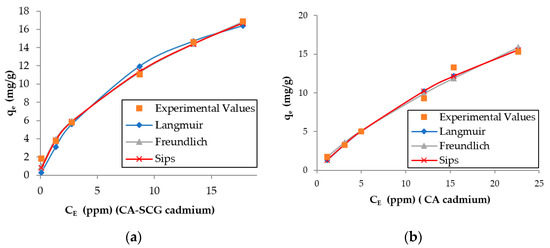
Figure 10.
Plots of the results of the adsorption models for each adsorbent and the experimental values for cadmium: (a) CA beads and (b) CA–SCG beads.
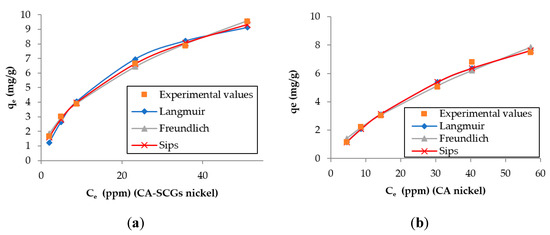
Figure 11.
Plots of the results of the adsorption models for each adsorbent and the experimental values for cadmium: (a) CA beads and (b) CA–SCG beads.
Table 4 shows a comparison of the theoretical maximum sorption capacities of different alginate, algal-based, or spent coffee adsorbents reported in the literature using Langmuir (L) and Sips (S) models. The theoretical adsorption capacity of SCGs for Cd2+ obtained in this study was higher than the value reported by Patterer, M.S. et al. [35] and similar to the value reported by Utomo, H.D. et al. [18].

Table 4.
Maximum adsorption capacities (mg/g) of different alginate, algal-based, or spent coffee adsorbents from Langmuir model (L) and Sips model (S).
The theoretical values of adsorption reported in the literature for alginate beads vary. The values for Ni2+ range from 25.60 mg/g obtained by Al-Rub, A. et al. [36] to 97.93 mg/g obtained by Nastaj, J. et al. [37]. The values of the current study were below the values for adsorption of Ni2+ by alginate beads reported in the literature. The values for Cd2+ range from 10.20 mg/g obtained by Mahmood, Z. et al. [38] to 198.43 mg/g obtained by Papageorgiou, S.K. (Sips model) [15]. In the current study, Cd2+ adsorption values were higher than the Ni2+ adsorption values, and are comparable with values obtained in other studies. It is worth mentioning that the adsorption by CA–SCGs beads in this study did not fit well with the Langmuir model of adsorption as was discussed earlier in this manuscript. The Sips model, however, showed a better correlation.
3.8. Kinetic Experiments
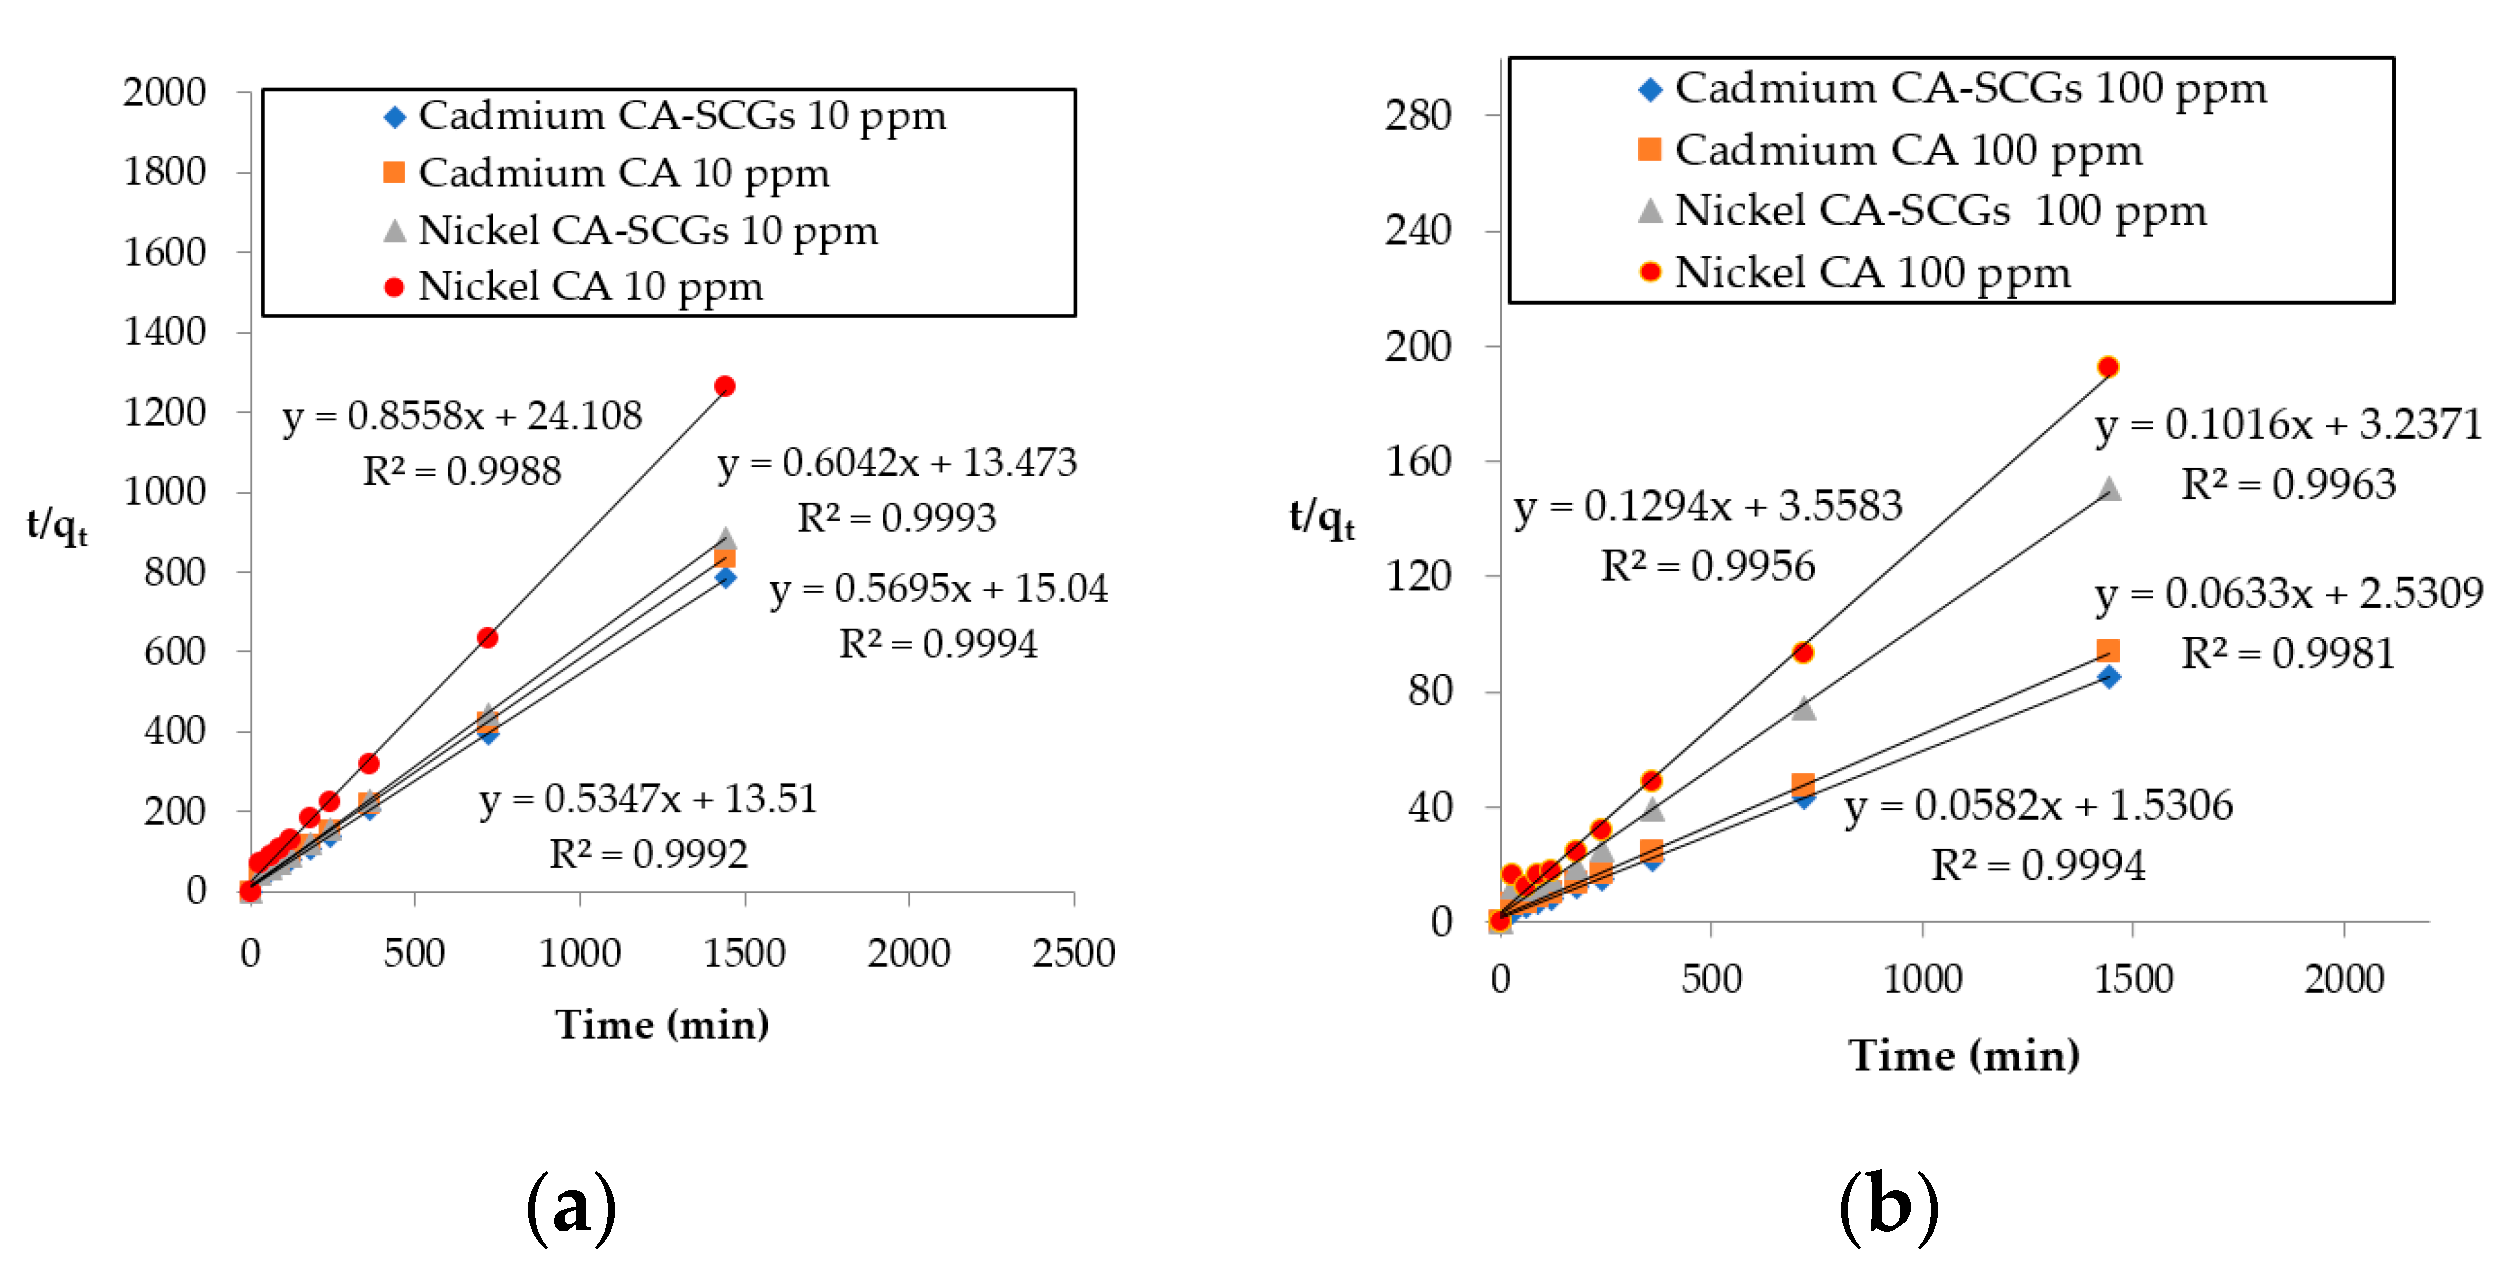
The effect of contact time during the adsorption of Cd2+ and Ni2+ ions by 0.5g of adsorbent in 100 mL of solution was investigated with initial concentrations 10 ppm and 100 ppm of metal. The percentages of removal by time can be seen in Figure 12. The pseudo-second-order linear equation was used to evaluate the kinetic data because it showed the best fit with the results (R2 > 0.995). The pseudo-second order model assumes that the rate-limiting step may be chemical sorption or chemisorption involving valency forces through sharing or exchange of electrons between adsorbent and adsorbate.
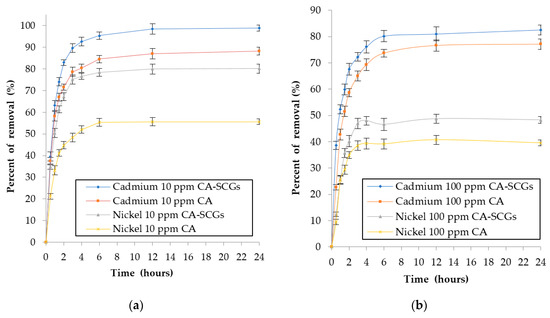
Figure 12.
Plots of percent of removal of metal vs. time: (a) initial concentration of 10 ppm of metal and (b) initial concentration of 100 ppm of metal.
Intraparticle diffusion was found to be rate-limiting following the pseudo-first order sorption rate expression of Lagergren [44] but that is not the case in this study. Therefore, the kinetics of adsorption in this study is mainly due to chemisorption, not diffusion. The linear pseudo-second-order equation is described by Equation (9) [45]:
where k2 (g/mg-min) is the rate constant of pseudo-second-order adsorption, qe (mg/g) is the amount of Cd2+ or Ni2+ ions at equilibrium, and qt (mg/g) is the amount of Cd2+ or Ni2+ ions adsorbed at time t (min). The slope and the intercept of graph t/qt versus t, give the values of k2 and the qe calculated during the adsorption of metal ions at a specific initial concentration of Cd2+ or Ni2+. The kinetic parameter h (mg g−1min−1) is the initial adsorption rate when t→0. This parameter can be calculated by using Equation (10) [45]:
t/qt = 1/(k2qe2) + t/qe
h = k2qe2
Figure 13 shows the plots of pseudo-second-order linear equations and the results obtained from these plots are summarized in Table 5. The initial adsorption rate parameter (h) is greater for CA–SCGs beads in the adsorption of Ni2+ and Cd2+ at both initial concentrations. The rate constant of pseudo-second-order adsorption (k2) is greater for CA–SCGs in the adsorption of Cd2+ but not in the adsorption of Ni2+. Our previous study on the adsorption of Cu2+ by CA–SCGs at pH 4 showed a much larger difference between the kinetics of adsorption by the CA–SCGs beads and the kinetics of adsorption by the CA beads [10]. In addition to the different pH level, this can be explained by the affinity of the metal toward the lignin and the alginate. The differences in kinetics of adsorption by CA–SCGs beads seen in the previous study with Cu2+, and in this current study with Cd2+ and Ni2+, match the affinities of Cu2+, Cd2+ and Ni2+ toward the alginate and lignin seen in studies reported in the literature [28,46].
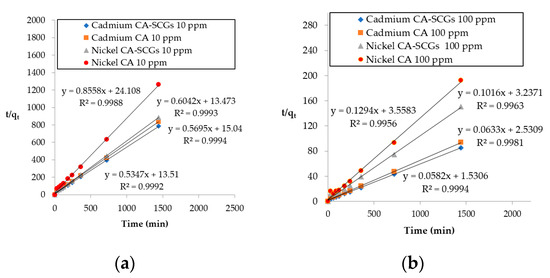
Figure 13.
Plots of pseudo-second-order linear equations: (a) initial concentration of 10 ppm of metal and (b) initial concentration of 100 ppm of metal.

Table 5.
Adsorption kinetic parameters.
Jodra and Mijangos deduced the selectivity order for ion exchange of CA for heavy metals with the following result: Pb > Cu > Cd > Ni > Zn > Co. The reported estimated equilibrium constants in their study were: KCu = 649 kgL/mol2, KCd = 172 kgL/mol2 and KNi = 30.8 kgL/mol2 [46]. Our previous study with Cu2+ showed a great improvement in the kinetics of adsorption by the CA–SCGs beads versus the CA beads, despite that the study was at pH of 4, with more protons competing with the metal for adsorption sites [17]. Nevertheless, the current study shows improvement in the kinetics of adsorption of Cd2+ in CA–SCGs versus the CA beads, but did not show any improvement in the kinetics of adsorption of Ni2+ in CA–SCGs versus the CA beads. These results of kinetics could be related to a poor affinity of Ni2+ to the CA.
Guo, X. et al. showed in their study that lignin has affinity with metal ions in the following order: Pb(II) > Cu(II) > Cd(II) > Zn(II) > Ni(II) [28]. Lignin affinity is more important than alginate affinity because one of the major differences between the CA beads and the CA–SCGs beads is the presence of the phenolic groups of lignin in the CA–SCGs beads. Again, the order of affinity with lignin follows the order of the kinetics seen in the previous study with Cu2+ and the current study with Cd2+ and Ni2+. As was discussed earlier, the lignin contains two main types of adsorption sites attributed to carboxylic- and phenolic-type groups, but the phenolic sites have a higher affinity for metal ions than the carboxylic sites [28]. Alginate does not have phenolic groups; therefore, the phenolic groups could follow the same pattern of affinity to the metals than the carboxylic groups.
A third explanation for the differences in adsorption kinetics is the structural changes in the bead caused by the metal adsorbed. An unusual phenomenon was seen during the test of adsorbent dose effect at the lowest dose of adsorbent (0.025 g of adsorbent in a solution with a concentration of 20 ppm of metal). This phenomenon was the swelling of the beads after of the adsorption of nickel. The swelling is also related to the affinity of the metal to alginate. In the study of Jodra and Mijangos [46], metals such as Pb, Cu, and Cd make the bead shrink under some experimental conditions. Metals such as Ni, Zn, and Co, which have less affinity to alginate, swelled over all the concentration ranges studied [46]. The swelling of the beads after the adsorption of Ni2+ allowed a gradual entrance of water inside of the bead. This gradual entrance of water during the process of swelling changed the distribution of SCGs throughout the bead obtained during the instant precipitation of the bead in the original synthesis. Also, the water inside the bead changed the overall structure of both types of beads, altering the adsorption because the exchange of water between the inside and outside of the bead will not be the same as if the bead maintained a more rigid structure. The swelling could be the reason of why the CA–SCGs beads did not show any improvement in the kinetics versus the CA beads during the adsorption of Ni2+. On the contrary, the swelling was greater in the CA–SCGs beads because they have less alginate relative to the concentration of Ni2+ and it could explain why the adsorption of Ni2+ by CA–SCGs beads was slower than the adsorption by CA beads. It could also describe why the EDX spectra showed more similar contents of Ni2+ between the CA beads and CA–SCGs beads, but a large difference in the content of Cd2+, because only the alginate portion of the bead is swelled, not the portion of SCGs. This phenomenon is more visible at the lowest dose of adsorbent because the adsorbent is exposed to a much more amount of Ni2+. Figure 14 shows photos of this swelling.

Figure 14.
Beads at a dose of 0.025g of adsorbent in a solution with a concentration of 20 ppm of metal: (a) CA beads before adsorption, (b) CA–SCGs beads before adsorption, (c) CA–SCGs beads after adsorption of Ni2+, (d) CA–SCGs beads after adsorption of Cd2+, (e) CA beads after adsorption of Ni2+ and (f) CA beads after adsorption of Cd2+ (inside of the circle).
3.9. Adsorption/Desorption Studies
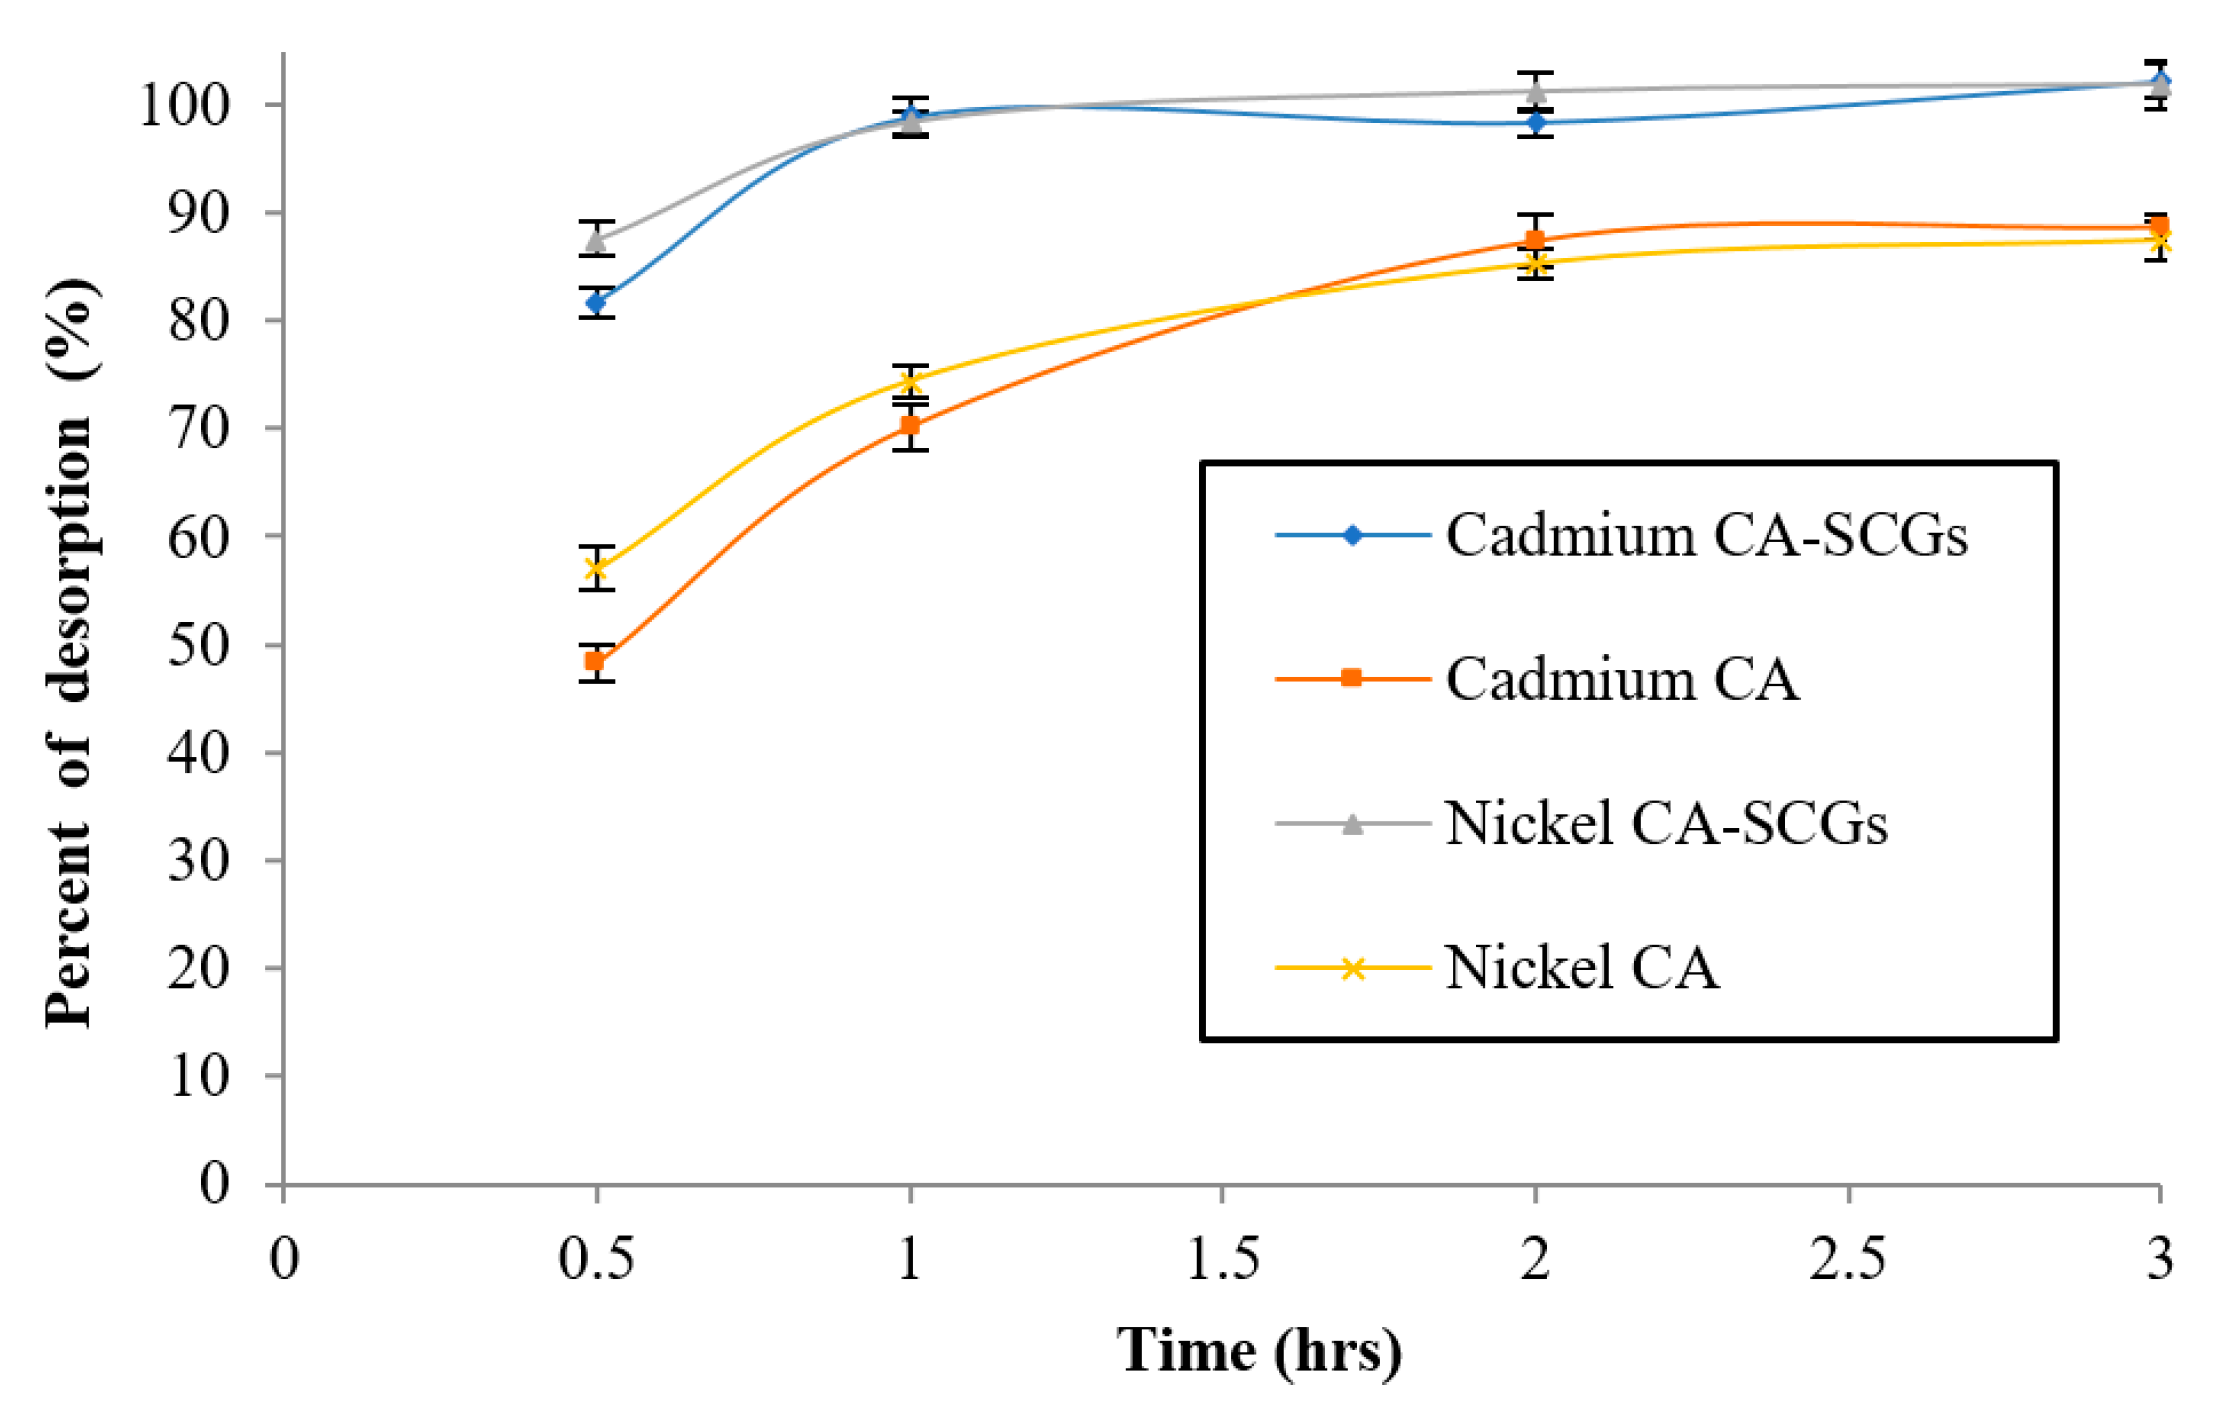
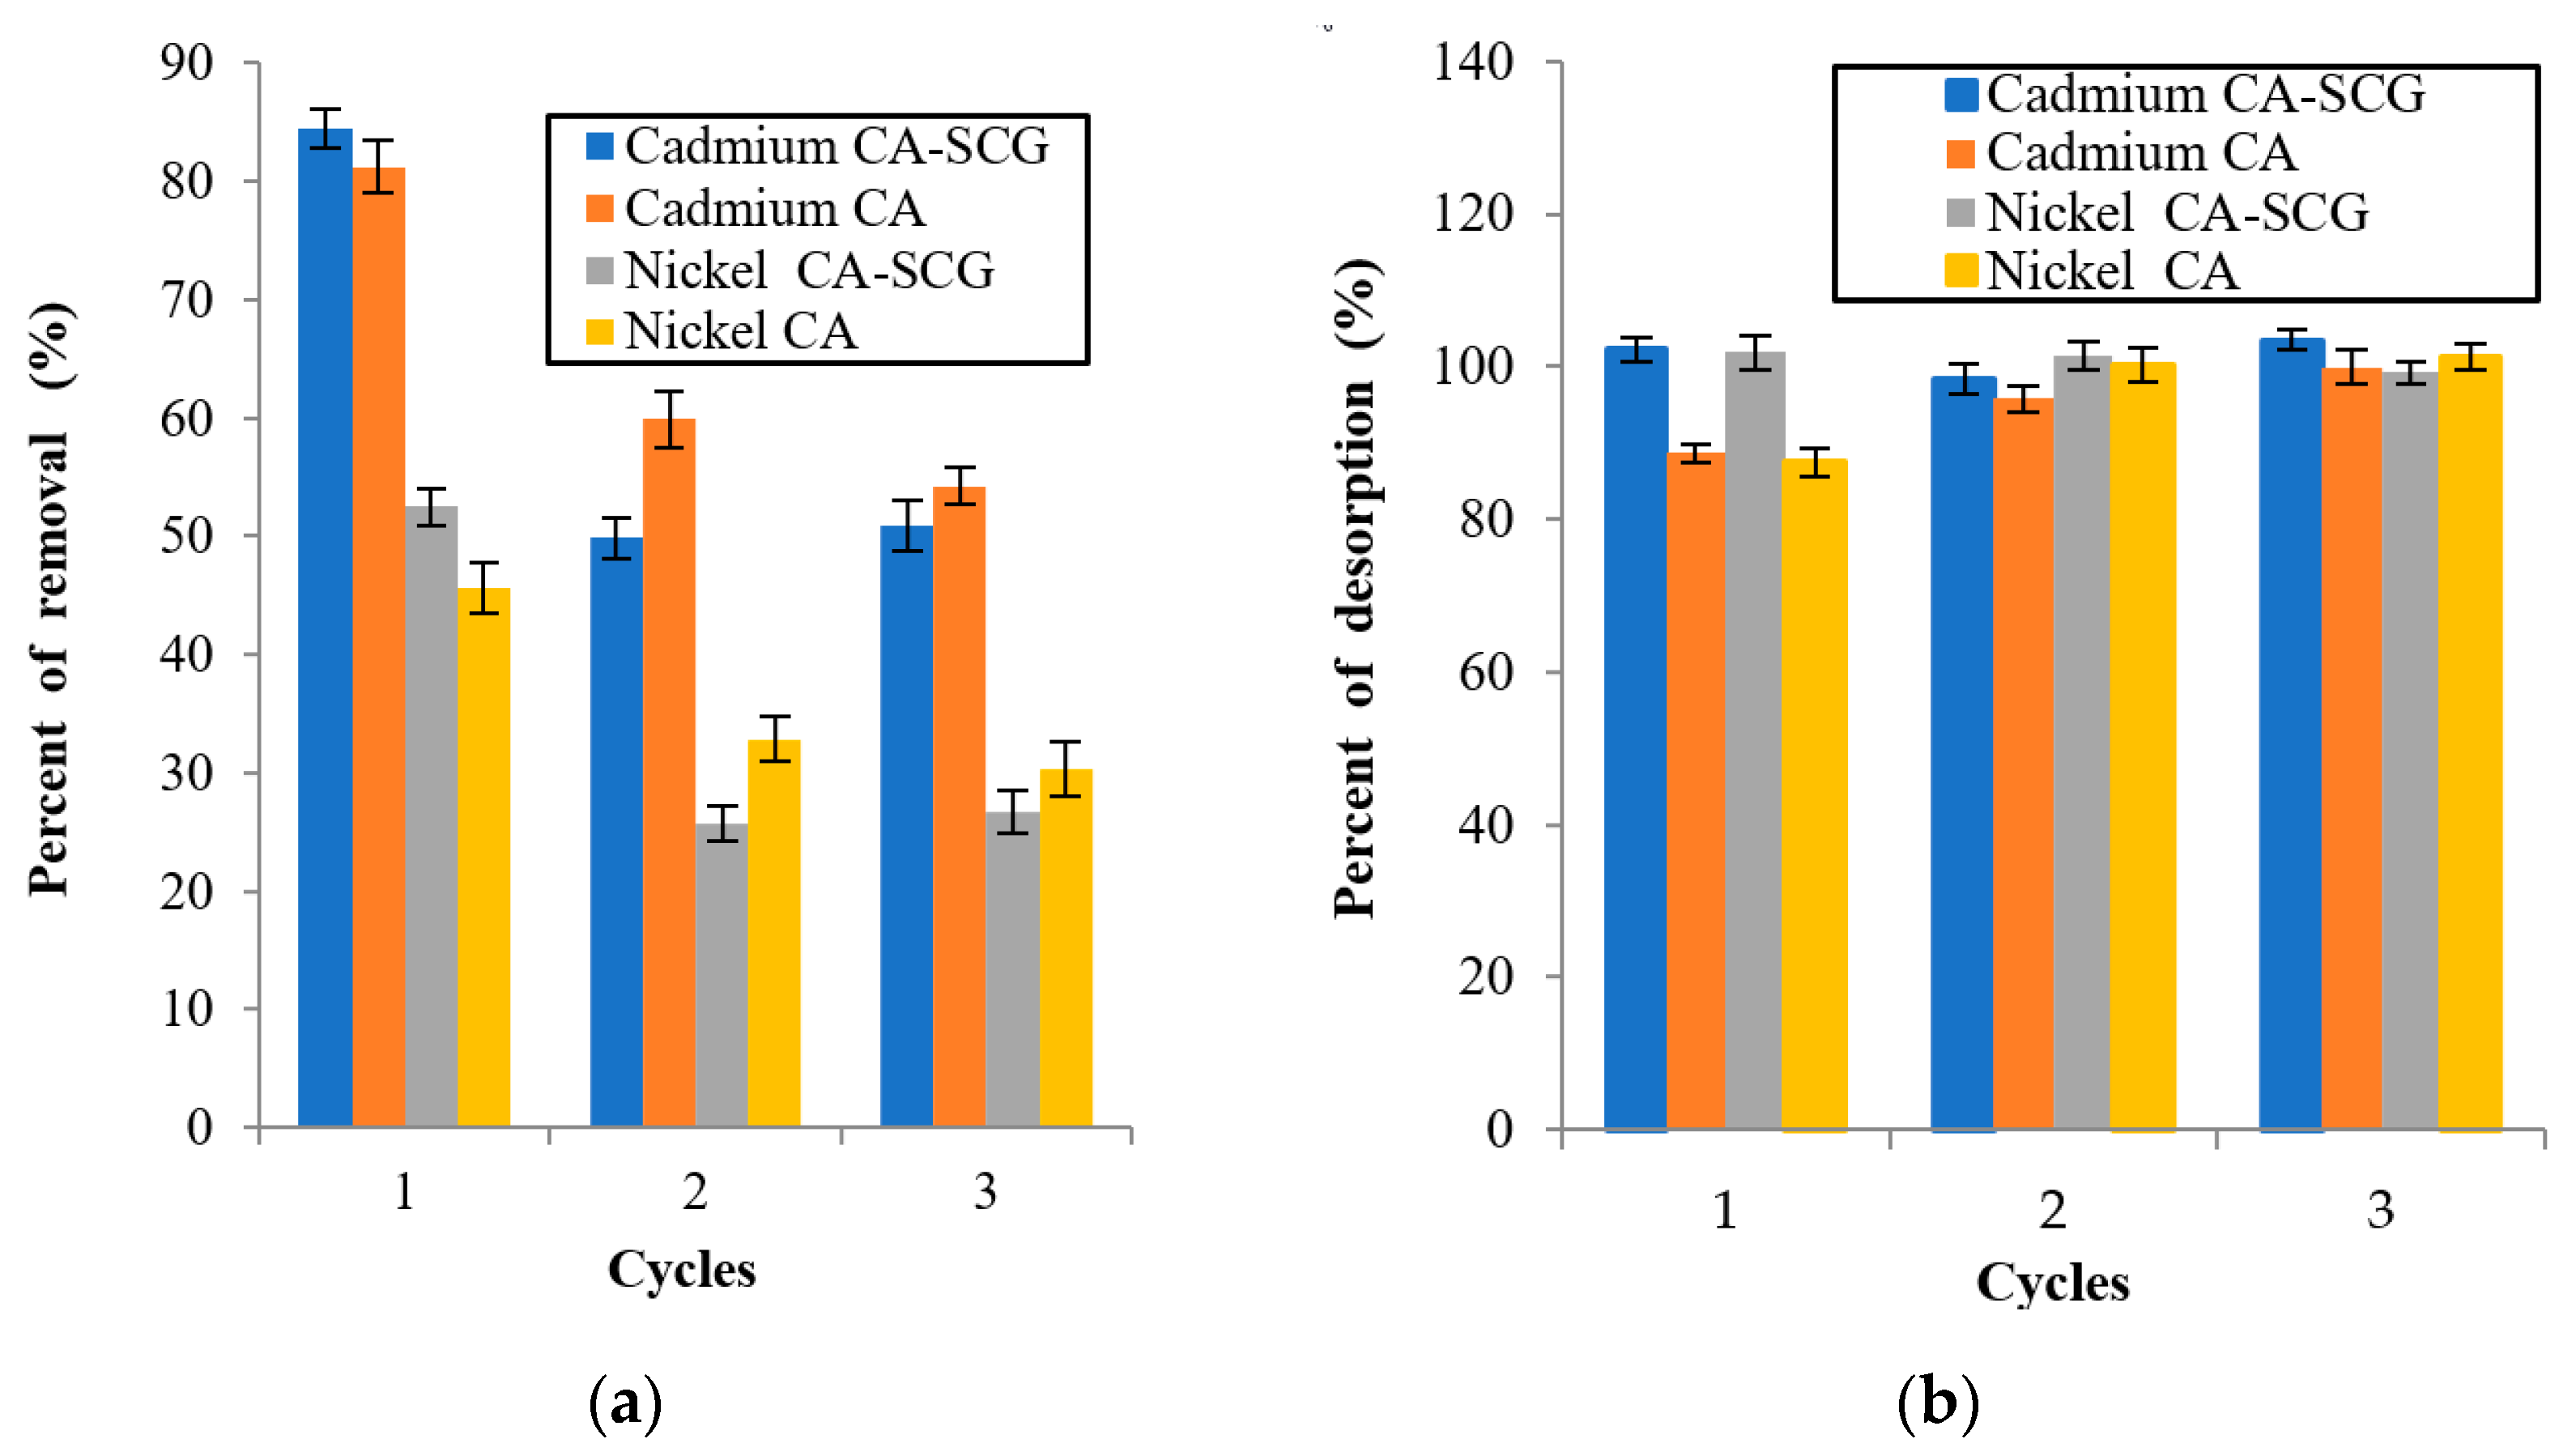
After adsorption of Ni2+ or Cd2+ at a concentration of 80 ppm, desorption of the metal from the bead was performed using 0.1 M HNO3. Nitric acid at a concentration of 0.1 M has been used before for desorption of heavy metals from the SCGs with high desorption efficiency [47]. The effect of time in the percent of desorption was studied in the first cycle of desorption and it can be seen in Figure 15. Desorption of the adsorbed cadmium from the CA–SCGs beads reached 102.25% (s = 1.67%) and desorption of nickel reached 101.87% (s = 2.20%). The equilibrium of desorption from this adsorbent was achieved in one hour. Desorption from the CA beads reached 88.6% (s = 1.21%) for cadmium, and 87.4% (s = 1.86%) for nickel; the equilibrium was achieved in two hours. Figure 16 shows the results of percent of metal removal from the solution for each cycle and the percent of metal desorption from the bead for each cycle.
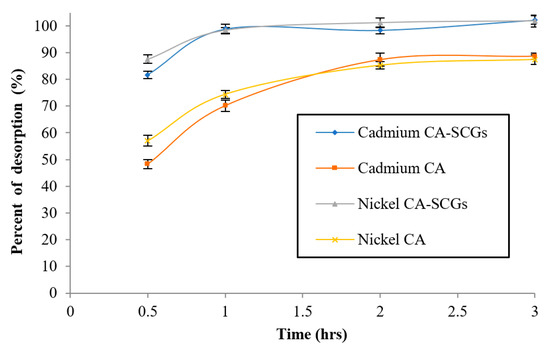
Figure 15.
Effect of time in the first cycle of desorption.
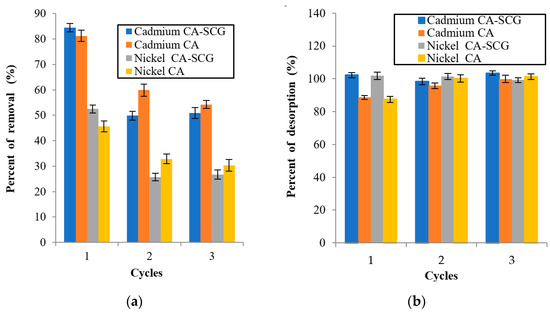
Figure 16.
Adsorption/Desorption results for each cycle: (a) percent of removal of metal from the solution for each cycle and (b) percent of desorption of the metal from the bead for each cycle.
Figure 16 shows a decrease in the metal adsorption by the CA beads and CA–SCGs beads in the second cycle. The larger decrease is seen in the CA–SCGs beads, but the adsorption percentages in the second and third cycle are similar, especially in the case of the CA–SCGs beads. This fact suggests that the decrease in the adsorption is due to the effect of the nitric acid in the CA–SCGs beads during the first time that the acid is added to the adsorbent, not degradation due a repeated addition of nitric acid.
4. Conclusions
Total removal of cadmium from solution was achieved at concentrations of 10 ppm and 20 ppm with SCGs and 98.07% (s = 0.95%) removal of nickel at 10 ppm. The CA–SCGs beads had a percent removal of 98.81% (s = 1.41%) for Cd2+, and 80.15% (s = 1.94%) for Ni2+ at 10 ppm. The SCGs is a very effective adsorbent of metals below its saturation levels. The CA beads have a larger adsorption capacity than SCGs, but this adsorption is less related to the level of metal concentration. A portion of the metal stays in solution instead of being adsorbed by the CA beads, no matter how low the metal concentration is. In this study, the percentages of adsorption by CA beads never reached average values over 90%. This poses a problem because the toxicity of metals, such as cadmium is possible even at trace levels. The encapsulation of SCGs in CA brings values closer to 100% of metal removal in the concentrations used in this study (10 ppm to 100 ppm). SCGs and CA–SCGs beads achieve percentages of removal closer to 100% due to the affinity of the adsorption sites of these adsorbents toward the metal. This characteristic can be related to the presence of phenolic groups in SCGs. Although the CA beads can have a larger number of adsorption sites, these adsorption sites have less affinity toward the metal, and so a portion of metal remains dissolved, despite the metal concentration. Also, the adsorption by CA beads involves mostly ion exchange between Ca2+ and the metal of interest. This ion-exchange mechanism has a bigger role in the adsorption by CA beads than in the case of adsorption by SCGs because Ca2+ does not have the same importance in the structure of SCGs. This study has showed the benefits of the encapsulation of a waste as SCGs in a renewable matrix, such as CA, to improve the adsorption of metals.
Author Contributions
Conceptualization, R.T.-C.; Investigation, R.T.-C.; Resources, C.A.V.-O. and N.M.-C.
Funding
This research received no external funding.
Acknowledgments
Special thanks to the USDA-ARS Tropical Agriculture Research Station for the use of the instrument of ICP-OES and to the Material Characterization Center of the University of Puerto Rico for the use of the SEM–EDX.
Conflicts of Interest
The authors declare no conflict of interest.
References
- Tchounwou, P.B.; Yedjou, C.G.; Patlolla, A.K.; Sutton, D.J. Heavy metal toxicity and the environment. Exp. Suppl. 2012, 101, 133–164. [Google Scholar] [CrossRef] [PubMed]
- Olabemiwo, F.A.; Tawabini, B.S.; Patel, F.; Oyehan, T.A.; Khaled, M.; Laoui, T. Cadmium Removal from Contaminated Water Using Polyelectrolyte-Coated Industrial Waste Fly Ash. Bioinorg. Chem. Appl. 2017, 2017, 7298351. [Google Scholar] [CrossRef] [PubMed]
- Rafati Rahimzadeh, M.; Rafati Rahimzadeh, M.; Kazemi, S.; Moghadamnia, A.A. Cadmium toxicity and treatment: An update. Casp. J. Intern. Med. 2017, 8, 135–145. [Google Scholar] [CrossRef]
- Doll, R. Report of the International Committee on Nickel Carcinogenesis in Man. Scand. J. Work Environ. Health 1990, 16, 1–82. [Google Scholar] [CrossRef]
- Agency for Toxic Substances and Disease Registry (ATSDR). Toxicological Profile for Nickel (Update); Department of Public Health and Human Services, Public Health Service: Atlanta, GA, USA, 2005.
- Gruszecka-Kosowska, A.; Baran, P.; Wdowin, M.; Franus, W. Waste dolomite powder as an adsorbent of Cd, Pb(II), and Zn from aqueous solutions. Environ. Earth Sci. 2017, 76, 521. [Google Scholar] [CrossRef]
- Płaza, A.; Kołodyńska, D.; Hałas, P.; Gęca, M.; Franus, M.; Hubicki, Z. The zeolite modified by chitosan as an adsorbent for environmental applications. Adsorpt. Sci. Technol. 2017, 35, 834–844. [Google Scholar] [CrossRef]
- Franus, M.; Bandura, L.; Madej, J. Mono and Poly-Cationic Adsorption of Heavy Metals Using Natural Glauconite. Minerals 2019, 9, 470. [Google Scholar] [CrossRef]
- Pyrzynska, K. Removal of cadmium from wastewaters with low-cost adsorbents. J. Environ. Chem. Eng. 2019, 7, 102795. [Google Scholar] [CrossRef]
- Anastopoulos, I.; Karamesouti, M.; Mitropoulos, A.C.; Kyzas, G.Z. A review for coffee adsorbents. J. Mol. Liq. 2017, 229, 555–565. [Google Scholar] [CrossRef]
- De Gisi, S.; Lofrano, G.; Grassi, M.; Notarnicola, M. Characteristics and adsorption capacities of low-cost sorbents for wastewater treatment: A review. Sustain. Mater. Technol. 2016, 9, 10–40. [Google Scholar] [CrossRef]
- Jiménez-Zamora, A.; Pastoriza, S.; Rufián-Henares, J. Ángel Revalorization of coffee by-products. Prebiotic, antimicrobial and antioxidant properties. LWT Food Sci. Technol. 2015, 61, 12–18. [Google Scholar] [CrossRef]
- Vítěz, T.; Koutný, T.; Šotnar, M.; Chovanec, J. On the Spent Coffee Grounds Biogas Production. Acta Univ. Agric. Silvic. Mendel. Brun. 2016, 64, 1279–1282. [Google Scholar] [CrossRef]
- Azouaou, N.; Sadaoui, Z.; Djaafri, A.; Mokaddem, H. Adsorption of cadmium from aqueous solution onto untreated coffee grounds: Equilibrium, kinetics and thermodynamics. J. Hazard. Mater. 2010, 184, 126–134. [Google Scholar] [CrossRef] [PubMed]
- Papageorgiou, S.K.; Katsaros, F.K.; Kouvelos, E.P.; Nolan, J.W.; Le Deit, H.; Kanellopoulos, N.K. Heavy metal sorption by calcium alginate beads from Laminaria digitata. J. Hazard. Mater. 2006, 137, 1765–1772. [Google Scholar] [CrossRef]
- Wang, S.; Vincent, T.; Faur, C.; Guibal, E. Alginate and Algal-Based Beads for the Sorption of Metal Cations: Cu(II) and Pb(II). Int. J. Mol. Sci. 2016, 17, 1453. [Google Scholar] [CrossRef]
- Torres-Caban, R.; Vega-Olivencia, C.A.; Alamo-Nole, L.; Morales-Irizarry, D.; Roman-Velazquez, F.; Mina-Camilde, N. Removal of Copper from Water by Adsorption with Calcium-Alginate/Spent-Coffee-Grounds Composite Beads. Materials 2019, 12, 395. [Google Scholar] [CrossRef]
- Utomo, H.D.; Hunter, K.A. Adsorption of heavy metals by exhausted coffee grounds as a potential treatment method for waste waters. e-J. Surf. Sci. Nanotechnol. 2006, 4, 504–506. [Google Scholar] [CrossRef]
- Dávila-Guzmán, N.E.; de Jesús Cerino-Córdova, F.; Soto-Regalado, E.; Rangel-Mendez, J.R.; Díaz-Flores, P.E.; Garza-Gonzalez, M.T.; Loredo-Medrano, J.A. Copper Biosorption by Spent Coffee Ground: Equilibrium, Kinetics, and Mechanism. Clean Soil Air Water 2013, 41, 557–564. [Google Scholar] [CrossRef]
- Torres, E.; Mata, Y.N.; Blázquez, M.L.; Muñoz, J.A.; González, F.; Ballester, A. Gold and silver uptake and nanoprecipitation on calcium alginate beads. Langmuir 2005, 21, 7951–7958. [Google Scholar] [CrossRef]
- Li, Y.; Xia, B.; Zhao, Q.; Liu, F.; Zhang, P.; Du, Q.; Wang, D.; Li, D.; Wang, Z.; Xia, Y. Removal of copper ions from aqueous solution by calcium alginate immobilized kaolin. J. Environ. Sci. 2011, 23, 404–411. [Google Scholar] [CrossRef]
- Kołodyńska, D.; Krukowska, J.; Thomas, P. Comparison of sorption and desorption studies of heavy metal ions from biochar and commercial active carbon. Chem. Eng. J. 2017, 307, 353–363. [Google Scholar] [CrossRef]
- Jiao, Y.; Han, D.; Lu, Y.; Rong, Y.; Fang, L.; Liu, Y.; Han, R. Characterization of pine-sawdust pyrolytic char activated by phosphoric acid through microwave irradiation and adsorption property toward CDNB in batch mode. Desalin. Water Treat. 2017, 77, 247–255. [Google Scholar] [CrossRef]
- Schmid, T.; Messmer, A.; Yeo, B.S.; Zhang, W.; Zenobi, R. Towards chemical analysis of nanostructures in biofilms II: Tip-enhanced Raman spectroscopy of alginates. Anal. Bioanal. Chem. 2008, 391, 1907–1916. [Google Scholar] [CrossRef] [PubMed]
- Agarwal, U.P. Analysis of Cellulose and Lignocellulose Materials by Raman Spectroscopy: A Review of the Current Status. Molecules 2019, 24, 1659. [Google Scholar] [CrossRef]
- Ballesteros, L.F.; Teixeira, J.A.; Mussatto, S.I. Chemical, Functional, and Structural Properties of Spent Coffee Grounds and Coffee Silverskin. Food Bioprocess Technol. 2014, 7, 3493. [Google Scholar] [CrossRef]
- Pujol, D.; Liu, C.; Gominho, J.; Olivella, M.; Fiol, N.; Villaescusa, I.; Pereira, H. The chemical composition of exhausted coffee waste. Ind. Crop. Prod. 2013, 50, 423–429. [Google Scholar] [CrossRef]
- Guo, X.; Zhang, S.; Shan, X.-Q. Adsorption of metal ions on lignin. J. Hazard. Mater. 2008, 151, 134–142. [Google Scholar] [CrossRef]
- Algothmi, W.M.; Bandaru, N.M.; Yü, Y.; Shapter, J.G.; Ellis, A.V. Alginate–graphene oxide hybrid gel beads: An efficient copper adsorbent material. J. Colloid Interface Sci. 2013, 397, 32–38. [Google Scholar] [CrossRef]
- Baillot, R.; Deshayes, Y. Reliability Investigation of LED Devices for Public Light Applications; Elsevier: London, UK, 2017; pp. 43–106. [Google Scholar] [CrossRef]
- Foo, K.Y.; Hameed, B. Insights into the modeling of adsorption isotherm systems. Chem. Eng. J. 2010, 156, 2–10. [Google Scholar] [CrossRef]
- Hamdaoui, O.; Naffrechoux, E. Modeling of adsorption isotherms of phenol and chlorophenols onto granular activated carbonPart II. Models with more than two parameters. J. Hazard. Mater. 2007, 147, 401–411. [Google Scholar] [CrossRef]
- Günay, A.; Arslankaya, E.; Tosun, İ. Lead removal from aqueous solution by natural and pretreated clinoptilolite: Adsorption equilibrium and kinetics. J. Hazard. Mater. 2007, 146, 362–371. [Google Scholar] [CrossRef] [PubMed]
- Bolster, C.H.; Hornberger, G.M. On the Use of Linearized Langmuir Equations. Soil Sci. Soc. Am. J. 2008, 72, 1848. [Google Scholar] [CrossRef]
- Patterer, M.S.; Bavasso, I.; Sambeth, J.; Medici, F. Cadmium Removal from Acqueous Solution by Adsorption on Spent Coffee Grounds. Chem. Eng. Trans. 2017, 60, 157–162. [Google Scholar] [CrossRef]
- Al-Rub, F.; El-Naas, M.; Benyahia, F.; Ashour, I. Biosorption of nickel on blank alginate beads, free and immobilized algal cells. Process Biochem. 2004, 39, 1767–1773. [Google Scholar] [CrossRef]
- Attar, K.; Demey, H.; Bouazza, D.; Sastre, A.M. Sorption and Desorption Studies of Pb(II) and Ni(II) from Aqueous Solutions by a New Composite Based on Alginate and Magadiite Materials. Polymer 2019, 11, 340. [Google Scholar] [CrossRef]
- Nastaj, J.; Przewłocka, A.; Rajkowska-Myśliwiec, M. Biosorption of Ni(II), Pb(II) and Zn(II) on calcium alginate beads: Equilibrium, kinetic and mechanism studies. Pol. J. Chem. Technol. 2016, 18, 81–87. [Google Scholar] [CrossRef]
- Alfaro-Cuevas-Villanueva, R.; Hidalgo-Vázquez, A.R.; Cortés Penagos Cde, J.; Cortés-Martínez, R. Thermodynamic, kinetic, and equilibrium parameters for the removal of lead and cadmium from aqueous solutions with calcium alginate beads. Sci. World J. 2014, 2014, 647512. [Google Scholar] [CrossRef]
- Mahmood, Z.; Amin, A.; Zafar, U. Adsorption studies of cadmium ions on alginate–calcium carbonate composite beads. Appl. Water Sci. 2017, 7, 915. [Google Scholar] [CrossRef]
- Kwiatkowska-Marks, S.; Wojcik, M. Removal of Cadmium(II) from Aqueous Solutions by Calcium Alginate Beads. Sep. Sci. Technol. 2014, 49, 2204–2211. [Google Scholar] [CrossRef]
- Petrovič, A.; Simonič, M. Removal of heavy metal ions from drinking water by alginate-immobilised Chlorella sorokiniana. Int. J. Environ. Sci. Technol. 2016, 13, 1761–1780. [Google Scholar] [CrossRef]
- Bayramoğlu, G.; Tüzün, I.; Celik, G.; Yilmaz, M.; Arica, M.Y.; Arıca, M.Y. Biosorption of mercury(II), cadmium(II) and lead(II) ions from aqueous system by microalgae Chlamydomonas reinhardtii immobilized in alginate beads. Int. J. Miner. Process. 2006, 81, 35–43. [Google Scholar] [CrossRef]
- Ho, Y.; McKay, G. Pseudo-second order model for sorption processes. Process Biochem. 1999, 34, 451–465. [Google Scholar] [CrossRef]
- Hefne, J.A.; Mekhemer, W.K.; Alandis, N.M.; Aldayel, O.A.; Alajyan, T. Removal of silver (I) from Aqueous solutions by natural bentonite. JKAU Sci. 2010, 22, 155–176. [Google Scholar] [CrossRef]
- Jodra, Y.; Mijangos, F. Ion exchange selectivities of calcium alginate gels for heavy metals. Water Sci. Technol. 2001, 43, 237–244. [Google Scholar] [CrossRef]
- Davila-Guzman, N.E.; Cerino-Córdova, F.J.; Loredo-Cancino, M.; Rangel-Mendez, J.R.; Gómez-González, R.; Soto-Regalado, E. Studies of Adsorption of Heavy Metals onto Spent Coffee Ground: Equilibrium, Regeneration, and Dynamic Performance in a Fixed-Bed Column. Int. J. Chem. Eng. 2016, 2016, 9413879. [Google Scholar] [CrossRef]
© 2019 by the authors. Licensee MDPI, Basel, Switzerland. This article is an open access article distributed under the terms and conditions of the Creative Commons Attribution (CC BY) license (http://creativecommons.org/licenses/by/4.0/).

