1. Introduction
The assessment of the degree of soil pollution with heavy metals is still a serious challenge for scientific departments dealing with this problem. The recognition of areas potentially contaminated with heavy metals is legally sanctioned in many countries. An exemplary document that is in force in the European Union is Directive No. 2010/75/EU [
1] and the resulting Regulation (Dz.U. 2016 poz. 1395 (2016) in Polish law) [
2]. A typical procedure for determining the degree of contamination of soil is based on sampling in accordance with the designated grid, an analysis of the contamination levels in the laboratory, and the interpretation of test results based on geostatistical methods. Commonly used methods for determining heavy metal content, such as inductively coupled plasma optical emission spectrometry [
3], are time-consuming and expensive. In the case of the need to recognize the scale of pollution of a large area, the cost and time needed to perform the necessary research increases significantly. In connection with the above, potential use of infrared spectroscopy as a new, less time-consuming, and less expensive method for determining the physicochemical parameters of soils has been studied for several years.
Infrared spectroscopy is a useful tool for investigating soil parameters such as total carbon, total nitrogen, the C/N ratio, lignin, dissolved OC, carbonyl-C, aromatic-C, O-alkyl-C, and alkyl-C contents. A review of the applications of Fourier-transform infrared (FT-IR) spectroscopy for the analysis of soil samples was presented by Tinti et al. [
4]. Nocita et al. [
5] presented the state of the art in the field of the application of infrared spectroscopy in soil analyses as an alternative to traditional so-called “wet” methods. The authors considered both the advantages and limits of this technique. Shepherd and Walsh [
6] presented a review of the application of infrared spectroscopy to agricultural and environmental management.
Previous studies have shown various possible applications of infrared spectroscopy for soil analysis. Viscarra Rossel et al. [
7] examined different soil properties, including pH, organic carbon, slay, silt, sand, cation exchange capacity, exchangeable calcium, exchangeable aluminum, nitrate nitrogen, available phosphorus, exchangeable potassium, and electrical conductivity. The authors compared PLS calibration models based on spectra obtained using the technique of diffuse reflectance (DRIFT) both separately and jointly in different infrared regions. Ng et al. [
8] evaluated the use of field portable and laboratory benchtop infrared spectrometers in the range of near infrared (NIR) and mid infrared (MIR) for the rapid nondestructive assessment of petroleum-contaminated soils. FT-IR has also been used for the analysis of the heavy metal concentration in soils. Chodak et al. [
9] studied the ability of near-infrared spectroscopy to detect the effects of heavy metals on the chemical composition of forest soil. The authors underlined that some concentrations (especially high concentrations) of heavy metals obtained using NIR spectroscopy were lower than in reality due to the fact that heavy metals in industrial samples are partially present in the inorganic form. Similar results were obtained by Siebielec et al. [
10] for soil metal content in highly contaminated soil samples obtained from industrial regions. The authors concluded that using mid-infrared lead to more accurate models compared to NIR. Gholizadeh et al. [
11] assessed the usefulness of the VIS-NIR method in the monitoring of toxic elements in soil samples from reclaimed dumpsites. Chen et al. [
12] applied visible and near infrared for fast analysis of cadmium pollution of soils. Niazi et al. [
13] used the DRIFT mode in the MIR range combined with PLS to estimate the contamination of soil with arsenic. Chakraborty et al. [
14] used Mid-IR and the DRIFT mode in combination with artificial neural network (ANN) models to assess lead concentration in soil samples collected from an urban landfill agricultural site.
Infrared spectroscopy has shown great potential for use in the analysis of different soil properties and contamination levels, but the problem of a choice of the optimal measurement methodology remains unresolved. The choice of the infrared range is important problem in the area of spectral soil analyses. Equally important question refers to the important issue of representativeness of samples for spectral analyses and comparison of the measurements in the laboratory after sample preparation or directly in the field (in-situ). Other issues relate to the choice of spectral techniques, the impact of the variation of the material studied on the results, or the choice of chemometric techniques to create a prediction model.
It was indicated that spectral analysis in the mid infrared region enables one to obtain more accurate models than in the near infrared region [
15]; however, visible and near infrared radiation (VIS-NIR) has been usually considered for application in on-line measurements. Jiminez-Donaire et al. [
16] presented an application of a diffuse reflectance mode and PLS calibration model in the on-line measurement of moisture content, soil organic carbon, pH, and total nitrogen. The specially designed on-line measurement system was mounted onto a tractor, with spectral data collected while moving across the landscape with a velocity of 2 km/h. He et al. [
17] used near-infrared reflectance spectroscopy for the estimation of nitrogen and organic matter content in soil samples. The authors indicated that this is a useful rapid technique for in situ application, which can be combined with GIS. Additionally, Martin et al. [
18] used near-infrared spectroscopy for a rapid analysis of organic carbon and nitrogen within a single field. This method was useful for analyzing carbon content in a range of 0–40 mg/g, however, the authors reported that they did not succeed in determining the nitrogen concentration. On the other hand, recent technological development of semiconductor technologies contributes in the development of mid-infrared (mid-IR) portable spectrometers.
Reeves J.B. [
19] compared the application of near and mid infrared in soil analyses and their related advantages and disadvantages. They also considered several questions concerning laboratory and on-site analysis, the effect of moisture and particle size on accuracy, and the effect of different soil types and compositions on calibration. He stated that DRIFT is not useful in on-site application but is advantageous in the laboratory after sample drying and grounding. D’Acqui et al. [
20] described an exemplary procedure of sampling for application of mid-infrared diffuse reflectance Fourier transform (MIR-DRIFT) spectroscopy, with partial least squares (PLS) regression, for the determination of variations in soil properties. After removal of the debris from the surface (twigs, litter, and rocks), the samples were taken from the surface to a depth of 20 cm, then for analysis were dried at 40 °C, and ground by a mill and sieved to <100 µm particle diameter. The authors collected 198 samples, and to obtain each representative sample, three subsamples were collected and mixed. Application of different techniques of mid infrared spectroscopy: diffuse reflectance spectroscopy, attenuated total reflectance spectroscopy, and Fourier transform infrared photoacoustic spectroscopy (PAS) for investigation of soil properties was analyzed and compared by Ma et al. [
21].
Raw spectra are often processed before use as an input into a chemometric model development using various techniques, such as absorbance transformation log (1/R), mean centering, detrend, standard normal variate (SNV), Savitzky-Golay smoothing, first or second derivatives, and multiplicative scatter correction (MSC) [
7,
11]. A review of the spectral preprocessing methods is presented by Tinti et al. [
4] and Chen et al. [
12]. The methods that are frequently combined with infrared spectroscopy are partial least square regression (PLS), principal component analysis (PCA), and artificial neural networks (ANN).
A literature review showed that extensive research was performed in the field of spectral rapid assessment of soil properties, especially with emphasis on properties that are important for agriculture–organic matter content, nitrogen content, pH etc. A much narrower group of papers considered heavy metal concentration in soil. Measurements were conducted on NIR, Vis-NIR, and less often on MIR. The far-IR region was not investigated in term of its usefulness for soil metal analysis. Frequencies of oscillations of heavy metal bonds are lower because of the mass. The crystal structure of inorganic compounds can be affected in the presence of heavier cations. Thus, analyzing the possibility of use of the FIR region for metal concentration analysis is justified.
The aim of this paper was construction of the PLS models for simultaneous analysis of various heavy metal concentrations in soil samples based on FT-IR spectra. Two spectral techniques, namely ATR and DRIFT, as well as the whole infrared region, were investigated during the study. Accuracy and prediction abilities of models were compared for as many as 13 harmful metals. Samples were taken from the polluted area, thus the range of concentrations of metals is very large. Moreover in this paper, the region of far-IR spectroscopy was considered as the method to improve the detection of heavy metals in soil. According to the knowledge of the authors, this region had not been investigated before in terms of soil metal concentration prediction.
3. Results
3.1. Qualitative Description of FT-IR Spectra
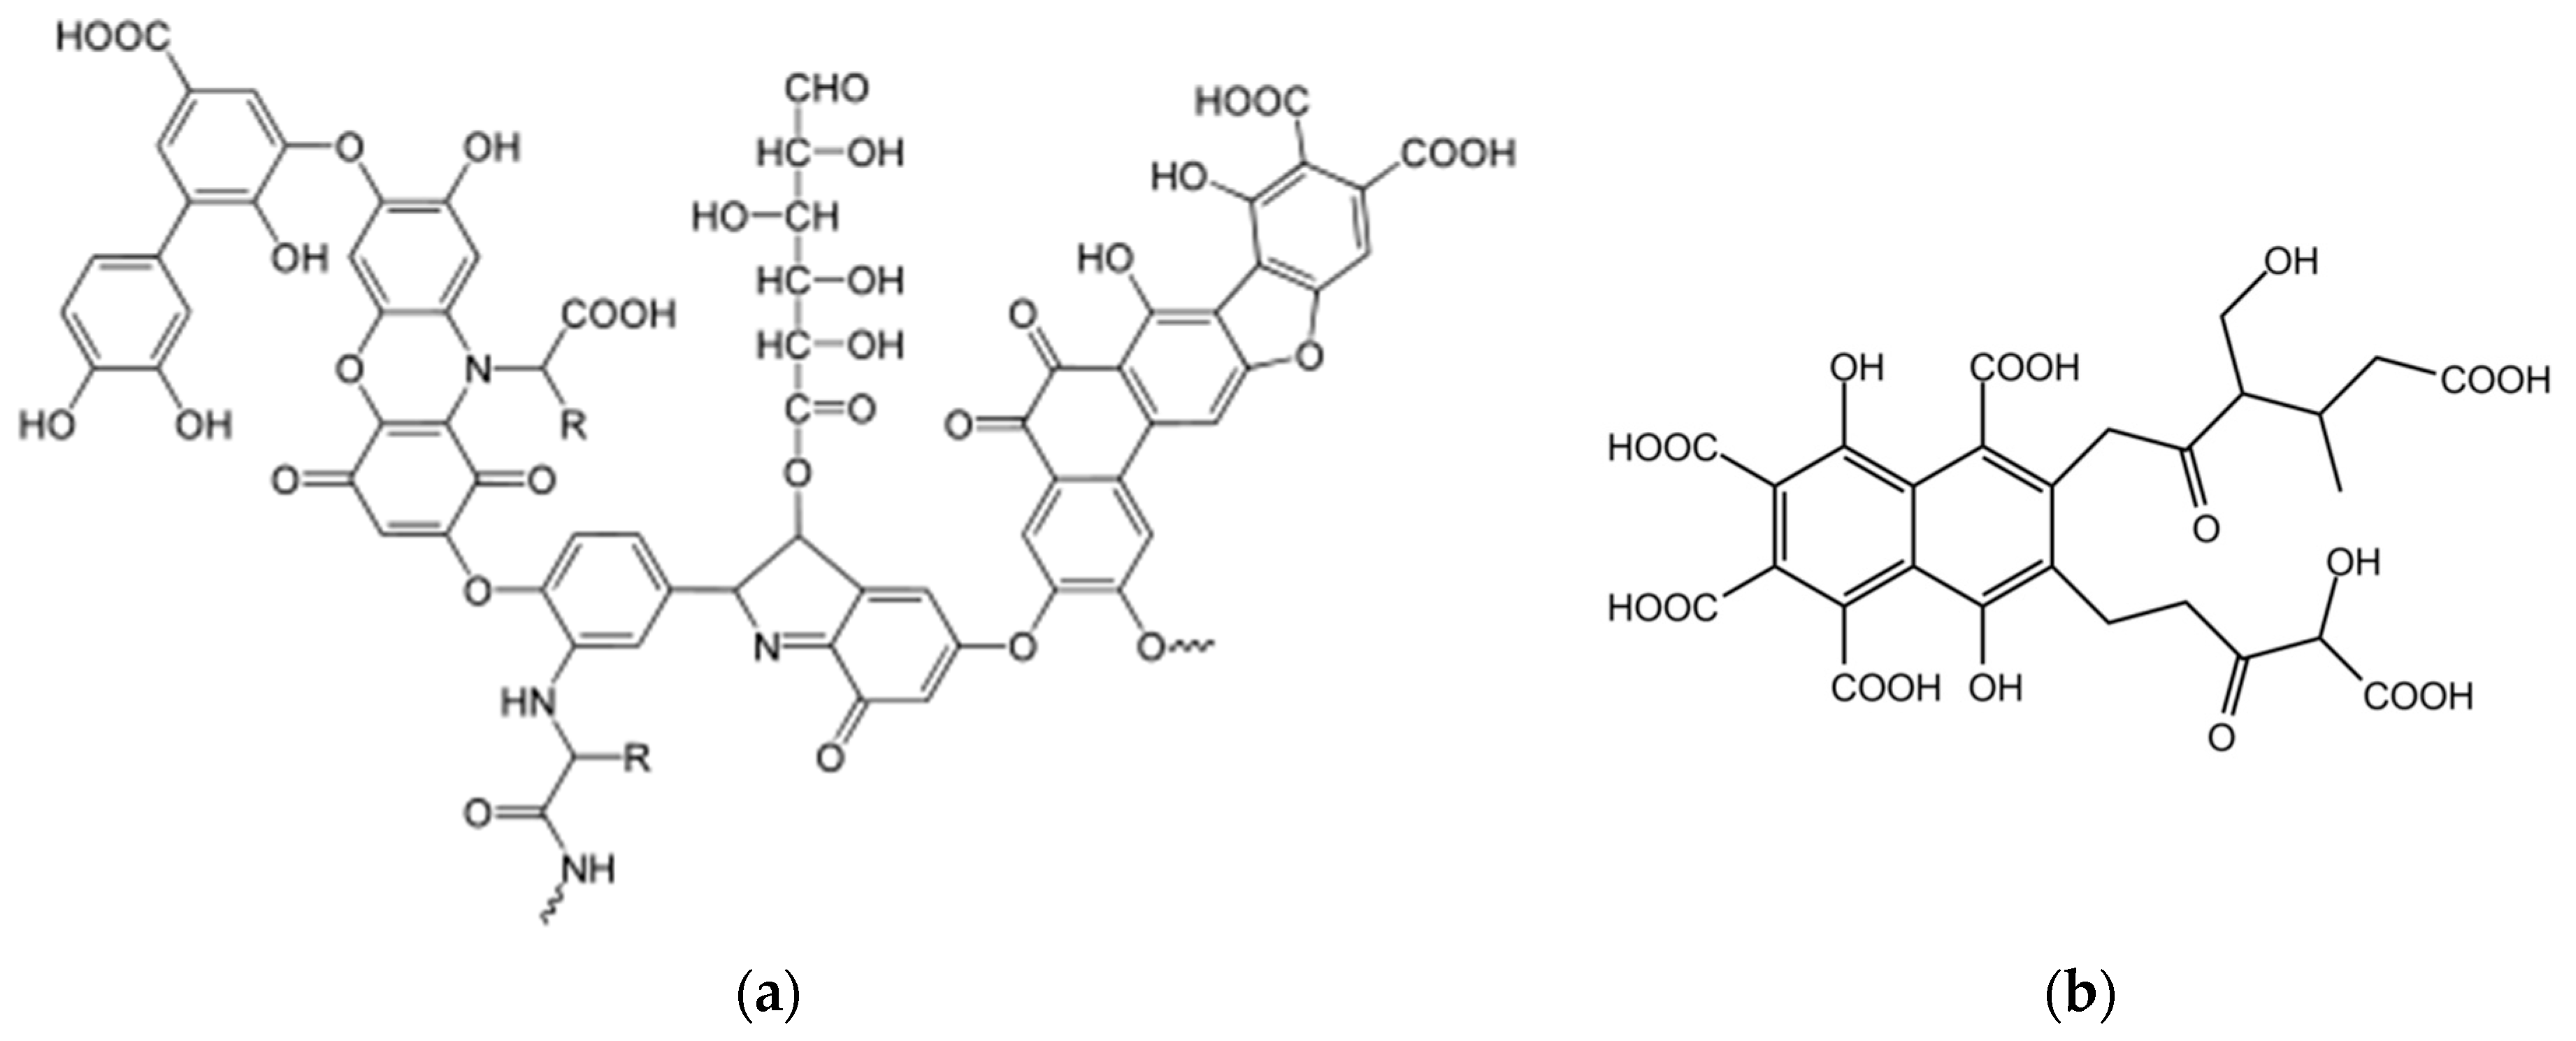
Soil is very complex, it contains both inorganic components, such as silicates, carbonates, sulfates, nitrates, as well as phosphates, and organic compounds such as humic and fulvic acids. In
Figure 2, an exemplary structure for the organic matter of soil is presented.
Bands related to various functional groups, such as phenolic, carbonyl, carboxylic, anhydrides, and nitrogen-containing groups, are expected in the infrared spectrum of a soil sample.
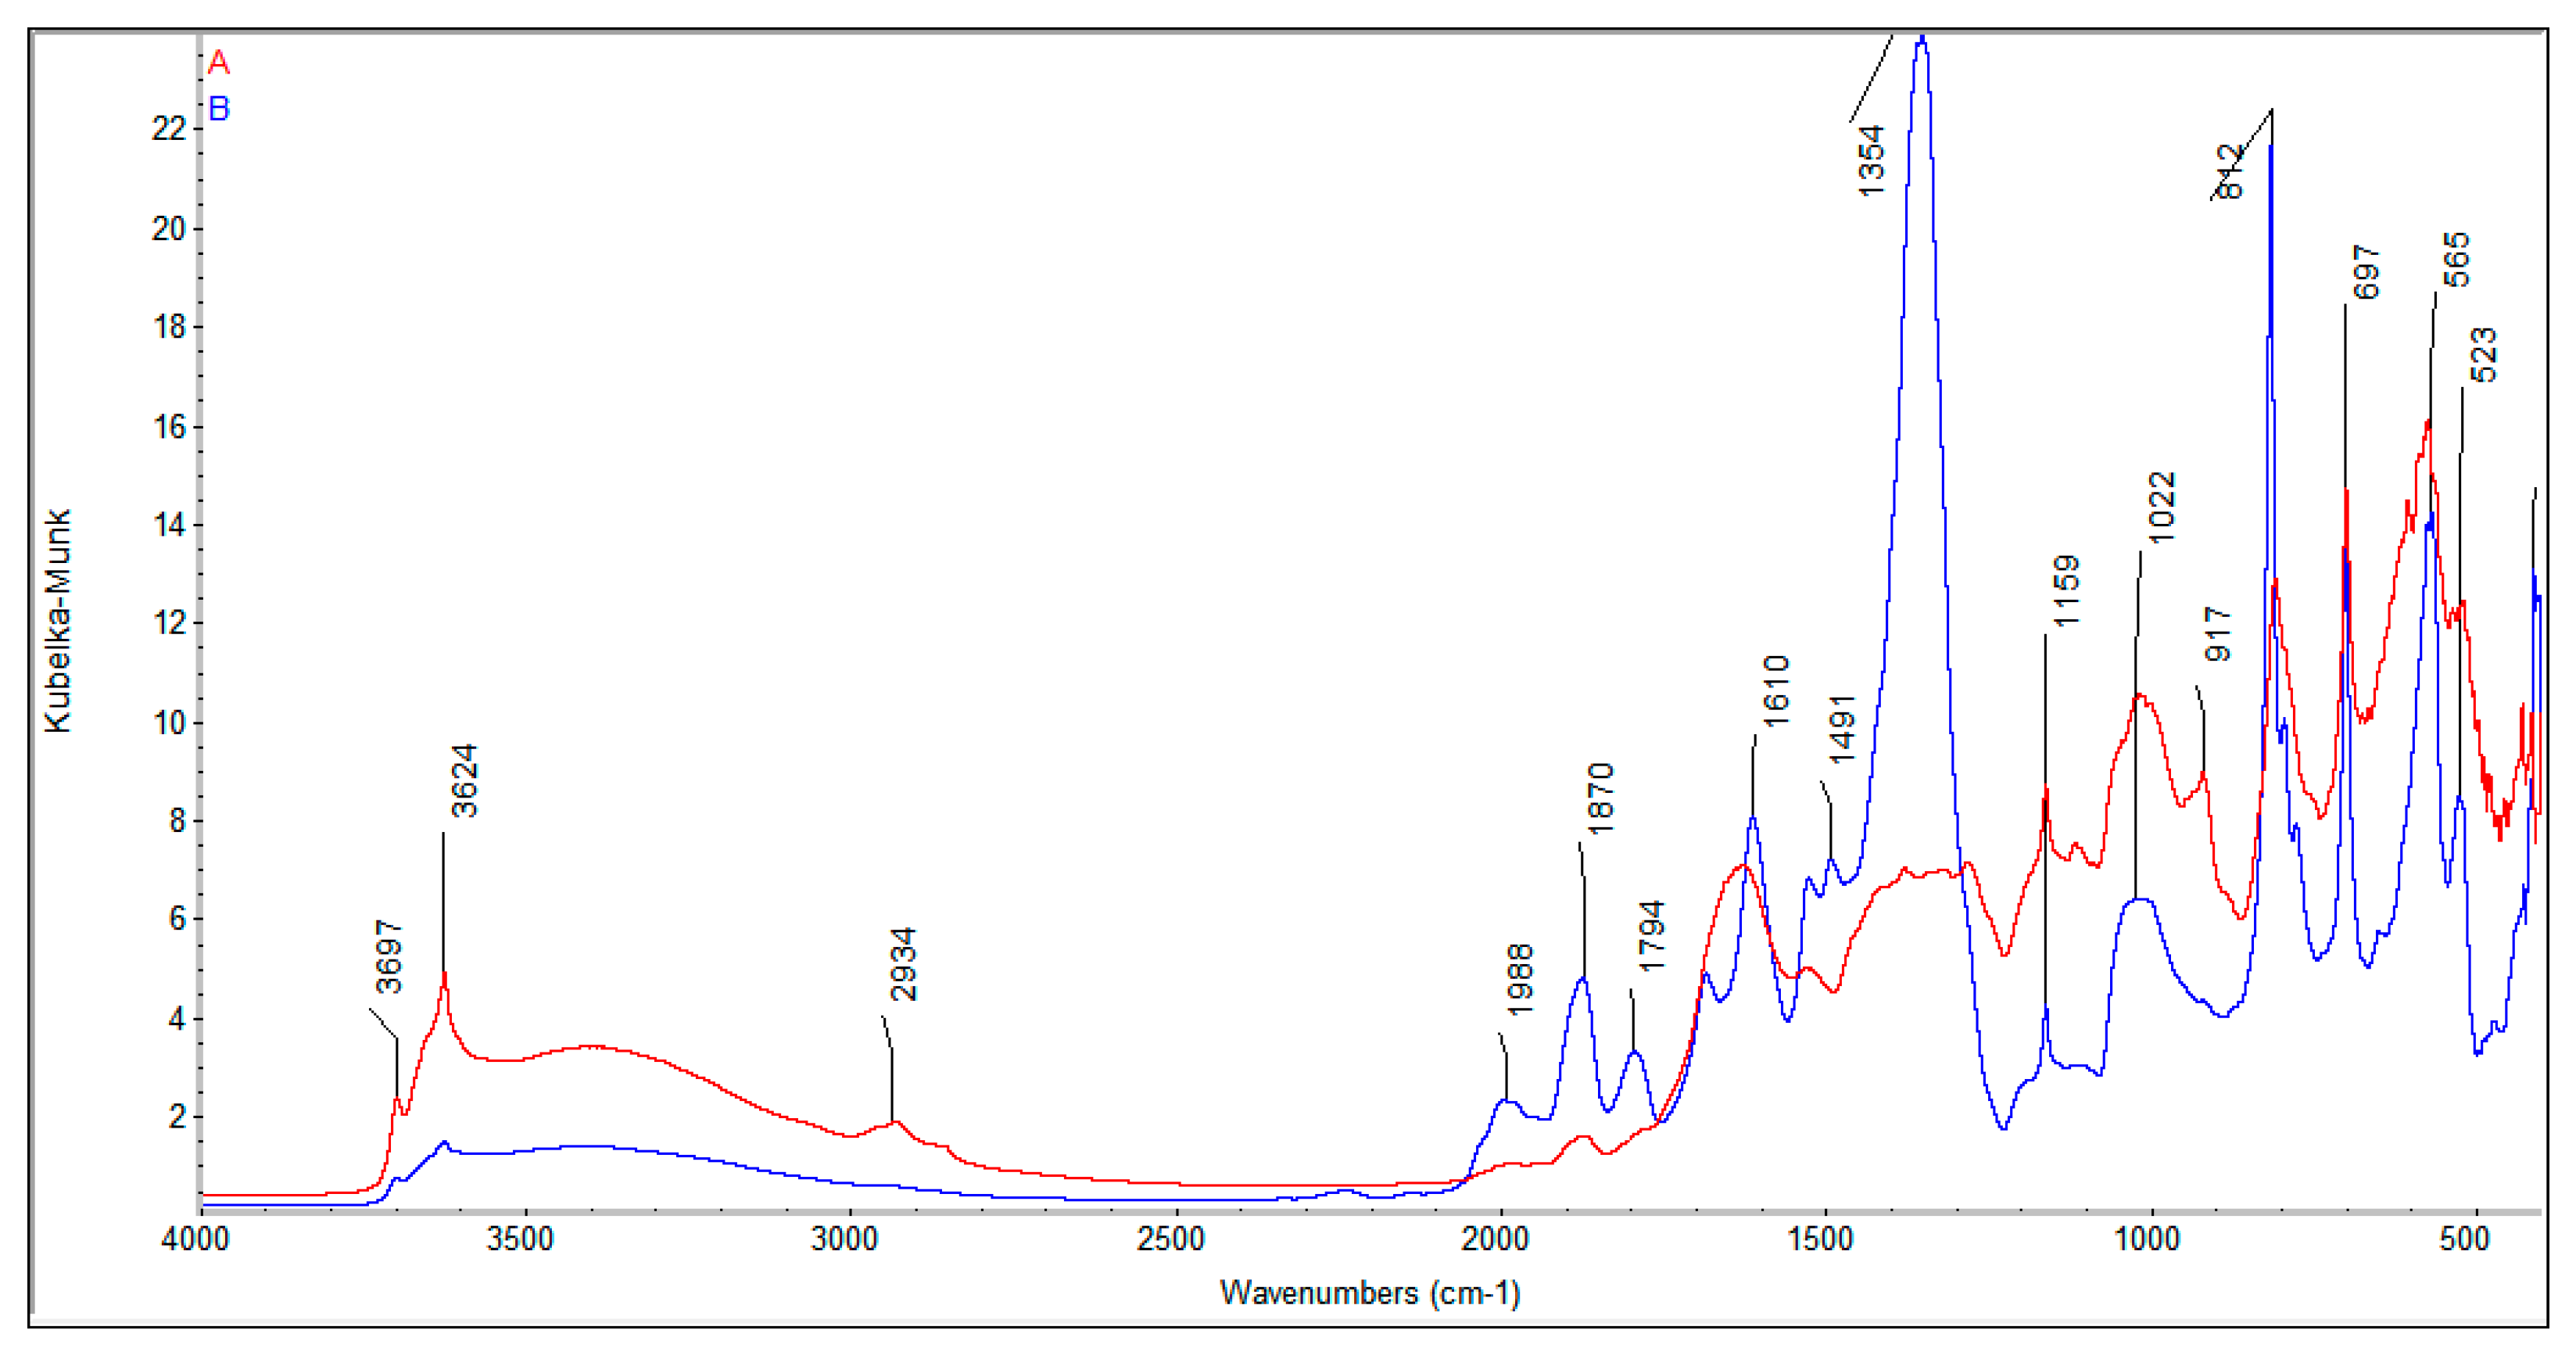
Spectra measured in the mid-infrared region represent fundamental vibration modes and enable one to identify different bonds and functional groups present in the sample. Spectra for all soils were found to be generally similar with differences resulting from the content of clay, quartz, organic compounds, and both fulvic and humic acids in the soils. Two exemplary Mid-IR spectra are presented in
Figure 3.
Bands due to the organic and inorganic compounds overlap; thus, their assignment to functional groups is difficult. However, some of them can be assigned to individual bonds and functional groups during a qualitative analysis of the spectra [
4,
30,
31]. A broad band observed in the region from 3700 to 3000 cm
−1 is related to the stretching of the associated H-bonded hydroxyl group in the OH group of alcohols and the Si-OH group. The peaks at 3697 and 3624 cm
−1 are associated with vibrations of the Si-O-H bond. The peaks at approximately 2934 cm
−1 are attributed to vibrations of aliphatic CH
2 and the CH
3 group. Vibrations of amides and aromatic C=C bonds are observed in the region of 1700 to ~1500 cm
−1. The peak observed at 1988 cm
−1 is connected to vibrations of cumulative C=C bonds or aromatic C-H. The peaks at approximately 1870 and 1794 cm
−1 can relate to anhydrides or the free COOH group. The peak with a maximum at 1610 cm
−1 is related to vibrations of aromatic C or conjugation of C=C with the C=O bond. The peak at 1159 cm
−1 can be ascribed to the stretching vibrations of the C-O bond in anhydrides, or Si-O-C and Si-O-Si in siloxanes. The peaks at approximately 1390 cm
−1 and 917 cm
−1 represent in plane and out of plane bending of the OH group. In the region 1400 to 950 cm
−1, vibrations due to various bonds containing oxygen are observed, especially alcohols, phenols, ethers, acetates, and carbohydrates. Bands assigned to the vibration of silicates SiO
42− are expected in the range 1100–900 cm
−1, carbonates CO
32− approximately 1450–1410 and 880–800 cm
−1, sulphates SO
42− in the range 1130–1080 cm
−1, nitrates NO
3− in the range 1410–1340 and 860–800 cm
−1, and phosphates PO
43− in the range 1100–900 cm
−1 [
30].
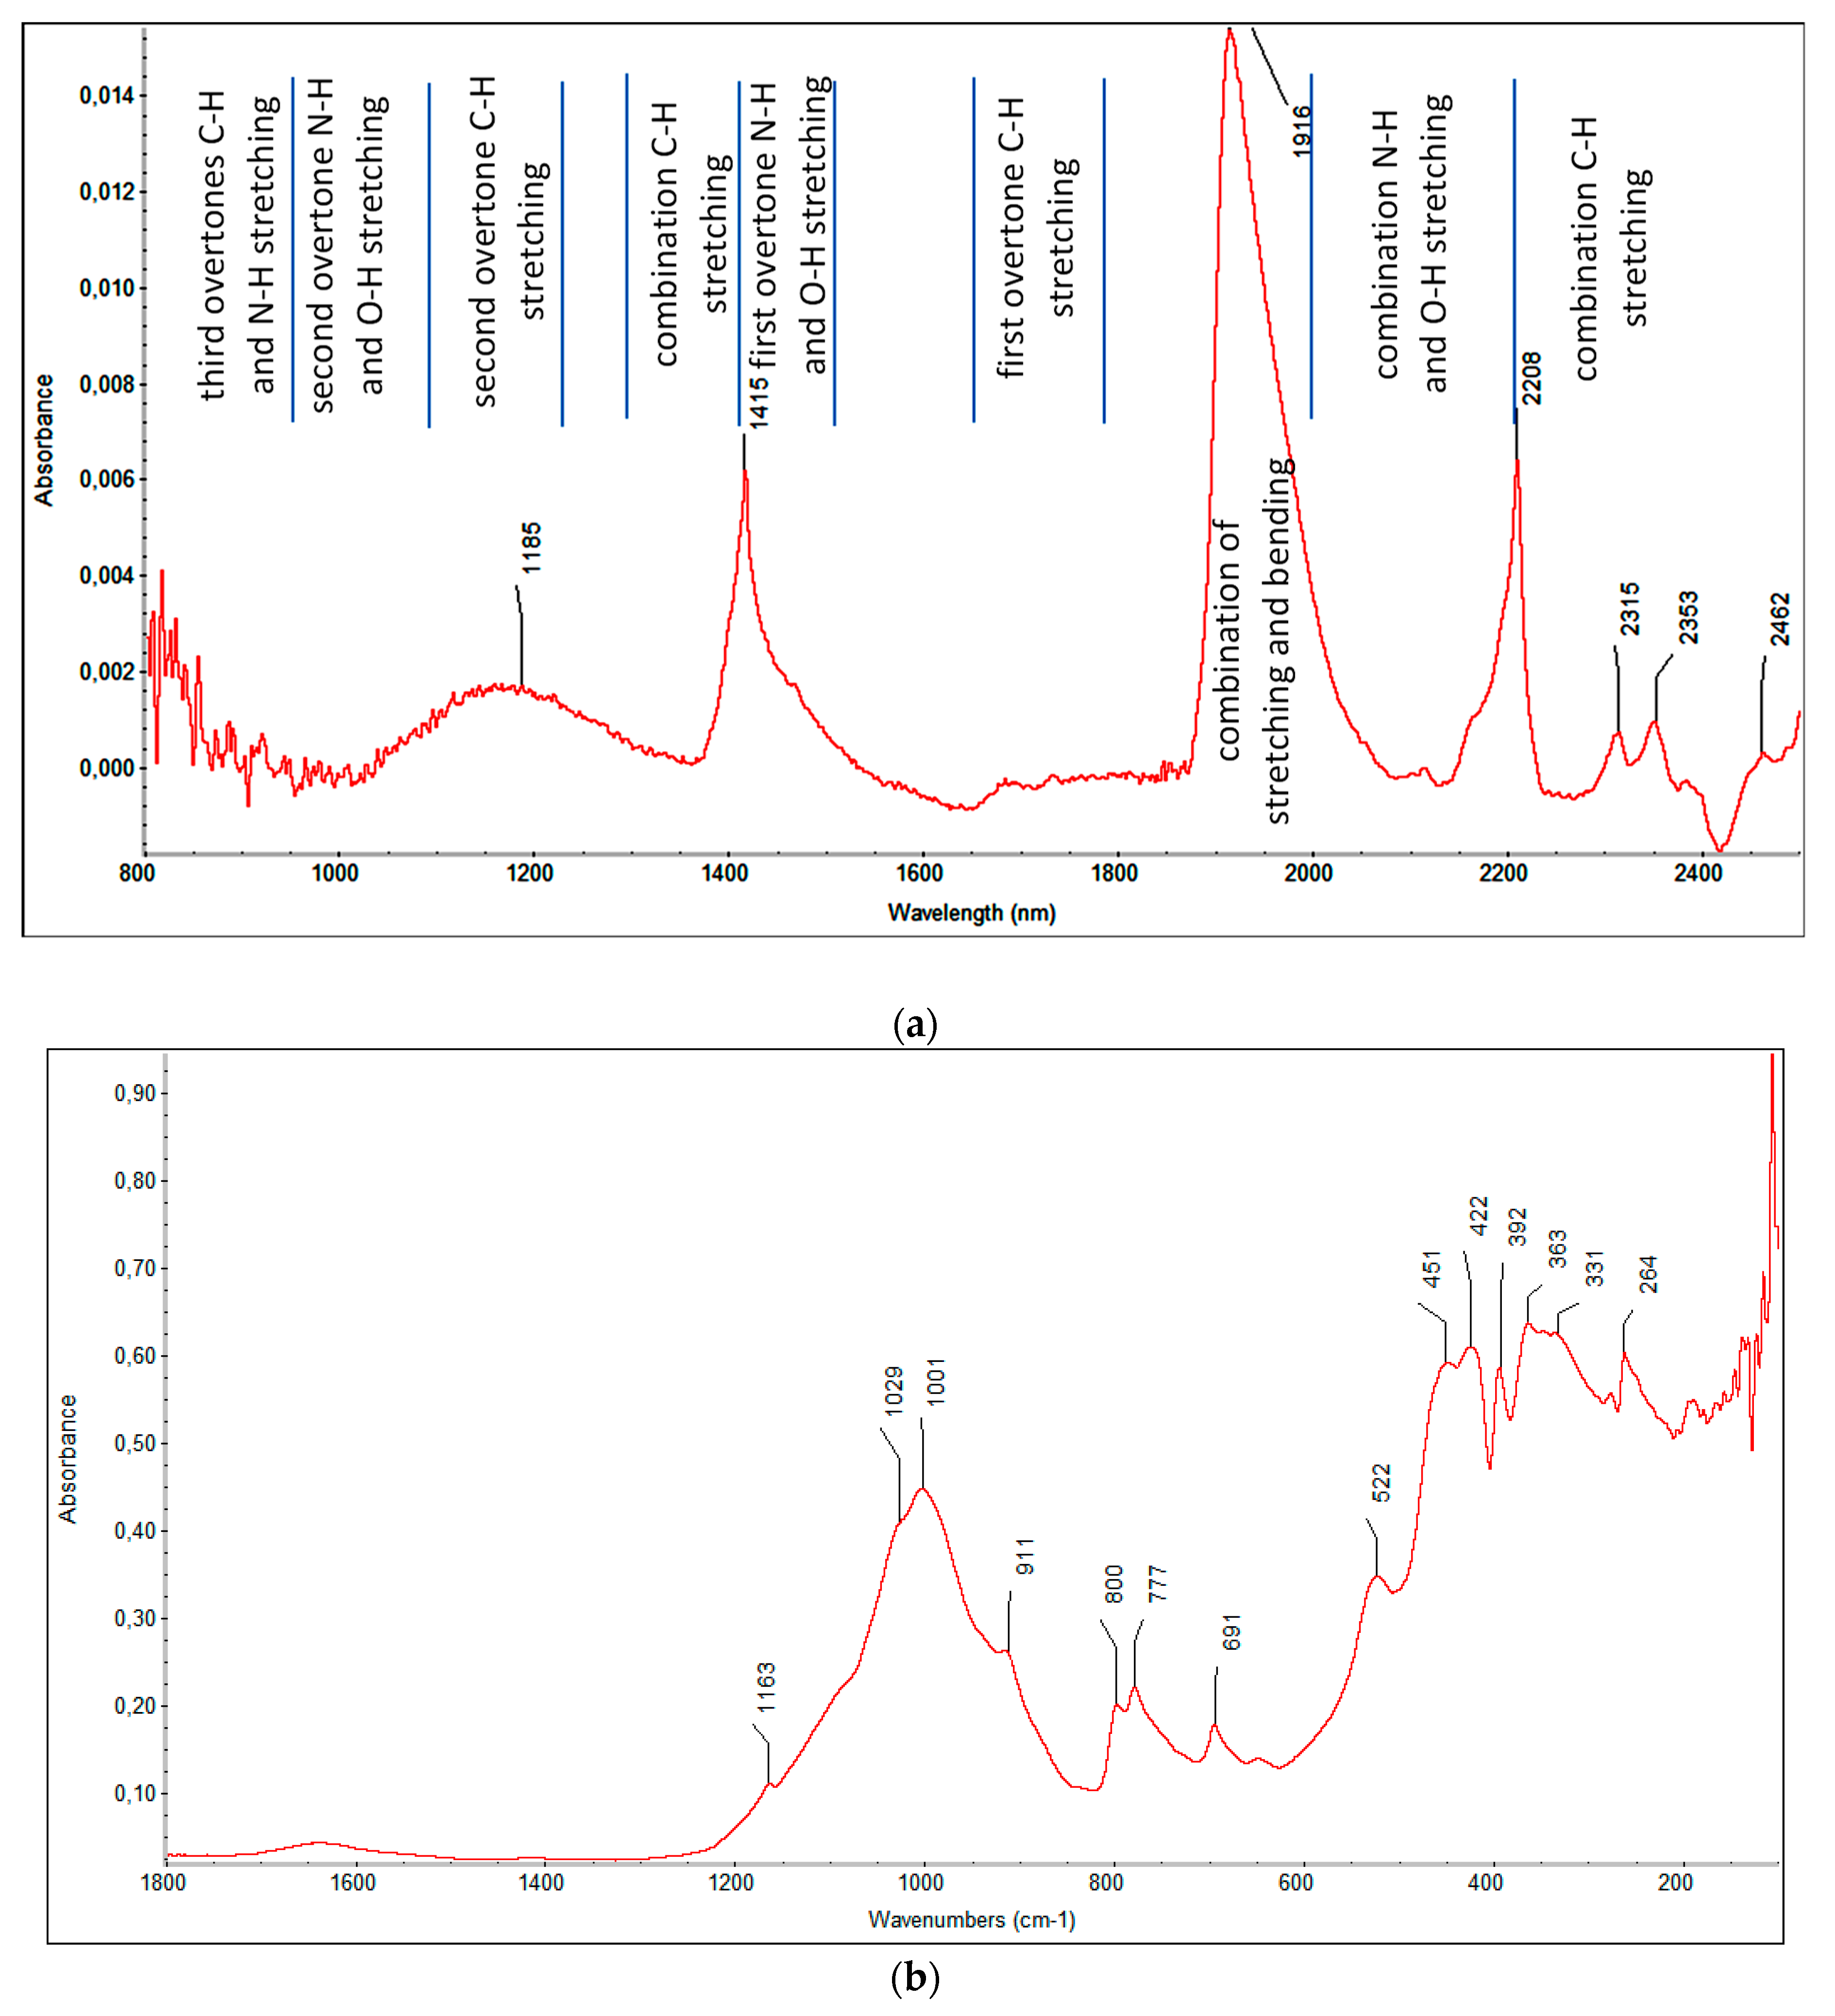
NIR and FIR spectra contain less information concerning the structure and functional groups. Bands observed in the near IR are mainly assigned to overtones and combinations of fundamental vibrational modes of groups containing C-H, O-H and N-H bonds. In the far infrared region, vibrations with large amplitude, such as torsional modes, ring puckering, crystal lattice vibrations and heavy atom skeletal bending modes, and molecular rotation are mainly observed. Information for the intermolecular forces is gained from the far IR spectra. Exemplary NIR and FIR spectra are presented in
Figure 4. In
Figure 4a, ranges characteristic for overtone bands characteristic of excited vibrational states and combined bands that are the sum of other fundamental vibrations are marked.
The detailed interpretation of each band is impossible in such a complex sample. Moreover, the presence of metals in a soil usually does not result in the appearance of new peaks in the spectrum. Thus, the direct calibration and quantitative analysis of the metal concentration on the basis of the IR spectra is impossible. However, metals impact the IR spectra of soils and observed spectral changes can be used to measure metal concentration with the support of chemometric methods. The presence of complexes of functional groups, especially complexes containing oxygen with metal ions, causes frequency shifting and changes in the intensity and shape of bands, which can be used in the analysis of the metal concentration in soil samples. Metal bonding in organometallic compounds weakens the bonds and results in a lowering of the wavenumber value compared to the free groups. The crystal structure of the inorganic compounds can be affected in the presence of heavier cations, causing changes in the far IR. The PLS method enables one to investigate the relationship between the metal concentration in soil samples and the measured FT-IR spectra.
3.2. PLS Models for NIR, MIR, and FIR
For effective investigation of the impact of the metal concentration in soil samples on the infrared spectra collected in the near, mid, and far infrared regions, PLS models were constructed. The PLS models described the relationship between 13 metals in soil (dependent variable
y), respectively, with spectral data organized in the matrix
X containing the value of the spectral signal measured for different wavenumbers. The PLS models constructed for studying the metal concentration based on separate spectroscopic measurements in the NIR, MIR, and FIR regions are presented in
Figure 5,
Figure 6 and
Figure 7. The calculated RMS and RMSCV for the constructed PLS models are presented in
Table 1,
Table 2 and
Table 3.
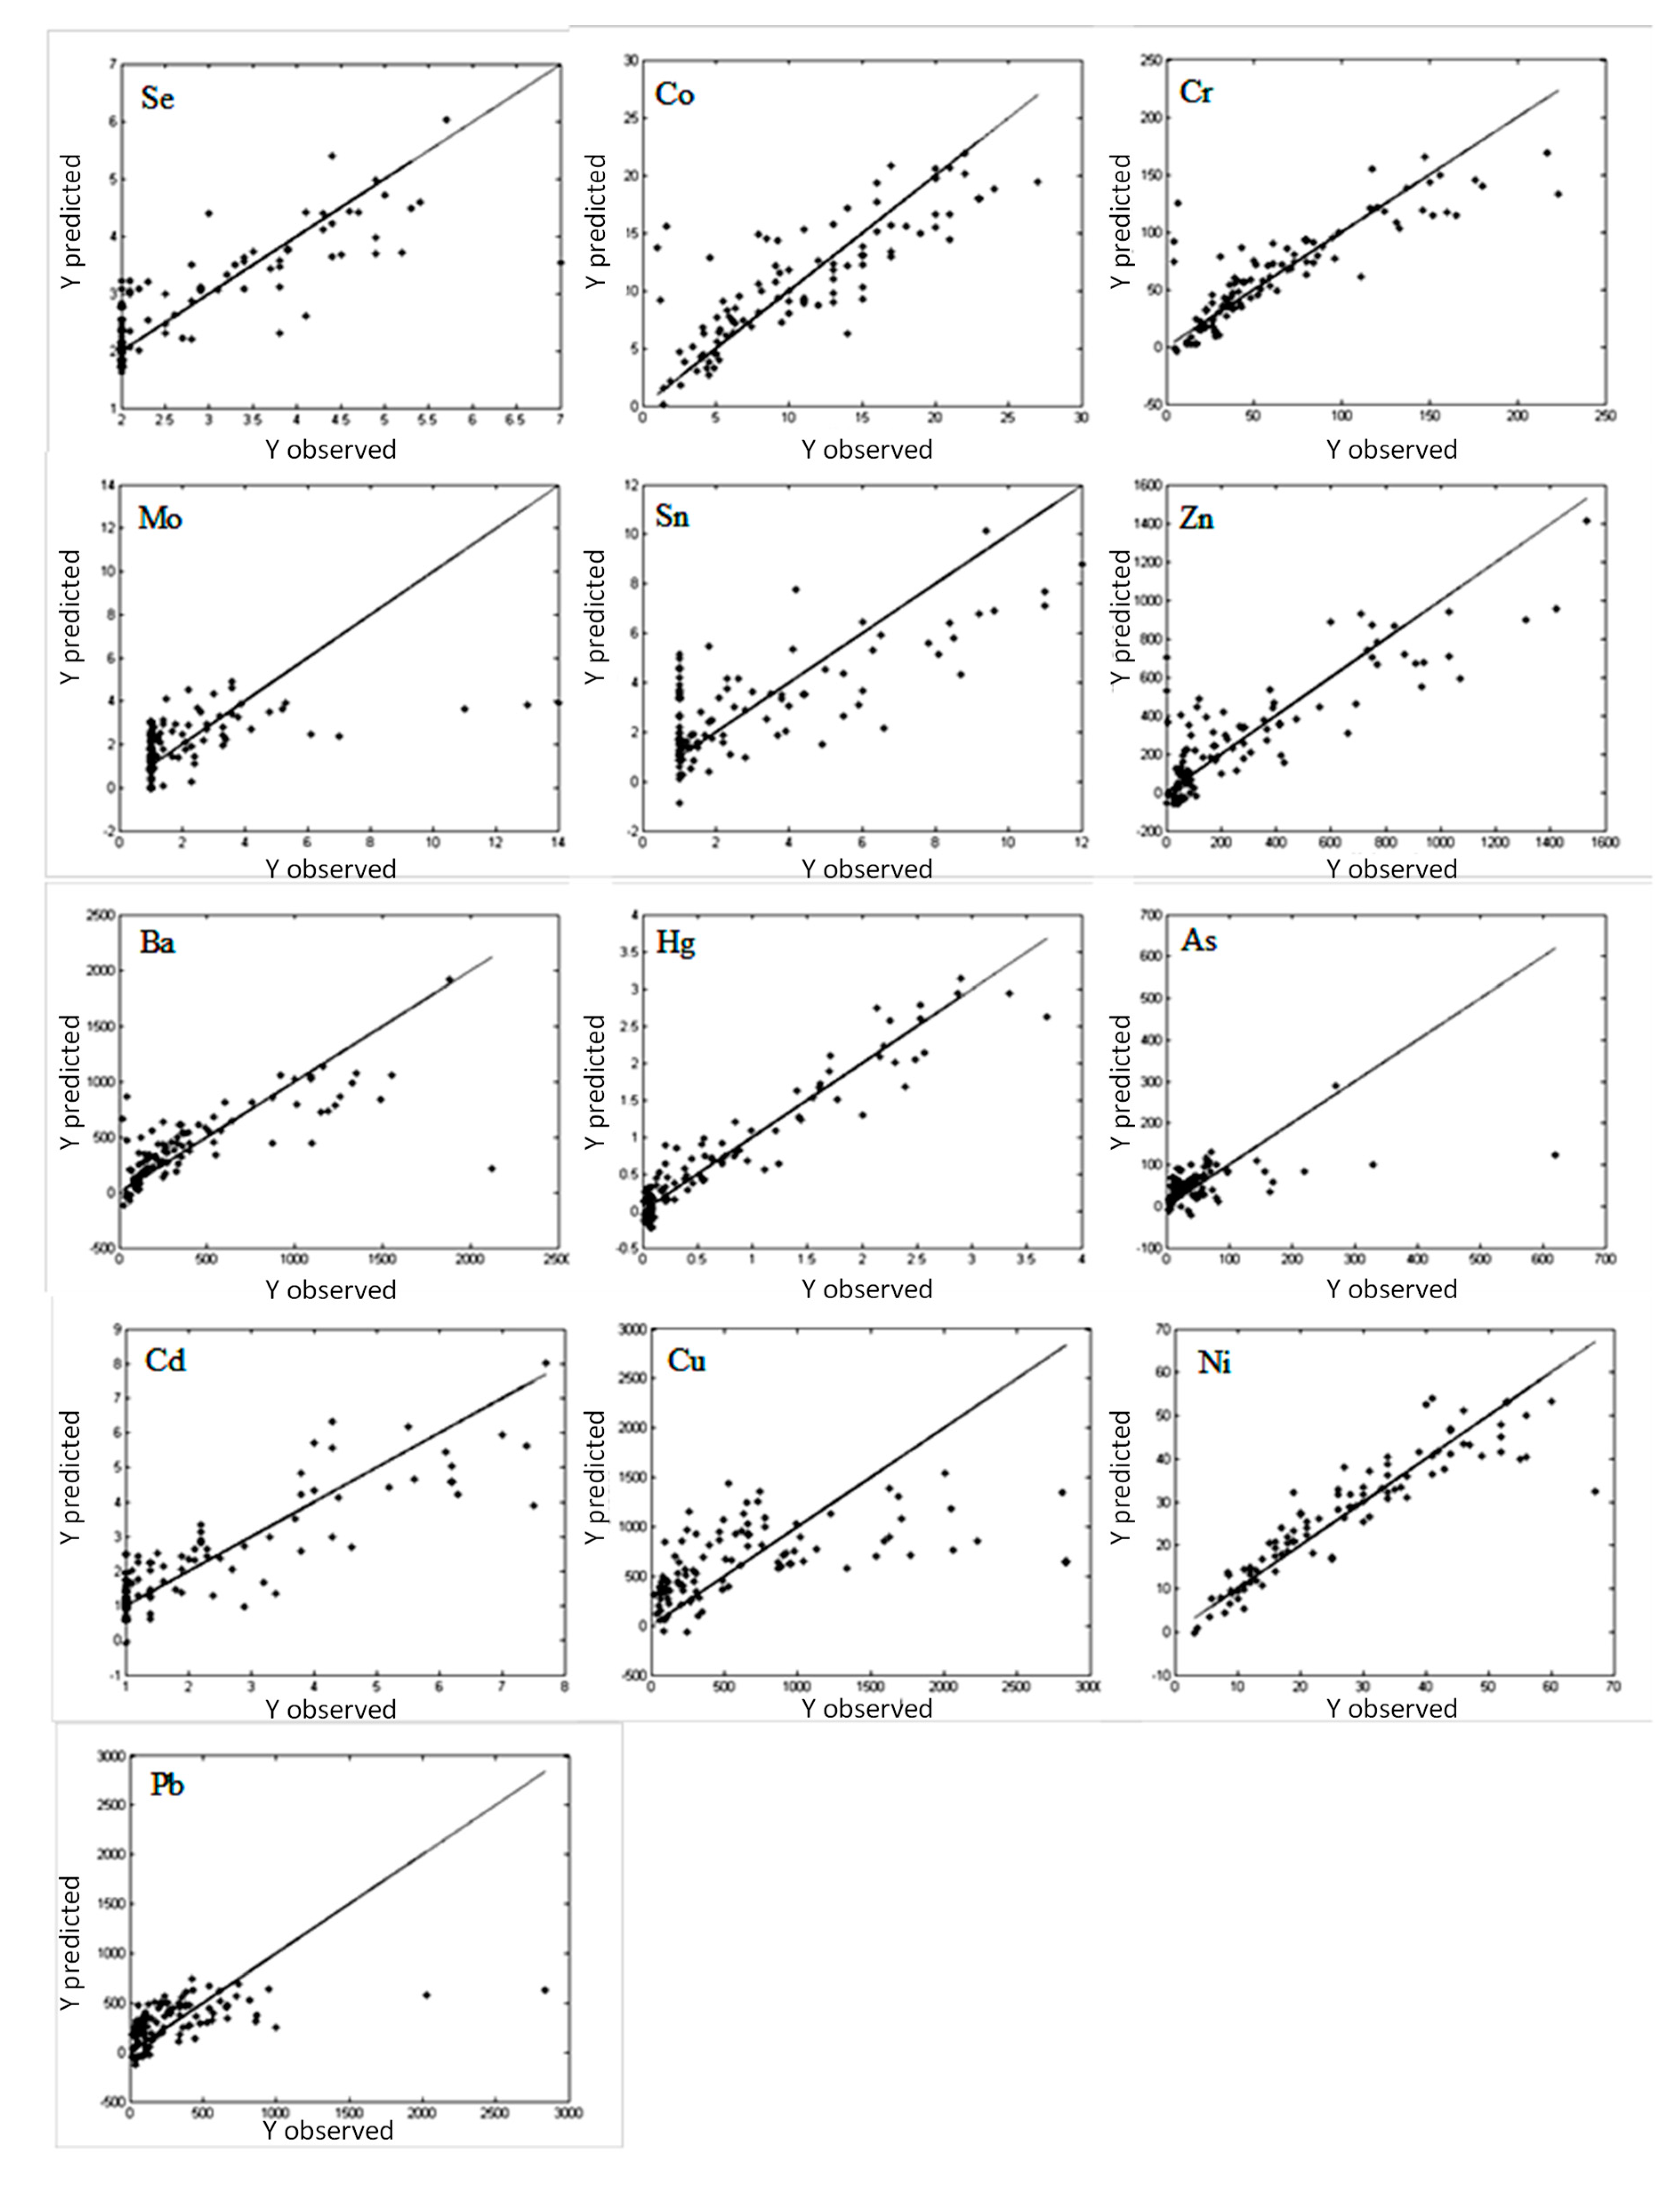
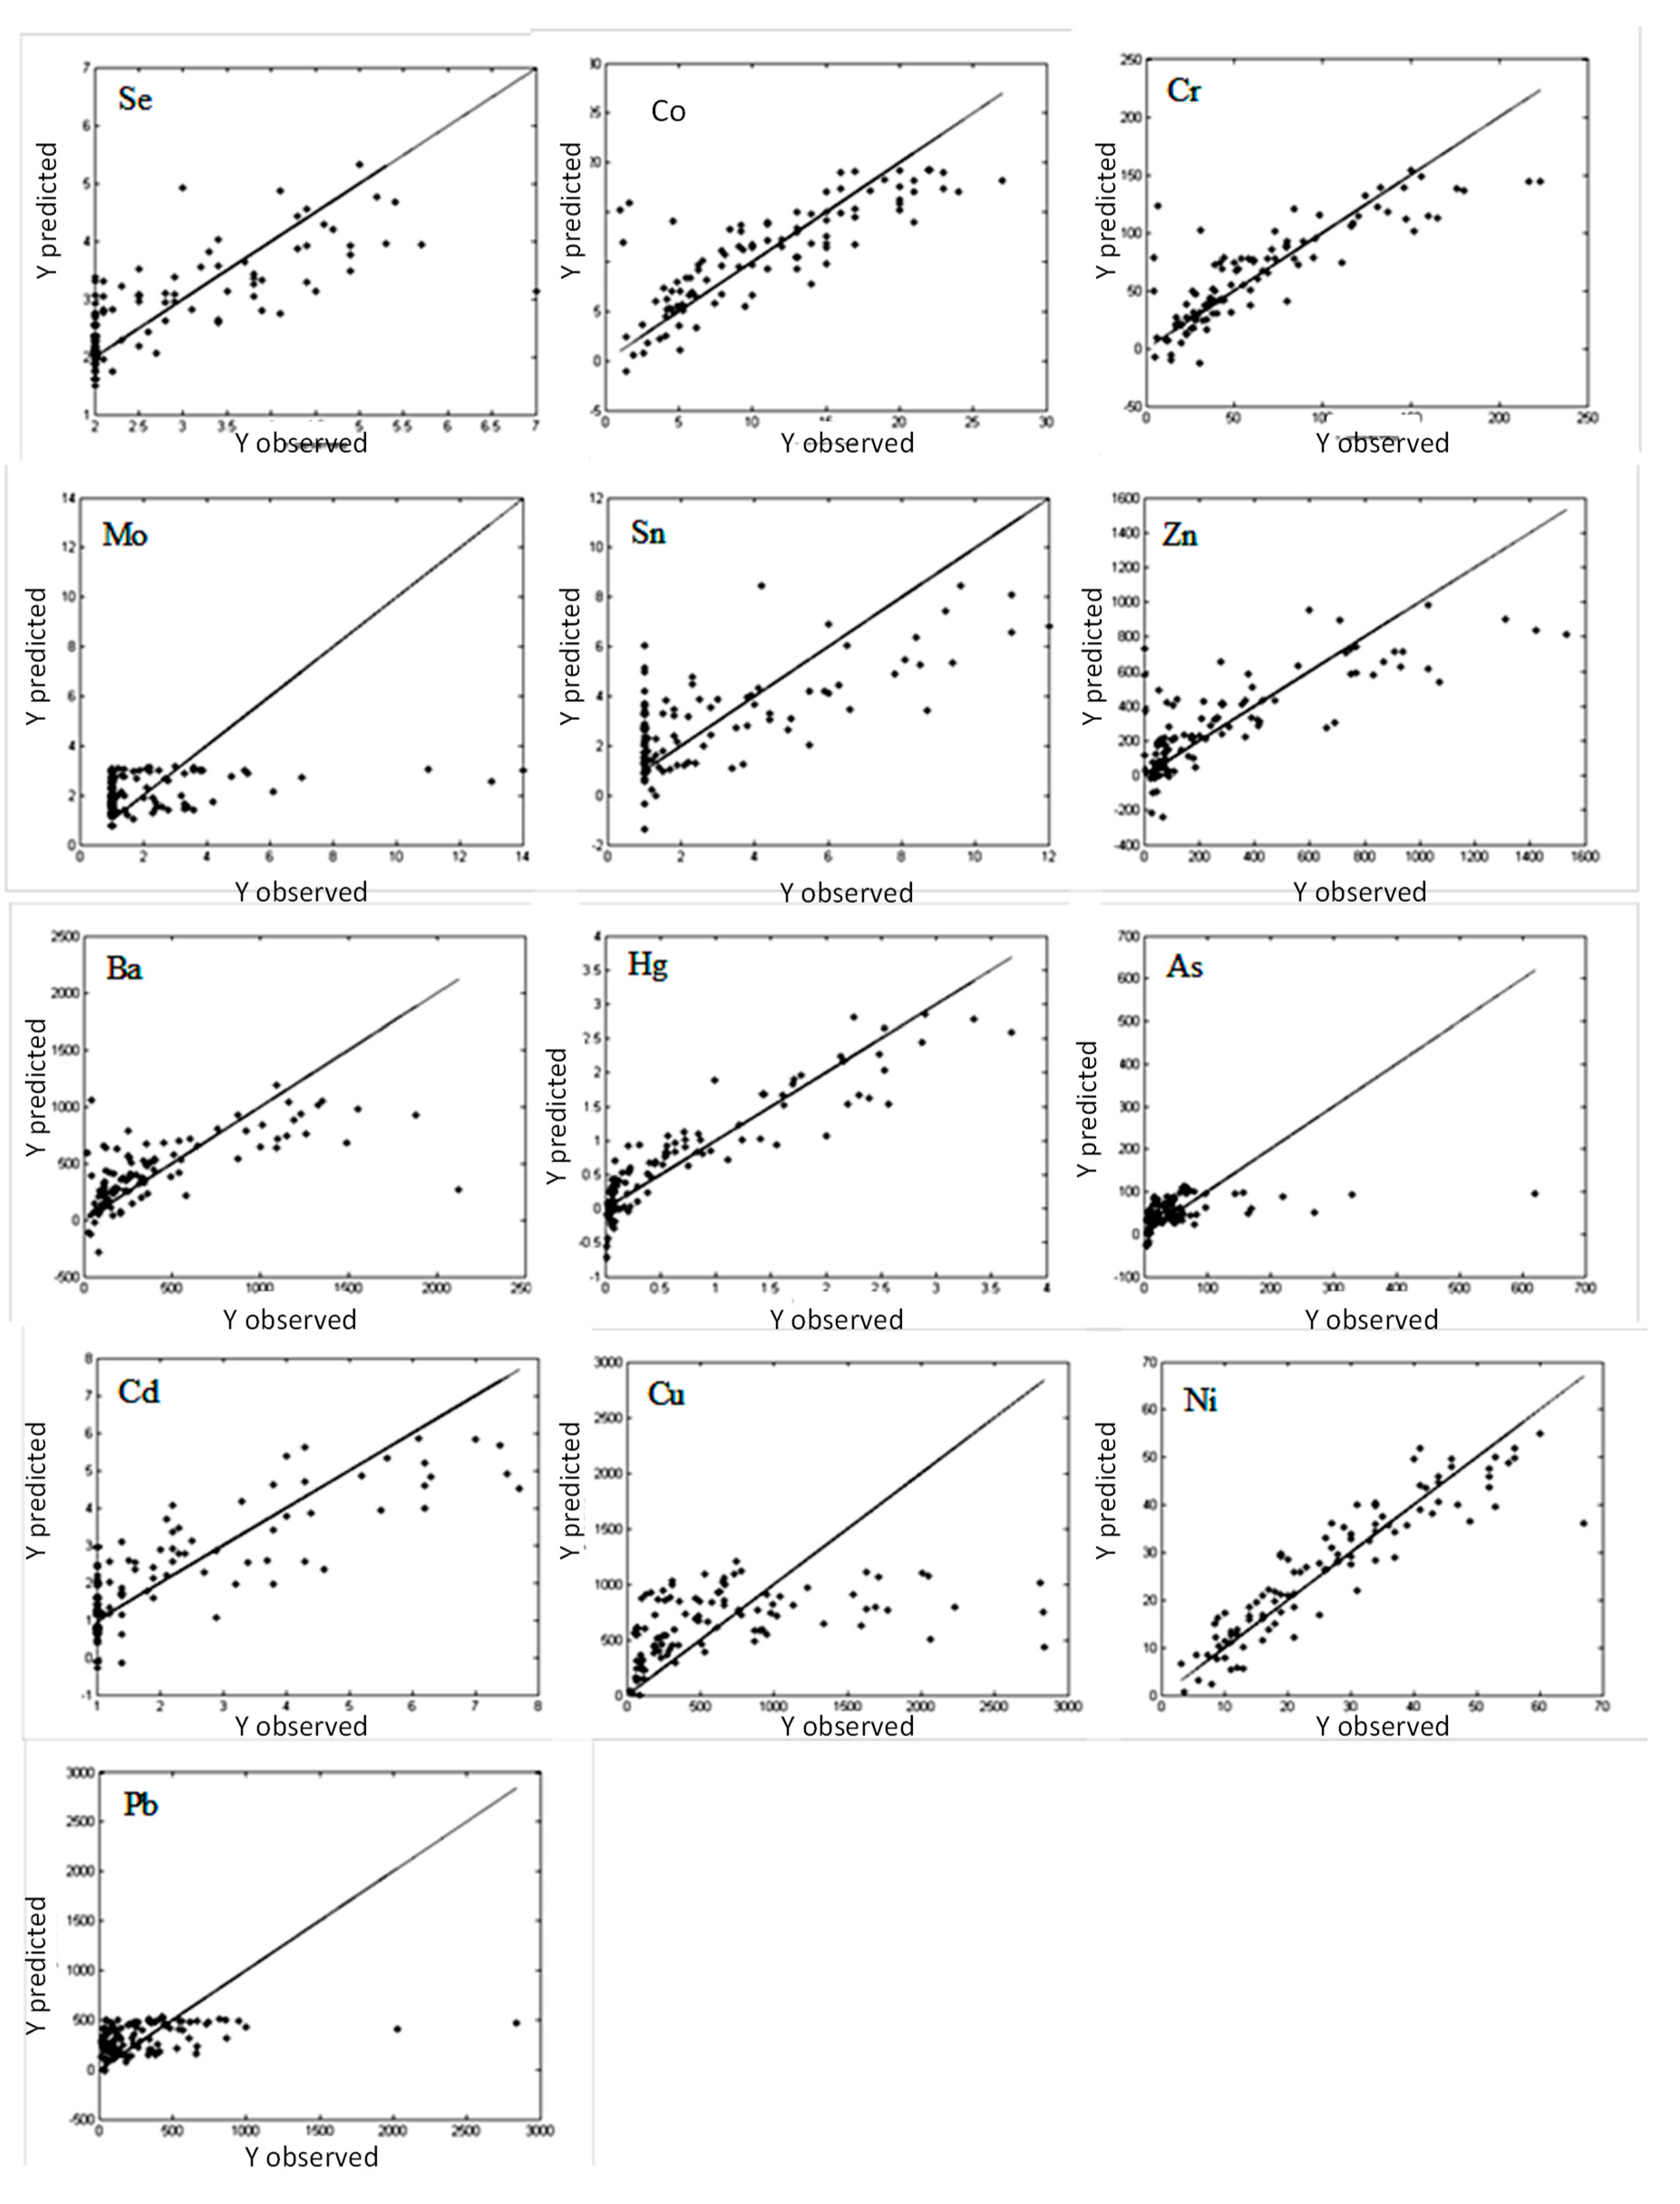
The constructed PLS models were analyzed in terms of fit and prediction abilities. The constructed models describing the relationship between the concentration and DRIFT spectra in the mid IR region (
Figure 6) were characterized by a good fit for cobalt, chromium, mercury, and nickel. Unfortunately, the constructed PLS models for molybdenum, tin, arsenic, copper, and linear correlation were characterized by a weak fit and weak prediction abilities.
Comparison of results obtained using different infrared regions, namely, far infrared ATR (1800–100 cm
−1), and mid infrared DRIFT (4000–400 cm
−1), which are presented in
Figure 5 and
Figure 6 and in
Table 1 and
Table 2, indicate slightly better results for the far IR range (lower values of %RMS and %RMSCV for every metal). This result confirmed that the crystal structure of inorganic compounds was affected in the presence of heavy metals, since heavy atom skeletal bending vibrations can be observed in the far IR range. However, differences between these two ranges were not large, which suggested that the common range of 1800–400 cm
−1 was crucial for both ranges. In this range, interactions between metal ions and organic functional groups (carbonylic, phenolic, alcoholic, and π-bonds) are observed. Individual metals form complexes with organic groups of different energy. The stronger new bond with metal is, the weaker organic group becomes, which results in a wider frequency shift of the peak for the ‘pure’ organic group. The PLS models constructed for mercury and nickel were characterized by a relatively good fit and prediction abilities (the lowest RMS and RMSCV among all constructed models).
Calibration models describing the relationship between metal concentration and DRIFT spectra in the near IR are shown in
Figure 7. In comparison to the previous results presented here and those obtained using FIR and MIR regions, in the case of the NIR region, a noticeable improvement in calibration and the %RMS values is observed in the cases of chromium, tin, zinc, barium, lead, selenium, as well as in mercury and nickel. However, analysis of the %RMSCV values indicates that the prediction possibilities for the NIR DRIFT calibration models were smaller. The error values %RMSCV were within the range 10.84–20.61%. The lowest values of %RMS and %RMSCV for the DRIFT NIR calibration models were achieved for mercury, nickel, and lead.
In
Table 4, errors achieved for each range were compared.
Generally, all the investigated spectral techniques and infrared radiation ranges have similar applicability for analysis of the metal concentration in soil. However, results indicated that there were differences between models depending on IR ranges and metals.
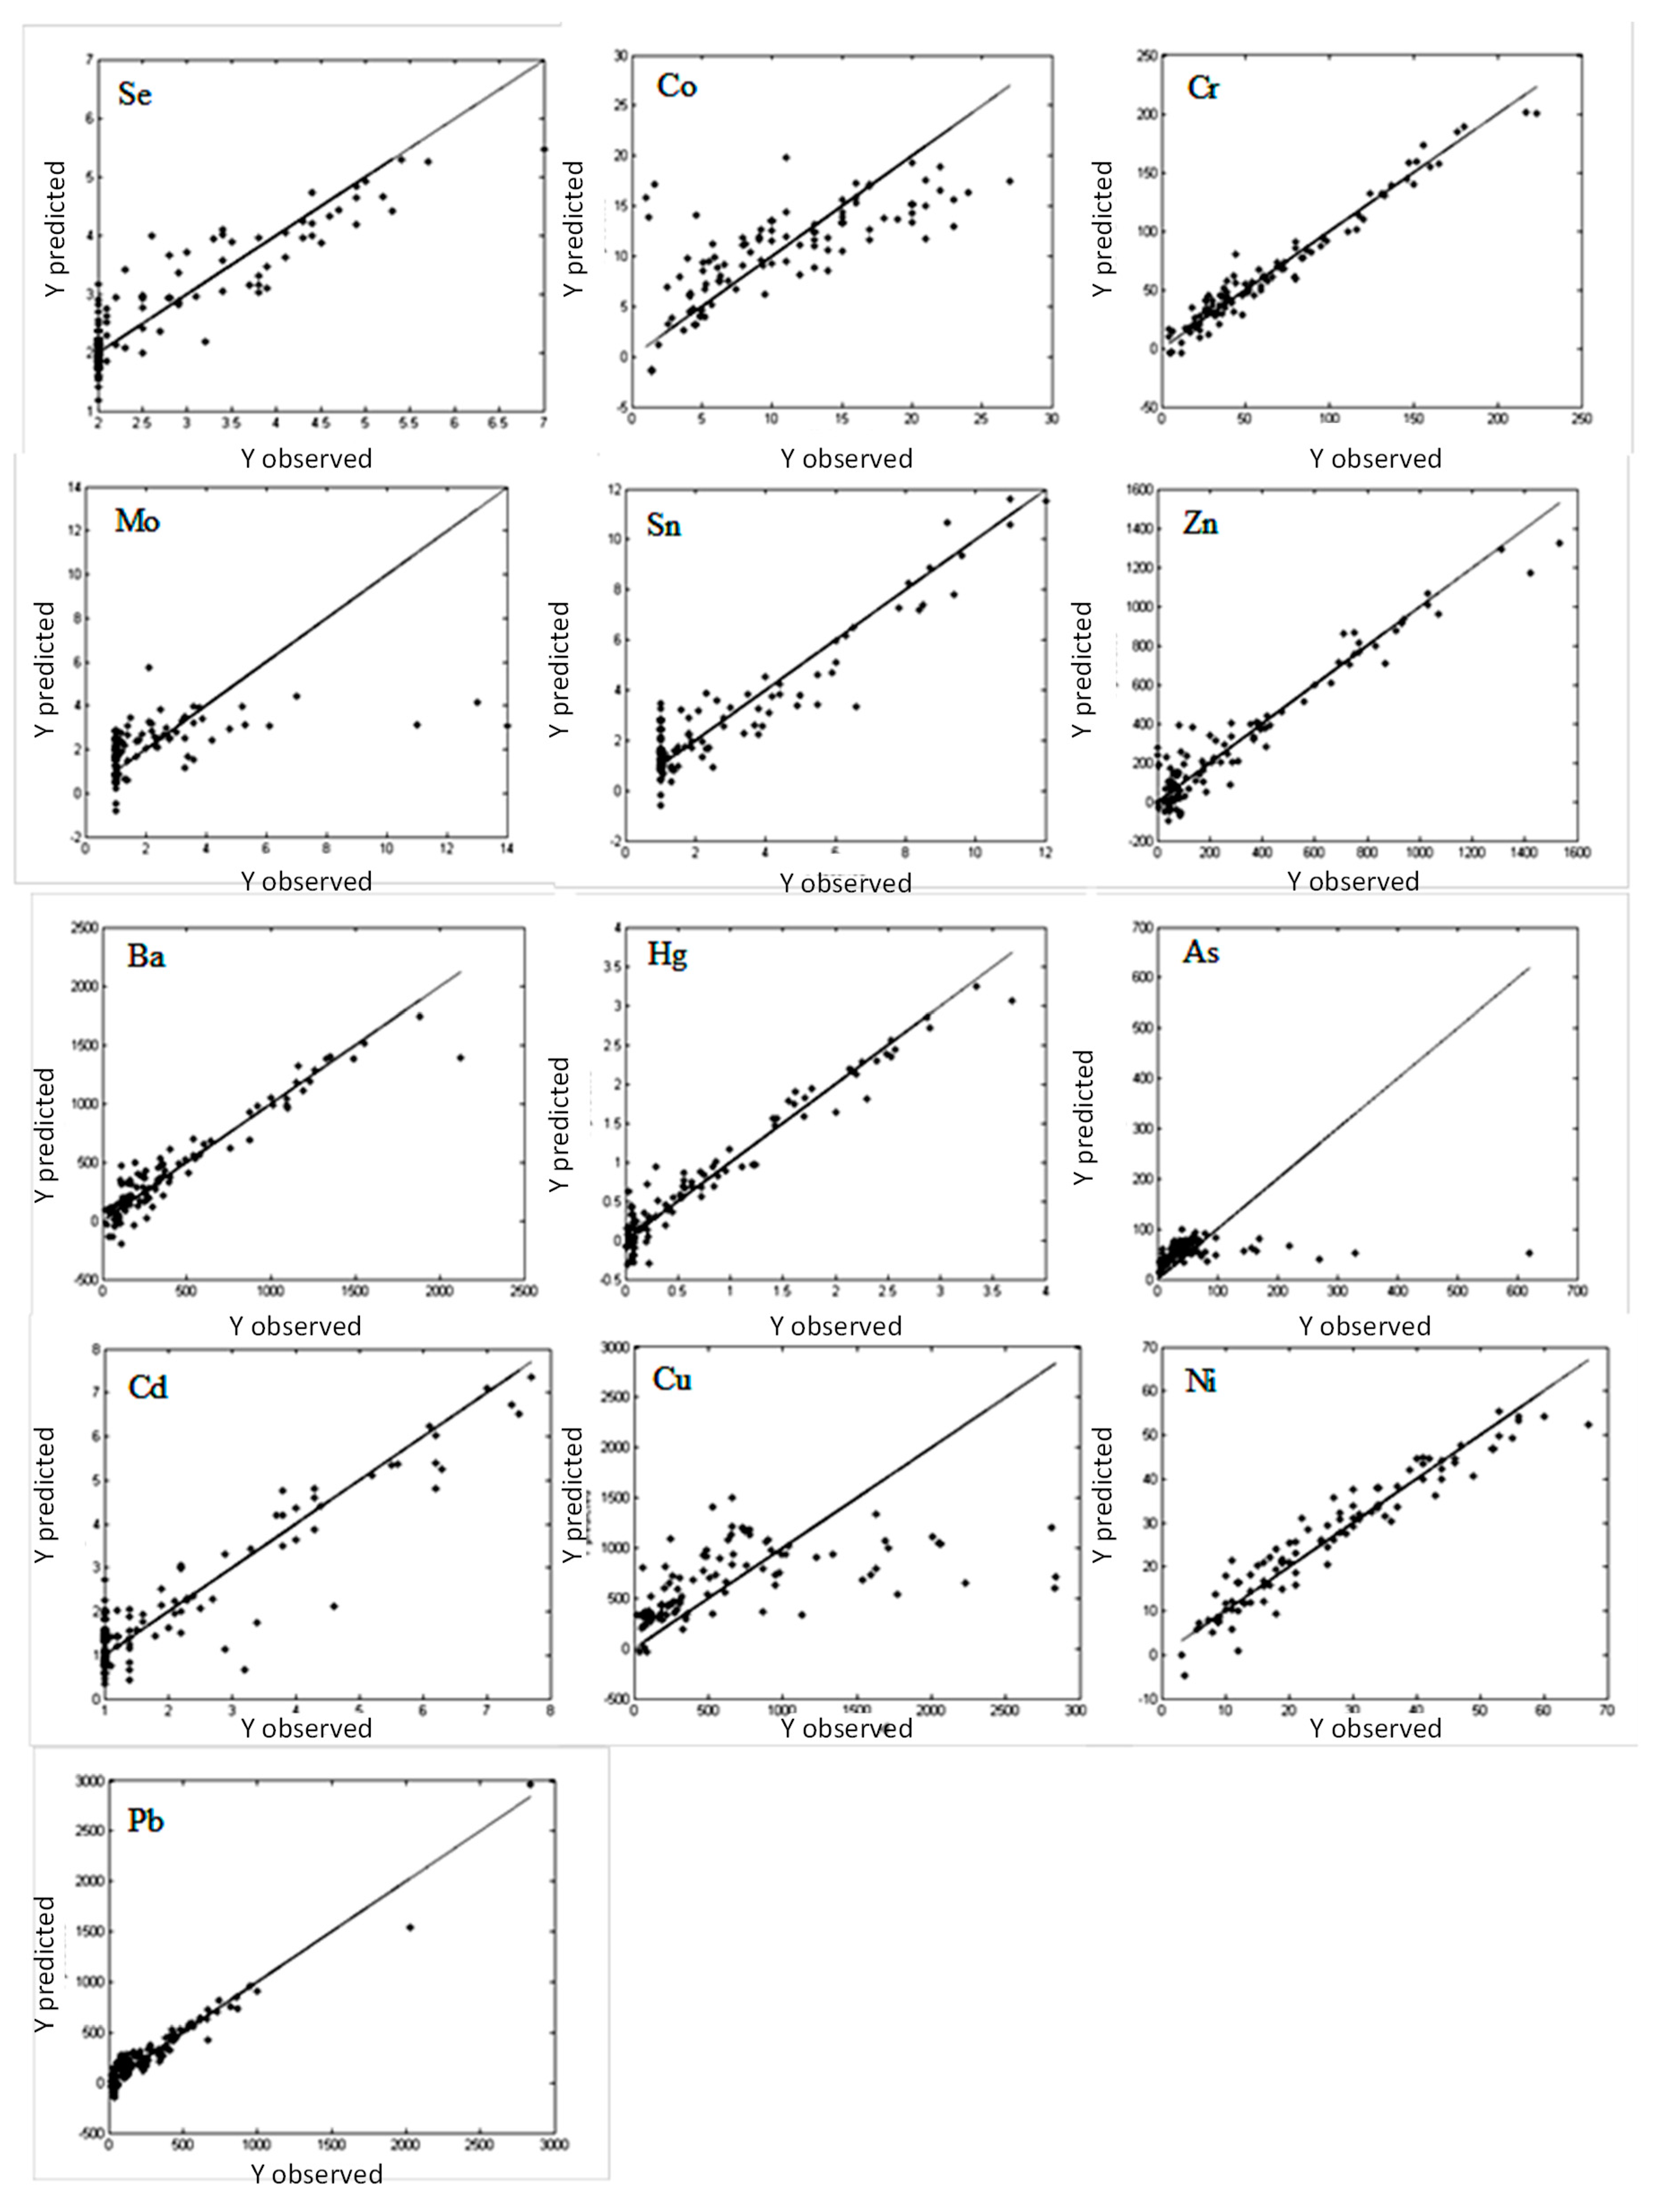
The best results and errors below 10% were achieved for following metals: chromium, zinc, barium, mercury, nickel, and lead. The highest linearity and lowest RMS values were achieved for the NIR range.
Models created using spectra measured in the far-IR region allowed us to get better linearity and lower RMS and RMSCV values there than for the MIR region. The model based on FIR spectra were characterized by better prediction abilities than NIR only in case of cobalt (%RMS 13.78, %RMSCV 15.82). For the other metals, application of FIR region did not improve possibilities of the models in comparison to the NIR region. The %RMS values below 10% were achieved only for mercury (7.44%) and nickel (9.52%). The values of %RMSCV for models based on FIR and NIR spectra were similar.
The satisfying model was not achieved for some metals like molybdenum and arsenic. Low concentrations of tin were impossible to predict, and a higher concentration of tin fair linearity and low RMS could only be observed in the NIR region. The outcome was similar for selenium – the linearity of the model was poor, especially for low concentrations. The model created for the copper was also not good – in the region of FIR and NIR for concentrations exceeding 1000 mg/kg predicted content was underestimated. For lower concentrations, NIR and FIR linearity was poor and there was a large spread of results. A similar observation was described for some heavy metals by Chodak et al. [
9] and Siebielec et al. [
10]. They concluded that such underestimated results of high concentrations were due to the fact that heavy metals in industrial samples are partially present in the inorganic form.
Comparison of the obtained results to the literature is difficult because of the broader scope of this paper (13 metals) and the much higher metal concentrations used. For example, Gholizadeh et al. (2015) considered the following ranges of concentrations in mg/kg: Cu 5.5 to 92.24, Cd 0.01 to 0.73, Pb 0.90 to 49.60, Zn 6.60 to 213.11, and As 0 to 19. Maximum contents of this metals in this paper were: Cu 2840, Cd 7.70, Pb 2840, Zn 1530, and As 620 mg/kg. Similarly, Chakraborty et al. (2015) for lead and Chen et al. (2015) for cadmium considered lower concentrations in soil. Chodak et al. (2007) investigated zinc concentration up to 4601 mg/kg which is much higher than in our paper. They reported a value of standard error of cross validation of 770 and a standard error of calibration of 436. Our results could be partly compared to the results presented by Siebielec et al. (2004) for lead (max. ca. 2000 mg/kg – in our paper the equivalent is 2840 mg/kg) and nickel (max. 80 mg/kg – in our paper 67 mg/kg). They reported that root mean squared deviations in NIR/MIR range were 839/662 for lead and 6.21/1.88 for nickel.
The spectroscopic methods were characterized by higher values for the calibration and prediction errors than the reference techniques, i.e., the error values usually exceeded 10%. The described method based on the FT-IR spectra is not an alternative to the ICP-OES method but rather can be perceived as a supplementary method with great potential for application in the estimation and approximate monitoring of soil contamination in large areas.
4. Conclusions
The application of FT-IR enables the simultaneous determination of several harmful metals in soil samples, which impacts the cost, speed, and effectiveness of environmental monitoring. The accuracy achieved with this method was good, but lower than that realized using conventional laboratory analyses. Such results indicated that FT-IR can be considered as a supplementary method to other traditionally used instrumental methods for determining metal content, such as ICP-OES. The PLS models constructed from the FT-IR spectra for the studied dataset were useful in the estimation of soil contamination by heavy metals. The results obtained indicated that both spectral techniques, namely, attenuated total reflectance (ATR) and diffuse reflectance (DRIFT), and spectra collected to each spectral region, namely far-IR, mid-IR and near-IR, enabled the construction of proper calibration models for a large number of samples for a single region for following metals: Cr, Zn, Ba, Hg, Ni, and Pb. Application of spectra for the far-IR slightly improved the prediction possibilities of the model in comparison to the mid-IR region. The models based on NIR-spectra were characterized by slightly better linearity than other ranges and the lowest RMS values. Attempts to create good models failed for several metals: Mo, Sn, As, Se, and Cu. Taking into account calibration and prediction errors, FT-IR spectroscopy could be applied in the monitoring of changes over time regarding heavy metal concentrations or the mapping of contamination levels across large areas.


