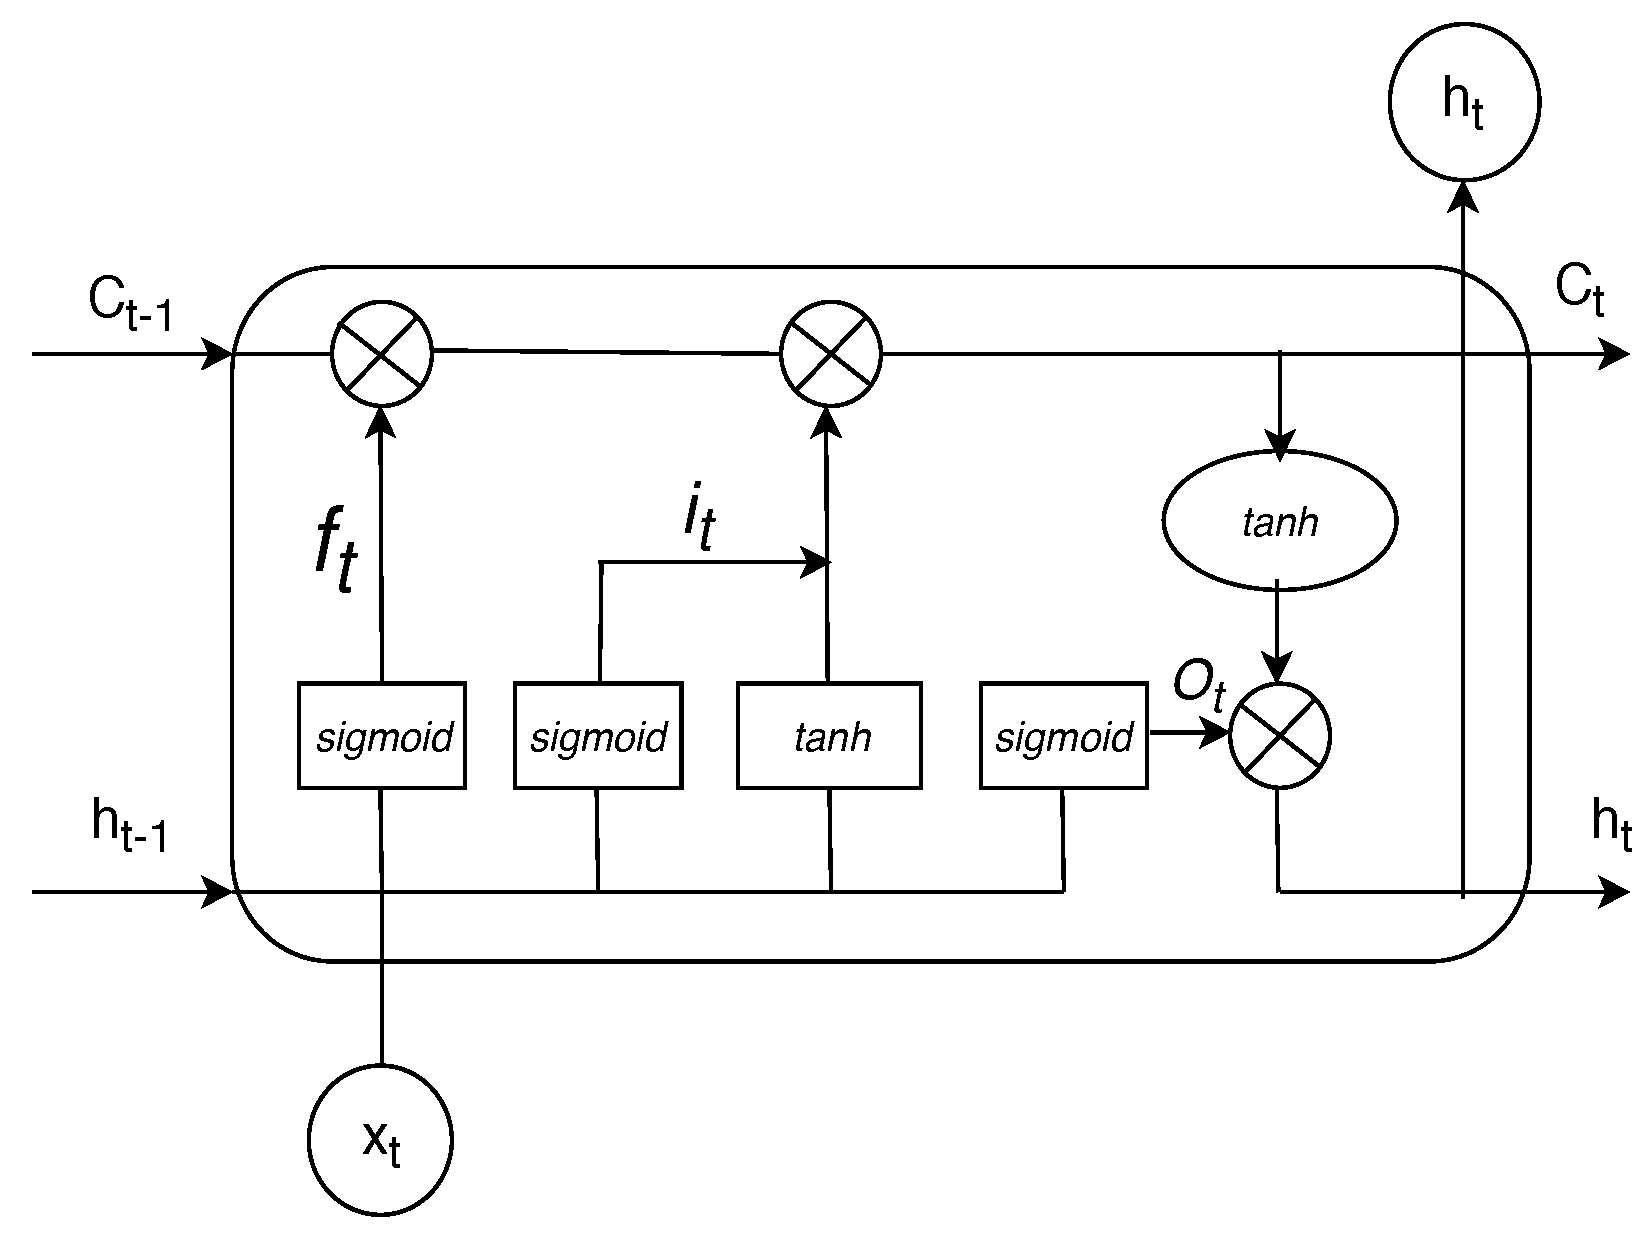
6.1. Effectiveness of Different Types of Input Features
In this subsection, the performance of our approach is examined using six different types of input features for the top five companies on the KOSPI 200 (i.e., Samsung Electronics Co. ( Suwon, Korea), SK Hynix Inc. (Icheon-si, Korea), Celltrion (Incheon, Korea), Hyundai Motor Co. (Seoul, Korea), and LG Chem (Seoul, Korea)) and the top five companies from five popular sectors on the S&P 500 (i.e., Apple Inc. (Cupertino, CA, USA), Amazon.com Inc. (Seattle, WA, USA), Boeing Company (Chicago, IL, USA), Johnson & Johnson (New Brunswick, NJ, USA), and JPMorgan Chase & Co. (New York, NY, USA)). Note that
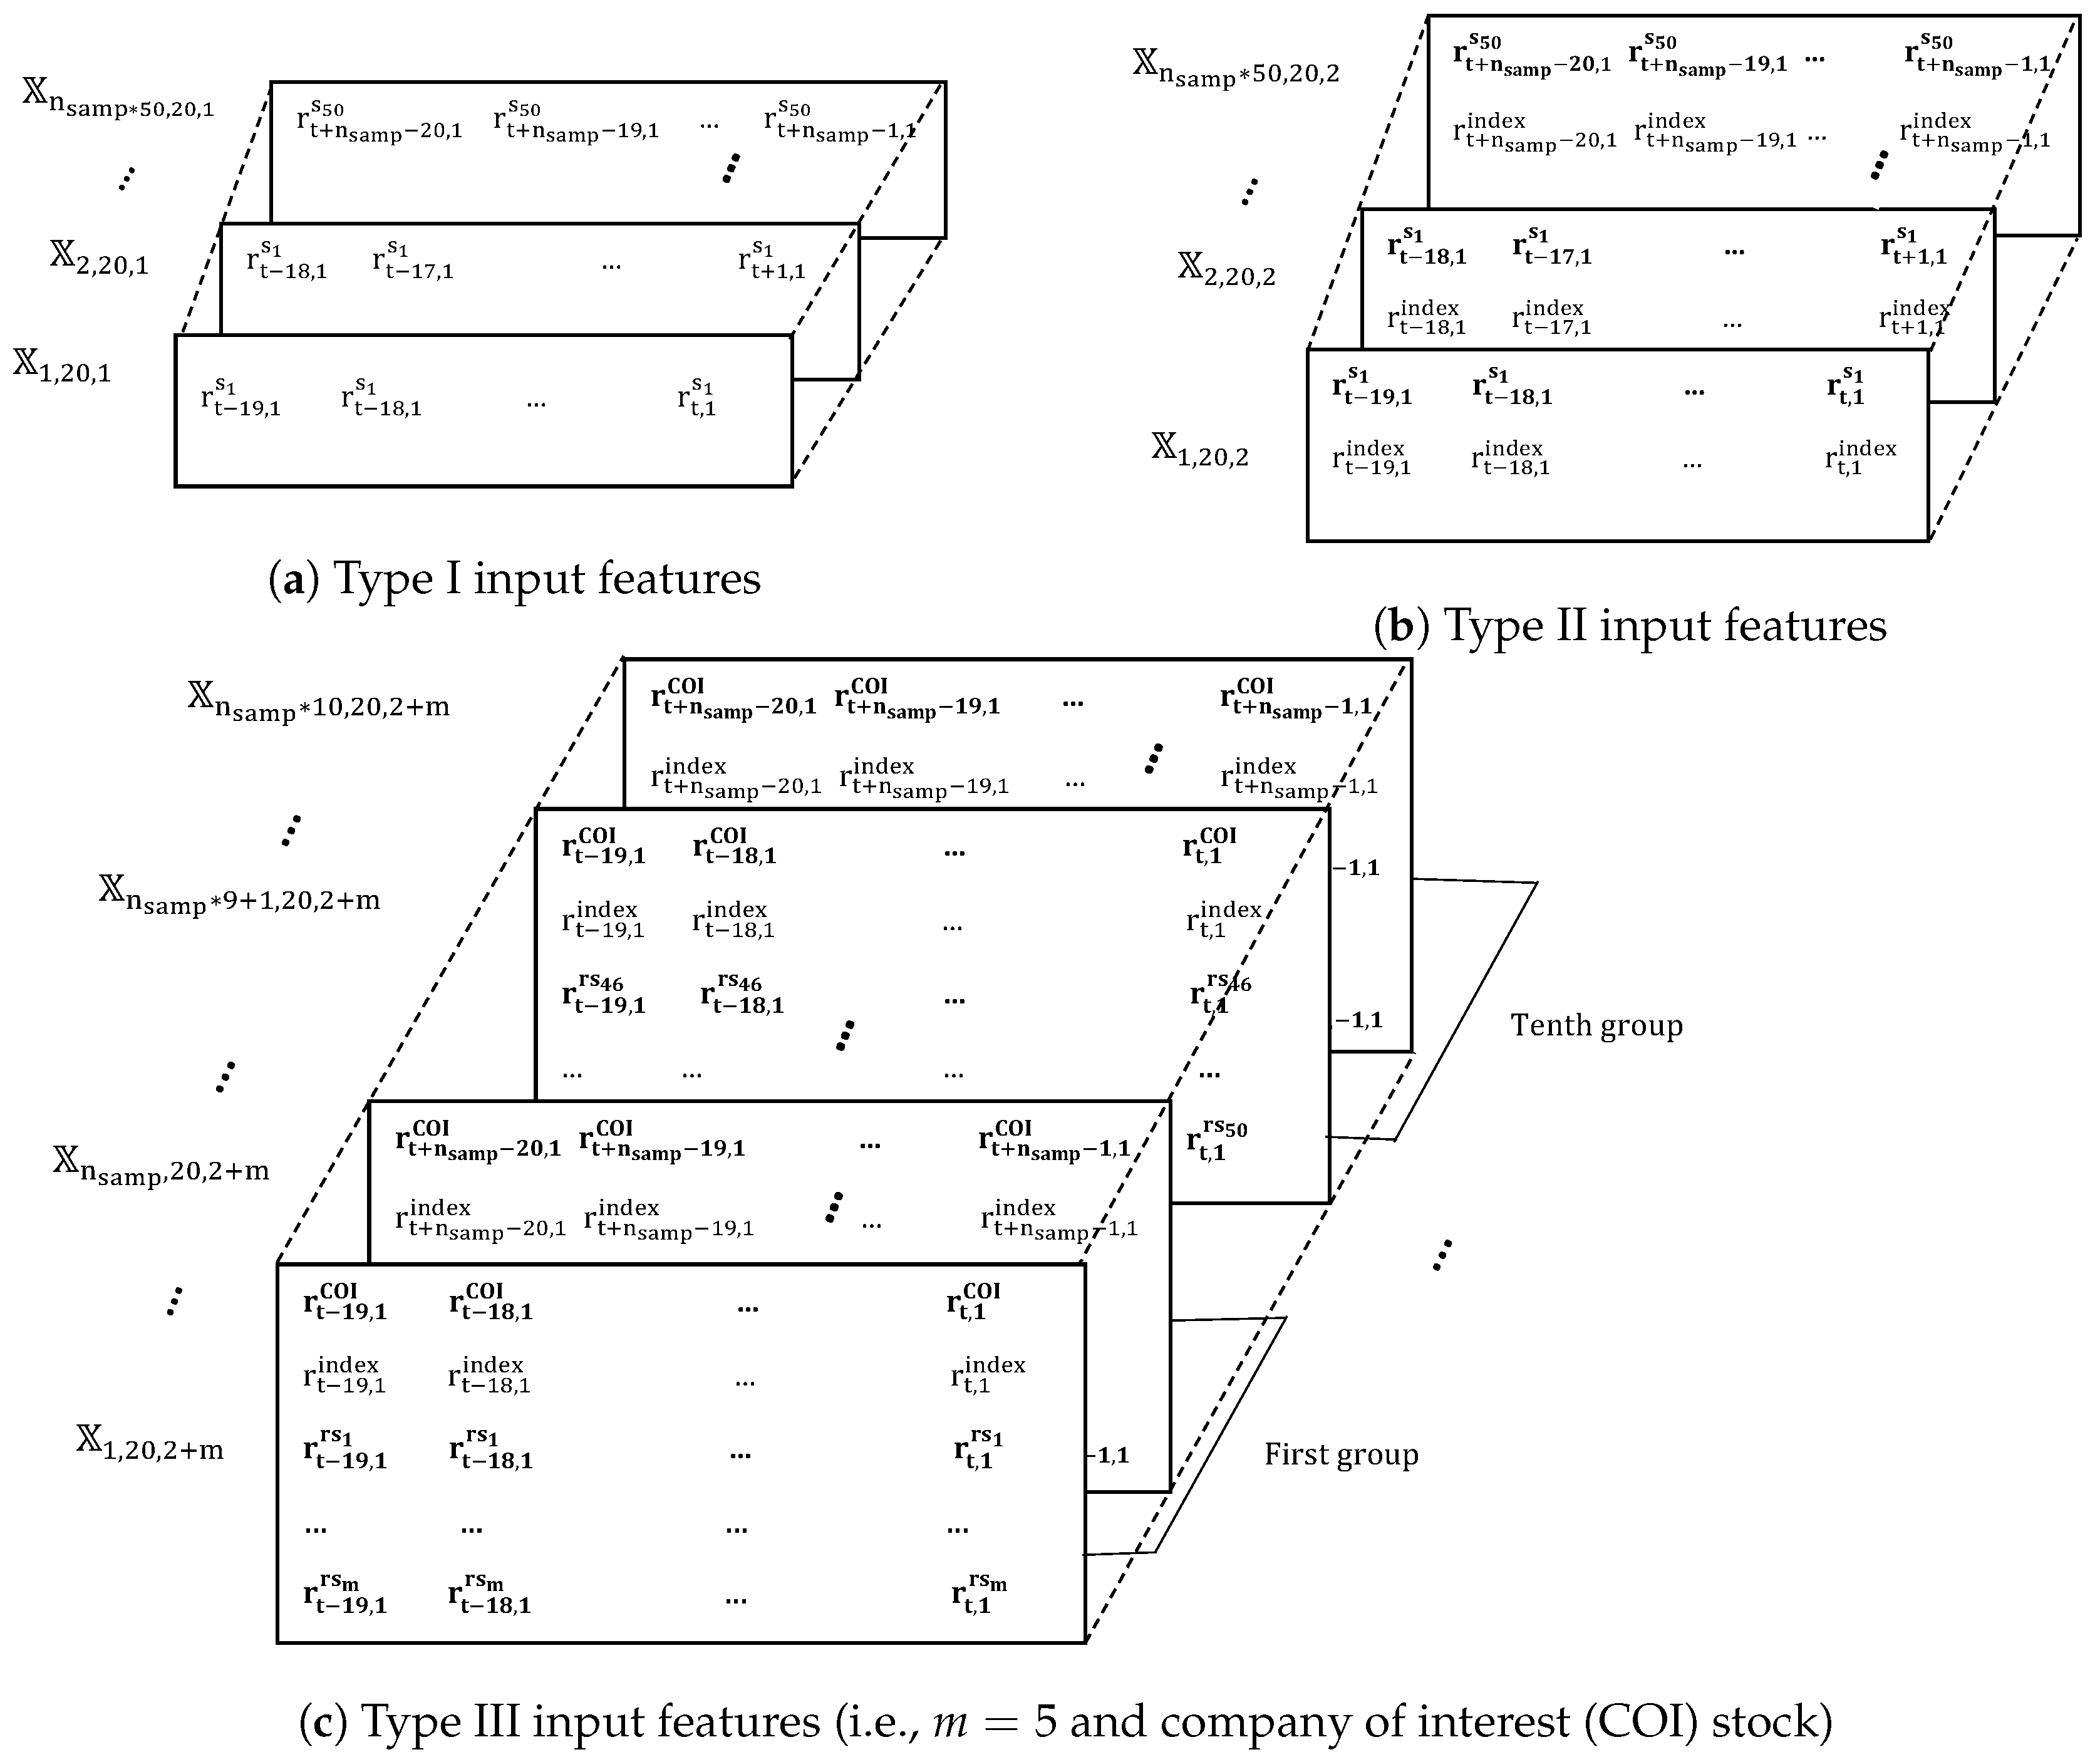
Table 5 uses COI, CI, CI+CS, CI+SF, CI+HMC, and CI+RND as the names of input features
,
,
,
,
, and
, respectively. Recall that CI is defined as model inputs formed based on features of the COI stock and the index; CS, SF, HMC, and RND are represented the relationship between other stocks and the COI stock such as the highest cosine similarity, similar field, the highest market capitalization, and randomly chosen, respectively.
As seen in
Table 5, the average prediction accuracy with CI+SF is the highest over all the study periods. Specifically, CI+SF obtains the highest average accuracy at 60.64%, compared to 53.74% and 56.35% for COI and CI, respectively. In addition, our model with CI+CS, CI+HMC and CI+RND achieves 58.91%, 58.59%, and 55.87%, respectively. This indicates that similar-field companies help to significantly improve the prediction accuracy of the model, compared to other considered factors.
Overall, the prediction model with CI+SF obtains the highest performance for almost all of the stocks. In particular, the prediction model with CI+SF effectively predicts Hyundai Motor Co. with a 64.54% average accuracy and Amazon.com Inc. with a 62.65% average accuracy over all study periods. However, in case of Apple Inc., CI attains 60.49% accuracy, which is slightly better than the 59.88% accuracy from CI+SF. One reason may be that Apple Inc. is the largest company in the United States and it is better coupled with the S&P 500.
In CI+SF, stocks from a similar field (e.g., similar industrial products) to the COI stock are selected. In fact, two companies in the same industry affect each other dramatically [
44]. For example, an event like a “Samsung recall” may decrease Samsung’s stock value while increasing the stock price of SK Hynix Inc. at the same time because SK Hynix Inc. is the world’s second-largest memory chip-maker (after Samsung). In contrast, CI+CS uses stocks that have the most similar direction in closing price movements. In our work, cosine similarity between two vectors including one-day returns of two stocks is calculated over the entire training time period. As shown in
Table 5, CI+SF achieves better average accuracy than CI+CS by 1.73%.
Additionally, CI+HMC aims at using top stocks that have the highest market capitalization in order to construct model inputs. When the COI is one of the top companies (e.g., Samsung Electronics Co., SK Hynix Inc, Apple Inc., or Amazon.com Inc.), CI+HMC obtains slightly better performance than CI+CS. Unlike these top companies, in the case of JPMorgan Chase & Co., CI+HMC achieves the worst performance at 54.01% average accuracy. Note that JPMorgan Chase & Co. is the largest company in the US financial field. Meanwhile, top companies of the US are companies working in the information technology field (e.g., Apple Inc., Alphabet Inc Class A (Mountain View, CA, USA), Microsoft Corp. (Redmond, WA, USA), and Facebook Inc. (Menlo Park, CA, USA)). Therefore, considering CI+HMC may not affect to JPMorgan Chase & Co.’s stock price movements, and may make irrelevant input features. As we can see in
Table 5, in case of JPMorgan Chase & Co., CI+HMC obtains slightly lower performance than CI, which does not use information about other stocks.
Moreover, in our study, we train the prediction model with CI+RND. In this type of input, we choose other companies randomly (i.e., they may have no relationship to the COI stock). From the empirical results presented in
Table 5, CI+RND provides lower performance than CI in terms of average prediction accuracy over all study periods. It proves that adding unnecessary information does not help improve the model’s performance.
One should note that CI+CS, CI+SF, and CI+HMC attain higher prediction accuracy than CI, and COI achieves the lowest performance. It indicates that by adding more relevant information, the performance of the prediction model is generally enhanced.
6.2. Effectiveness of the Proposed Approach versus Benchmark Models
In this subsection, we evaluate the performance of our model compared to four baseline classifiers, which are SVM, RF, KNN, and an existing model using LSTM cells [
20]. First, the input vector for training four baseline models is constructed. Specifically, in constructing input vectors for the SVM, RF, and KNN models, five returns are stacked into one feature vector
, which is used as an input vector. Unlike these models, in [
20], they used 240 one-day returns,
, to design input vectors, in which
. Therefore, the input model is formed as
. All returns,
, are calculated by using Equation (
6). In addition, targets of the baseline models are defined in the same way as the targets of our model in
Section 4.
Two kinds of non-linear kernels (i.e., the radial basis function (RBF) kernel and the polynominal kernel) of SVM are considered. Hyperparameters of SVM (e.g.,
of RBF kernel, degree
d of polynominal, and regularization
C), hyperparameters of RF (e.g., the number of trees
B, and maximum depth
J), and hyperparameters of KNN (e.g., the number of neighbors
K) are chosen by grid search for each branch. For choosing hyperparameters of the SVM model, the searching interval for
,
d, and
C is
with a step size of
,
with a step size of 1, and
, respectively. The search range
with a step size of 10 and range
with a step size of 1 are considered for number of trees and maximum depth of RF model, respectively. Also, the search range
with a step size of 1 is considered for number of neighbors of KNN model. The model from [
20] consists of the input layer with one feature and 240 timesteps, one LSTM layer with
hidden neurons and a dropout of
, and the output layer with two neurons and softmax activation function.
As shown in
Table 6, the performance of our proposed approach is the highest, with a 60.70% average accuracy in the study periods, while the SVM, RF, and KNN methods show low performance with 51.57%, 51.49%, and 51.77% average accuracy, respectively. Note that even when our approach uses only one-day returns of COI stock, it achieves 53.74% average accuracy, which is higher than SVM, RF, and KNN models by 2.17 percentage points, 2.25 percentage points, and 1.97 percentage points, respectively. It indicates that simple classifier models cannot extract input features effectively. Moreover, the overfitting problem may occur in training the SVM, RF, and KNN models due to the insufficient amount of data, whereas our approach based on transfer learning can reduce the influence of this problem.
Compared to the existing model from [
20], our approach improves the average accuracy by 3.34%. In [
20], the model predicted COI stock price movement on day
based on only one-day returns of the COI stock over one year. In fact, the direction of stock price movement is affected by other factors [
1]. Unlike [
20], related stocks are considered in our study. Results prove the effectiveness of using returns of related stocks to form the model input.
Overall, the proposed approach outperforms the model in [
20] for all stocks, particularly, in the case of Hyundai Motor Co. company, with only 57.83% average accuracy from the existing model, compared to 64.54% average accuracy of our proposed approach (a broad difference of 6.71 percentage points). Additionally, 5.11% and 4.63% higher average accuracy are achieved for SK Hynix Inc and Amazon.com Inc., respectively. However,
Table 6 illustrates similar average accuracy for the proposed approach and the existing model in predicting stock price movements of LG Chem, at 60.05% and 58.78%, respectively.
6.3. Performance Based on Different Numbers of Similar Companies
In this subsection, we concentrate on examining the influence of the number of stocks from a field similar to the COI stock when predicting stock price movement. The number of stocks varies: .
As shown in
Table 7, the performance of predicting stock price movements of each company dramatically depends on the value of
m. Specifically,
displays the lowest performance at 55.93% average accuracy. However, with Hyundai Motor Co. and LG Chem,
achieves remarkable performance at 64.22% and 56.87% average accuracy, respectively, compared to the others.
In addition, both
and
obtain similar performances at 57.97% and 57.62% average accuracy. In the Korean market, unlike Hyundai Motor Co. and LG Chem, the performance from stock price movement prediction for two companies (Samsung Electronics Co. and SK Hynix Inc) is the highest when
. For instance, with Samsung Electronics Co.,
achieves 59.42% average accuracy, compared to 56.56% and 52.39% average accuracy when
and
, respectively. A similar trend is present in the US market, as shown in
Table 7, particularly, for Apple Inc., with only 52.68% average predictive accuracy when
, compared to 58.96% average accuracy when
(a broad difference of 6.18 percentage points).
It should be highlighted that the value of m is considered as a hyperparameter of the prediction model and this value should be chosen carefully for each company.


