Abstract
A performance-driven sustainable urban design is an important step in adapting to local climates and improving outdoor comfort level. This study proposed investigating an urban layout optimization method, validated in an urban area in Shenyang City, a cold region, that comprises nine urban blocks. This study selected an urban block type and street width as optimization input indices and defined the percentage of acceptable universal thermal comfort index (UTCI) range as the objective. The genetic algorithm is applied to optimize and generate an urban block to maximize the percentage of acceptable UTCI range at urban block level and street level. When the comfort level is set as −17–20 °C, optimization can achieve 87.7% of acceptable UTCI in the urban block level and 90.3% at urban street level. To attain an urban layout with higher than 85% acceptable UTCI range, results found, in a cold region, multistory blocks are more suitable than high-rise blocks and open spaces; it would be better to place multistory blocks with high building enclosures on the north side to block cold wind.
1. Introduction
With urbanization, climate change appears accordingly, becoming a major challenge with the need to adapt to urbanization. Climate changes have increased as a result [1]. Researchers provide many insights on such nexus between urbanization and climate change, emphasizing sustainable urban development and its corresponding strategies [2,3]. Such challenges usually face integration with nature, socio-economics, human beings, and so on [4]. Among those, the urban microclimate—increasingly associated with natural environment and human comfort—has caught much attention in urban performance assessment and designs, including sunlight [5,6], energy performance [7,8], thermal comfort [9], and ventilation [10,11]. As an important part of urban design, urban layout has a vital impact on urban microclimate and outdoor thermal comfort in urban areas. Layout is one of the most critical criteria for evaluating the quality of urban space. In particular, urban layout can influence urban climate with different morphological parameters, exhibiting more intense heat islands [12,13,14] and lower permeability of urban air ventilation [15,16]. Therefore, urban morphology is now an important ecological factor in high-density and high-intensity urban development, gradually becoming the focus of architects and planners [17,18].
Some researchers have explored the relationship between urban spatial patterns and microclimate. Johansson and Emmanuel (using urban Colombo’s hot and humid areas in Sri Lanka as an example) studied the influence of street canyons’ geometric shapes on outdoor thermal comfort and proved the importance of urban form for that microclimate [19]. Ali-Toudert and Mayer [20] investigated urban street design influence on outdoor thermal comfort and pointed out that all design aspects can impact air temperature and heat gained in the human body. Erell et al. discussed the microclimate between buildings by combining the latest achievements in climate science with their own applications in urban design, suggesting principles for successful integration of climatic strategies in urban planning processes [21]. Moreover, Tsitoura et al. analyzed the key climate parameters in an area, providing necessary information for designing climatological urban outdoor open spaces [22]. Wong et al. used computational fluid dynamics (CFD) to simulate the influence of geometric scale changes on urban streets and building complexes with an urban heat island effect [23]. Yang et al. conducted simulative analysis regarding the impacts of height–width (H/W) ratio, orientation, and other form elements of canyons of urban blocks on their microclimatic environments, showing that a H/W of three can be considered a threshold with respect to outdoor thermal comfort [24].
In addition to urban climate simulation, Bajsanski applied the Ladybug (a plug-in of the Grasshopper in Rhino software) to study urban planning significance on the heat environment in Neoplanta, Serbia, and the research pointed out that building height and density increases in future street design and can modify the thermal environment [25]. Taleb et al. applied a genetic algorithm in Rhino to generate a building form cluster that adapts to a dry and hot climate, covering environmental factors such as solar radiation, urban ventilation, building form, and orientation to achieve the best sustainable urban form [26]. A Geographic Information System (GIS) extension model was applied to simulate and calculate the urban heat island intensity based on urban geometry [27]. Perini et al. replicated urban outdoor thermal comfort by coupling EVNI-Met and TRNSYS using Grasshopper, as well as investigated the potentialities of both ENVI-met and TRNSYS for calculation of urban features (urban form, vegetation, canyon proportion, etc.), all of which affect urban microclimate [28]. Xu et al. analyzed design parameters for an urban courtyard, reaching climate optimization through simulations with PHOENICS (version 1.0, CHAM, London, UK), CFD, and EnergyPlus (version 7.1, DOE, US) software, determining how the outdoor environment influences the indoor environment in different designs [29]. Edward Ng studied the impacts of the scale relationship among buildings and varied skylines on urban ventilation and air quality in high-density cities. Ng used a sunshine-based physical model and CFD technology, recommending an air ventilation assessment for a better wind environment toward sustainable development in Hong Kong [30]. Moreover, Mayer et al. researched numerical simulations and actual measurements of the outdoor thermal environment; his findings concluded that simulation models can be validated from real environmental conditions to enable a reality-oriented model initialization [31].
Above all, research on the relationship between urban environment and microclimate have been carried out, with many studies forwarding suggestions for urban planning and design based on general principles of urban climatology. Those studies usually focused on studying the microclimate at a micro-level block. On one hand, a lack of investigation exists at the meso-level, which is, most often involved in urban design. On the other hand, urban microclimate is usually studied with single or limited climate factors, and as such, is short on analysis with comprehensive factors. The main goal of this study included creating an evaluation criteria of microclimate comfort with an acceptable universal thermal climate index (UTCI) percentage and optimizing urban building forms and intervals to explore the maximum acceptable UTCI percentage. Two levels—urban block level and street level—were studied, and one urban block in a typical urban region (Shenyang City, Liaoning Province, China) was selected as a case study to extract prototype of urban form.
2. Methodology
2.1. Overview of This Study
Figure 1 shows the overview of this study. First, this study selected the field where climate condition and typical urban forms were applied. Second, this study defined multiple factors of urban morphology (building density, plot ratio, sky view factors, building enclosures, and variation of building heights), as well as several other factors of urban microclimate (mean radiation temperature, UTCI, average wind speed, and unacceptable wind speed percentage). All these factors were introduced to assess the urban layout optimization. During optimization, the study divided the field into 5 × 5 grids and randomly selected a point in the grid as the measurement point. The objective was defined as the percentage of acceptable UTCI percentage that counts the UTCI results of points reaching setting range. A genetic algorithm was applied as the optimization choice at two urban levels (block and street levels). Finally, this study provided analysis on acceptable UTCI percentages among factors of urban morphology and microclimate, and it discussed urban design strategies.
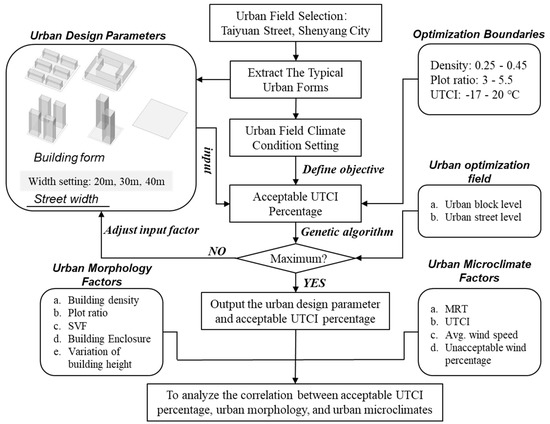
Figure 1.
The framework of this study. SVF—sky view factor; MRT—mean radiant temperature; UTCI—universal thermal comfort index.
2.2. Factors of Urban Morphology
This study selected several factors to describe the morphology of urban block. The first parameter is building density, which is defined as a ratio in a given area where the building’s ground floor area is divided by the site’s total area. This parameter indicates the ratio of built area as well as open space. Secondly, plot ratio is selected, which refers to a building’s total floor area (gross floor area) compared to total area of the site. The term can also refer to limits imposed on such a ratio through zoning. Thirdly, sky view factor (SVF), which is applied, denotes the ratio of sky scope that can be seen with human eyes in the urban space. SVF is a geometric space parameter describing the extent of sky openness. It is also an important index for measuring urban ventilation environment, pollutant diffusion efficiency, and urban heat island effect. Next, the building enclosure degree signifies the closure degree of the urban entity form in different directions, that is, the ability to hinder the passage of wind. Usually, the enclosure degree of a city is related to the study of the city’s ventilation efficiency. To quantify this feature, the study adopted the method of defining the overall enclosure degree of the block (ratio of the perimeter of the facade outside the block to the block’s perimeter). Last, the variation of building heights represents the building height differences, which have an important influence on urban wind environment. Notably, low-altitude buildings reduce wind speed near the ground and produce strong airflow around higher buildings nearby. To describe the building height difference, this study defined an index as showed in Equation (1):
where is the variation of building heights, is the height of each building, μ, the average building height within the block, and N is the number of buildings.
2.3. Factors of Urban Microclimate
In addition to urban morphology, this study also selected four urban microclimate parameters. The mean radiant temperature (MRT) was selected as the uniform temperature of an imaginary enclosure where the radiant heat transfer from the human body is equal to the radiant heat transfer in the actual non-uniform enclosure [32]. Another parameter is UTCI, which is acknowledged as a comprehensive index, that measures the outdoor thermal comfort of humans by considering the effects of such factors as air temperature (Ta, °C), radiation temperature (Tmrt, K), relative humidity (RH, %), and wind speed (m/s) [33]. In cold regions, cities are generally cold in winter and cool in summer. Thus, the standard for wind comfort in Shenyang City was mainly set for winter conditions. It is generally believed that the primary consideration in the wind environment of winter cities is to avoid cold winds, which means limiting the maximum wind speed inside urban blocks. Therefore, this study characterized the urban wind condition by two indicators: unaccepted wind percentage (when urban wind speed in the measure points is higher than the wind speed setting) and average wind speed (the average result of all measure points).
2.4. Urban Form Extraction
This study selected the Taiyuan Block, which has more comprehensive and representative architectural types in Shenyang City to extract the urban form prototype, shown in Figure 2. The buildings were divided into four types based on their height: 16% of 1–3F subsidiary buildings (6–10 m), 40% of 5–7F multistory buildings (21–24 m), 14% of 11–14F small high-rise buildings (30–40 m), and 30% of 30–40F high-rise buildings (90–120 m), and the form of each block is presented in Figure 3. In a real city environment, high-rise buildings are generally round shaped with a podium, thereby shaped by a single-twist L (form 2), but simply, this study extracted only the characteristics of main forms and highlighted the microclimate for speeding up genetic algorithm and reducing the computation time and hardware requirements. For the same reason, the building height variation is limited. Five types of urban forms (two multistory, two high-rise, and one open space) were extracted in Table 1, according to the previous height and shape analysis.
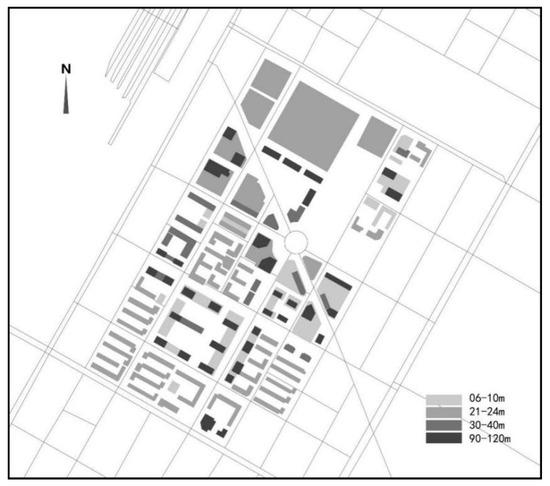
Figure 2.
Layout of the example—Taiyuan urban block.
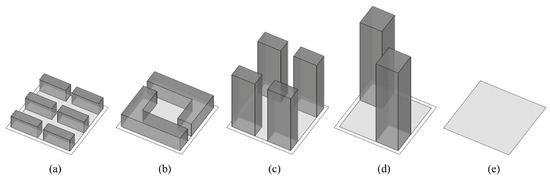
Figure 3.
Basic building form extracted from urban block: (a) strip type building form; (b). courtyard type building form; (c). high-rise strip type building form; (d). high-rise dot type building form; (e). open space.

Table 1.
Building height and form selected from Taiyuan Block.
2.5. Method of Microclimate Optimization
Genetic algorithm was selected for urban layout optimization, which is commonly used to generate high-quality solutions for optimization and search problems, relying on bio-inspired operators such as mutation, crossover, and selection. This study selected the time period between 8:00 a.m. and 8:00 p.m. on a typical cold day provided by Ladybug (version: 0.0.58, A plug-in for Grasshopper, https://www.ladybug.tools/) to simulate optimization. The software simulates the climate condition after urban design generation. The optimization goal was set to find the maximum percentage of thermal comfort area to the total area by presetting measurement points and then counting those points—the UTCI of which can reach the setting range. Those points are set uniformly distributed as a grid of 5 m and 5 m and the height is 10 m. With the Grasshopper (version: 0.9.56.0, company: Robert McNeel & Associates, USA, https://www.grasshopper3d.com/), this study integrated the three modules of urban form generation, microclimate performance simulation, and optimization, as well as used Galapagos genetic algorithm to search for the maximum percentage of acceptable outdoor comfort for the human body. The study’s basic block unit was set to 100 m × 100 m, and the outline of the block was made to retreat inward by 5 m as the scope for placing buildings in the block. The road’s red line spacing of 20 m was taken as the base width. The whole block was comprised of nine small blocks, each of which was given an urban form prototype based on genetic algorithms.
2.6. Model Configuration and Settings
This study optimized the overall microclimate performance at the block and street levels, respectively. The first level optimized the overall acceptable block comfort to simulate and measure all exposed areas (including area inside the block and roads outside the block), as shown in Figure 4. The second level optimized the acceptable street comfort to simulate and measure all street spaces outside the block range. Table 2 shows the parameter settings during optimization and the boundary conditions. To avoid situations where optimization cannot reach convergence or results cannot meet the actual condition (e.g., the plot ratio equals zero), this study set boundary conditions for building density, plot ratio, and comfort (UTCI) level.
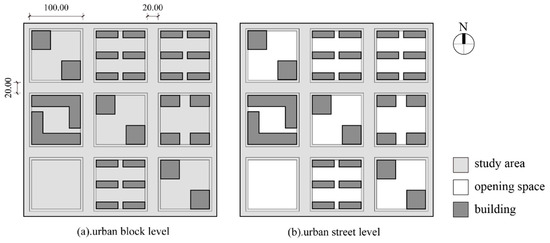
Figure 4.
Test plane range: (a) urban block level and (b) urban street level.
Table 2.
Parameter settings and boundary conditions during optimization.
3. Results
3.1. Results of Microclimate Optimization at the Block Level
In this study, 972 generations were obtained in total, of which 601 generations were valid (the optimization target value was not 0). After removal of invalid data, the change line of the optimization target value was drawn, as shown in Figure 5. The comfort index of the entire simulated area increased from 0 to 180 generations and tended to be stable with the calculation. Notably, the large graph fluctuations are determined by characteristics of the genetic algorithm itself to prevent the continuous selection of similar “high-quality genes,” resulting in “inbreeding.” Occasionally, the algorithm selected genes that differed greatly from high-quality genes to increase diversity and prevent premature convergence.
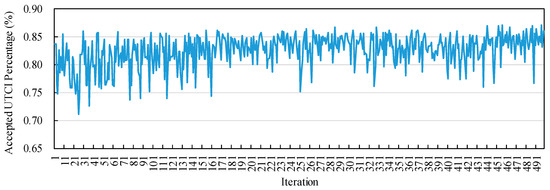
Figure 5.
Change trends in comfort ratios generated by Galapagos genetic algorithm at the block level.
To verify effectiveness of the optimization results, we selected two urban designs for the best and worst acceptable UTCI percentage along with the comfort level. The data in Figure 6 show that, through program optimization, the overall block comfort ratio increased from 73.6% in the poorest case to 87.7%, a growth of about 19%. This demonstrates that optimization can effectively improve the microclimate comfort performance of the whole block combination by searching for the optimal combination of urban morphology.
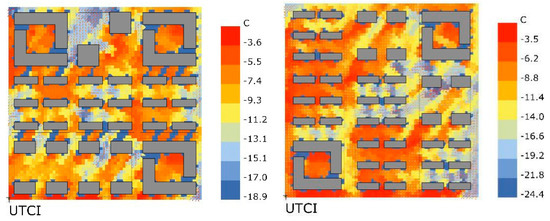
Figure 6.
Example optimization results at block level: the best optimization (left, street width: 20 m, acceptable UTCI percentage: 87.7%) and the worst optimization (right, street width: 40 m, acceptable UTCI percentage: 73.6%).
In addition, results through optimization with higher than 85% acceptable UTCI percentage are used to check the building form characteristics that achieved good results. Figure 7 shows the building form distribution, illustrating the percentage of building forms in each block. The whole urban block was divided into nine individual blocks, indexed with columns A, B, C, and rows 1, 2, 3. According to Figure 7, building forms 1 and 2 were the top two types (A1, A2, B1, B2, C2, and C3 block area); building form 3 occurred at a high frequency (A3, B3, and C1); building form 4 did not appear in any high-frequency location of the block, and building form 5 (open space) did not appear in any generation. Multistory blocks 1 and 2 were chosen more frequently than high-rise blocks 3 and 4 and open space 5. Open space significantly reduces the building density of the whole block. Hence, this form must be strictly controlled in the early stage. Based on micro-climate effects, high-rise forms and large-area open spaces will result in surrounding unfavorable wind environments, especially with high-rise form 4 compared to high-rise form 3. In the distribution locations, the high-frequency form at A1 was building form 2 with the highest building enclosure degree, which blocked cold air to the maximum extent and provided protection for the high-level flank of the B1 location. The high-frequency form at the B1 was building form 1, used to shield the northward incoming wind with its front width, and the gap between buildings on its side was protected to a certain extent by the enclosed block on the east side. The remaining high-rise blocks appeared at a high frequency in the southwest corner because it was an upwind shadow area that minimized the adverse effects of high-speed airflow around the high-rise forms.
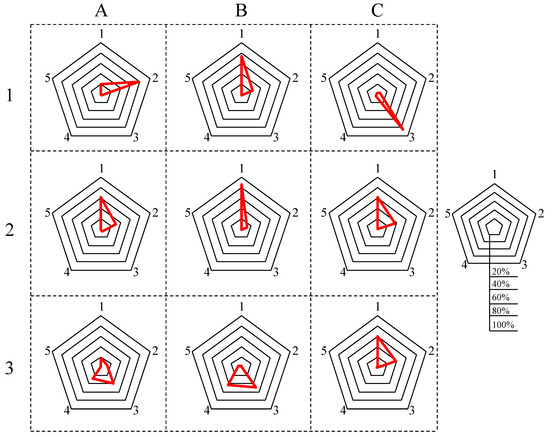
Figure 7.
The percentage of building form distribution with optimization of higher than 85% of acceptable UTCI percentage at block level.
Figure 8, Figure 9 and Figure 10 illustrate the optimization results of building density, plot ratio, building enclosure, variation of building heights, and SVF, as well as their correlation with optimization results (acceptable UTCI percentage). These parameters can respond to changes in building form and street width. However, for optimization of overall comfort, factors such as density, plot ratio, building enclosure, and variation of building heights cannot effectively explain the change trend due to lack of obvious correlation. According to the observation results of SVF, the value basically increased with a decrease in comfort ratio. Hence, there was a small negative correlation between SVF and comfort ratio, so a small SVF could help improve the outdoor comfort ratio of the whole block during winter.
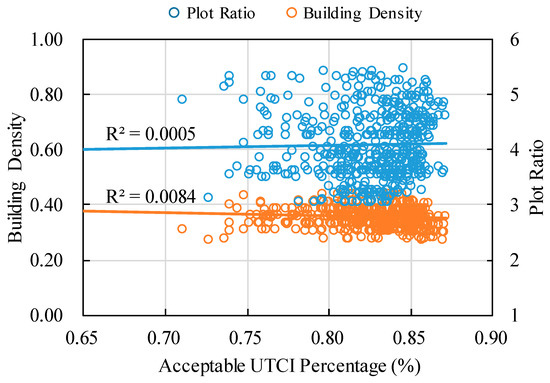
Figure 8.
Correlation results of building density, plot ratio, and acceptable UTCI percentage at block level.
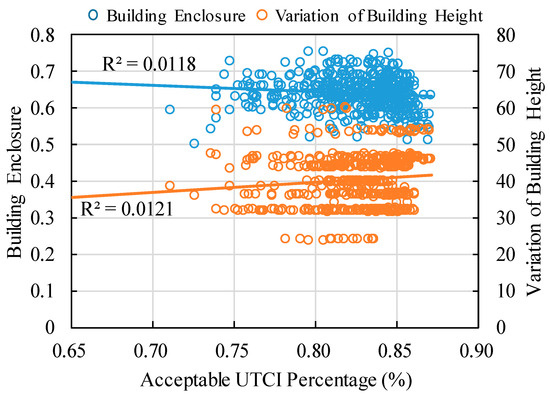
Figure 9.
Correlation results of building enclosure, variation of building heights, and acceptable UTCI percentage at block level.
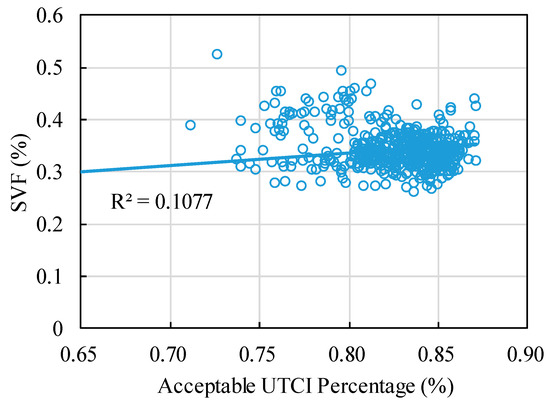
Figure 10.
Correlation results of building density, plot ratio, and acceptable UTCI percentage at block level.
Figure 11 and Figure 12 show the results of microclimate results of optimization. Based on observation results of the four microclimate indices recorded in the study, the MRT did not indicate a significant trend, but the other three predictive variables showed substantial correlation with comfort ratio. There was a negative correlation between the average wind speed and maximum wind speed ratios and the comfort ratio, meaning that the higher the two values, the smaller the comfort ratio. The UTCI was positively correlated with comfort ratio, demonstrating that range of comfort grew with an increase of average comfort.
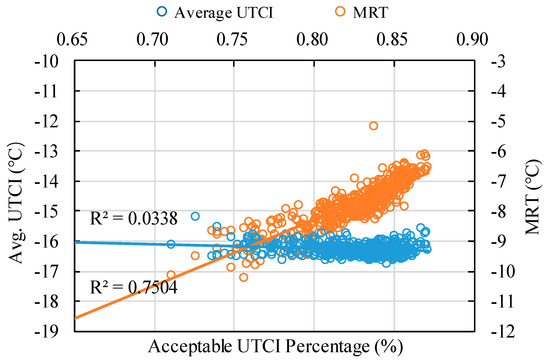
Figure 11.
Correlation results of average UTCI, MRT, and acceptable UTCI percentage at block level.
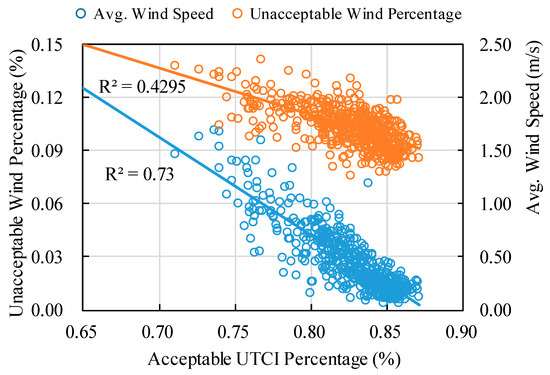
Figure 12.
Correlation results of average unacceptable wind percentage, average wind speed, and acceptable UTCI percentage at block level.
3.2. Optimization of Microclimate Performance at Street Level
In this section of the study, the optimization scope was adjusted to focus on street space instead of comfort inside the block. The calculation was stopped after the Galapagos module showed the numerical value was convergent and stable. The study lasted 31 h to obtain results of 948 generations, of which the data of 452 generations were valid (optimization target value was not 0). After the invalid data were removed, the change line of the optimization target value was drawn, as shown in Figure 13. The comfort index of the whole simulated area illustrated a continuous rising trend from 0 to 130 generations and tended to be stable with the calculation.
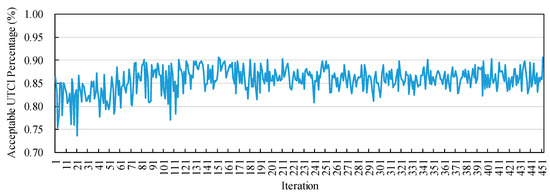
Figure 13.
Change trends in comfort ratios generated by Galapagos genetic algorithm at street level.
Similarly, we selected two generations of morphology for each of the best and the worst, respectively, to reproduce the comfort level at street level, showed in Figure 14. The data indicated that through optimization, the overall comfort ratio of the block increased dramatically from 73.7% in the poorest case to 90.6%, an increase of about 23%. This indicated the optimization can effectively improve the microclimate comfort performance of the whole block combination by searching for the optimal combination of morphology.
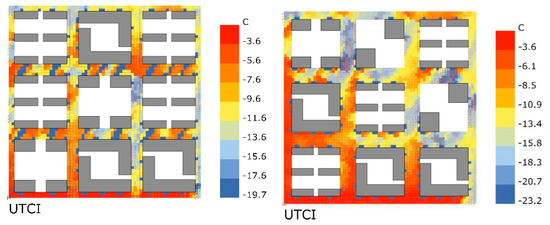
Figure 14.
Example optimization results at street level: the best optimization (left, street width: 20 m, acceptable UTCI percentage: 90.6%) and the worst optimization (right, street width: 30 m, acceptable UTCI percentage: 73.7%).
This study selected the generation results through optimization with higher than 85% of acceptable UTCI percentage to check the building form characteristics at street level, presented in Figure 15. Building form 1 and 2 occupied the top two positions of most locations (A1, A2, B1, B2, B3, C1, C2, and C3 location blocks). Building form 3 only occurred in high frequency at location A3, and building form 4 did not appear in any high-frequency block location. Furthermore, the total number occurring in these generations was significantly less than in the overall optimization, and form 5 did not appear in these generations either. Additionally, multistory building form 1 and 2 were chosen more frequently than high-rise 3 and 4 and open space 5.
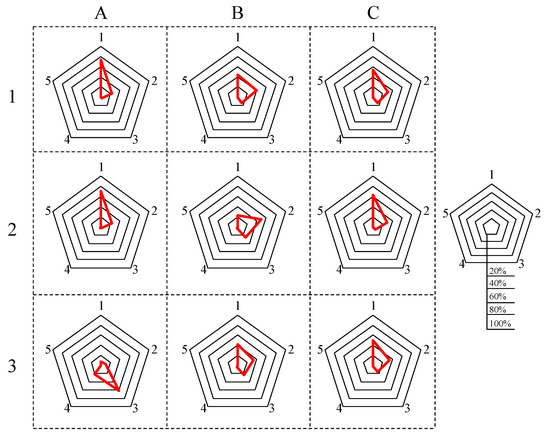
Figure 15.
The percentage of building form distribution with optimization of higher than 85% of acceptable UTCI percentage at street level.
Figure 16, Figure 17 and Figure 18 show the optimization results of building density, plot ratio, building enclosure, variation of building heights, and SVF, respectively. The overall density of the block decreased gradually between 0 and 120 generations and presented a steady state in subsequent generations. In terms of this trend, the high-density urban layout was beneficial to improving the microclimate comfort of outdoor streets during winter in cold areas. However, the change curve of plot ratio was disordered in general. The value of the first half was relatively small, while the value of the second half was relatively large. If reflected in the morphology, results indicate that the relatively high urban density was not conducive to improvement of thermal comfort of outdoor streets during winter, which was not in line with previous study conclusions. The speculated cause of the difference is that the form prototypes in this study contributing to improvement of plot ratio were basically high-rise buildings, and the wind environment around high-rise buildings is generally poor, with an adverse effect on outdoor thermal comfort. The change trend of mean SVF increased steadily with the decrease of comfort ratio, which indicated that the smaller SVF can improve the microclimate comfort of outdoor streets. In other words, the street space with a higher building enclosure degree was beneficial to improvement of the street’s comfort performance in winter.
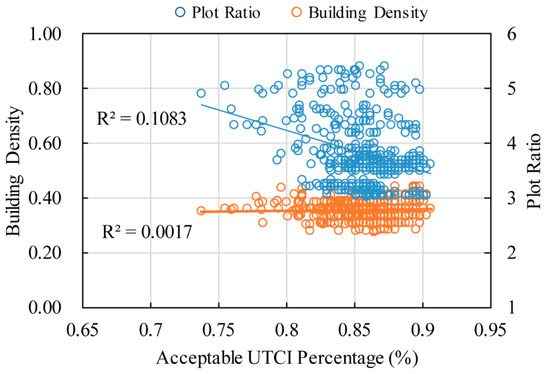
Figure 16.
Correlation results of building density, plot ratio, and acceptable UTCI percentage at street level.
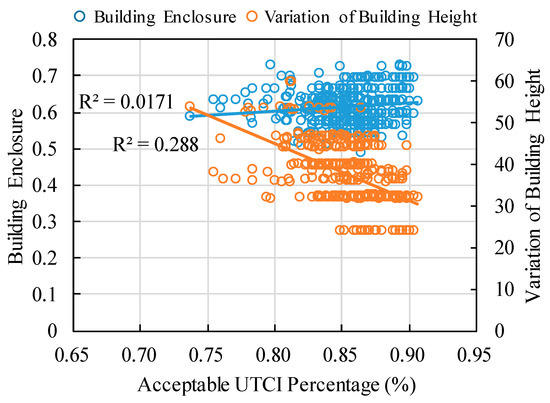
Figure 17.
Correlation results of building enclosure, variation of building heights, and acceptable UTCI percentage at street level.
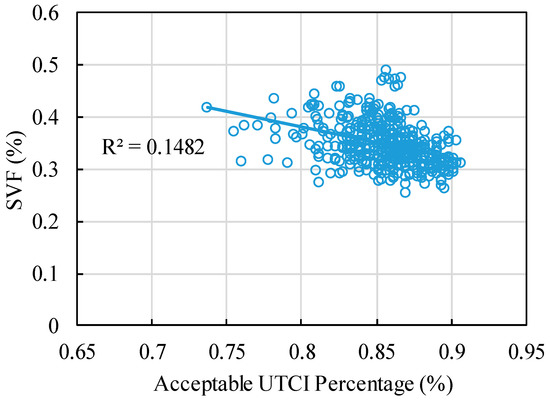
Figure 18.
Correlation results of SVF and acceptable UTCI percentage at street level.
The mean building enclosure degree value of the block showed a significant downward trend and then kept at around 0.6. These results demonstrated that the average building enclosure degree of the block was positively correlated with the street’s outdoor comfort ratio; the surrounding blocks with a higher building enclosure degree had a positive contribution with improvement of the middle street’s outdoor comfort.
Along with the decrease of comfort ratio, the trend of variation of building heights showed a significant step-by-step upward trend. Results illustrated that the smaller variation of building heights was beneficial to improving the microclimate comfort of the street space, while the larger variation of building heights led to poor street microclimate comfort. This finding occurred because the larger variation of building heights indicated an increased building height difference, which guides cold wind into the block’s interior by the higher buildings, thus affecting the street’s comfort. Nonetheless, previous studies suggested that a higher variation of building heights was also beneficial to increasing the reflection ratio of solar radiation, so more radiation enters the city’s interior and improves the microclimate of cold blocks during winter. Regardless, the losses caused by cold air in Shenyang City were clearly more significant than the benefits of radiation.
As for the microclimate indices, the change trend of mean radiation temperature (MRT) was observed (Figure 19), and findings demonstrated that the value of MRT changed irregularly with the decrease of comfort ratio. With the reduction of comfort ratio, the average radiation temperature did not decrease but rather appeared in the poorer generations of optimization, which showed that different from our experience, winter solar radiation in cold-region cities was not a dominant factor in outdoor comfort of the human body.
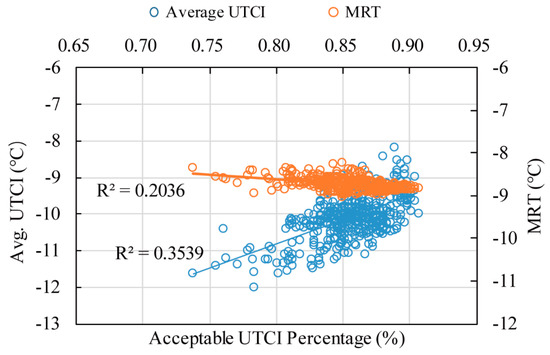
Figure 19.
Correlation results of average UTCI, MRT, and acceptable UTCI percentage at street level.
Notably, the change trend of comfort index basically has a linear positive correlation with the change trend of comfort ratio. However, there is not a large fluctuation in the line chart of comfort index, indicating that when average comfort within the test range is high (that is, the overall comfort is high) this does not mean that most of the field area is comfortable. Instead, high comfort indices in some regions may exist with very low comfort indices in other regions, yet this difference cannot be seen in terms of mean value. These results also confirm the rationality of selecting comfort ratio as the optimization index from the lateral perspective, ensuring that the maximum range of urban areas can meet the comfort standard.
The change trend of average wind speed and unacceptable wind speed percentage was observed in Figure 20, both showing a decline trend with the decrease of comfort ratio. By comparing the mean wind speed and average solar radiation temperature, we determined that wind is more effective than solar radiation in influencing the comfort of outdoor microclimates during winter in cold-region cities. By comparing the variation trend of average and unacceptable wind speed percentage with the comfort ratio change trend in a descending order, we noticed that although the general trend of average wind speed was similar to that of the comfort percentage, the change trend of unacceptable wind percentage was more consistent with that of comfort percentage. In other words, the unacceptable wind percentage change trend (wind speed higher than threshold) had a more direct effect on street comfort percentage.
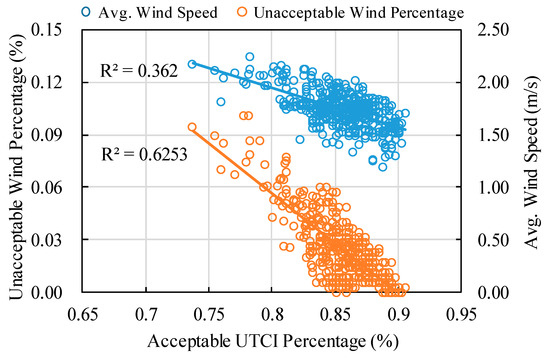
Figure 20.
Correlation results of unacceptable wind percentage, avg. wind speed, and acceptable UTCI percentage at street level.
4. Discussion
4.1. Research Implications
This study proposed to optimize the urban layout design in the aim of achieving better outdoor comfort at both block and street levels. Genetic algorithm was used for optimization and two parameters were applied: building form and street width. To assess the performance, this study made use of four factors: MRT, UTCI, average wind speed, and unacceptable wind percentage. Further, the study investigated the characteristics of urban layout under different optimization results. Final optimization indicated that the acceptable comfort percentage of the whole optimization was 87.7%, and the street space optimization could reach 90.6%. Regarding urban morphology indices, at the block level, the predictive indices did not show obvious correlation with comfort ratio. However, at the street level, except for plot ratio, other predictive indices demonstrated high correlation with comfort ratio. Specifically, the percentages of influence of the variation of building heights, SVF, building enclosure, and density were 47%, 30%, 18%, and 5%, respectively. Therein, SVF and variation of building heights were negatively correlated with comfort ratio, and density and building enclosure were positively correlated with comfort ratio.
The main results of this study were as follows: (1) The layout of high-rise buildings had an important influence on the micro-climate performance of the whole block and the microclimate performance of the street space for small and medium-sized blocks in cold cities; (2) while at block level and street level, their optimal layout tended to choose the smallest possible street width. A certain number of high-rise blocks were in the windward direction, and the remaining high-rise buildings were arranged in the shadow area. The difference was that the whole block optimization included the interior of the small block, so we avoided placing it in the northeast corner, which was vulnerable to the lateral wind and instead placed it in the middle of the north side. There was no such problem in street space optimization, so high-rise blocks were usually placed in the northwest corner of the wind to protect the rear blocks; (3) the results a of high-rise building suggest that the higher the upwind density, the greater the maximum wind speed ratio and the larger the uncomfortable range of the block. When the distribution location of the high-rise blocks was the same, the buildings tended to face the wind direction with their long sides, blocking the invading airflow to the maximum extent; (4) as for open space, it is inappropriate to arrange large area open spaces in cold-area cities. If necessary, open spaces should be placed in the middle of blocks surrounded by buildings, and the upwind location should avoid high-rise buildings to prevent high-rise-accelerated airflow from affecting the square’s wind environment.
Not only can this study support urban layout design, especially providing strategies for cold-region cities, it can also provide significant insights to support sustainable development for cities where microclimate and sustainability highly correspond. Further, this study can help analyze the urban block energy use since the microclimate in block area can influence the heat gains from outside for buildings. By optimizing urban layout design, it can further benefit the urban block energy study, as well as benefit sustainability of a city.
4.2. Research Inspirations and Limitations
The optimization results demonstrated a high similarity between overall comfort optimization at both block level and street level. However, the complexity and difficulty of the optimization of block level was higher than that of street level. Notably, in an actual urban environment, the building form would be more complex, which brings some difficulties to modeling restoration and simulation optimization. Considering that street space is the main daily travel and public activity space for people, this study has more practical significance in optimizing outdoor comfort at the street level. However, it brings one limitation that this study did not take the real urban block as the optimization basis and also ignored the details of real urban block with its complexity and high computation requirement, which can also be an inspiration for future work.
The second limitation is that this study considered only two parameters—building form and street width. However, other factors related to urban layout can impact on the microclimate, such as the solar radiation differences caused by block direction, as well as the building height variation between north and south. Although this study can achieve good optimization when comparing the best and the worst urban layouts, such limitations should be overcome as an inspiration for considering additional factors of urban morphology to achieve better urban layout design and a more optimal microclimate.
Third, the time range in this study was only from 8:00 a.m. to 8:00 p.m., which can represent the duration time for outdoor activity; however, future work can take more optimization time into consideration, such as 24 h, summer day, or even the whole year.
Finally, as suggested, cities in cold regions should avoid the placement of large-scale unprotected open spaces; however, open spaces are a necessity for outdoor activity. Therefore, cold-area cities should consider locating open spaces under building enclosure protection around the block or dividing open spaces into small pieces arranged in the interior or between the enclosed buildings.
5. Conclusions
This study proposed investigating urban layout optimization method and validated the results in an urban area in Shenyang City, located in a cold region. Instead of using the regular cube previously utilized as the carrier of morphological research, this study extracted the urban form prototype within the selected area. Urban block building type and street width were selected as the optimization input indices. Through establishment of an evaluation system suitable for urban thermal and wind environment in cold regions, urban microclimate performance can be converted into UTCI as an outdoor comfort index. Microclimatological simulation is no longer just an evaluation tool but is transforming into part of a performance-driven design process. Morphological and microclimate indices were included as building density, plot ratio, SVF, building enclosure, and variation of building heights, as well as mean radiation temperature, UTCI, average wind speed, and unacceptable wind speed ratio. All these indices were tested at the urban and street levels.
Instead of using UTCI, this study applied the percentage of acceptable UTCI in a selected area as optimization performance index to cover the whole block. As a result, optimization can achieve 87.7% of acceptable UTCI in the urban block level and 90.3% in the urban street level. In optimization results as high than 85% of acceptable UTCI range, multistory blocks were more suitable than high-rise blocks and open space. Multistory blocks with high building enclosure are usually located on the north side, while high-rise blocks are on south sides. Open space is not a good choice. Future work should incorporate more urban design indices into the urban block optimization to validate the performance-driven urban layout optimization. Further, the optimization framework for urban design with achieving max acceptable UTCI can be easily extended in other cities of different climate zones.
Author Contributions
Conceptualization, methodology, formal analysis and writing—original draft: X.X., Y.L.; Simulation, data analysis, and visualization: X.X., Y.L., W.W., K.L., N.X.; Writing—discussion of the original draft: X.X., G.Y., K.L.; Writing—revision & editing: X.X., W.W., and N.X.; Supervision: X.X., G.Y.
Acknowledgments
The work described in this study was sponsored by the projects of the National Natural Science Foundation of China (NSFC#51978144, NSFC#51678127), the National Scientific and Technological Support during the 12th Five-Year Plan Period (No.: 2013BAJ10B13), and China Scholarship Council (CSC#201706095035). Any opinions, findings, conclusions, or recommendations expressed in this study are those of the authors and do not necessarily reflect the views of the National Scientific and Technological Support committee and NSFC.
Conflicts of Interest
The authors declare no conflict of interest.
References
- Feldmeyer, D.; Wilden, D.; Kind, C.; Kaiser, T.; Goldschmidt, R.; Diller, C.; Birkmann, J. Indicators for Monitoring Urban Climate Change Resilience and Adaptation. Sustainability 2019, 11, 2931. [Google Scholar] [CrossRef]
- Zhang, C.; He, M.; Zhang, Y. Urban Sustainable Development Based on the Framework of Sponge City: 71 Case Studies in China. Sustainability 2019, 11, 1544. [Google Scholar] [CrossRef]
- De Lisboa, U. Evaluating the Cooling Potential of Urban Green Spaces to Tackle Urban Climate Change in Lisbon. Sustainability 2019, 11, 2480. [Google Scholar] [CrossRef]
- He, C.; Zhou, L.; Ma, W.; Wang, Y. Spatial Assessment of Urban Climate Change Vulnerability during Di ff erent Urbanization Phases. Sustainability 2019, 11, 2406. [Google Scholar] [CrossRef]
- Fichera, A.; Inturri, G.; La Greca, P.; Palermo, V. A model for mapping the energy consumption of buildings, transport and outdoor lighting of neighbourhoods. Cities 2016, 55, 49–60. [Google Scholar] [CrossRef]
- Chi, D.A.; Moreno, D.; Esquivias, P.M.; Navarro, J. Optimization method for perforated solar screen design to improve daylighting using orthogonal arrays and climate-based daylight modelling. J. Build. Perform. Simul. 2017, 10, 144–160. [Google Scholar] [CrossRef]
- Oh, M.; Kim, Y. Identifying urban geometric types as energy performance patterns. Energy Sustain. Dev. 2019, 48, 115–129. [Google Scholar] [CrossRef]
- Sarralde, J.J.; Quinn, D.J.; Wiesmann, D.; Steemers, K. Solar energy and urban morphology: Scenarios for increasing the renewable energy potential of neighbourhoods in London. Renew. Energy 2015, 75, 10–17. [Google Scholar] [CrossRef]
- Jusuf, S.K.; Tan, C.L.; Ignatius, M.; Wong, N.H.; Tan, E.; Tong, S. Impact of urban morphology on microclimate and thermal comfort in northern China. Sol. Energy 2017, 155, 212–223. [Google Scholar] [CrossRef]
- Lau, G.E.; Ngan, K. Analysing urban ventilation in building arrays with the age spectrum and mean age of pollutants. Build. Environ. 2018, 131, 288–305. [Google Scholar] [CrossRef]
- Luo, Y.; He, J.; Ni, Y. Analysis of urban ventilation potential using rule-based modeling. Comput. Environ. Urban Syst. 2017, 66, 13–22. [Google Scholar] [CrossRef]
- Wang, Y.; Berardi, U.; Akbari, H. Comparing the effects of urban heat island mitigation strategies for Toronto, Canada. Energy Build. 2016, 114, 2–19. [Google Scholar] [CrossRef]
- Wen, C.Y.; Juan, Y.H.; Yang, A.S. Enhancement of city breathability with half open spaces in ideal urban street canyons. Build. Environ. 2017, 112, 322–336. [Google Scholar] [CrossRef]
- Debbage, N.; Shepherd, J.M. The urban heat island effect and city contiguity. Comput. Environ. Urban Syst. 2015, 54, 181–194. [Google Scholar] [CrossRef]
- Chen, L.; Ng, E.; An, X.; Ren, C.; Lee, M.; Wang, U.; He, Z. Sky view factor analysis of street canyons and its implications for daytime intra-urban air temperature differentials in high-rise, high-density urban areas of Hong Kong: A GIS-based simulation approach. Int. J. Climatol. 2012, 32, 121–136. [Google Scholar] [CrossRef]
- Ren, C.; Ng, E.Y.; Katzschner, L. Urban climatic map studies: a review. Int. J. Climatol. 2011, 31, 2213–2233. [Google Scholar] [CrossRef]
- Adelia, A.S.; Yuan, C.; Liu, L.; Shan, R.Q. Effects of urban morphology on anthropogenic heat dispersion in tropical high-density residential areas. Energy Build. 2019, 186, 368–383. [Google Scholar] [CrossRef]
- He, B.J.; Ding, L.; Prasad, D. Enhancing urban ventilation performance through the development of precinct ventilation zones: A case study based on the Greater Sydney, Australia. Sustain. Cities Soc. 2019, 47, 101472. [Google Scholar] [CrossRef]
- Johansson, E.; Emmanuel, R. The influence of urban design on outdoor thermal comfort in the hot, humid city of Colombo, Sri Lanka. Int. J. Biometeorol. 2006, 51, 119–133. [Google Scholar] [CrossRef]
- Ali-Toudert, F.; Mayer, H. Effects of asymmetry, galleries, overhanging façades and vegetation on thermal comfort in urban street canyons. Sol. Energy 2007, 81, 742–754. [Google Scholar] [CrossRef]
- Erell, E.; Pearlmutter, D.; Williamson, T. Urban Microclimate: Designing the Spaces Between Buildings; Routledge: Manchester, UK, 2010. [Google Scholar]
- Tsitoura, M.; Michailidou, M.; Tsoutsos, T. A bioclimatic outdoor design tool in urban open space design. Energy Build. 2017, 153, 368–381. [Google Scholar] [CrossRef]
- Wong, N.; Song, J.; Istiadji, A.D. A study of the effectiveness of mechanical ventilation systems of a hawker center in Singapore using CFD simulations. Build. Environ. 2006, 41, 726–733. [Google Scholar] [CrossRef]
- Yang, W.; Wong, N.H.; Li, C.-Q. Effect of Street Design on Outdoor Thermal Comfort in an Urban Street in Singapore. J. Urban Plan. Dev. 2016, 142, 05015003. [Google Scholar] [CrossRef]
- Bajšanski, I.V.; Milošević, D.D.; Savić, S.M. Evaluation and improvement of outdoor thermal comfort in urban areas on extreme temperature days: Applications of automatic algorithms. Build. Environ. 2015, 94, 632–643. [Google Scholar] [CrossRef]
- Taleb, H.; Musleh, M.A. Applying urban parametric design optimisation processes to a hot climate: Case study of the UAE. Sustain. Cities Soc. 2015, 14, 236–253. [Google Scholar] [CrossRef]
- Lindholm, G.; Meerow, S.; Newell, J.P.; Abunnasr, Y.F.; Nakata-Osaki, C.M.; Cristina, L.; Souza, L.; Souto, D. THIS—Tool for Heat Island Simulation: A GIS extension model to calculate urban heat island intensity based on urban geometry. Landsc. Urban Plan. 2017, 159, 62–75. [Google Scholar] [CrossRef]
- Perini, K.; Chokhachian, A.; Dong, S.; Auer, T. Modeling and simulating urban outdoor comfort: Coupling ENVI-Met and TRNSYS by grasshopper. Energy Build. 2017, 152, 373–384. [Google Scholar] [CrossRef]
- Xu, X.; Luo, F.; Wang, W.; Hong, T.; Fu, X.; Xu, X.; Luo, F.; Wang, W.; Hong, T.; Fu, X. Performance-Based Evaluation of Courtyard Design in China’s Cold-Winter Hot-Summer Climate Regions. Sustainability 2018, 10, 3950. [Google Scholar] [CrossRef]
- Ng, E. Policies and technical guidelines for urban planning of high-density cities—Air ventilation assessment (AVA) of Hong Kong. Build. Environ. 2009, 44, 1478–1488. [Google Scholar] [CrossRef]
- Mayer, H.; Holst, J.; Dostal, P.; Imbery, F.; Schindler, D. Human thermal comfort in summer within an urban street canyon in Central Europe. Meteorol. Z. 2008, 17, 241–250. [Google Scholar] [CrossRef]
- ISO 7726. Ergonomics of the Thermal Environment—Instruments for Measuring Physical Quantities. 1998. Available online: https://standards.globalspec.com/std/124246/ISO 7726 (accessed on 13 May 2019).
- Błazejczyk, K.; Jendritzky, G.; Bröde, P.; Fiala, D.; Havenith, G.; Epstein, Y.; Psikuta, A.; Kampmann, B. An Introduction to the Universal Thermal Climate Index (UTCI). Geogr. Pol. 2013, 86, 5–10. [Google Scholar] [CrossRef]
© 2019 by the authors. Licensee MDPI, Basel, Switzerland. This article is an open access article distributed under the terms and conditions of the Creative Commons Attribution (CC BY) license (http://creativecommons.org/licenses/by/4.0/).