Abstract
Accurate energy consumption modelling is critical for the improvement of energy efficiency in machining. Existing energy models of machining processes mainly focus on turning or milling, and there are few energy models for drilling. However, since drilling is often applied to roughing and semi-finishing, and the cutting parameters are large, the energy consumption is huge, and it is urgent to study the consumption of energy during the drilling process. In this paper, an energy consumption model for drilling processes was proposed. Idle power, cutting power, and auxiliary power were included in the proposed energy consumption model, using the cutting force to obtain the cutting power during drilling. Further, the relationship between cutting power and auxiliary power was analyzed. Cutting experiments were then carried out which confirmed the correctness of the proposed model. In addition, compared with several existing energy consumption models, the proposed model had better accuracy and applicability. It is expected that the proposed energy consumption model will have applications for the minimization of energy consumption and improvement of energy efficiency but not limited to only drilling energy consumption prediction.
1. Introduction
In recent years, with the intense discussion of a low-carbon economy [1] and carbon trading [2], energy issues have once again caused widespread concern [3]. As energy prices continue to rise, the manufacturing industry, which is the largest energy consumer industry, is paying more and more attention to energy consumption in the manufacturing process, and reducing energy consumption has become a goal pursued by the manufacturing industry. In particular, drilling is widely used in the aerospace manufacturing process [4]. Studies have shown that, during the manufacture of a medium-sized aircraft, more than 6500 holes need to be machined, most of which are drilled [5]. At the same time, drilling is the main processing technology for the roughing and semi-finishing of holes; however, the processing efficiency is relatively low which leads to huge levels of energy consumption during processing [6]. Therefore, finding a solution to the problem of reducing energy consumption and increasing energy utilization during drilling processes is worth studying.
To obtain a high utilization of energy in manufacturing processes, the first step is to understand and characterize how energy is consumed in manufacturing [7]. Recently, a number of energy consumption models have been proposed, particularly for machining. These existing models can be broadly classified into two categories: material removal rate (MRR)-based and detailed parameter (DPT)-based models [8].
The MRR-based models predict total energy consumption based on the assumption that the total energy assumption and MRR are linearly related. Gutowski et al. [9] pioneered the idea that machining energy consumption is related to the MRR. Kara and Li [10] proposed a specific energy consumption model, which proved to be of high accuracy for both lathes and milling machines. Li et al. [11] improved the MMR-based energy consumption model by considering the effects of no-load conditions and spindle speed on energy consumption. Costa et al. [12] studied how to obtain the minimum roughness and maximum material removal rate. Zhong et al. [13] proposed a decision rule for minimum energy consumption during turning based on the material removal rate.
Differently from MRR-based models, DPT-based models calculate the total energy consumption by using different parameters which are obtained based on different theories. Many studies have pointed out that the cutting parameters are the major factors affecting energy consumption. Guo et al. [14] proposed an approach which combines energy consumption with surface roughness and applied it to finish turning; Xu et al. [15] proposed a tool path planning algorithm for five-axis milling with the goal of minimizing energy consumption. However, the accuracy of their model was found to be less than satisfactory in some cases. Some energy models are based on cutting forces including the work of Draganescu et al. [16] and Rodrigues and Coelho [17] who noted that the transformation of the cutting force caused by the tool edge geometry directly affects specific energy consumption (SEC). Research by Li and Kara [18] suggests that energy consumption models based solely on cutting forces only reflect the minimal energy consumption and not the maximum energy demand. To further improve the above energy models, Liu et al. [19] proposed a method based on the cutting force to establish an energy consumption model for the milling. Shi et al. [20] improved the energy consumption model of Liu [19] by introducing no-load power to establish a milling energy consumption model and a milling energy consumption model considering tool wear [21].
As already alluded to, although many of these existing energy models are comprehensive and detailed, most of the above energy models, whether MRR- or DPT-based, are built for turning or milling. There are very few studies on energy consumption for drilling. However, drilling is widely used in aerospace manufacturing processes [22]. Whether these existing models can accurately describe the energy consumption of the drilling process is yet to be verified. Besides, as the name suggests, in an MRR-based model, the only considered variable is MRR. However, the same MRR can be combined from many different processing parameters; cutting experiments have shown that energy consumption is not always the same at the same MRR, as many other affecting factors need to be considered. In addition, DPT-based models, such as Liu et al. [19], only consider the relationship between cutting power and total power; the coefficients in their model are purely obtained by mathematical regression thus lacking a clear theoretical basis.
In this paper, an energy consumption model for drilling processes was proposed. Idle power, cutting power, and auxiliary power were included in the proposed energy consumption model. The performance of the machine determines the idle power which can be calculated from the spindle speed. The cutting power was calculated from the cutting forces on the cutting edge. The auxiliary power was calculated from the cutting power by establishing its relationship to the cutting power. The model was validated in experiments and achieved high prediction accuracy.
2. Energy Consumption in Drilling Processes
2.1. Energy Composition in a Drilling Process
A complete machining process generally consists of three operational states: the start-up state, the idle state, and the machining state. Figure 1 shows a general power consumption profile for a drilling process; it is composed of three drilling operations with constant drilling parameters.
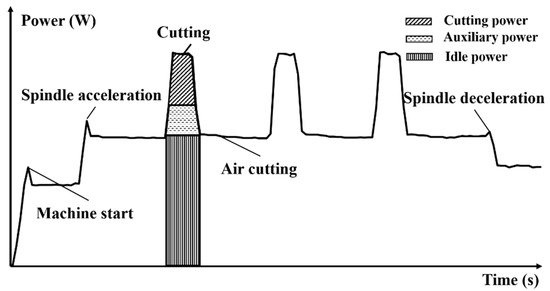
Figure 1.
The power profile in a drilling process.
A machine tool generally comprises the drive tables, the motors for the spindle and tables, the mechanical transmissions, and other mechanical components. Although, during machining, the energy consumption of each component is complex, the total energy consumption of the machine tool can be roughly divided into the idle power (Pidle), the cutting power (Pcutting), and the auxiliary power (Pauxiliary), which can be expressed as:
2.2. The Idle Power
According to Li et al. [11] and Ma et al. [23], the idle power is defined as energy consumption that only includes the rotation of the spindle, so the idle power (Pidle) can be expressed as:
where is the spindle speed.
2.3. The Cutting Power
In this paper, cutting force was adopted to calculate cutting power as shown in Figure 2. The cutting forces in drilling can be modelled as [24,25]:
where , , and (N/mm2) and , , and (N/mm) are the specific cutting and edge force coefficients; (mm2) is an area of a chip differential lip removed, and it can be calculated by ; (mm) is the chip thickness, and it can be calculated by ; is the chip width, and it can be calculated by ; is the taper angle; and z (mm) is the axial position.
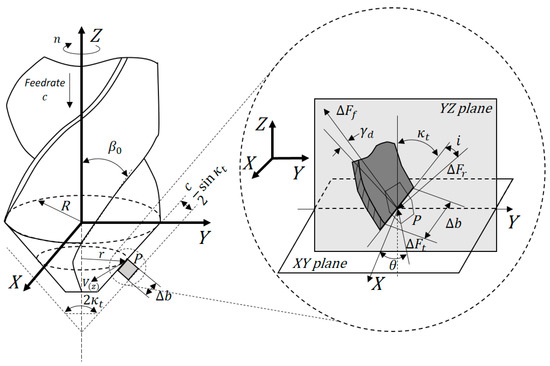
Figure 2.
Mechanics model of a twist drill.
The components of the elemental cutting force components (, , ) can be calculated in the , , directions (see Figure 2):
where is the angle between the cutting velocity and the x-axis; is the angle among the two velocity components (a component perpendicular to the cutting edge and a component of the cutting speed in the y-axis); is the angle between the cutting velocity and normal to the cutting edge.
Energy consumption during the drilling process is caused by the relative motion of the tool and workpiece material. Rotary drive and feed drive are the main modes of this relative movement. Modelling two different modes of motion can be used to calculate the cutting energy consumption of the drill during machining.
In the rotary motion, since and are perpendicular to the cutting speed, they do not contribute to the generation of rotational motion power, and the differential powers consumed at each tiny finite element cutting edge in tangential, feed, and radial directions can be established as:
where (m/s) is the cutting speed.
Therefore, due to the rotational motion, the total power consumed in the tiny finite element cutting edge can be expressed as:
In the feed motion, is perpendicular to the feed direction, which has no effect on feed power, and the differential powers are:
where f (mm/min) is the feed rate.
The total power in the tiny finite element cutting edge caused by the feed motion can be expressed as:
Substituting Equation (4) into Equation (8), Equation (8) can be expressed as:
Finally, the instantaneous cutting power consumption can be calculated by:
2.4. The Auxiliary Power
The auxiliary power is attributed to the cutting load. Hu et al. [26,27] proposed that auxiliary power is a linear or quadratic function of the cutting power as follows.
where and are coefficients that can be obtained from the physical cutting experiment. The coefficient of Equation (11a) is easier to obtain, but Equation (11b) is more accurate. Therefore, the load loss coefficient is determined using Equations (11a) or (11b) based on other parameters (such as machine performance, machining process, etc.).
2.5. The Power Consumption Model
In the stable drilling state, the total power consumption of the machine tool can be expressed as:
For Equation (12), it is generally agreed that Pidle only depends on the specific machine tool and Pcutting depends on the workpiece material and processing parameters such as cutting speed, feed rate, and coolant conditions. Moreover, Ptotal, Pidle, and Pcutting can all be accurately measured, respectively, by means of an electrical power logger and cutting force sensors and the calculation function (f(Pcutting)) of Pauxiliary can be obtained experimentally. In the next two sections, we report a physical cutting experiment that demonstrates how to establish the function f(Pcutting).
3. Energy Consumption Model Calibration Experiments
In the following experiments, two sets of drilling operations were carried out. One set of experiments was used to calibrate the coefficients in the model, and another set of experiments was used to validate the proposed model.
3.1. Experiment Details
The experiments were carried out on a 3 axis machining center (YH850Z). The workpiece material was GH4169. The tool was a twist drill, the diameter was 10 mm, and the helix angle was 30, wet cutting.
Table 1 provides the cutting parameters used in Experiment-I. A total of 16 combinations were selected. In Experiment-II, some different cutting parameters from Experiment-I were chosen to verify the accuracy of the model. As a result, four sets of processing parameters were selected for experimental verification.

Table 1.
Cutting parameters for Experiment I.
The setup of the experiments is shown in Figure 3. All data on forces were collected using a Kistler-9123C rotary dynamometer, and all power data were collected using the PW3360 power logger during the experiments.
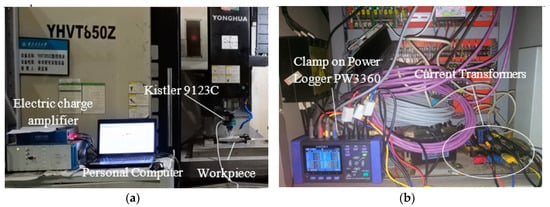
Figure 3.
The experimental setup: (a) force and (b) power signal processing and collection.
3.2. Energy Consumption Model Calibration
The Ptotal was equal to Pidle when the machine was in the non-cutting state. In the non-cutting state, the PW3360 was used to collect the total power (Ptotal) at different spindle speeds, and the Pidle at different spindle speeds was obtained. Then, the relationship between Pidle and the spindle speed could be established. Figure 4 shows the experimental data and the numerically fitted curve which clearly resembles a quadratic relationship.
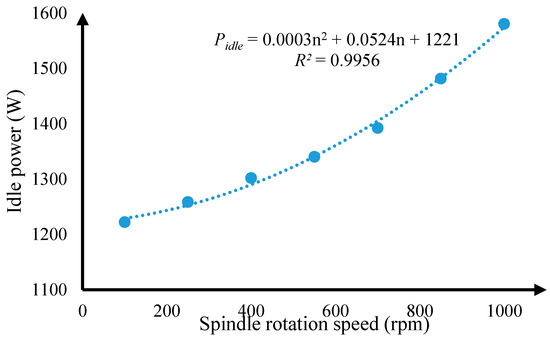
Figure 4.
The idle power at different spindle speed.
Explicitly, the experimental data in Figure 4 shows that the idle power (Pidle) can be expressed as:
Reliable cutting force coefficients must be obtained before Pcutting is calculated according to Equation (3a–c) which can be calculated using the proposed force experiments [28]. According to Equation (10), it is only necessary to calibrate the cutting force coefficients in the tangential and the z directions. According to the experimental data, the cutting force coefficient can be obtained as:
K = [Ktc Kte Kzc Kze]T = [4196.8 202.6 5395.7 339.2]T
Figure 5 shows the comparison of the predicted cutting force and experimental cutting force, which were calculated using the obtained cutting force coefficient under several different processing parameters. The results show that the error between the predicted cutting force and experimental cutting force was acceptable, and that the obtained cutting force coefficients were reliable.
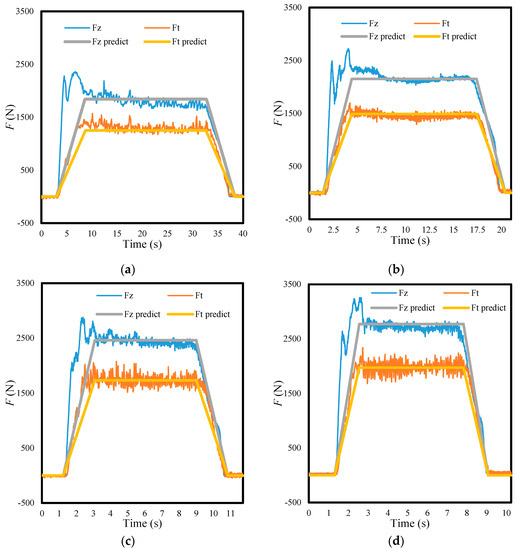
Figure 5.
Comparison of predicted and experimental values of cutting force under different cutting conditions: (a) n = 400 rpm, f = 32 mm/min; (b) n = 550 rpm, f = 60 mm/min; (c) n = 700 rpm, f = 98mm/min; (d) n = 850 rpm, f = 144 mm/min.
Table 2 lists the data from Experiment-I. The Ptotal is the measured data obtained by the power recorder. The Pidle was calculated by Equation (13). The Pcutting was calculated by the Equation (10). Based on these results, the auxiliary power, Pauxiliary, can then be calculated from Equation (11a) as shown in Figure 6.
Table 2.
The measured total power (Ptotal) and the calculated cutting power (Pcutting) in Experiment-I.
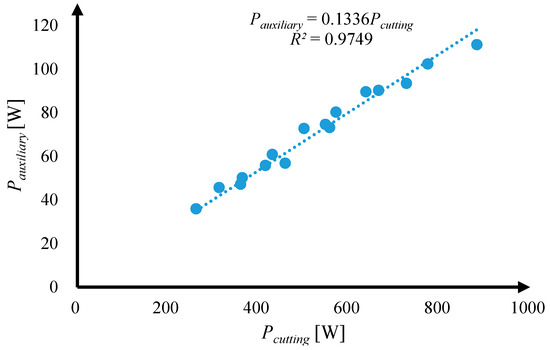
Figure 6.
The auxiliary power at different cutting powers.
It can be seen from the experimental data that under the current processing parameters, the linear relationship used to describe the relationship between Pauxiliary and Pcutting had reached high accuracy, so that in order to simplify the calculation process, the equation for calculating Pauxiliary can be obtained by Equation (11a):
Finally, the Ptotal was expressed as the equation for Pidle and Pcutting, where both Pidle and Pcutting can be calculated by Equations (13) and (10), the Ptotal can be expressed as:
In summary, in order to more clearly show the calculation process of the energy consumption model, the energy consumption calculation process of the drilling process can be described by the following flowchart (Figure 7):
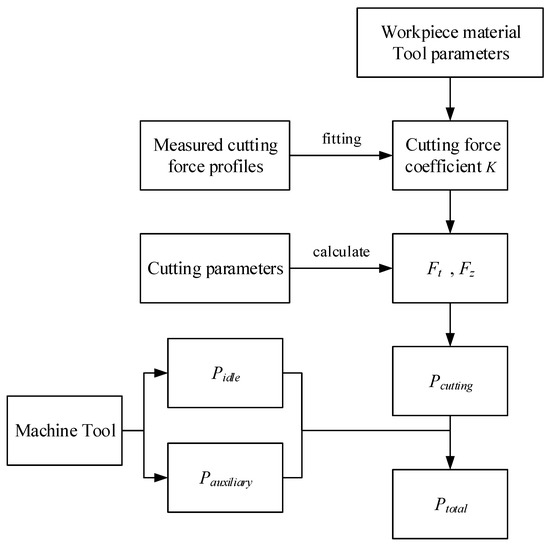
Figure 7.
Flowchart of the drilling process energy consumption calculation.
In the next section, the experimental data under different processing parameters are compared and analyzed between the proposed model and the existing model.
4. Results and Discussions
In this section, with the data from Experiment-II, the proposed power model was first verified. Subsequently, the results from Experiment-I and II were used to compare the proposed model with some existing models.
4.1. Model Validation
The setup of Experiment-II was used to verify the proposed model. The four sets of processing parameters, which were different from Experiment-I, are shown in Table 3, together with the corresponding measured actual power P, and the Pidle, Pcutting, predicting power (P *), and accuracy were calculated under each setting.
Table 3.
Cutting conditions and power dada in Experiment-II.
Among all the settings, the MRR was kept unchanged while the spindle speed was varied in four levels. It can be seen from the experimental data (Table 3) that, when the MRR was constant, the P varied with the different processing parameters. Therefore, the simple model for predicting power with the material removal rate was not accurate enough. On the other hand, under the same feed rate, the Pidle changed with the spindle speed, so it was also not accurate enough to use Pcutting to predict the power. It can be seen that the predicting power (P *) calculated by the prediction model was nearly 99% accurate compared with the four sets of experimental data, and it is proved that the model is reliable for predicting the energy consumption of drilling.
4.2. Model Comparison
In order to prove the validity and accuracy of the new model, a comparative study was used to compare it with the three existing models (the form of each model is listed in Table 4): Model-1 [10], Model-2 [11], and Model-3 [19]—all of which were established based on the same machine tool, and with the same data from our experiments. First of all, the coefficients of the three models were calculated by the data from Experiment-I which are shown in Table 4:
Table 4.
Three comparison models.
Then, the data collected from Experiment I and Experiment II were used to compare the proposed power model, P *, with the three types of models. Table 5 shows the comparison results based on the data of Experiment-I, where P(W) is the measured total power.
Table 5.
Comparing different power models with the data from Experiment-I.
As can be seen in Table 5, on average, the proposed model prediction error was 1.13% which is the smallest error in the comparison experiments. Model 1 and Model 2 (based on the MRR) had prediction errors of 3.09% and 2.39%, respectively, and their prediction errors were greater than the 2.09% of Model 3 (based on cutting force). This indicates that the MRR was not sufficient to fully characterize the total energy consumption compared to the cutting force. Although Model 3 also gave acceptable predictions, the accuracy was not as good as the proposed model which may be due to the large influence of idle power on total power, while Model 3 ignores this.
In addition, Figure 8 shows the specific prediction error of each model under 16 sets of experimental parameters. The maximum values of the fluctuation range of Models 1, 2, and 3 were approximately 8%, 5%, and 5%, respectively. The maximum value of the proposed model fluctuation range was about 2%. It can be seen that the fluctuation of the prediction error of the other three models was significantly higher than that of the proposed model which clearly shows the stability of the proposed model prediction.
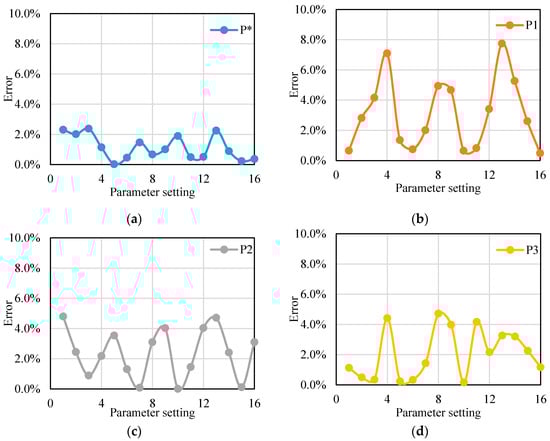
Figure 8.
The prediction errors of the four models (Experiment-I): (a) proposed model; (b) model 1; (c) model 2; (d) model 3.
Similarly, Table 6 lists the predicted powers of our model P * and the three benchmarks P1, P2, and P3 against the actual power consumption P. From the table, it can be found that the proposed model had the smallest prediction error (1.02%), and the fluctuation of error was smaller as well (see Figure 9). For Model-1, the errors of the No. 1 and 4 experiments were relatively large as compared with that of the No. 2 and 3. For the second benchmark, since Model-2 considered the influence of spindle speed on energy consumption on the basis of Model-1, the prediction error (1.73%) was much smaller than that of Model-1, but the error was also larger than ours. For Model-3, the prediction accuracy was equivalent to that of Model-2. Model-3 used the Pcutting to predict energy consumption, but since the Pidle at different spindle speeds was not considered, there was still no higher prediction accuracy (1.77%) than ours.
Table 6.
Comparing the different models with the data from Experiment-II.
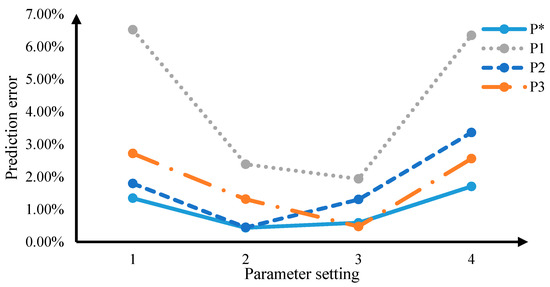
Figure 9.
The prediction errors of the four models (Experiment-II).
5. Conclusions
In this paper, an energy consumption model for drilling processes was proposed. It is based on an equation consisting of the idle power, calculated based on the spindle speed, the cutting power, calculated from the cutting force, and the auxiliary power, calculated based on the cutting power. This proposed model was implemented and verified during the drilling process on a three-axis vertical machining center. Comparative experiments showed that the proposed model had higher accuracy than the existing MRR-based model, the model based on the MRR and spindle speed, and the model based only on cutting force.
Although the new power model from this work is only specific to the particular machine tool and the specific workpiece material on which the experiments were carried out, we believe they are applicable to the majority of machine tools and workpiece materials, albeit with different coefficients in the model.
On the potential future study of the subject, the effect of tool wear on energy consumption should be considered, especially in the drilling of difficult-to-machine materials wherein the roughing stage often has radical cutting parameters. This calls for the consideration of the impact of tool wear on energy consumption. Secondly, the proposed model only considers the energy consumption of simple holes, which may not be applicable for deep hole drilling, and further research on the energy consumption of deep hole drilling should be carried out.
Author Contributions
Conceptualization, Q.W., D.Z. and B.C.; Methodology, Q.W., Y.Z. and B.W.; Statistical analysis, Q.W. and Y.Z.; Formal analysis and investigation, Q.W. and B.C.; Writing—original draft preparation, Q.W.; Writing—review and editing, B.C. and Y.Z.; Supervision, B.W.; Project administration and funding acquisition, B.C., Y.Z. and B.W.
Funding
This research was funded by [the Major National Science and Technology Projects] grant number [No.2017ZX04011011] and [the China Scholarship Council] grant number [No. 201706295033] and [the Shaanxi Key Research and Development Program in Industrial Domain] grant number [No.2018ZDXM-GY-063] and [the Fundamental Research Funds for the Central Universities] grant number [No.31020190505003].
Conflicts of Interest
The authors declare no conflict of interest.
References
- Niamir, L.; Filatova, T.; Voinov, A.; Bressers, H. Transition to low-carbon economy: Assessing cumulative impacts of individual behavioral changes. Energy Policy 2018, 118, 325–345. [Google Scholar] [CrossRef]
- Yuchi, Q.; Wang, N.; Li, S.; Jiang, B. A Bi-objective Reverse Logistics Network Design under the Emission Trading Scheme. IEEE Access 2019. [Google Scholar] [CrossRef]
- Tuo, J.; Liu, P.; Liu, F. Dynamic Acquisition and Real-time Distribution of Carbon Emission for Machining Through Mining Energy Data. IEEE Access 2019, 7. [Google Scholar] [CrossRef]
- Luo, B.; Zhang, K.; Liu, S.; Cheng, H.; Wang, R. Investigation on the Interface Damage in Drilling Low-stiffness CFRP/Ti Stacks. Chin. J. Aeronaut. 2019, 32, 2211–2221. [Google Scholar] [CrossRef]
- Wang, Q.; Zhang, D.; Tang, K.; Zhang, Y. A mechanics based prediction model for tool wear and power consumption in drilling operations and its applications. J. Clean. Prod. 2019, 234, 171–184. [Google Scholar] [CrossRef]
- Luo, M.; Han, C.; Hafeez, H.M. Four-axis trochoidal toolpath planning for rough milling of aero-engine blisks. Chin. J. Aeronaut. 2019, 32, 2009–2016. [Google Scholar] [CrossRef]
- Cai, W.; Liu, F.; Zhou, X.N.; Xie, X. Fine energy consumption allowance of workpieces in the mechanical manufacturing industry. Energy 2016, 114, 623–633. [Google Scholar] [CrossRef]
- Zhou, L.; Li, J.; Li, F.; Meng, Q.; Li, J.; Xu, X. Energy consumption model and energy efficiency of machine tools: A comprehensive literature review. J. Clean. Prod. 2016, 112, 3721–3734. [Google Scholar] [CrossRef]
- Gutowski, T.G.; Branham, M.S.; Dahmus, J.B.; Jones, A.J.; Thiriez, A.; Sekulic, D.P. Thermodynamic analysis of resources used in manufacturing processes. Environ. Sci. Technol. 2009, 43, 1584–1590. [Google Scholar] [CrossRef] [PubMed]
- Kara, S.; Li, W. Unit process energy consumption models for material removal processes. CIRP Ann. 2011, 60, 37–40. [Google Scholar] [CrossRef]
- Li, L.; Yan, J.; Xing, Z. Energy requirements evaluation of milling machines based on thermal equilibrium and empirical modelling. J. Clean. Prod. 2013, 52, 113–121. [Google Scholar] [CrossRef]
- Costa DM, D.; Brito, T.G.; de Paiva, A.P.; Leme, R.C.; Balestrassi, P.P. A normal boundary intersection with multivariate mean square error approach for dry end milling process optimization of the AISI 1045 steel. J. Clean. Prod. 2016, 135, 1658–1672. [Google Scholar] [CrossRef]
- Zhong, Q.; Tang, R.; Peng, T. Decision rules for energy consumption minimization during material removal process in turning. J. Clean. Prod. 2017, 140, 1819–1827. [Google Scholar] [CrossRef]
- Guo, Y.; Loenders, J.; Duflou, J.; Lauwers, B. Optimization of energy consumption and surface quality in finish turning. Procedia CIRP 2012, 1, 512–517. [Google Scholar] [CrossRef]
- Xu, K.; Luo, M.; Tang, K. Machine based energy-saving tool path generation for five-axis end milling of freeform surfaces. J. Clean. Prod. 2016, 139, 1207–1223. [Google Scholar] [CrossRef]
- Draganescu, F.; Gheorghe, M.; Doicin, C.V. Models of machine tool efficiency and specific consumed energy. J. Mater. Process. Technol. 2003, 141, 9–15. [Google Scholar] [CrossRef]
- Rodrigues, A.R.; Coelho, R.T. Influence of the tool edge geometry on specific cutting energy at high-speed cutting. J. Braz. Soc. Mech. Sci. Eng. 2007, 29, 279–283. [Google Scholar] [CrossRef]
- Li, W.; Kara, S. An empirical model for predicting energy consumption of manufacturing processes: A case of turning process. Proc. Inst. Mech. Eng. Part B J. Eng. Manuf. 2011, 225, 1636–1646. [Google Scholar] [CrossRef]
- Liu, N.; Zhang, Y.F.; Lu, W.F. A hybrid approach to energy consumption modelling based on cutting power: A milling case. J. Clean. Prod. 2015, 104, 264–272. [Google Scholar] [CrossRef]
- Shi, K.N.; Zhang, D.H.; Liu, N.; Wang, S.B.; Ren, J.X.; Wang, S.L. A novel energy consumption model for milling process considering tool wear progression. J. Clean. Prod. 2018, 184, 152–159. [Google Scholar] [CrossRef]
- Shi, K.N.; Ren, J.X.; Wang, S.B.; Liu, N.; Liu, Z.M.; Zhang, D.H.; Lu, W.F. An improved cutting power-based model for evaluating total energy consumption in general end milling process. J. Clean. Prod. 2019, 231, 1330–1341. [Google Scholar] [CrossRef]
- Zhang, Y.; Xu, Z.; Zhu, Y.; Zhu, D. Machining of a film-cooling hole in a single-crystal superalloy by high-speed electrochemical discharge drilling. Chin. J. Aeronaut. 2016, 29, 560–570. [Google Scholar] [CrossRef]
- Ma, F.; Zhang, H.; Cao, H.; Hon, K.K.B. An energy consumption optimization strategy for CNC milling. Int. J. Adv. Manuf. Technol. 2017, 90, 1715–1726. [Google Scholar] [CrossRef]
- Lee, P.; Altintaş, Y. Prediction of ball-end milling forces from orthogonal cutting data. Int. J. Adv. Mech. Des. Syst. Manuf. 1996, 36, 1059–1072. [Google Scholar] [CrossRef]
- Budak, E.; Armarego, E.J.A. Prediction of milling force coefficients from orthogonal cutting data. J. Manuf. Sci.Eng 1996, 118, 216–224. [Google Scholar] [CrossRef]
- Hu, S.; Liu, F.; He, Y.; Peng, B. Characteristics of additional load losses of spindle system of machine tools. J. Adv. Mech. Des. Syst. Manuf. 2010, 4, 1221–1233. [Google Scholar] [CrossRef]
- Hu, S.; Liu, F.; He, Y.; Hu, T. An on-line approach for energy efficiency monitoring of machine tools. J. Clean. Prod. 2012, 27, 133–140. [Google Scholar] [CrossRef]
- Han, C.; Zhang, D.; Luo, M.; Wu, B. Chip evacuation force modelling for deep hole drilling with twist drills. Int. J. Adv. Manuf. Technol. 2018, 98, 3091–3103. [Google Scholar] [CrossRef]


© 2019 by the authors. Licensee MDPI, Basel, Switzerland. This article is an open access article distributed under the terms and conditions of the Creative Commons Attribution (CC BY) license (http://creativecommons.org/licenses/by/4.0/).