Linear Method for Diagnosis of Inter-Turn Short Circuits in 3-Phase Induction Motors


Abstract
:1. Introduction
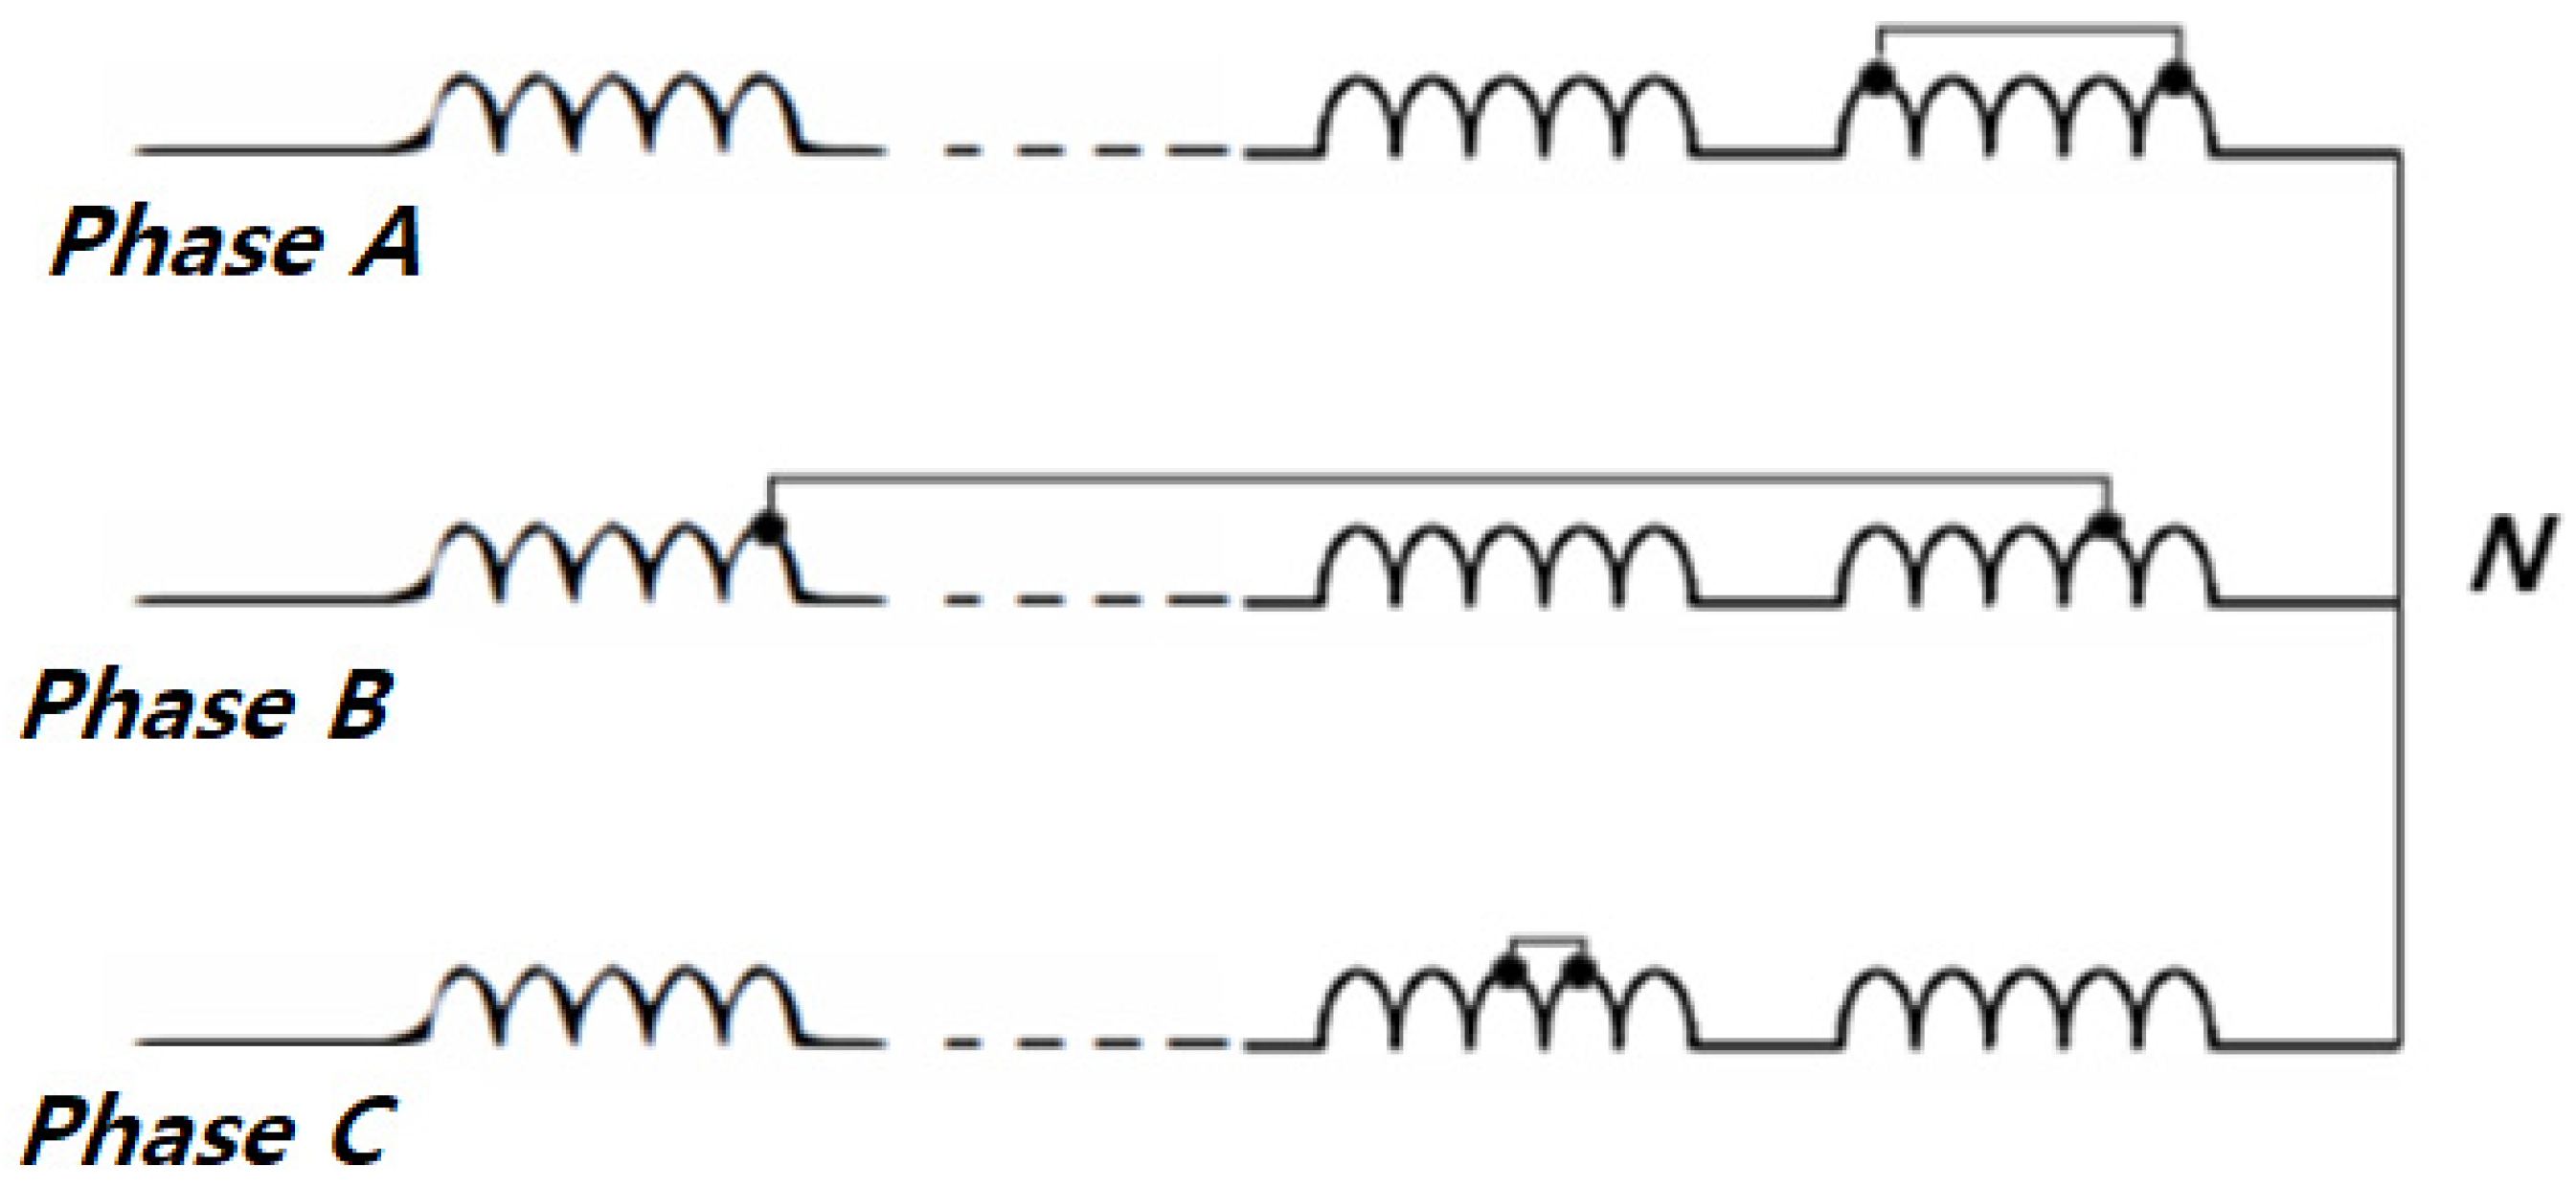
2. Overview of Turn-to-Turn Shorts
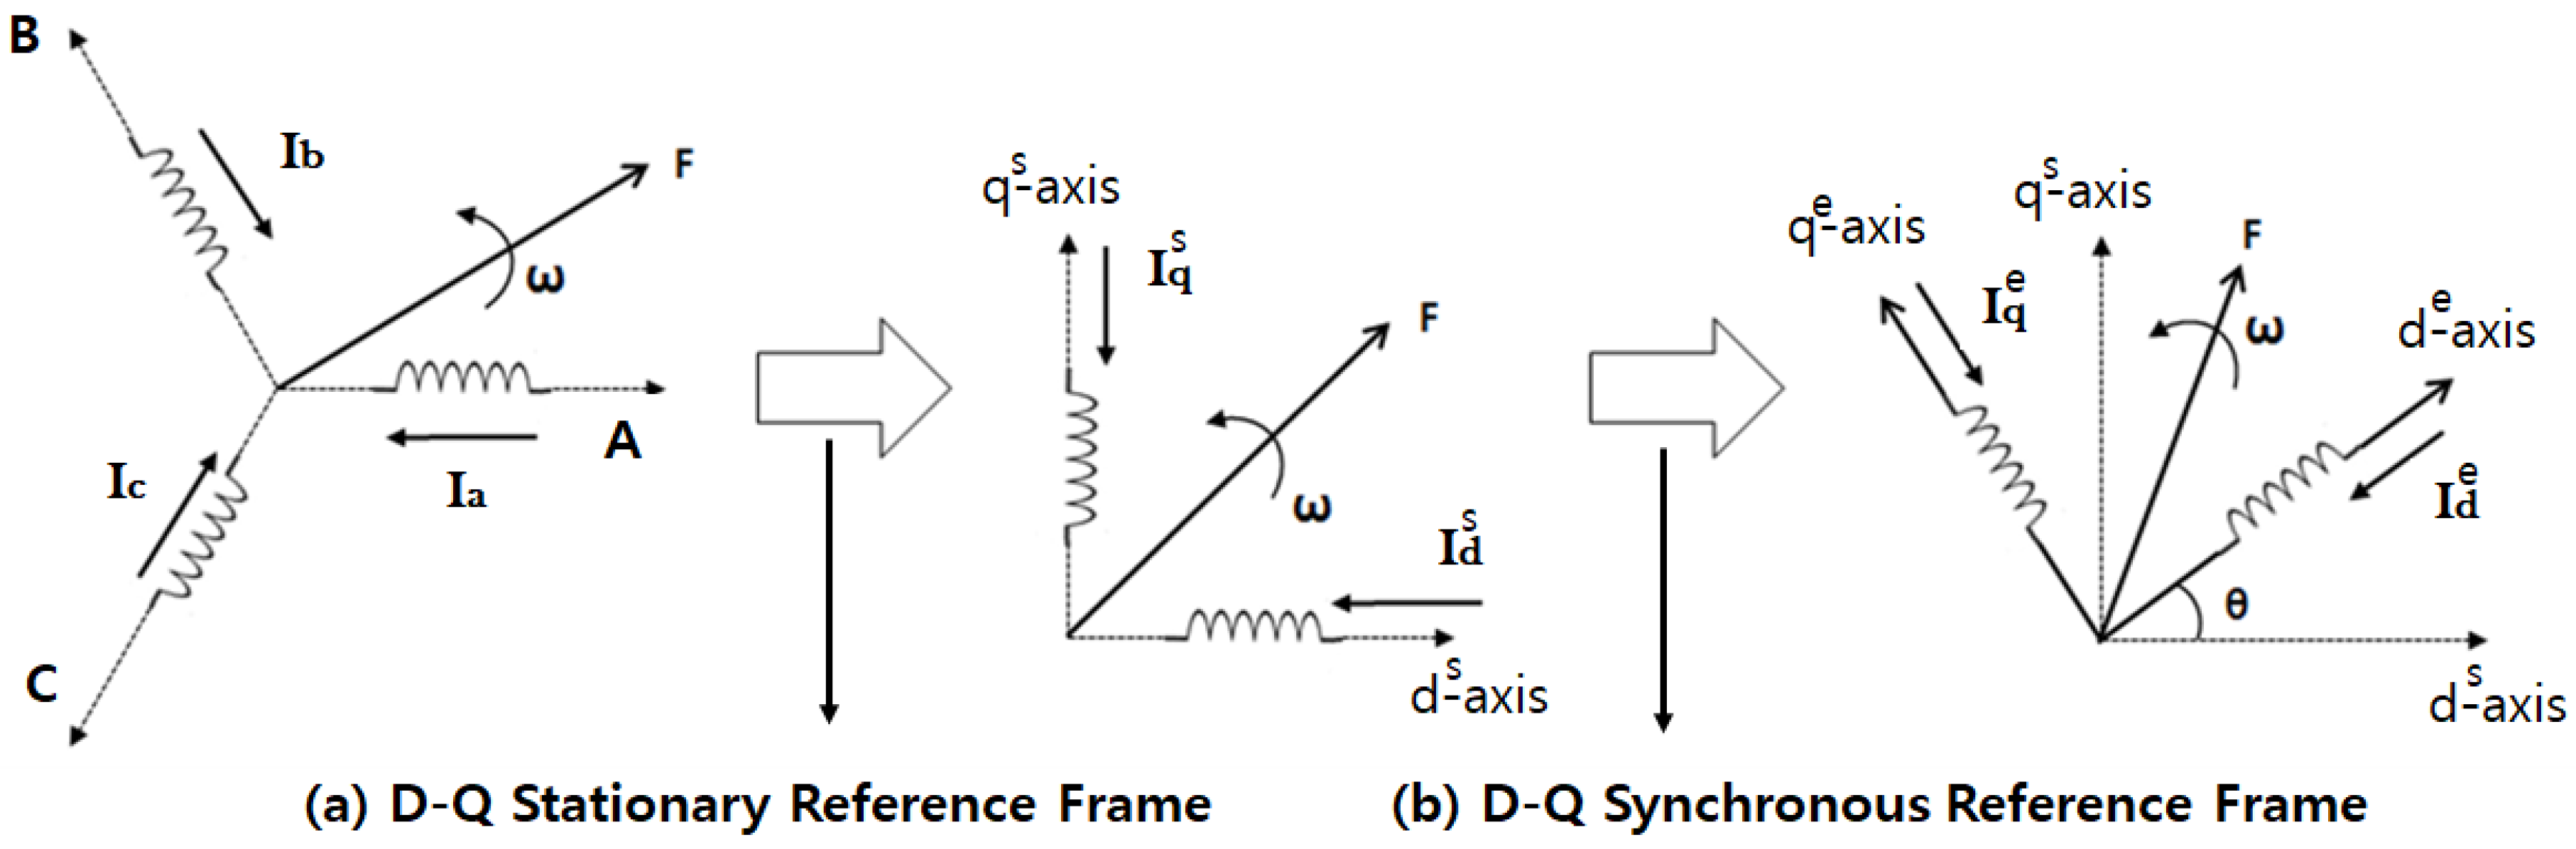
3. D-Q Transformation
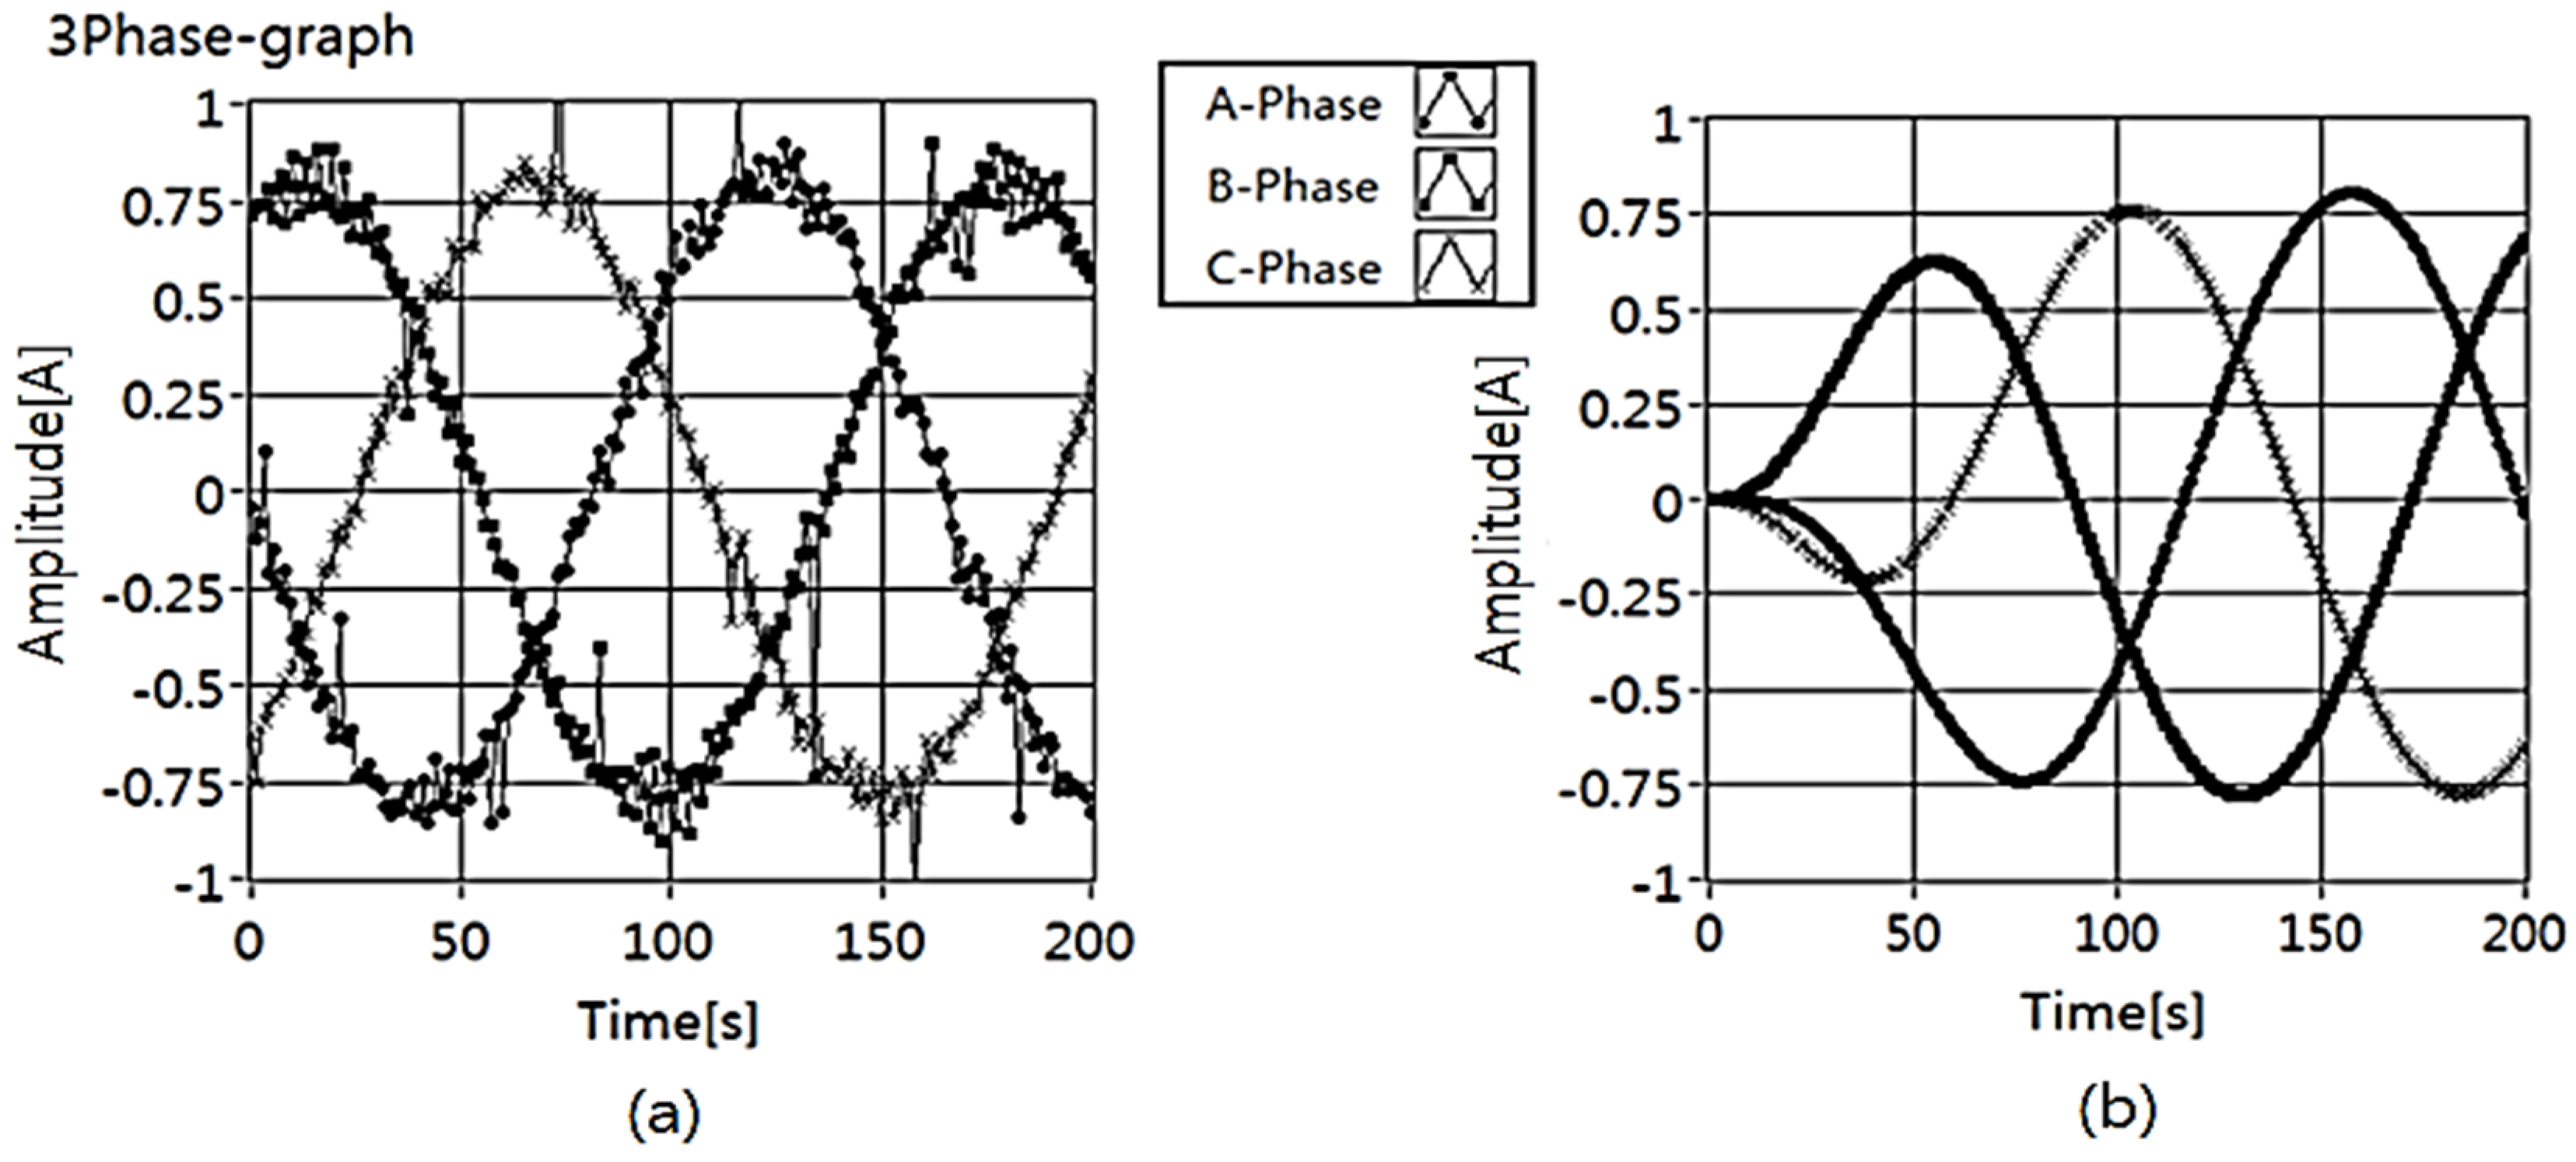
3.1. D-Q Stationary Reference Frame
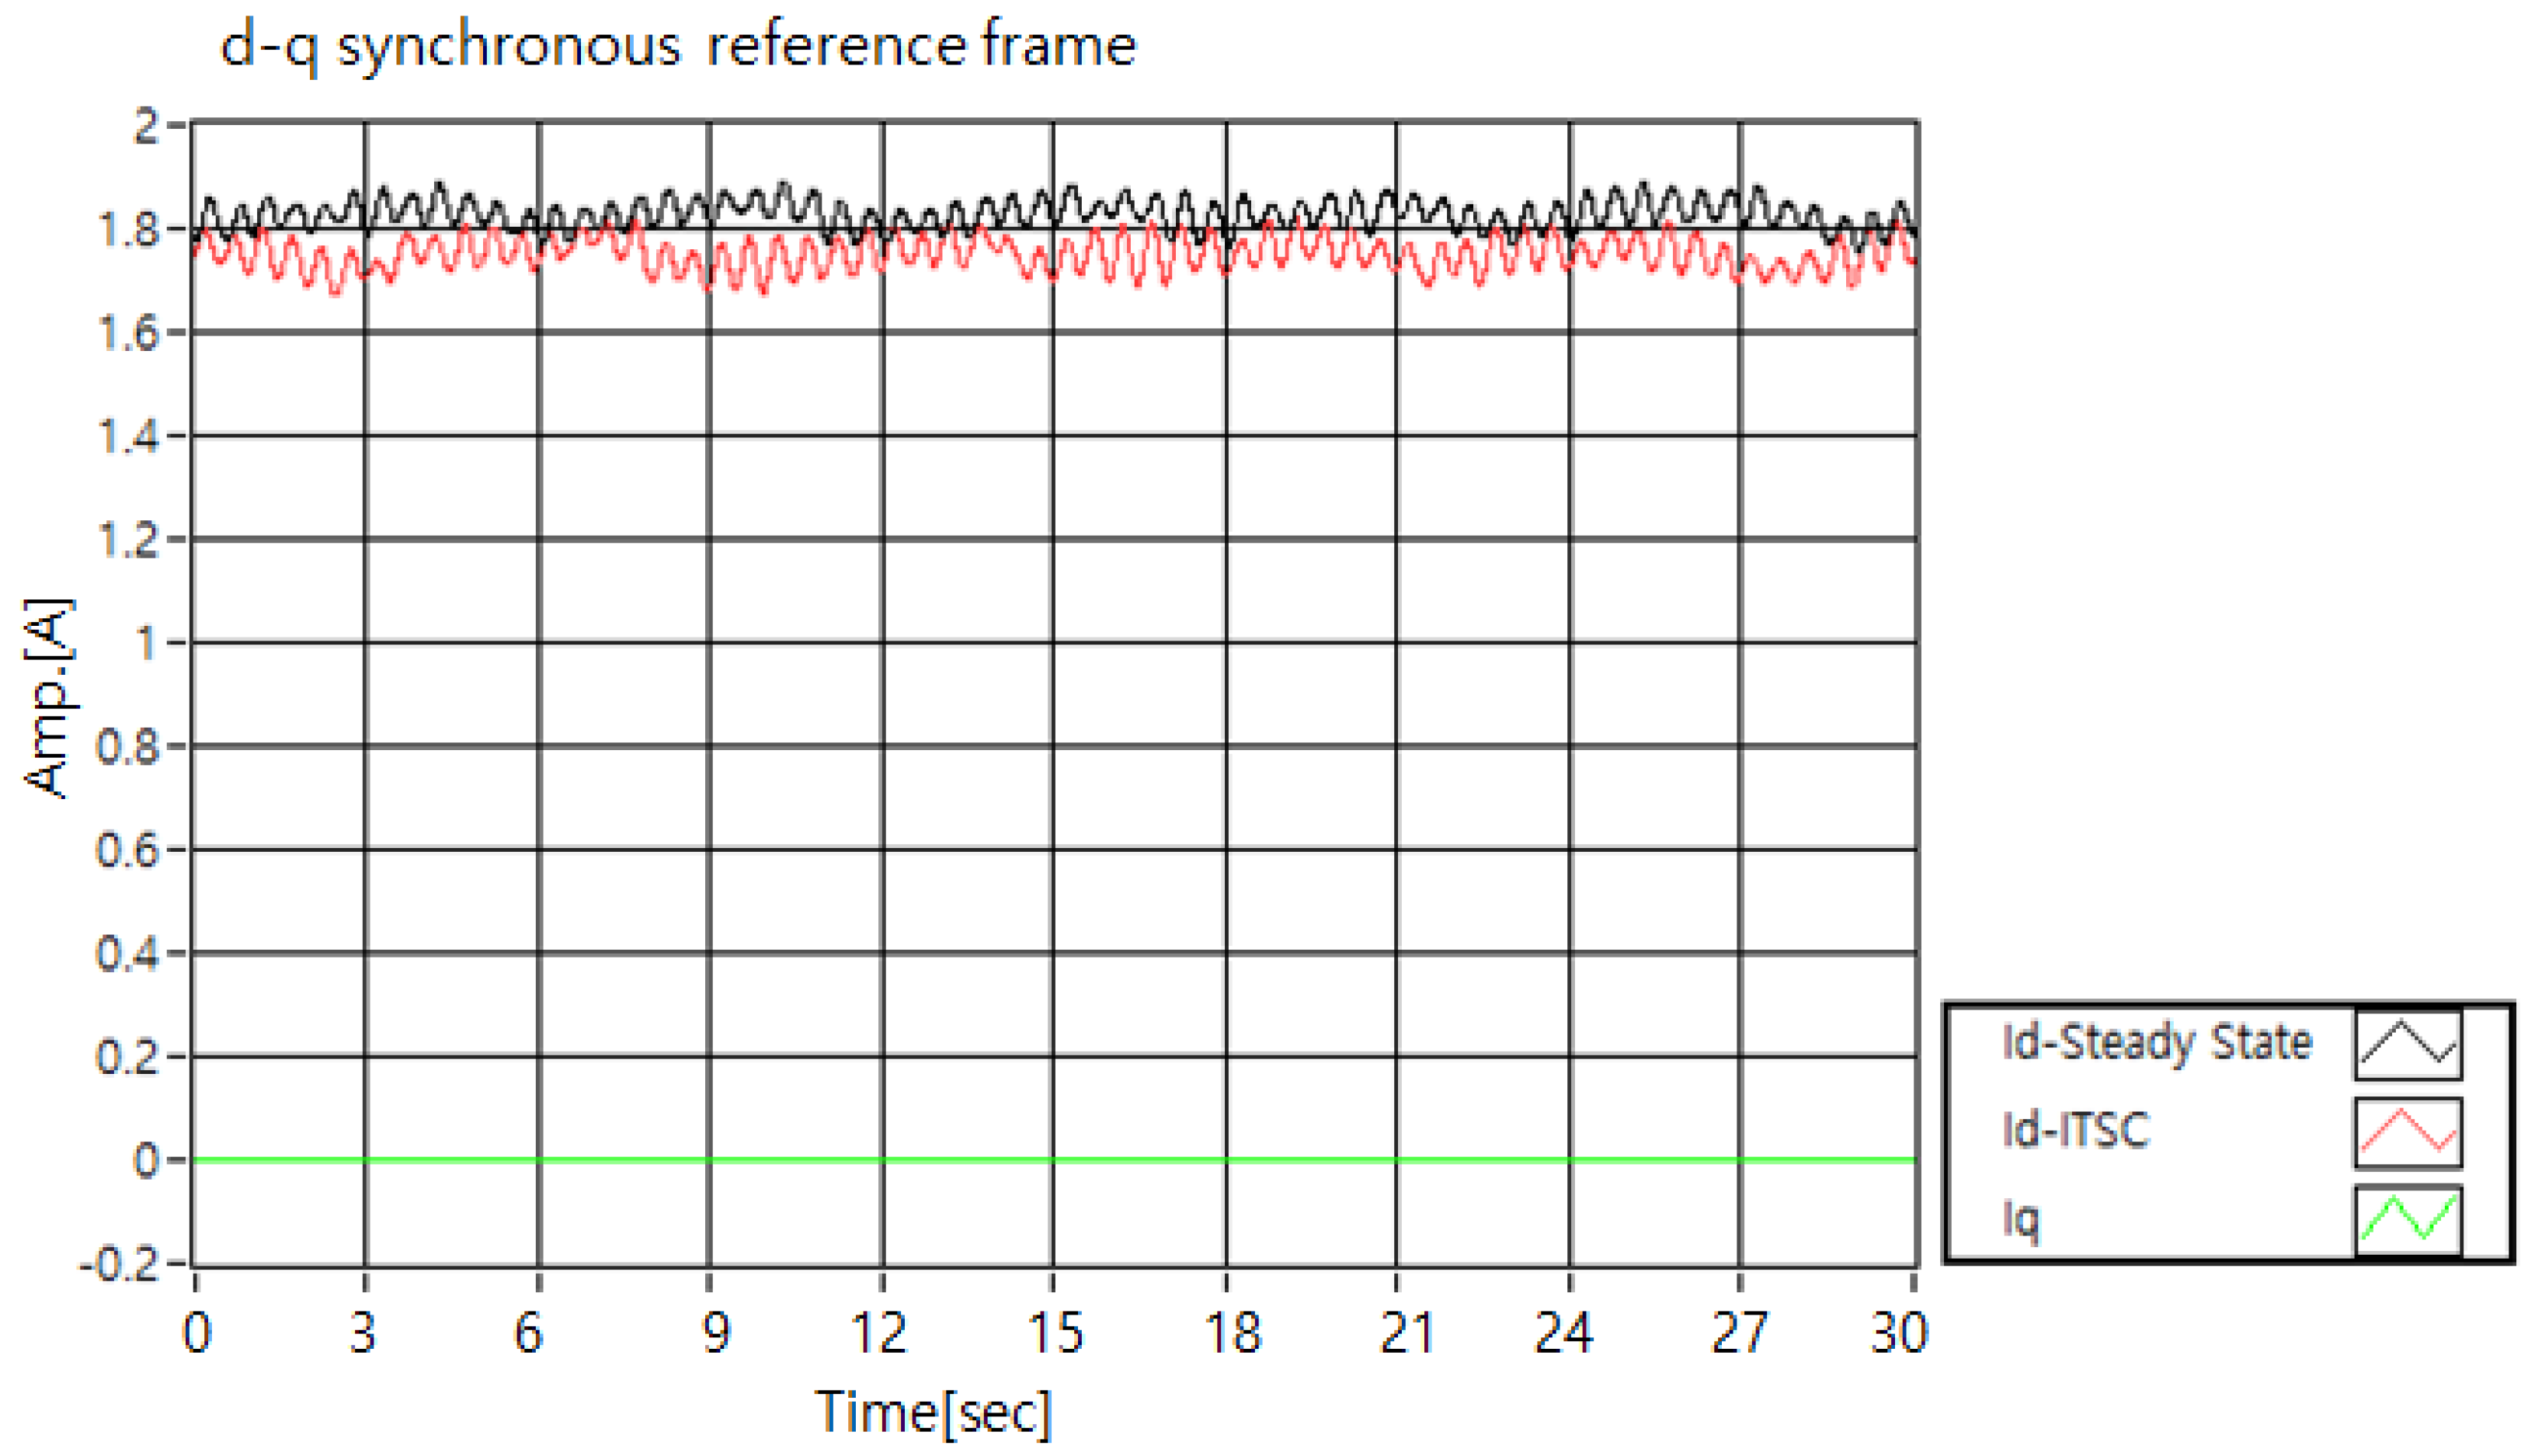
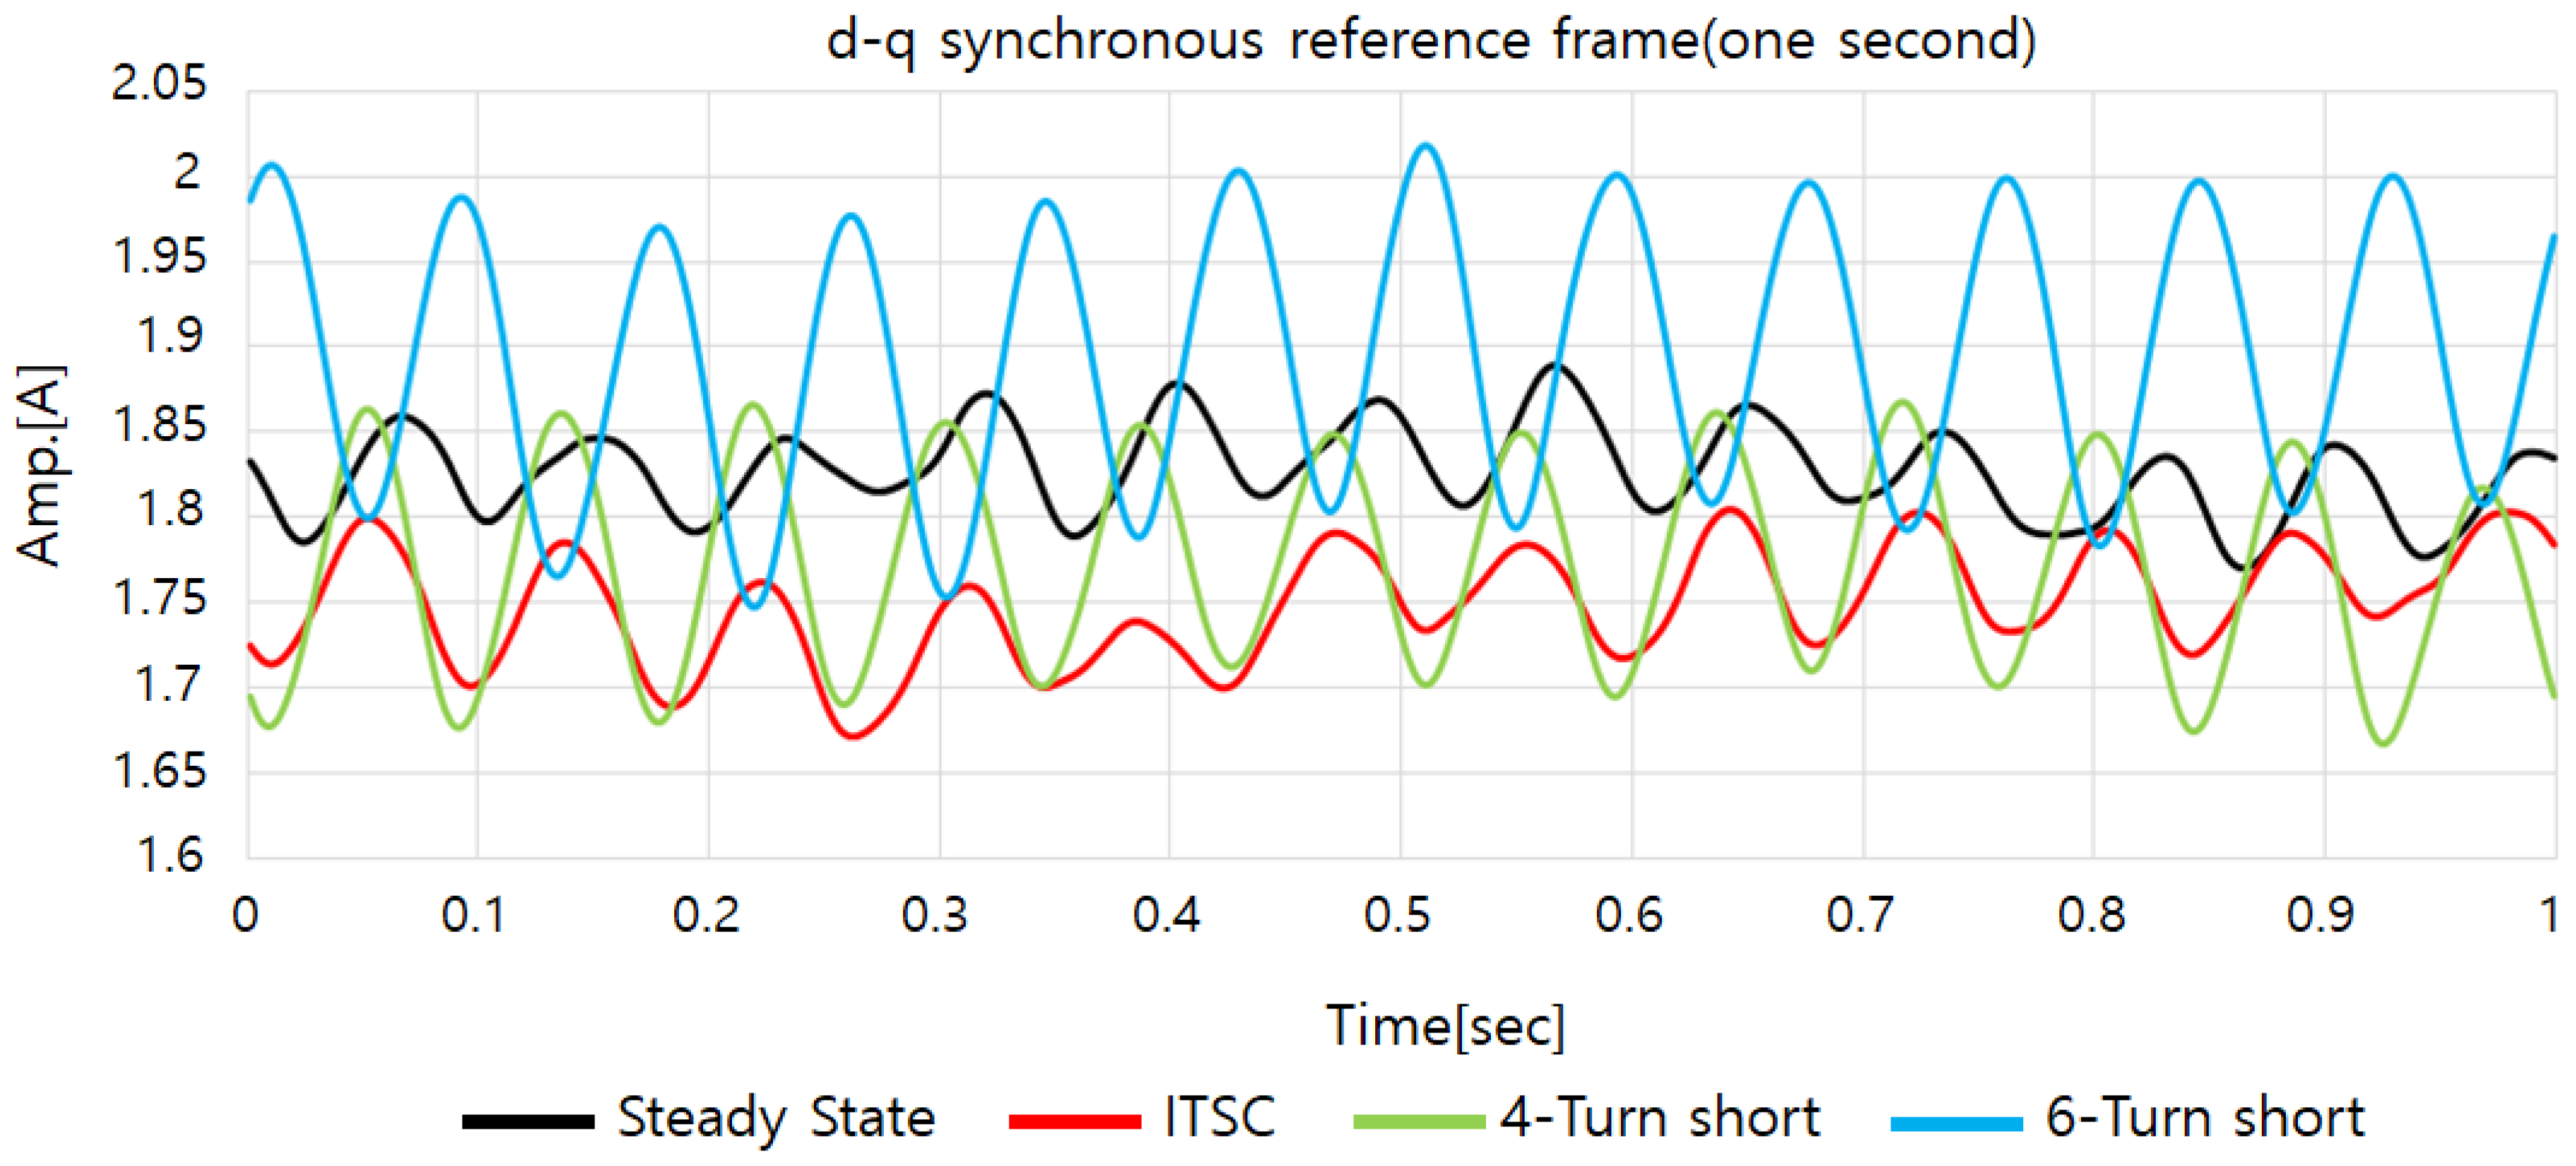
3.2. D-Q Synchronous Reference Frame
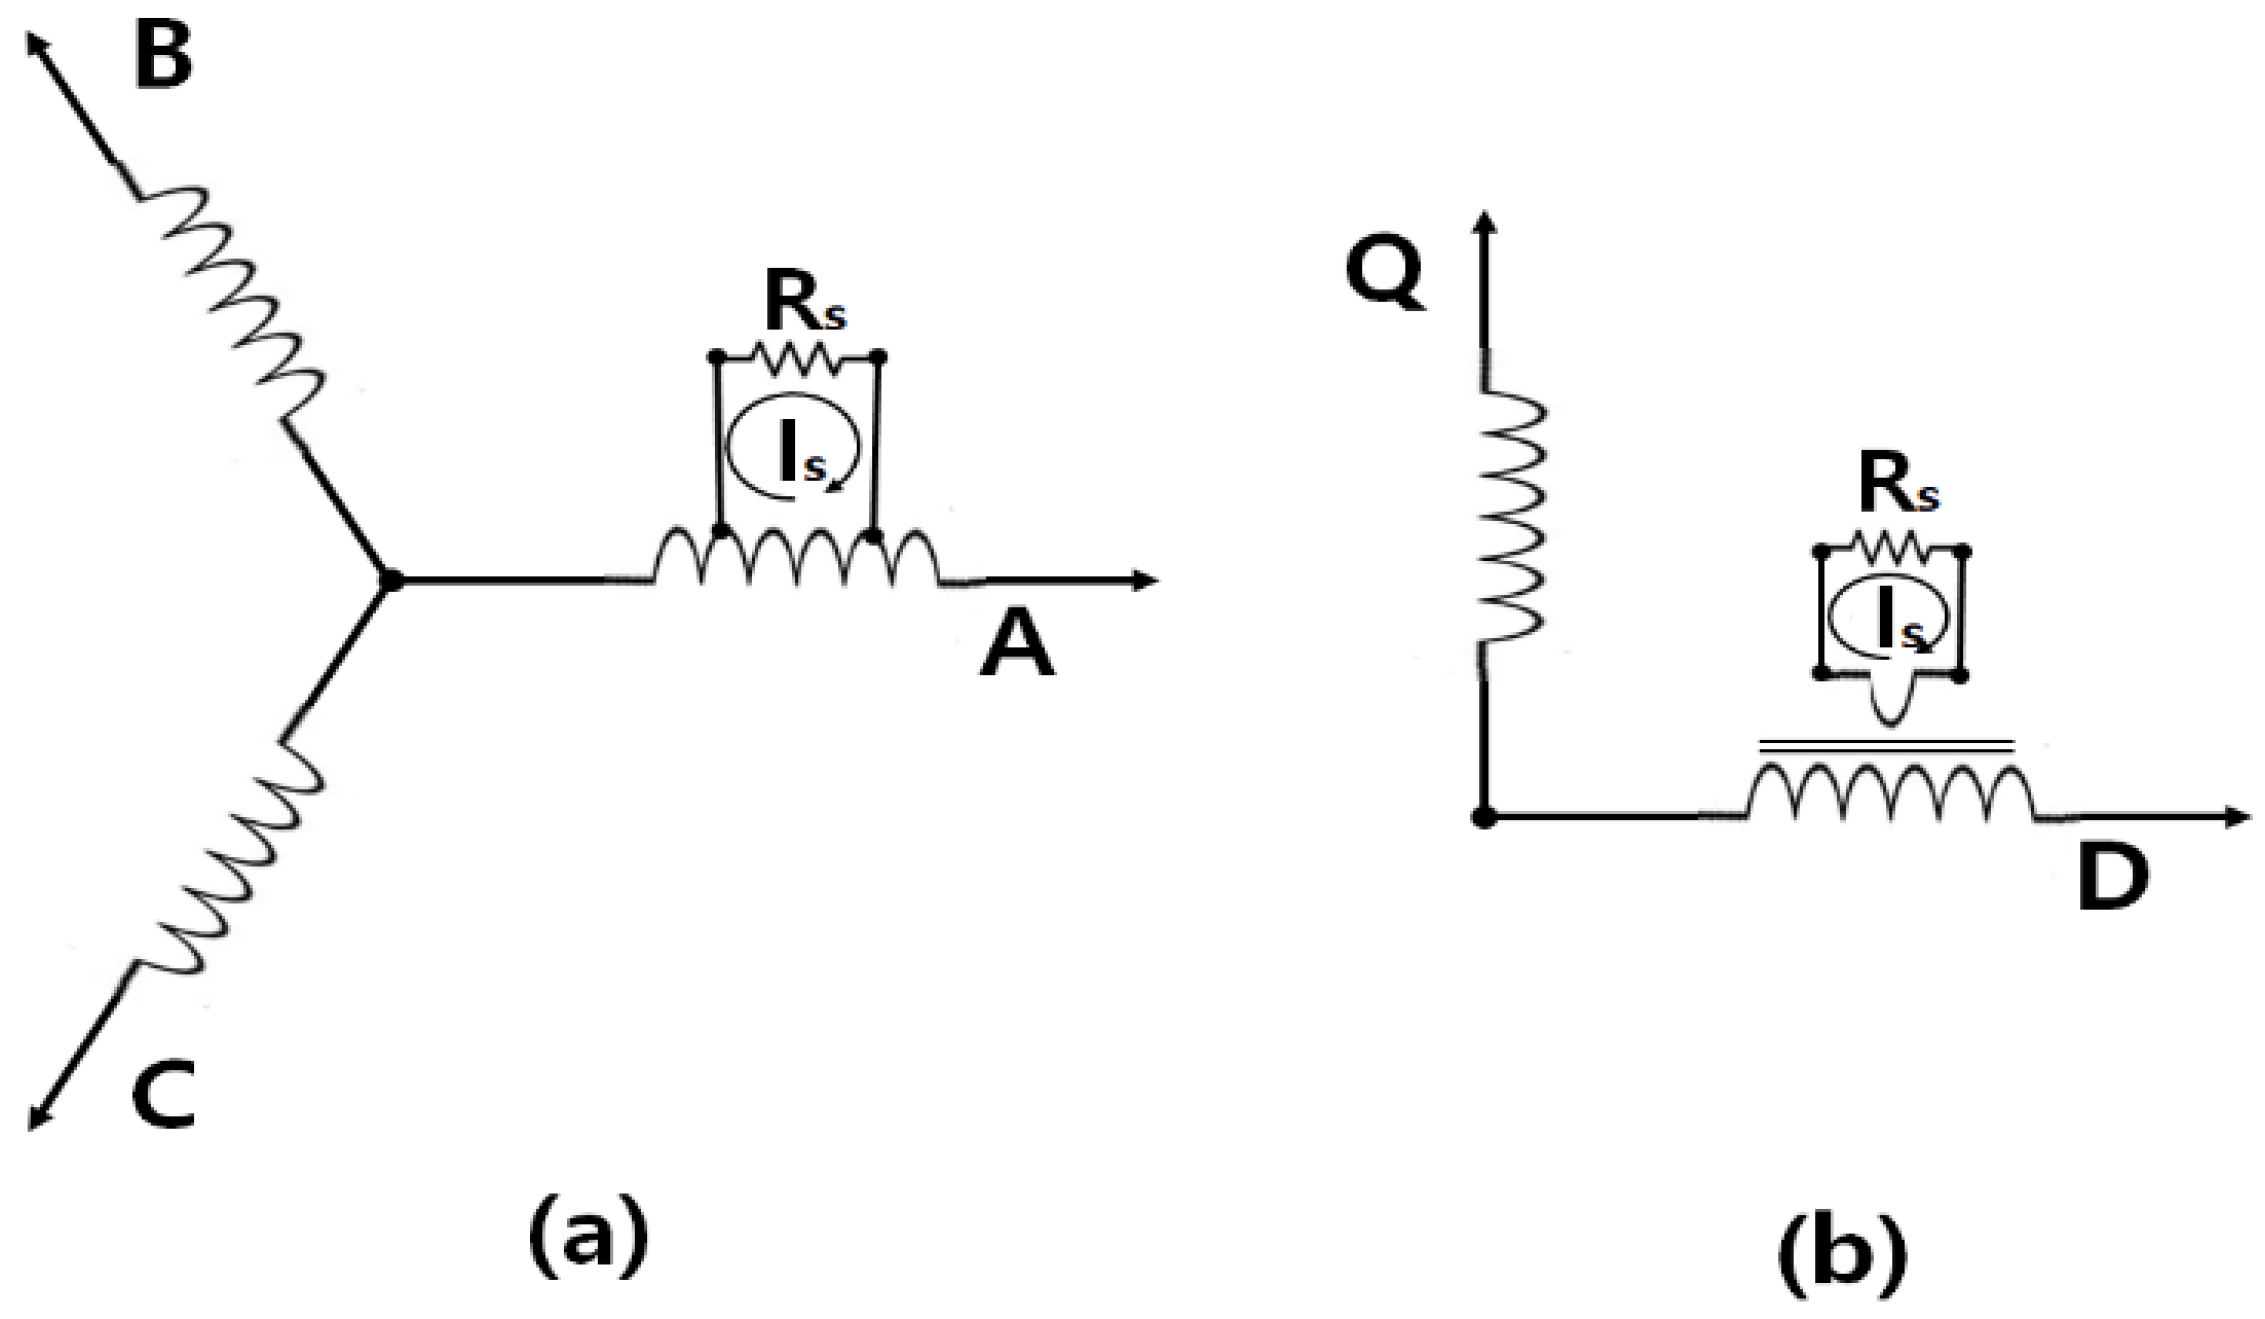
4. Turn-to-Turn Short and Inter Turn Short Circuit
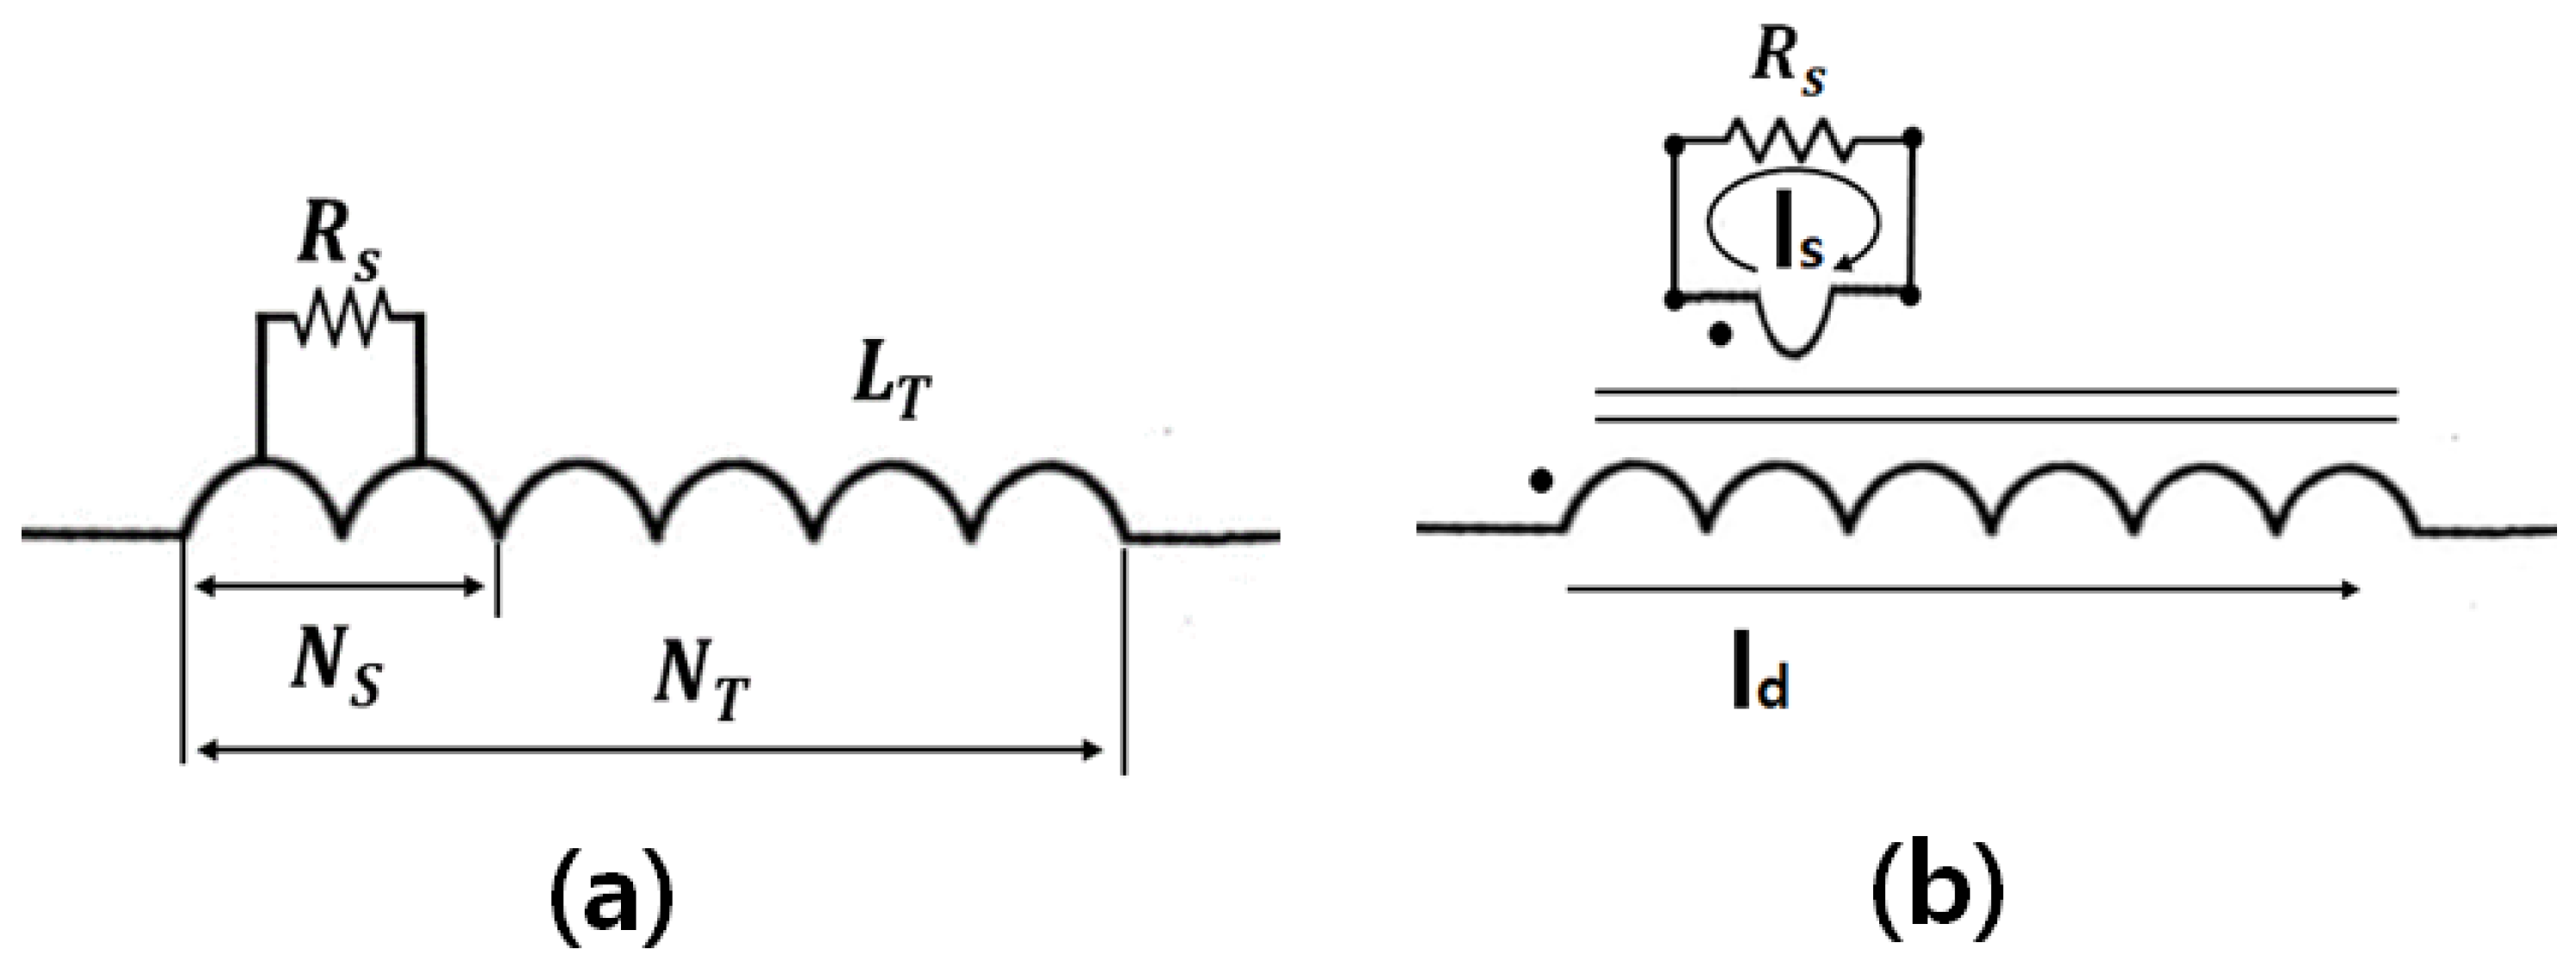
4.1. Magnetic Flux Linkage Quantity according to a Turn-to-Turn Short
4.2. Short Circuit Current According to ITSC
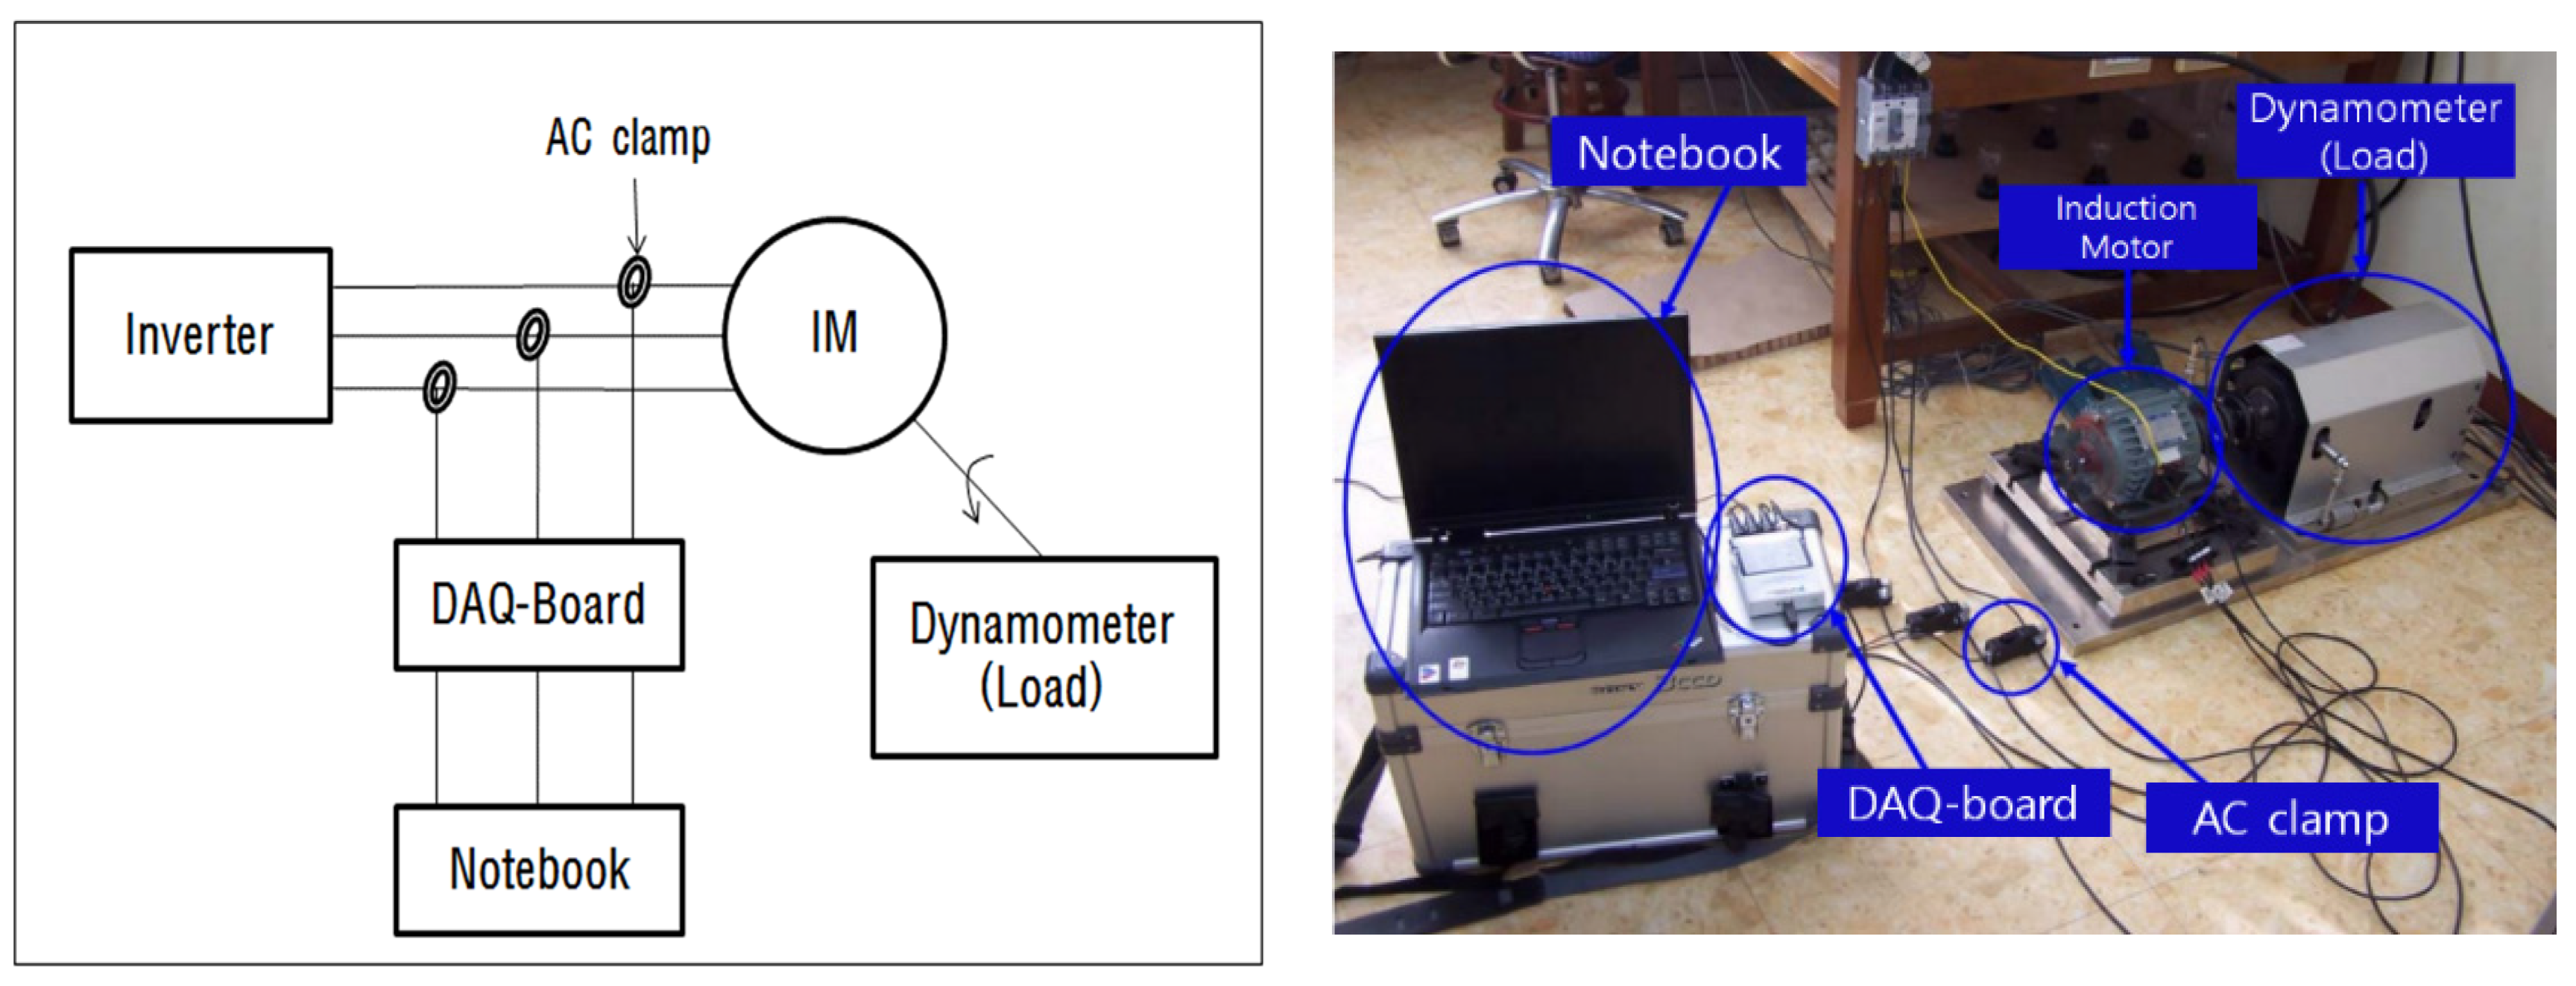
5. Experiment and Discussion
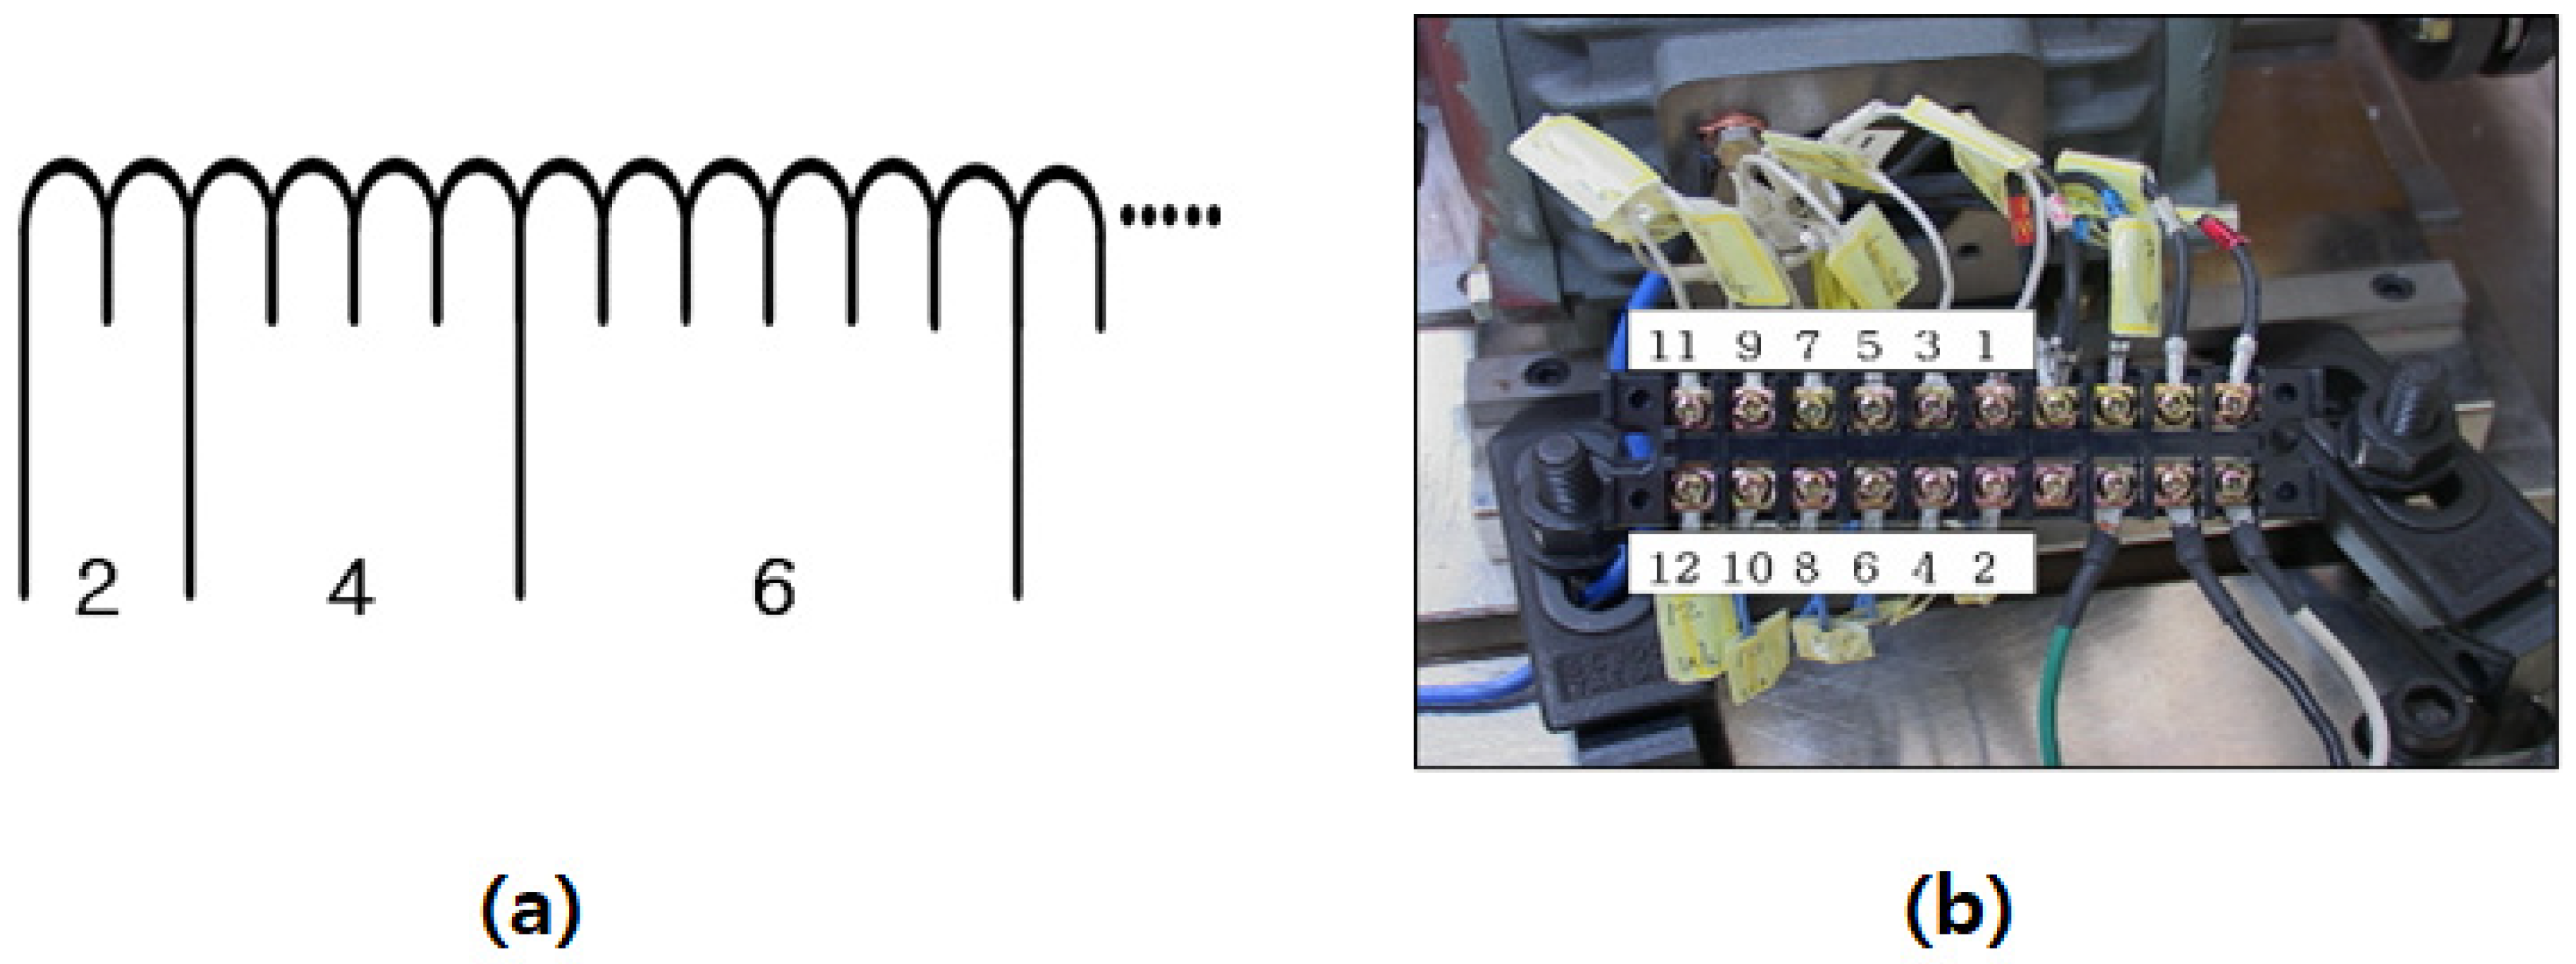
5.1. Experimental Conditions
- -
- Operation of an induction motor by using inverter;
- -
- Adjustment of the motor operation speed by using dynamometer;
- -
- The initial speed—the rated speed 1690 [rpm];
- -
- operating time—turn short per 30 [s];
- -
- Sampling rate and the number of samplings: 10,000 [S/s], 10,000 [s];
- -
- The frequency of samplings: 1 [s].
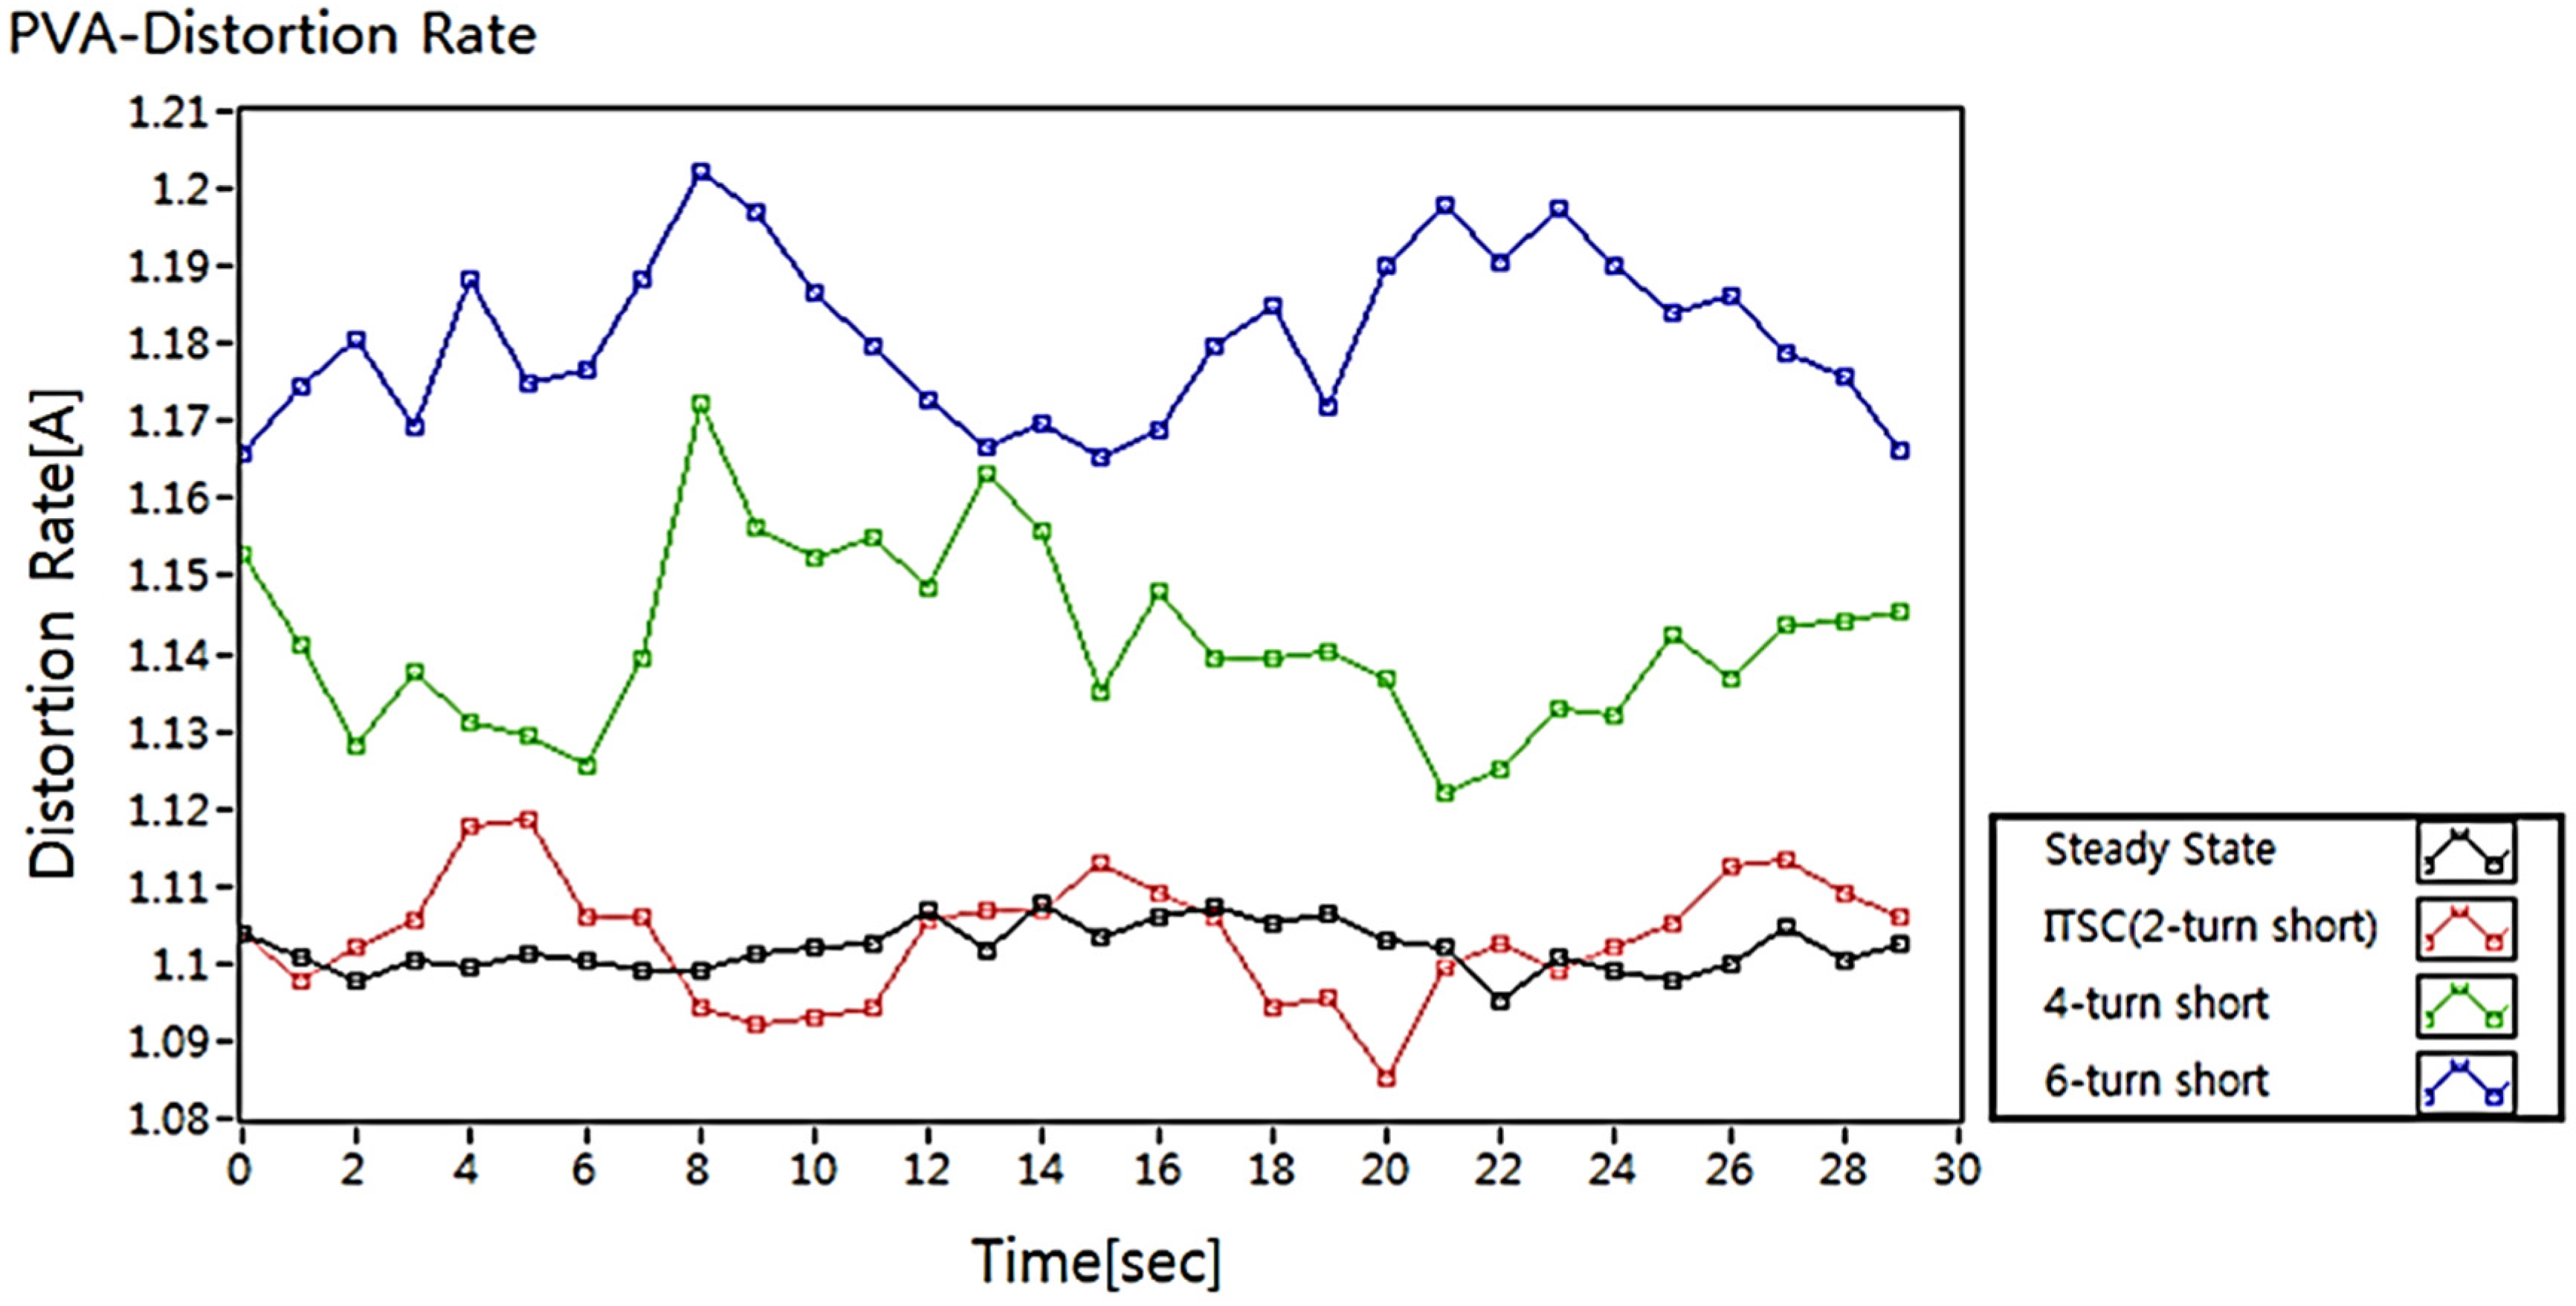
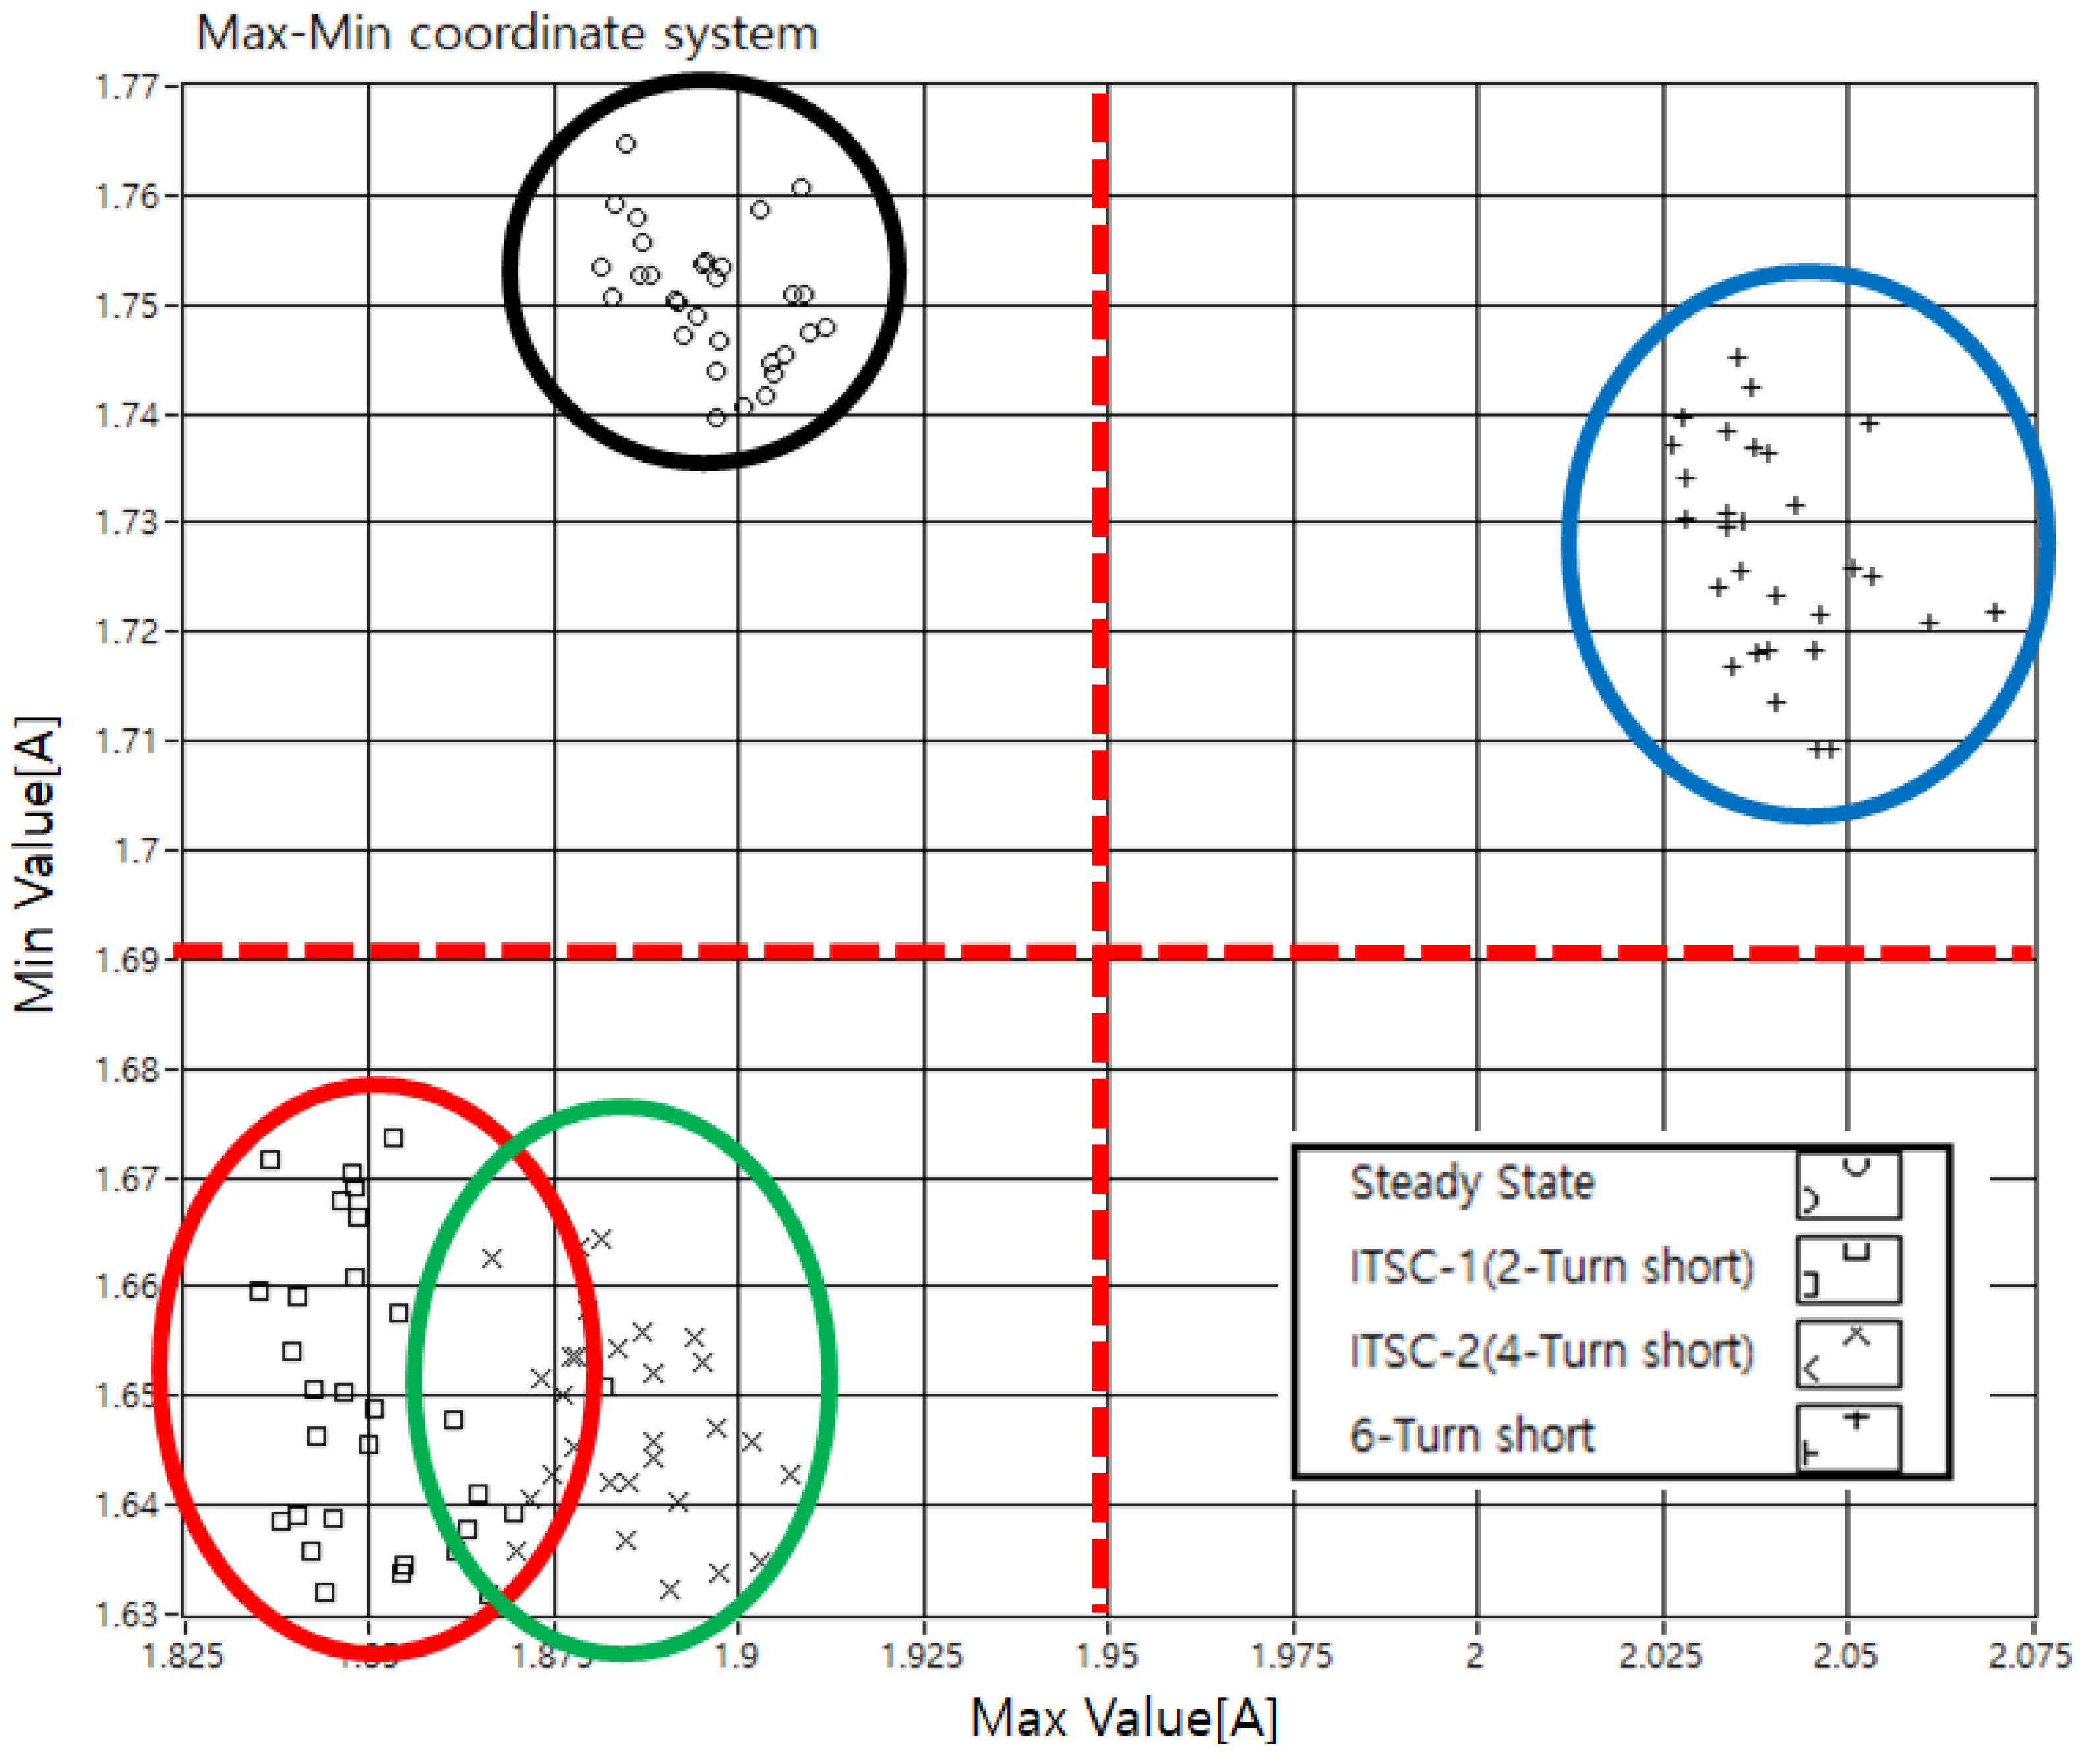
5.2. Existing Studies-PVA
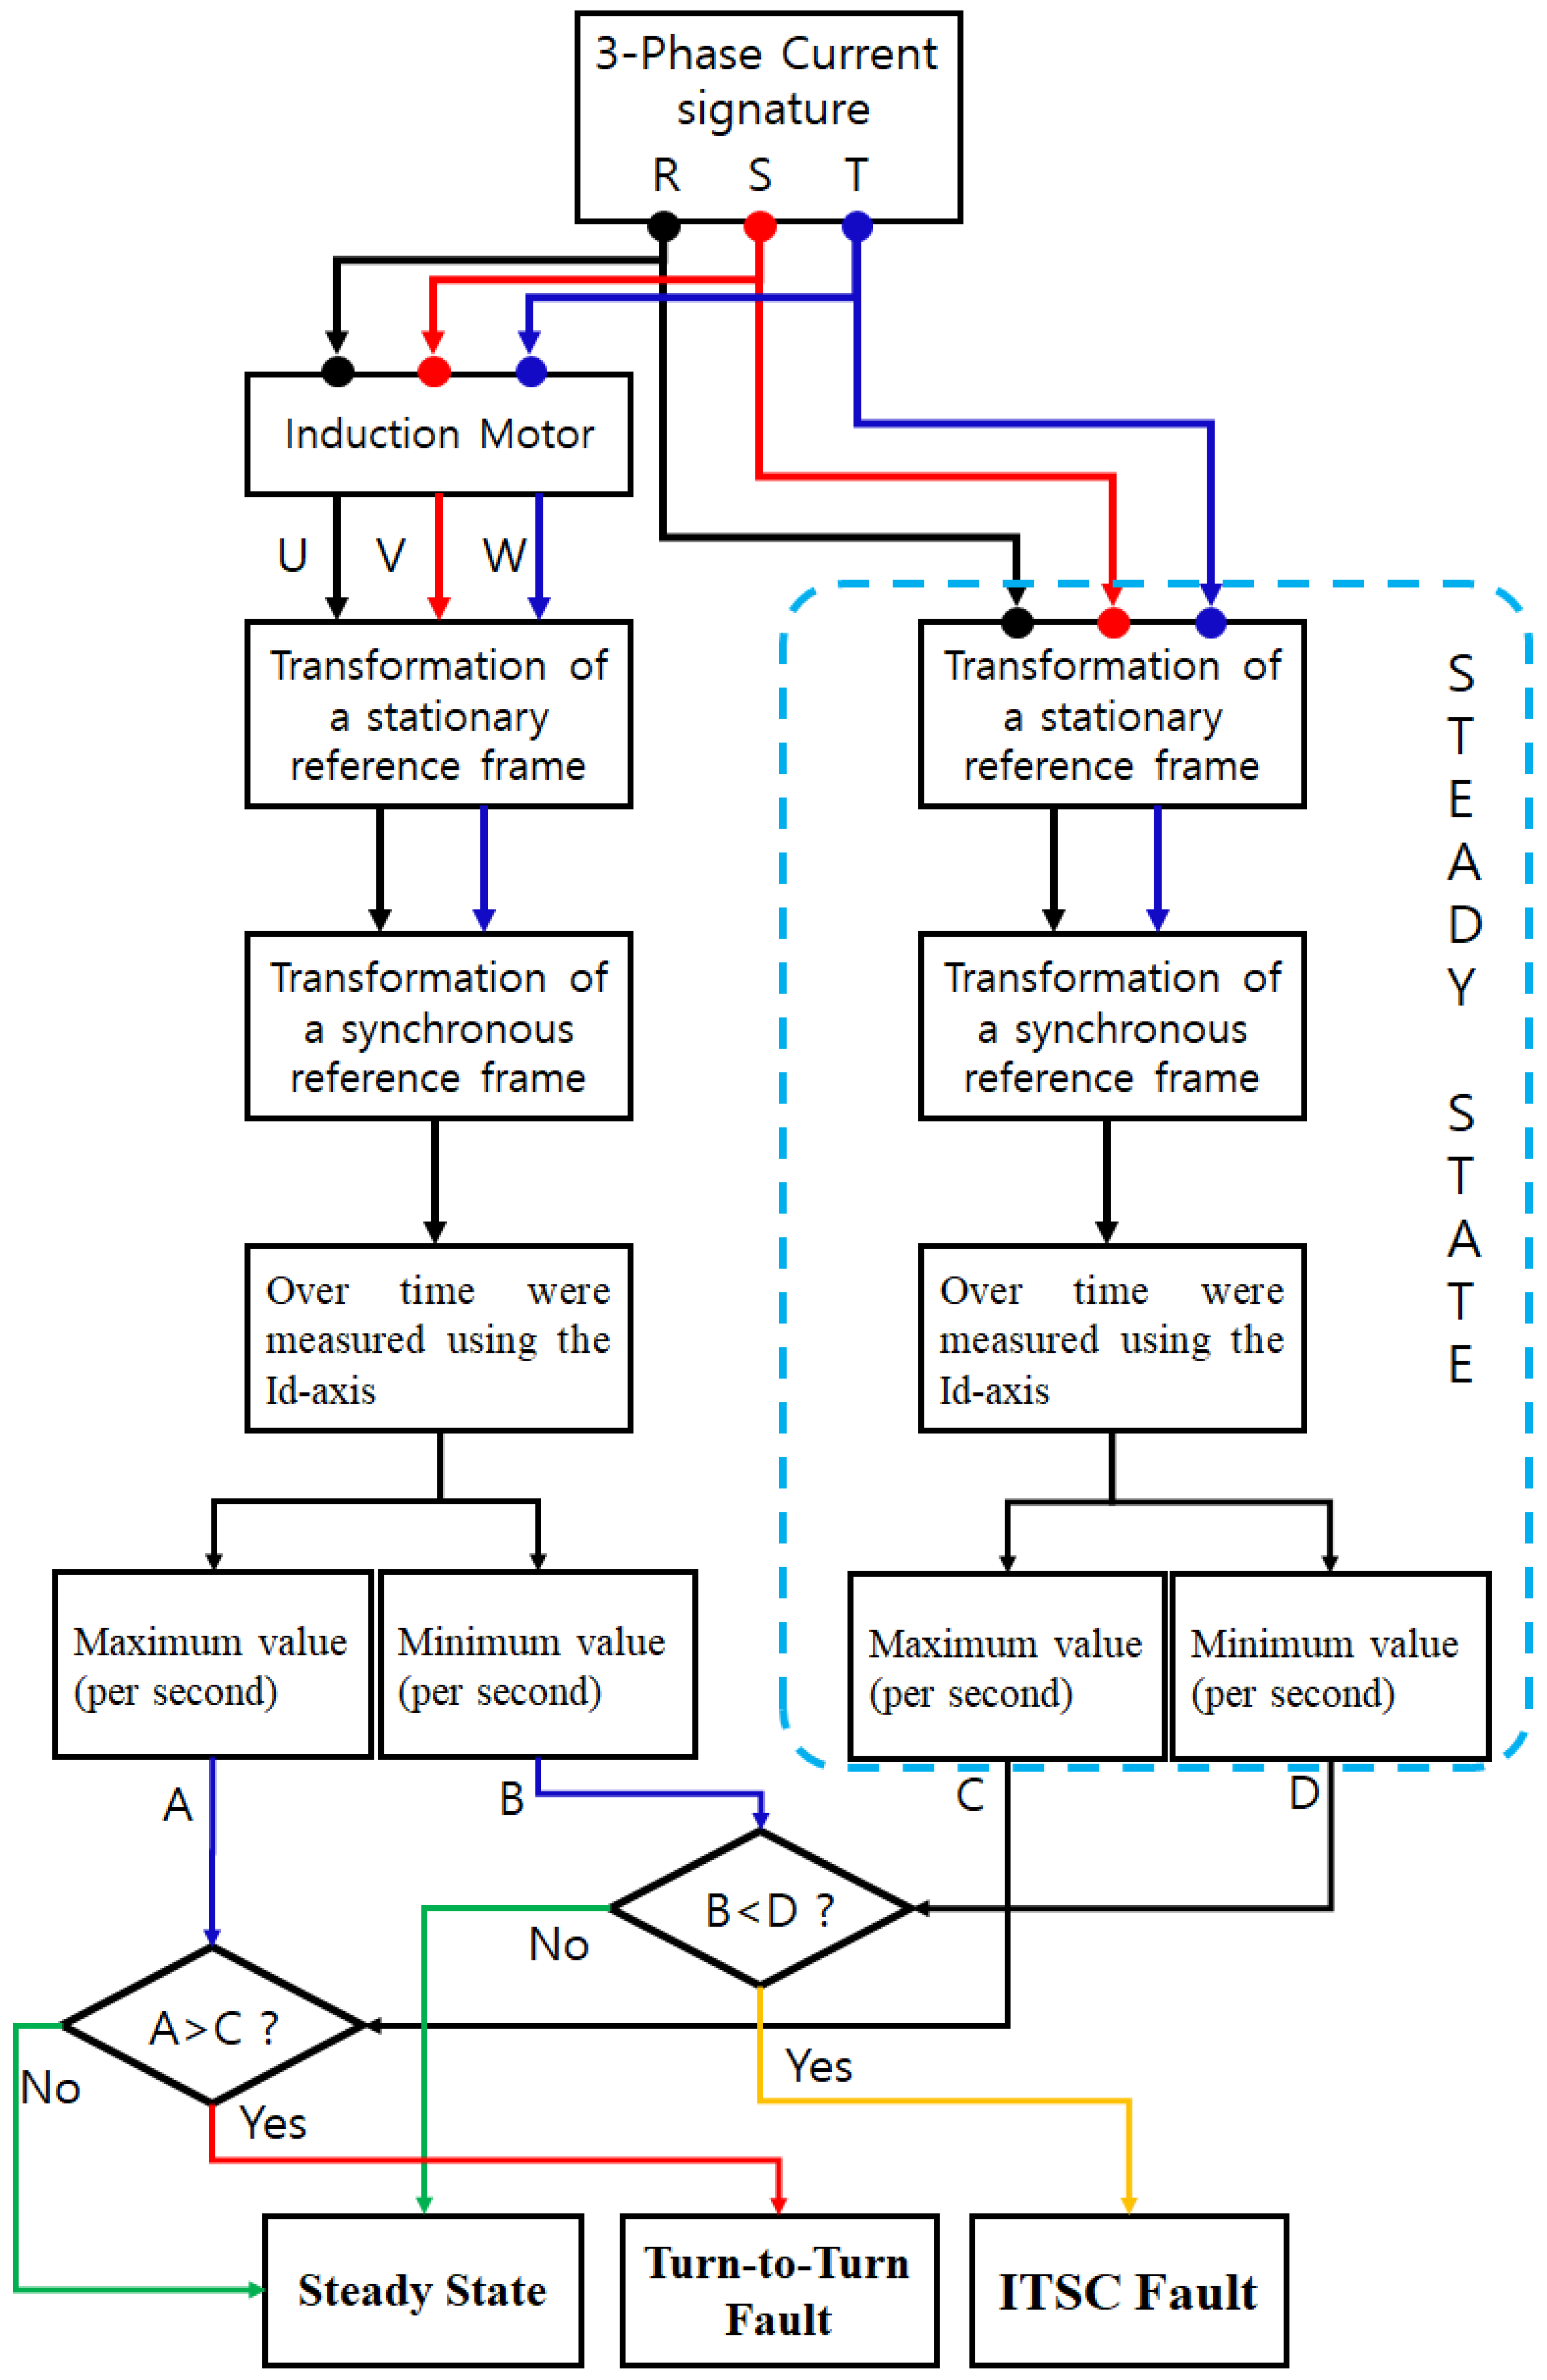
6. Proposed Method
7. Conclusions
Author Contributions
Funding
Conflicts of Interest
References
- Waide, P.; Brunner, C. Energy-Efficiency Policy Opportunities for Electric Motor-Driven Systems; IEA Energy Papers; OECD Publishing: Paris, France, 2011; pp. 1–132. [Google Scholar] [CrossRef]
- O’Donnell, P. Report of large motor reliability survey of industrial and commercial installations: Part I and II. IEEE Trans. Ind. Appl. 1985, IA-21, 853–872. [Google Scholar] [CrossRef]
- Albrecht, P.F.; Appiarius, J.C.; McCoy, R.M.; Owen, E.L.; Sharma, D.K. Assessment of the Reliability of Motors in Utility Applications—Updated. IEEE Trans. Energy Convers. 1986, EC-1, 39–46. [Google Scholar] [CrossRef]
- Radja, N.; Rachek, M.; Larbi, S.N. Non-Destructive Testing for Winding Insulation Diagnosis Using Inter-Turn Transient Voltage Signature Analysis. Machines 2018, 6, 21. [Google Scholar] [CrossRef]
- Bellini, A.; Filippetti, F.; Tassoni, C.; Capolino, G. Advances in Diagnostic Techniques for Induction Machines. IEEE Trans. Ind. Electron. 2008, 55, 4109–4126. [Google Scholar] [CrossRef]
- Tallam, R.M.; Lee, S.B.; Stone, G.C.; Kliman, G.B.; Yoo, J.; Habetler, T.G.; Harley, R.G. A Survey of Methods for Detection of Stator-Related Faults in Induction Machines. IEEE Trans. Ind. Appl. 2007, 43, 920–933. [Google Scholar] [CrossRef]
- Bonnett, A.H.; Soukup, G.C. Cause and analysis of stator and rotor failures in three-phase squirrel-cage induction motors. IEEE Trans. Ind. Appl. 1992, 28, 921–937. [Google Scholar] [CrossRef]
- Wang, L.; Li, Y.; Li, J. Diagnosis of Inter-Turn Short Circuit of Synchronous Generator Rotor Winding Based on Volterra Kernel Identification. Energies 2018, 11, 2524. [Google Scholar] [CrossRef]
- Dybkowski, M.; Bednarz, S. Modified Rotor Flux Estimators for Stator-Fault-Tolerant Vector Controlled Induction Motor Drives. Energies 2019, 12, 3232. [Google Scholar] [CrossRef]
- Chen, Y.; Zhao, X.; Yang, Y.; Shi, Y. Online Diagnosis of Inter-turn Short Circuit for Dual-Redundancy Permanent Magnet Synchronous Motor Based on Reactive Power Difference. Energies 2019, 12, 510. [Google Scholar] [CrossRef]
- Glowacz, A. Recognition of acoustic signals of induction motor using FFT, SMOFS-10 and LSVM. Eksploatacja i Niezawodność 2015, 17, 569–574. [Google Scholar] [CrossRef]
- Duan, Z.; Wu, T.; Guo, S.; Shao, T.; Malekian, R.; Li, Z. Development and trend of condition monitoring and fault diagnosis of multi-sensors information fusion for rolling bearings: A review. Int. J. Adv. Manuf. Technol. 2018, 96, 803. [Google Scholar] [CrossRef]
- Stief, A.; Ottewill, J.R.; Baranowski, J.; Orkisz, M. A PCA and Two-Stage Bayesian Sensor Fusion Approach for Diagnosing Electrical and Mechanical Faults in Induction Motors. IEEE Trans. Ind. Electron. 2019, 66, 9510–9520. [Google Scholar] [CrossRef]
- Glowacz, A.; Głowacz, Z. Recognition of rotor damages in a DC motor using acoustic signals. Bull. Pol. Acad. Sci. Tech. Sci. 2017, 65, 187–194. [Google Scholar] [CrossRef]
- Glowacz, A.; Glowacz, W. Vibration-Based Fault Diagnosis of Commutator Motor. Shock Vib. 2018, 2018, 10. [Google Scholar] [CrossRef]
- Benbouzid, M.E.H. A review of induction motors signature analysis as a medium for faults detection. IEEE Trans. Ind. Electron. 2000, 47, 984–993. [Google Scholar] [CrossRef]
- Cruz, S.M.A.; Cardoso, A.J.M. Diagnosis of stator inter-turn short circuits in DTC induction motor drives. IEEE Trans. Ind. Appl. 2004, 40, 1349–1360. [Google Scholar] [CrossRef]
- Refaat, S.S.; Abu-Rub, H.; Iqbal, A. ANN-based system for inter-turn stator winding fault tolerant DTC for induction motor drives. In Proceedings of the 17th European Conference on Power Electronics and Applications (EPE’15 ECCE-Europe), Geneva, Switzerland, 8–10 September 2015; pp. 1–7. [Google Scholar] [CrossRef]
- Praneeth, A.V.J.S.; Williamson, S.S. Algorithm for prediction and control of induction motor stator interturn faults in electric vehicles. In Proceedings of the 2017 IEEE Transportation Electrification Conference and Expo (ITEC), Chicago, IL, USA, 22–24 June 2017; pp. 130–134. [Google Scholar] [CrossRef]
- Lu, D.; Zhang, P. MCSA-based Fault Diagnosis Technology for Motor Drivetrains. In Proceedings of the 2018 IEEE International Power Electronics and Application Conference and Exposition (PEAC), Shenzhen, China, 4–7 November 2018; pp. 1–5. [Google Scholar] [CrossRef]
- Zia, U.; Hur, J. A Comprehensive Review of Winding Short Circuit Fault and Irreversible Demagnetization Fault Detection in PM Type Machines. Energies 2018, 11, 3309. [Google Scholar] [CrossRef]
- Garcia-Bracamonte, J.E.; Ramirez-Cortes, J.M.; de Jesus Rangel-Magdaleno, J.; Gomez-Gil, P.; Peregrina-Barreto, H.; Alarcon-Aquino, V. An Approach on MCSA-Based Fault Detection Using Independent Component Analysis and Neural Networks. IEEE Trans. Instrum. Meas. 2019, 68, 1353–1361. [Google Scholar] [CrossRef]
- Verma, A.K.; Radhika, S.; Padmanabhan, S.V. Wavelet Based Fault Detection and Diagnosis Using Online MCSA of Stator Winding Faults Due to Insulation Failure in Industrial Induction Machine. In Proceedings of the 2018 IEEE Recent Advances in Intelligent Computational Systems (RAICS), Thiruvananthapuram, India, 6–8 December 2018; pp. 204–208. [Google Scholar] [CrossRef]
- Thomson, W.T.; McRae, C.J. On-Line current monitoring to detect inter-turn stator winding faults in induction motors. In Proceedings of the 24th Universities Power Engineering Conference, Belfast, UK, 19–20 September 1989. [Google Scholar]
- Cardoso, A.J.M.; Cruz, S.M.A.; Fonseca, D.S.B. Inter-Turn Stator Winding Fault Diagnosis in Three-Phase Induction motors, by Park’s Vector Approach. IEEE Trans. Energy Convers. 1999, 14, 595–598. [Google Scholar] [CrossRef]
- Cruz, S.M.A.; Cardoso, A.J.M. Stator winding fault diagnosis in three-phase synchronous and asynchronous motors, by the extended Park’s vector approach. IEEE Trans. Ind. Appl. 2001, 37, 1227–1233. [Google Scholar] [CrossRef]
- Jung, J.H.; Lee, J.J.; Kwon, B.H. Online Diagnosis of Induction Motors Using MCSA. IEEE Trans. Ind. Electron. 2006, 53, 1842–1852. [Google Scholar] [CrossRef]
- Park, R.H. Two-reaction theory of synchronous machines generalized method of analysis-part I. Trans. Am. Inst. Electr. Eng. 1929, 48, 716–727. [Google Scholar] [CrossRef]
- Cardoso, A.J.M.; Saraiva, E.S. On-line diagnostics of three-phase induction motors, by Parks Vector. In Proceedings of the International Conference on Electrical Machines, Pisa, Italy, 12–14 September 1988; pp. 231–234. [Google Scholar]
- Henao, H.; Capolino, G.A.; Fernandez-Cabanas, M.; Filippetti, F.; Bruzzese, C.; Strangas, E.; Pusca, R.; Estima, J.; Riera-Guasp, M.; Hedayati-Kia, S. Trends in Fault Diagnosis for Electrical Machines: A Review of Diagnostic Techniques. IEEE Ind. Electron. Mag. 2014, 8, 31–42. [Google Scholar] [CrossRef]
- Song, M.H.; Park, K.N.; Han, D.G.; Yang, C.O. Auto-diagnosis for stator winding faults using distortion ratio of Park’s vector pattern. Trans. Korean Inst. Electr. Eng. 2008, 57, 160–163. [Google Scholar] [CrossRef]
- Yang, C.O.; Park, G.N.; Song, M.H. Study on distortion ratio calculation of park’s vector pattern for diagnosis of stator winding fault of induction motor. Trans. Korean Inst. Electr. Eng. 2012, 61, 643–649. [Google Scholar] [CrossRef]
- Cruz, S.M.A.; Cardoso, A.J.M. Rotor cage fault diagnosis in three-phase induction motors by Extended Park’s Vector Approach. Electr. Mach. Power Syst. 2000, 28, 289–299. [Google Scholar] [CrossRef]
- Barendse, P.S.; Herndler, B.; Khan, M.A.; Pillay, P. The application of wavelets for the detection of inter-turn faults in induction machines. In Proceedings of the 2009 IEEE International Electric Machines and Drives Conference, Miami, FL, USA, 3–6 May 2009; pp. 1401–1407. [Google Scholar] [CrossRef]
- Parra, A.P.; Enciso, M.C.A.; Ochoa, J.O.; Peñaranda, J.A.P. Stator fault diagnosis on squirrel cage induction motors by ESA and EPVA. In Proceedings of the 2013 Workshop on Power Electronics and Power Quality Applications (PEPQA), Bogota, CO, USA, 6–7 July 2013; pp. 1–6. [Google Scholar] [CrossRef]
- Cruz, J.P.; Panadero, R.P.; Sanchez, M.P.; Guasp, M.R.; Roman, J.M.; Bano, A.S. Cost-effective on-line fault diagnosis of induction motors using the reduced modulus of the current park’s vector. In Proceedings of the 2017 IEEE 11th International Symposium on Diagnostics for Electrical Machines, Power Electronics and Drives (SDEMPED), Tinos, Greece, 29 August–1 September 2017; pp. 427–433. [Google Scholar] [CrossRef]
- Skowron, M.; Wolkiewicz, M.; Kowalska, T.O.; Kowalski, C.T. Application of Self-Organizing Neural Networks to Electrical Fault Classification in Induction Motors. Appl. Sci. 2019, 9, 616. [Google Scholar] [CrossRef] [Green Version]
- Estima, J.O.; Cardoso, A.J.M. A New Approach for Real-Time Multiple Open-Circuit Fault Diagnosis in Voltage-Source Inverters. IEEE Trans. Ind. Appl. 2011, 47, 2487–2494. [Google Scholar] [CrossRef]
- Go, Y.J.; Lee, B.; Song, M.H.; Kim, K.M. A Stator Fault Diagnosis of an Induction Motor based on the Phase Angle of Park’s Vector Approach. J. Inst. ControlRobot. Syst. 2014, 20, 408–413. [Google Scholar] [CrossRef] [Green Version]
- Go, Y.J.; Song, M.H.; Kim, J.Y.; Choi, W.R.; Lee, B.; Kim, K.M. A New Algorithm for Analyzing Method of Electrical Faults of Three-Phase Induction Motors Using Duty Ratios Half-Period Frequencies According to Phase Angle Changes. Mechatronics and Robotics Engineering for Advanced and Intelligent Manufacturing. In Lecture Notes in Mechanical Engineering; Zhang, D., Wei, B., Eds.; Springer International Publishing: Cham, Switzerland, 2017; Volume 36, pp. 303–317. [Google Scholar]
- Spagnol, M.; Bregant, L.; Boscarol, A. Electrical Induction Motor Higher Harmonics Analysis Based on Instantaneous Angular Speed Measurement. In Advances in Condition Monitoring of Machinery in Non-Stationary Operations; Chaari, F., Zimroz, R., Bartelmus, W., Haddar, M., Eds.; Springer International Publishing: Cham, Switzerland, 2016; Volume 4, pp. 27–41. [Google Scholar] [CrossRef]
- IEC 60034-1. Rotating Electrical Machines—Part 1: Rating and Performance; IEC: Geneva, Switzerland, 2010. [Google Scholar]
- ANSI/IEEE Std. IEEE Recommended Practice for Electric Power Distribution for Industrial Plants; ANSI/IEEE Std.: New York, NY, USA, 1993. [Google Scholar]
- IEEE Std. 519. IEEE Recommended Practices and Requirements for Harmonic Control in Electrical Power Systems; IEEE Std.: New York, NY, USA, 1992. [Google Scholar]
- Chang, H.C.; Jheng, Y.M.; Kuo, C.C.; Hsueh, Y.M. Induction Motors Condition Monitoring System with Fault Diagnosis Using a Hybrid Approach. Engergies 2019, 12, 1471. [Google Scholar] [CrossRef] [Green Version]
- Kishan, S.H.; Gupta, S.P. Effect of voltage unbalance and stator inter turn short circuit on the characteristics of an induction motor. In Proceedings of the 2012 IEEE 5th India International Conference on Power Electronics (IICPE), Delhi, India, 6–8 December 2012; pp. 1–6. [Google Scholar] [CrossRef]
- Nguyen, V.; Seshadrinath, J.; Krishna, M.S.; Nadarajan, S.; Vaiyapuri, V. A Method for Incipient Interturn Fault Detection and Severity Estimation of Induction Motors Under Inherent Asymmetry and Voltage Imbalance. IEEE Trans. Transp. Electrif. 2017, 3, 703–715. [Google Scholar] [CrossRef]
- Mirafzal, B.; Demerdash, N.A.O. On innovative methods of induction motor interturn and broken-bar fault diagnostics. IEEE Trans. Ind. Appl. 2006, 42, 405–414. [Google Scholar] [CrossRef]
- Kohler, J.L.; Sottile, J.; Trutt, F.C. Condition monitoring of stator windings in induction motors. I. Experimental investigation of the effective negative-sequence impedance detector. IEEE Trans. Ind. Appl. 2002, 38, 1447–1453. [Google Scholar] [CrossRef]
- Lee, S.B.; Tallam, R.M.; Habetler, T.G. A robust, on-line turn-fault detection technique for induction machines based on monitoring the sequence component impedance matrix. IEEE Trans. Power Electron. 2003, 18, 865–872. [Google Scholar] [CrossRef]
- Bouzid, M.B.K.; Champenois, G. New Expressions of Symmetrical Components of the Induction Motor Under Stator Faults. IEEE Trans. Ind. Electron. 2013, 60, 4093–4102. [Google Scholar] [CrossRef]
- Gonzalez-Cordoba, J.L.; Osornio-Rios, R.A.; Granados-Lieberman, D.; Romero-Troncoso, R.D.J.; Valtierra-Rodriguez, M. Correlation Model Between Voltage Unbalance and Mechanical Overload Based on Thermal Effect at the Induction Motor Stator. IEEE Trans. Energy Convers. 2017, 32, 1602–1610. [Google Scholar] [CrossRef]
- Dorrell, D.G.; Makhoba, K. Detection of Inter-Turn Stator Faults in Induction Motors Using Short-Term Averaging of Forward and Backward Rotating Stator Current Phasors for Fast Prognostics. IEEE Trans. Magn. 2017, 53, 1–7. [Google Scholar] [CrossRef]
- Berzoy, A.; Mohammed, O.A.; Restrepo, J. Analysis of the Impact of Stator Interturn Short-Circuit Faults on Induction Machines Driven by Direct Torque Control. IEEE Trans. Energy Convers. 2018, 33, 1463–1474. [Google Scholar] [CrossRef]
- Zidani, F.; Benbouzid, M.E.H.; Diallo, D.; Nait-Said, M.S. Induction motor stator faults diagnosis by a current Concordia pattern-based fuzzy decision system. IEEE Trans. Energy Convers. 2003, 18, 469–475. [Google Scholar] [CrossRef]
- Siddique, A.; Yadava, G.S.; Singh, B. A review of stator fault monitoring techniques of induction motors. IEEE Trans. Energy Convers. 2005, 20, 106–114. [Google Scholar] [CrossRef]
- Xu, Z.; Hu, C.; Yang, F.; Kuo, S.; Goh, C.; Gupta, A.; Nadarajan, S. Data-Driven Inter-Turn Short Circuit Fault Detection in Induction Machines. IEEE Access 2017, 5, 25055–25068. [Google Scholar] [CrossRef]
- Yin, S.; Ding, X.; Xie, X.; Luo, H. A Review on Basic Data-Driven Approaches for Industrial Process Monitoring. IEEE Trans. Ind. Electron. 2014, 61, 6418–6428. [Google Scholar] [CrossRef]
- Maraaba, L.; Al-Hamouz, Z.; Abido, M. An Efficient Stator Inter-Turn Fault Diagnosis Tool for Induction Motors. Energies 2018, 11, 653. [Google Scholar] [CrossRef] [Green Version]
- Yoash, L.; Juri, B.; Baimel, D. A Tutorial on Dynamics and Control of Power Systems with Distributed and Renewable Energy Sources Based on the DQ0 Transformation. Appl. Sci. 2018, 8, 1661. [Google Scholar] [CrossRef] [Green Version]


| Description | Value |
|---|---|
| Power | 0.75 [kW] (1 [HP]) |
| Input Voltage | 220 [V]/380 [V] |
| Full Load Current | 3.8 [A]/2.2 [A] |
| Supply Frequency | 60 [Hz] |
| Number of Pole | 4 |
| Number of Rotor Slot | 44 |
| Number of Rotor Slot | 36 |
| Full Load Torque | 0.43 [kg·m] |
| Rated Speed | 1690 [rpm] |
| No. | 1–3 | 3–5 | 5–7 | 7–9 | 9–11 |
|---|---|---|---|---|---|
| Turn short | 2(ITSC) | 4 | 6 | 8 | 12 |
| No. | Max Value [A] | Min Value [A] | Peak-to-Peak [A] | Average Value [A] |
|---|---|---|---|---|
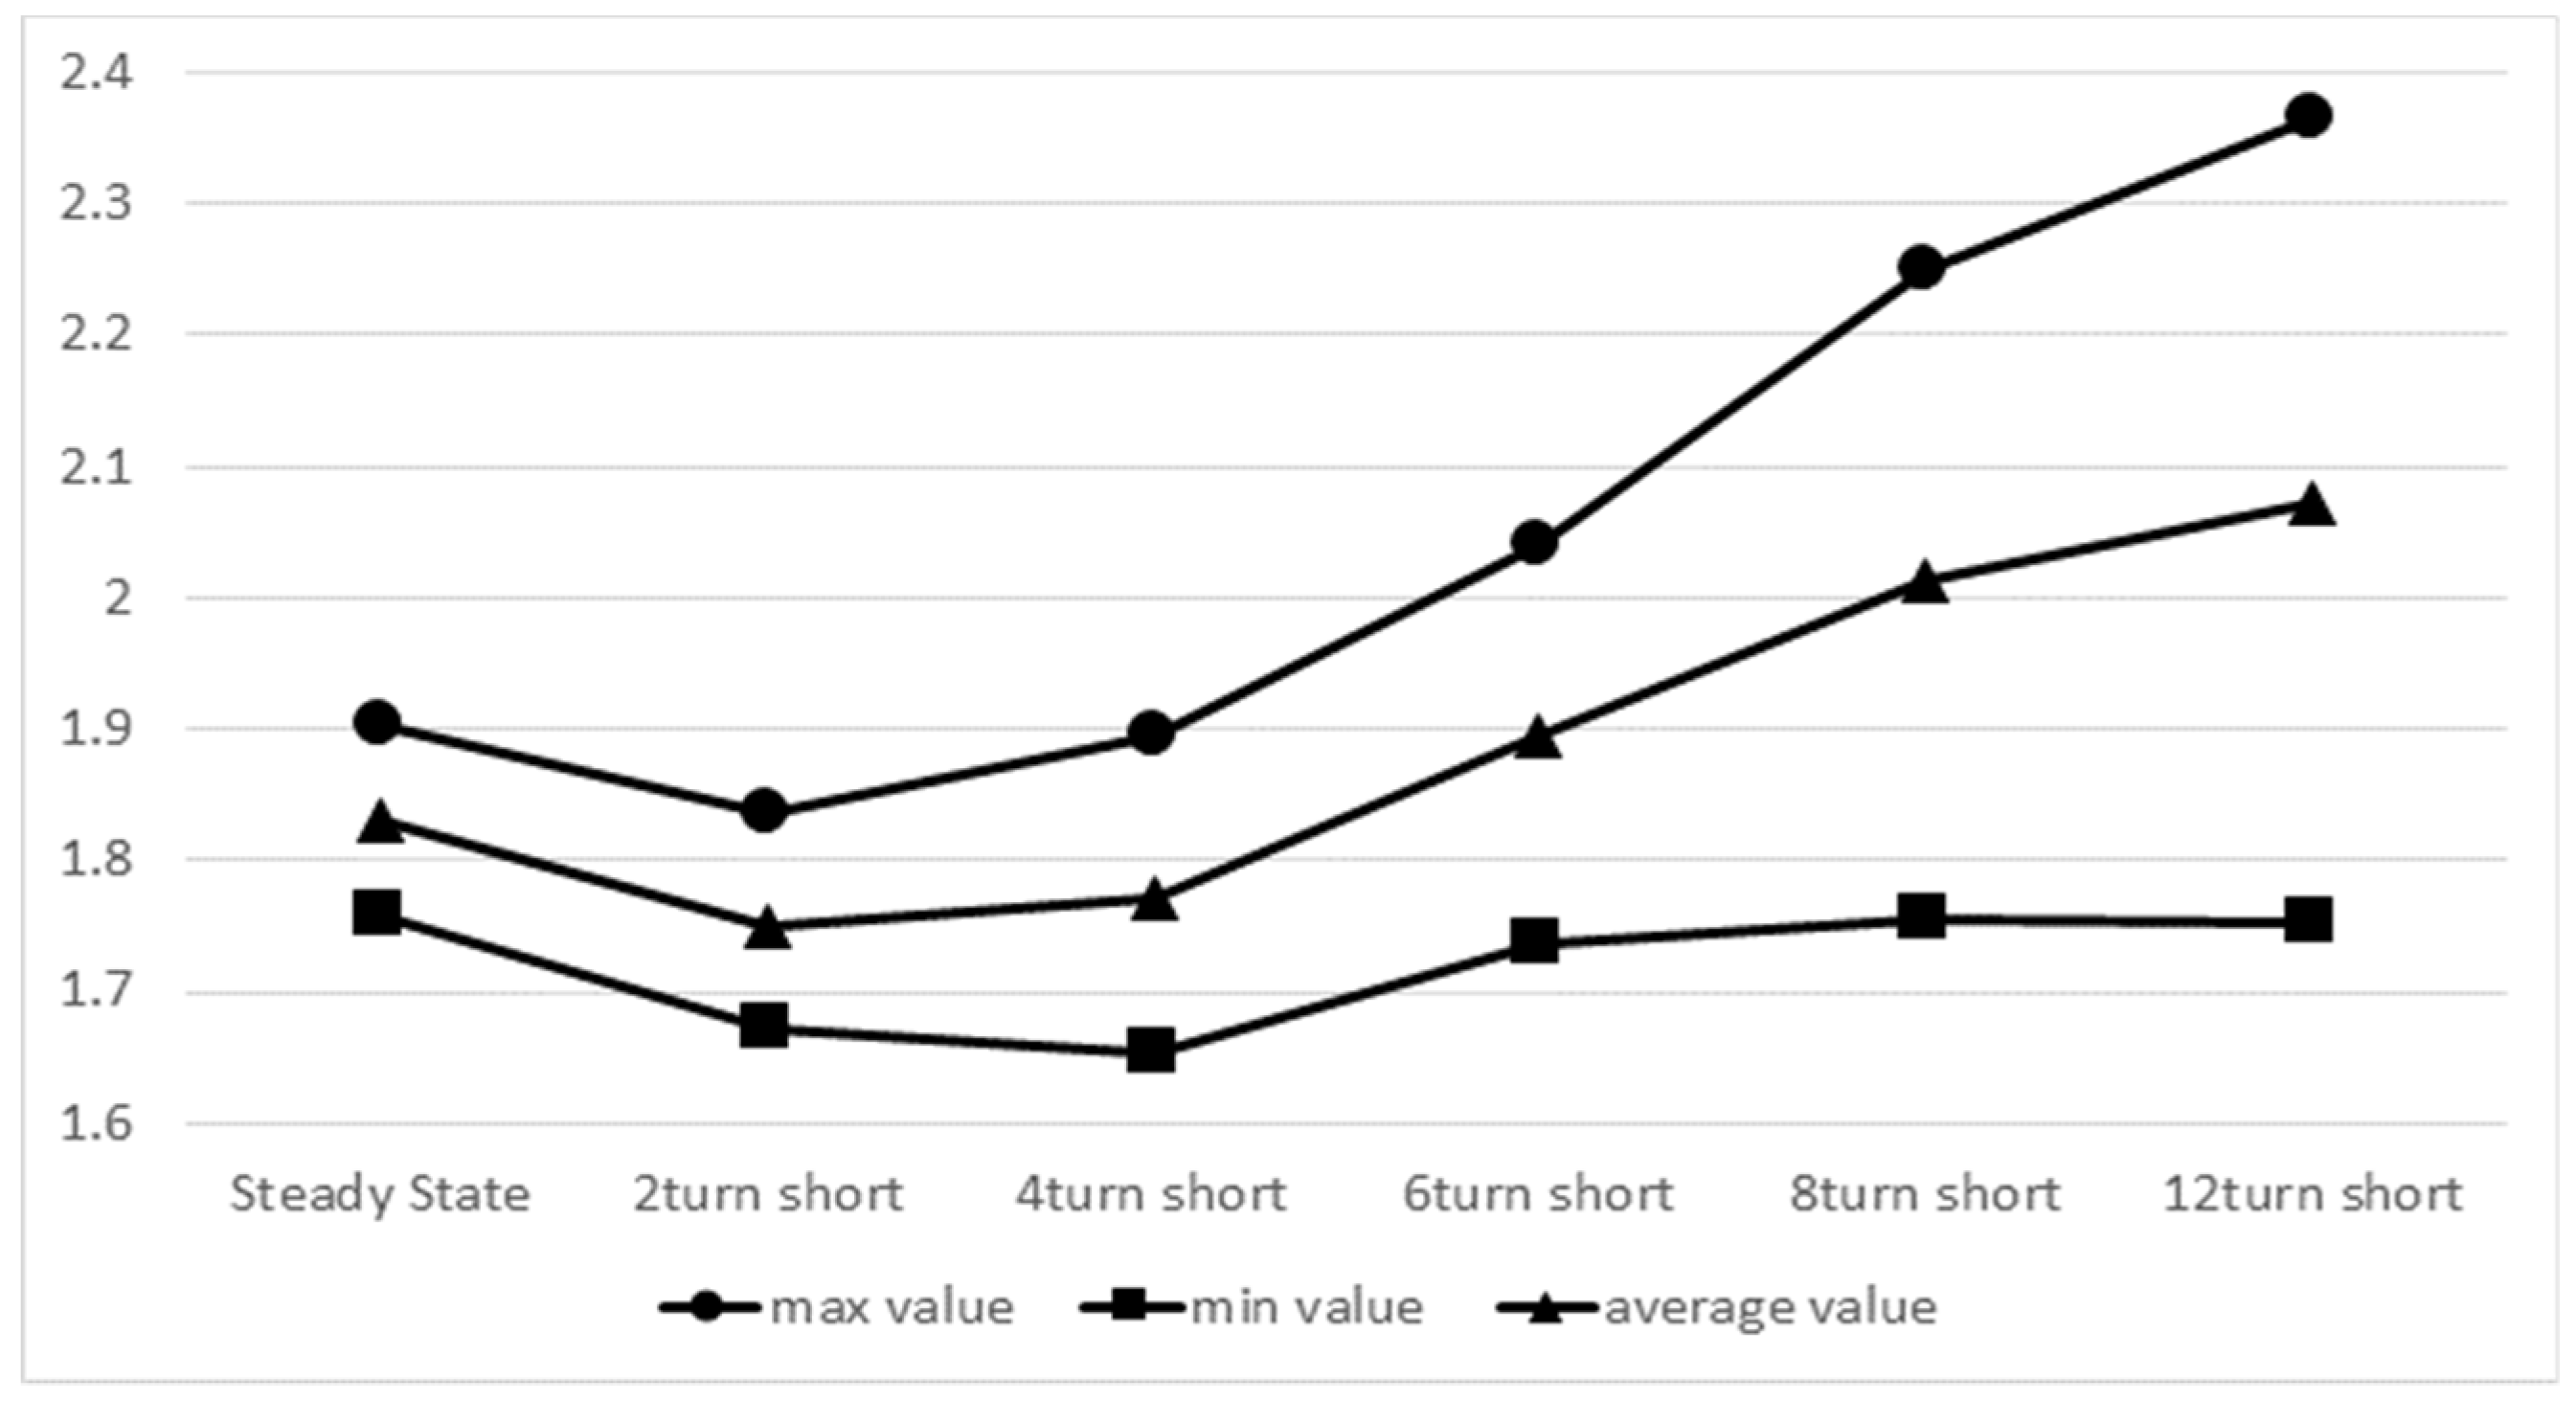
| Steady-State | 1.9026 | 1.7586 | 0.1439 | 1.8303 |
| ITSC | 1.8364 | 1.6717 | 0.1647 | 1.7503 |
| 4-Turn short | 1.8949 | 1.6531 | 0.2418 | 1.7722 |
| 6-Turn short | 2.0391 | 1.7363 | 0.3027 | 1.8949 |
| 8-Turn short | 2.2496 | 1.7564 | 0.4931 | 2.0141 |
| 12-Turn short | 2.3636 | 1.7514 | 0.6122 | 2.0715 |
© 2019 by the authors. Licensee MDPI, Basel, Switzerland. This article is an open access article distributed under the terms and conditions of the Creative Commons Attribution (CC BY) license (http://creativecommons.org/licenses/by/4.0/).
Share and Cite
Goh, Y.-J.; Kim, O. Linear Method for Diagnosis of Inter-Turn Short Circuits in 3-Phase Induction Motors. Appl. Sci. 2019, 9, 4822. https://doi.org/10.3390/app9224822
Goh Y-J, Kim O. Linear Method for Diagnosis of Inter-Turn Short Circuits in 3-Phase Induction Motors. Applied Sciences. 2019; 9(22):4822. https://doi.org/10.3390/app9224822
Chicago/Turabian StyleGoh, Yeong-Jin, and On Kim. 2019. "Linear Method for Diagnosis of Inter-Turn Short Circuits in 3-Phase Induction Motors" Applied Sciences 9, no. 22: 4822. https://doi.org/10.3390/app9224822