1. Introduction
The field of Virtual Reality (VR) has been an area of interest for both research and development for the past five decades. With the advancement of technology, specifically miniaturization of computing hardware and improved display technology, the field is finally going mainstream [
1]. Indeed, the advancement of consumer grade VR devices, e.g., Oculus Rift, HTC Vive, Gear VR etc., has opened new ways for people to interact with technology. In general, the user-interaction paradigm for VR is an extension of how people interact with the computing systems using a graphical user interface (GUI). The concept of GUI revolves around the concept of direct manipulation (DM), where the user uses some input device to directly manipulate the content on a two-dimensional (2D) display, and receives an immediate feedback of its action, e.g., point and click, dragging, etc.
The VR on the other hand is a different medium, where the content is not only displayed in a true three-dimensional (3D) environment, but also because of the VR device, the user loses the ability to directly observe the input devices, e.g., mouse and the keyboard, which renders the current DM user interface paradigm not well suited for 3D immersive VR environments. Therefore, for an immersive VR environment, it is necessary to explore different types of user interface paradigms that are better suited for natural user interaction (NUI) without means of a physical input device. A natural user interface (NUI) allows people to interact with the technology without the need of intermedial devices for the user interaction; these interactions rather take place directly using hand gestures or body movements. Thus, it is very important to understand how an NUI can be used in a 3D user interface as an effective means of Human Computer Interaction (HCI).
Moreover, a number of new input devices, e.g., Kinect, Leap Motion, Holo Lens, Magic Leap, etc. are ushering in the new era of HCI systems. These devices allow the user to control any 3D user interface using hand or body gestures, be it on a desktop system or a VR environment. A 3D User Interface (UI) design is now becoming a critical area for developers, students, and researchers to understand. The use of VR visualization and natural interactive gestures can increase the user’s engagement, which results in enhanced usability and user experience [
2].
In the past decade, the use of VR has increased tremendously. It has been employed in a number of industries and is powering many different types of interactions. A number of novel and innovative user interfaces have been created for VR applications. These interfaces have changed the way people interact with VR environments and result in truly unique experiences.
A 3D VR application should be useful compared to a 3D non-VR application because VR results in higher immersion, uses natural skills, and provides immediacy of visualization. However, one of the limitations of many current 3D VR applications is that they either support only simple interactions or have serious usability problems [
1].
3D UI design is an area ripe for further work, the development of which is often referred to as new exciting areas of research in HCI today, providing the next frontier of innovation in the field [
1]. There are already some applications of 3D UIs used by real people in the real world (e.g., walkthroughs, psychiatric treatment, entertainment, and training). Most of these applications, however, contain 3D interaction that is not very complex. More complex 3D interfaces (e.g., immersive design, education, complex scientific visualizations) are difficult to design and evaluate, leading to a lack of usability. Better technology is not the only answer—for example, 30 years of virtual environment (VE) technology research have not ensured that today’s VEs are usable [
1]. Thus, a more thorough treatment of this subject is needed [
1].
Within a 3D human-computer interaction mode, user’s tasks are performed in a 3D environment, and the spatial context is extended to the third dimensions. 3D interaction involves either 3D input devices (such as hand gesture or physical walking) or 2D input devices (such as mouse) mapped into a 3D virtual location. 3D UIs as the intermediary between the human and the machine become the medium where different users directly perform the tasks within the spatial context of a 3D domain. In carrying out different tasks, users’ commands, questions, intents, and goals are communicated to the system, which in turn must provide feedback with information about the status and flow for the execution of the tasks [
1].
As the interaction mode is an important aspect in a 3D environment, more natural interaction modes need to be explored. One type of NUI is the gesture-based interaction. When a person uses hands, arms, face, or body to convey some information, it is deemed as a gesture. In the first place, a gesture is recognized by tracking the motion of hands, arms, face, or body. Afterward, the gesture is interpreted and mapped to a meaningful action within the context of the application. Saffer [
3] has identified the following advantages of gestural interfaces against traditional interfaces: (1) more natural interactions; (2) less heavy or visible hardware; (3) more flexibility; and (4) more fun. Gesture recognition can be used in many areas. Some of the application domains that employ gesture interaction are VR, gaming, desktop and mobile applications, telepresence, sign language, and robotics. This work only focuses on hand gestures.
The UI design and usability depend a lot on the type of input device used in a 3D UI. Additionally, the display characteristics can affect 3D interaction performance, for example, when employed for VR, Head Mounted Displays (HMDs) block out the visibility of one’s hands, body, and the overall surroundings. If the user cannot see the input device then using it with good hand eye coordination is a challenging task. Therefore, it is imperative to develop a user interface that does not require the actual visibility of the hands or the body, because the user will not be comfortable moving within a physical environment with this limitation.
Among the variety of applications used, the desktop is the most commonly used environment used by billions of people every day. The metaphor is used widely on desktop computers and part of it is employed in the form of the home screen design of mobile devices. As VR becomes even more ubiquitous, a successful translation of the desktop environment from the computers and mobile devices to the 3D environment is imminent. Therefore, it is important to design and analyze the usability and user experience of various user interaction paradigms in an immersive VR desktop environment.
Therefore, the objective of this work is to propose an answer to the following question, what is the most suitable interaction mode for the desktop environment in immersive VR? Consequently, a new dual-layered 3D UI is proposed that allows the user to perform common desktop tasks in a VR environment. The proposed 3D UI allows the user to visualize the content on a 360-degree wide field of view, in the form of multiple curved screens. The gaze mechanism is used to switch between the screen layers and the interaction layer. The interaction layer allows the user to perform simple tasks related to a desktop environment. In order to test the new 3D UI, three user interaction modes are implemented. Finally, a comprehensive user study is performed using a mixed methods approach to validate its usability and user experience both qualitatively and quantitatively.
In order to study the feasibility of the proposed new 3D UI and draw conclusions about the suitability of the three different interaction modes for a variety of tasks in an immersive VR 3D desktop environment, the main contributions of this work are:
Designed a novel dual-layer 3D UI that allows the user to interact with multiple screens portrayed within a curved 360-degree effective field of view available for the user.
Designed a context-aware UI using the eye gaze mechanism to move between the two layers of the proposed 3D UI and for performing certain tasks.
Developed and implemented three different interaction modes: point-and-click interaction, controller-based DM interaction, and a gesture-based interaction to evaluate the proposed 3D UI.
Performed a user study using a mixed-methods approach to quantitatively and qualitatively validate the usability and user experience of the new 3D UI using three interaction modes.
Employed the current state of art technology, HTC Vive headset and its controllers, and Leap Motion controller for developing three interaction modes for 3D desktop environment in the immersive VR.
In the following sections, first the literature review is presented, followed by the methodology, user study, experiment setup, results, data analysis, and finally the conclusions that discuss the findings, limitations, and future work.
3. Methodology
The basic idea of this work is to evaluate a new 3D UI using both device-based and gesture-based user interactions for an immersive VR 3D desktop environment. The proposed UI is a dual-layer 3D UI that allows the user to interact with multiple screens portrayed within a curved 360-degree effective field of view available for the user. Downward gaze allows the user to raise the interaction layer that facilitates several traditional desktop tasks, such as selecting a different type of file to open, deleting a file, duplicating a file, etc. Thus, the three different interaction modes are point-and-click, controller-based DM, and gesture-based interaction. Based on each interaction mode, the three UIs are named accordingly. Then, a mixed-methods approach is used to perform a comprehensive user study for both the usability and user experience analysis of all the three UIs.
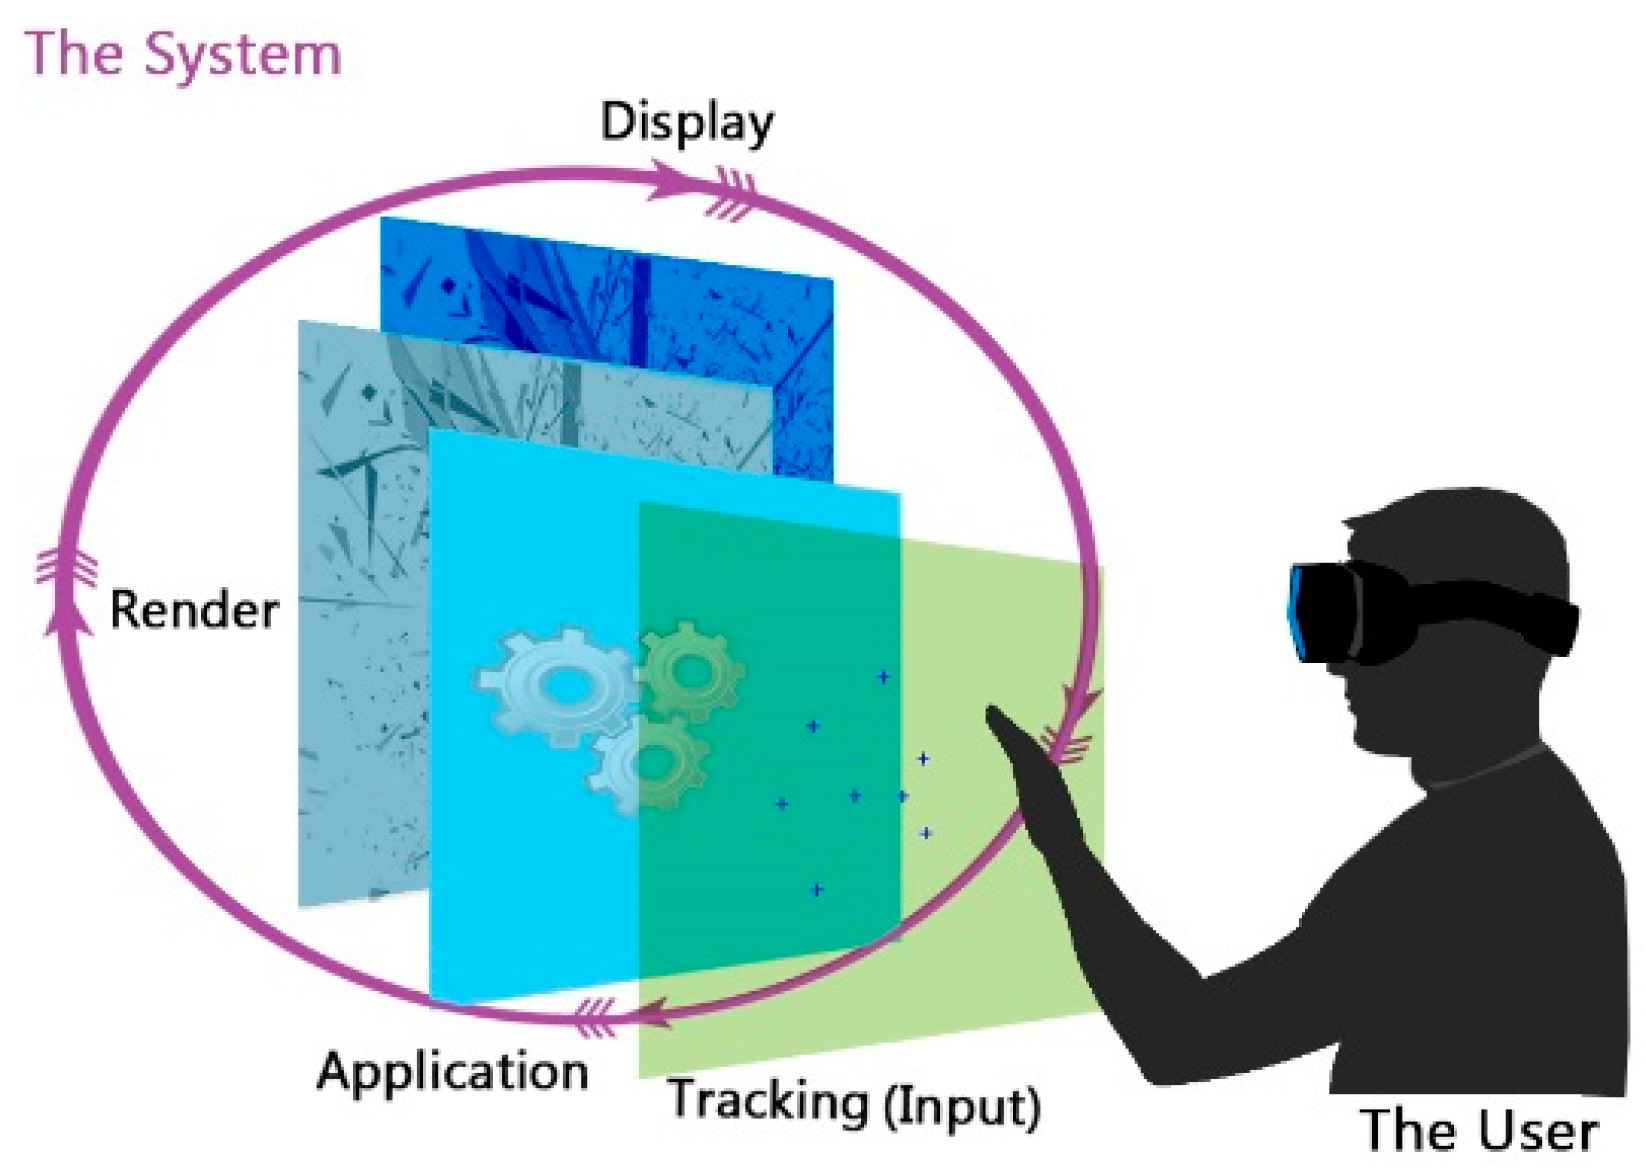
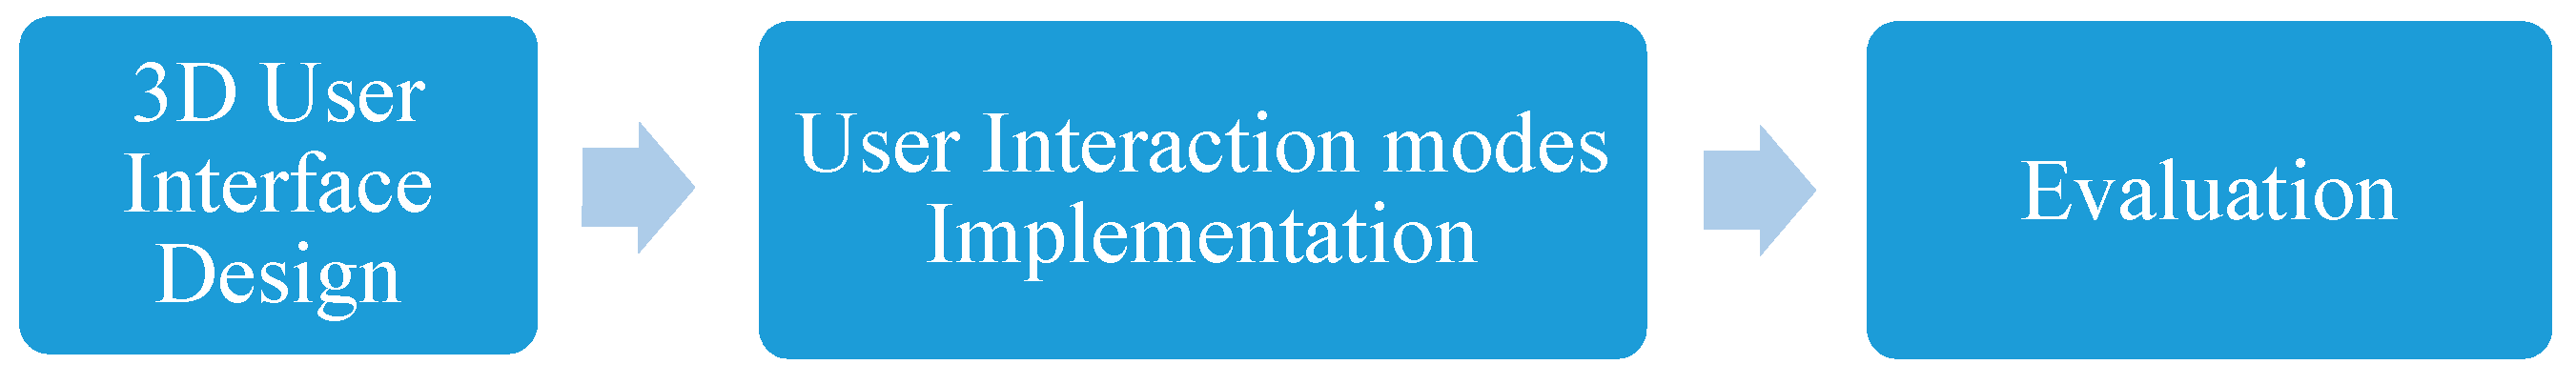
Like any system, the proposed 3D desktop system for the immersive VR has inputs (i.e., physical input device or natural gestures as system commands), and outputs that allow the user to control the 3D desktop tasks. The input will be translated through the 3D UI into actions that are used to perform a variety of tasks in an immersive VR 3D desktop. The block diagram of the proposed methodology decomposed into three stages is shown in
Figure 3. The first stage is designing the 3D UI. The second stage is implementing and developing the different interaction modes. The third stage is evaluation, to analyze the usability and user experience of the UI using the three different interaction modes. The following sections shed more light on these stages.
3.1. 3D User Interface Design
Since immersive VR has a different medium, where the content is displayed in a 3D environment, a new 3D UI had to be designed to suit this environment. The designed 3D interface is different than the traditional 2D desktop, where all the files and tasks are carried out in a 2D space and on the same layer.
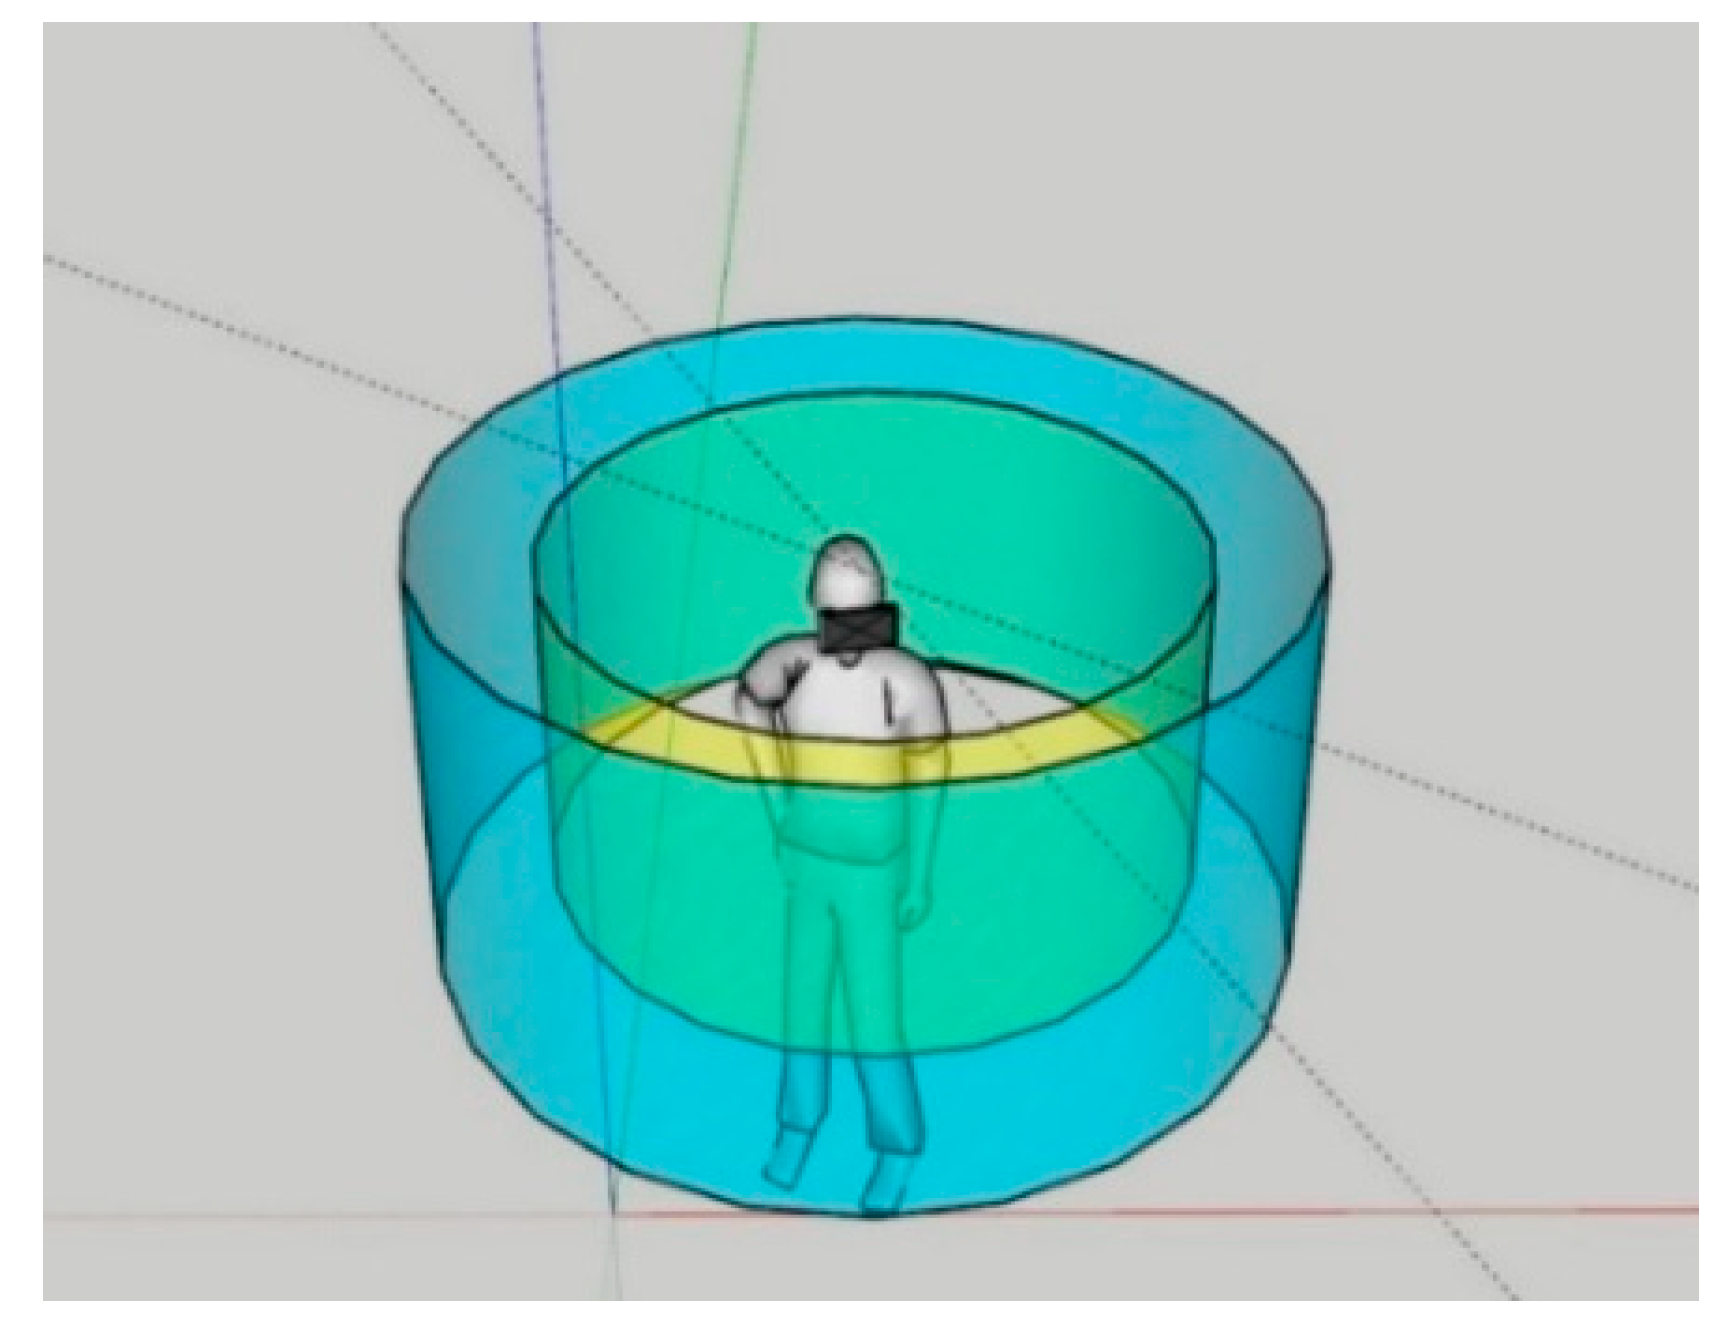
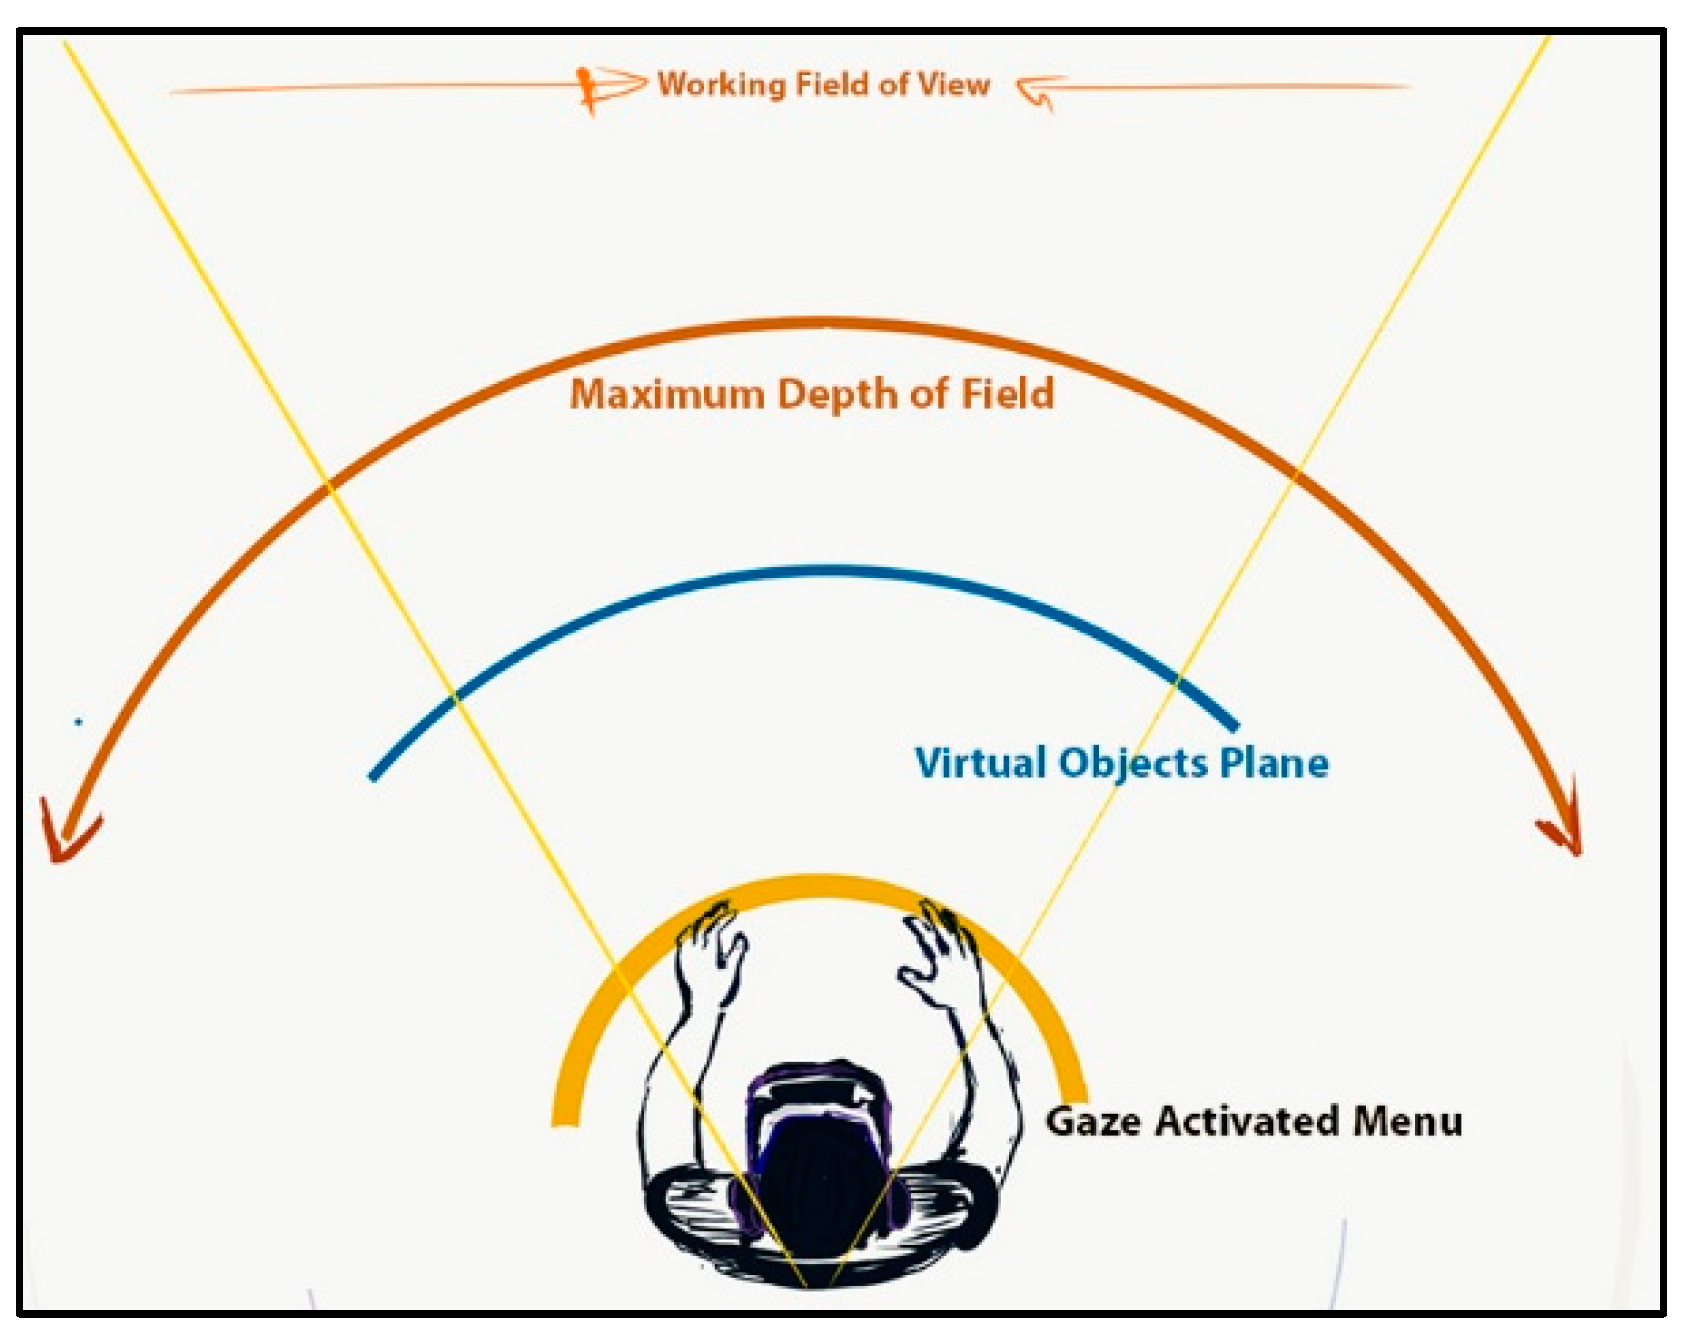
The proposed 3D UI is a dual-layer UI consisting of two main layers with curved screens (
Figure 4). The upper layer (screen layer) is used for displaying the opened files. It allows the user to interact with multiple screens portrayed within a curved 360-degree effective field of view available for the user. While the lower layer (interaction layer) contains the traditional desktop tasks e.g., delete, duplicate, etc. Downward gaze allows the user to raise the interaction (lower) layer that facilitates several traditional desktop tasks. The effective field of view (FOV) of the 3D UI from the top is shown in
Figure 5.
Based on the three different interaction modes, the three UIs are named accordingly. The three interfaces are Point-and-Click UI, Controller-based DM UI, and Gesture-based interface. A visualization of the three UIs design showing the two layers is found in
Figure 6,
Figure 7 and
Figure 8, respectively.
The gaze-based selection mechanism is used in the 3D UI as a context-aware mechanism to move between the two layers, and to perform certain tasks. Applying the context-aware gaze tracking activates the intended layer/object. For example, looking down makes the lower layer active, while looking up makes the upper layer active.
In addition to that, gaze is used to choose an object within a curved screen at the upper layer to make it active and then the user can perform the task on that object. The term object is used to refer to different types of files available in the 3D UI, e.g., images, videos, and folders. Specifically, for the video files, the gaze mechanism is used to play the video, and when the user moves his gaze away from the video, it will be paused automatically.
The user can display and access the menu that contains the different types of objects by either flipping his/her left hand for the gesture-based interaction, or by flipping the left controller for the controller-based DM interaction. Whereas, in the point-and-click UI, the menu is always presented at the lower layer. A visualization of the lower layer menu in the three UIs is shown in
Figure 9, whereas the flipping menus can be seen in
Figure 10 and
Figure 11.
3.2. Interaction Tasks
Several tasks can be performed by the users through the proposed 3D UI for the immersive VR desktop. As mentioned earlier, the context-aware gaze tracking is used to indicate which specific object is active, and then the specific task is performed on this object.
The manipulation and system control tasks available in the 3D UI are as follows:
Open/Select: allows to select and open an object from the menu.
Close: allows to close an object displayed in the selected space.
Scroll: allows the movement (scrolling) of the layer in the x-axis of 3D space.
Scale: allows zooming in or zooming out on all objects displayed in the selected space.
Duplicate: allows to make a copy of an object on the lower layer by first selecting the duplicate button and then selecting the intended object.
Delete: allows to remove an object from the lower layer by first selecting the delete button and then selecting the intended object.
The design of the 3D UI takes into consideration the design principles such as affordance, feedback, consistency, and visibility. For example, to maintain the consistency in the design, similar tasks operations are used, and similar elements are used for the similar tasks. The two layers are used in all the interfaces, where the upper layer is used for displaying objects and the lower layer for interaction to perform the desktop tasks. The rationale being that having consistent interfaces are easier to learn and use. In addition to that, feedback is provided to the user about what has been done, e.g., when the delete/duplicate button is clicked on, a green highlight feedback was provided.
In a traditional user interaction, most of the interaction is typically performed using a keyboard input, mouse movement, and/or button pressing. These combinations can be attached to intuitive gestures defined by the movements of the hands alone or combined with fingers. Not only to make the interaction more natural and easier, but to also consider the three theoretical determinants of anticipated usefulness, ease of use, and behavior intention of the unified framework for the Technology Acceptance Model (TAM) and Reasoned Action Theory (RTA) [
35]. These determinants are shared across a range of different models that investigate user’s adoption of novel technology, see for instance early VR adoption in therapeutic studies [
36]. In the following sections, the three different interaction modes are presented in more detail.
3.3. Point-and-Click Interaction
In this interface, the basic mouse interaction for the traditional desktop is adapted to a 3D laser pointer using one of the Vive controllers. The pointer has a blue laser light that gives an indication about where it is pointing to. Both hands can be independently used to control the pointer. Developing the idea of the laser pointer with some clicks, the user can interact with the 3D desktop in the immersive VR environment. An example of the user interaction in the point-and-click UI is shown in
Figure 6. As mentioned above, the Vive controller is used to simulate the 3D laser pointer. The Vive controller has several input methods and only two of them are used, the trigger and trackpad. The trigger button is used for the tasks of opening, deleting, duplicating, and closing, where the users need to point to the intended place and then click the trigger. While the trackpad is used for scrolling and scaling tasks. The users need to move one finger on the touchpad right or left for scrolling, and up or down for scaling (zoom in or zoom out respectively). A summary of the desktop tasks and their corresponding interactions using the point-and click UI is found in
Table 1. The menu is always displayed at the lower layer, the user can point and choose any type of objects.
3.4. Controller-Based DM
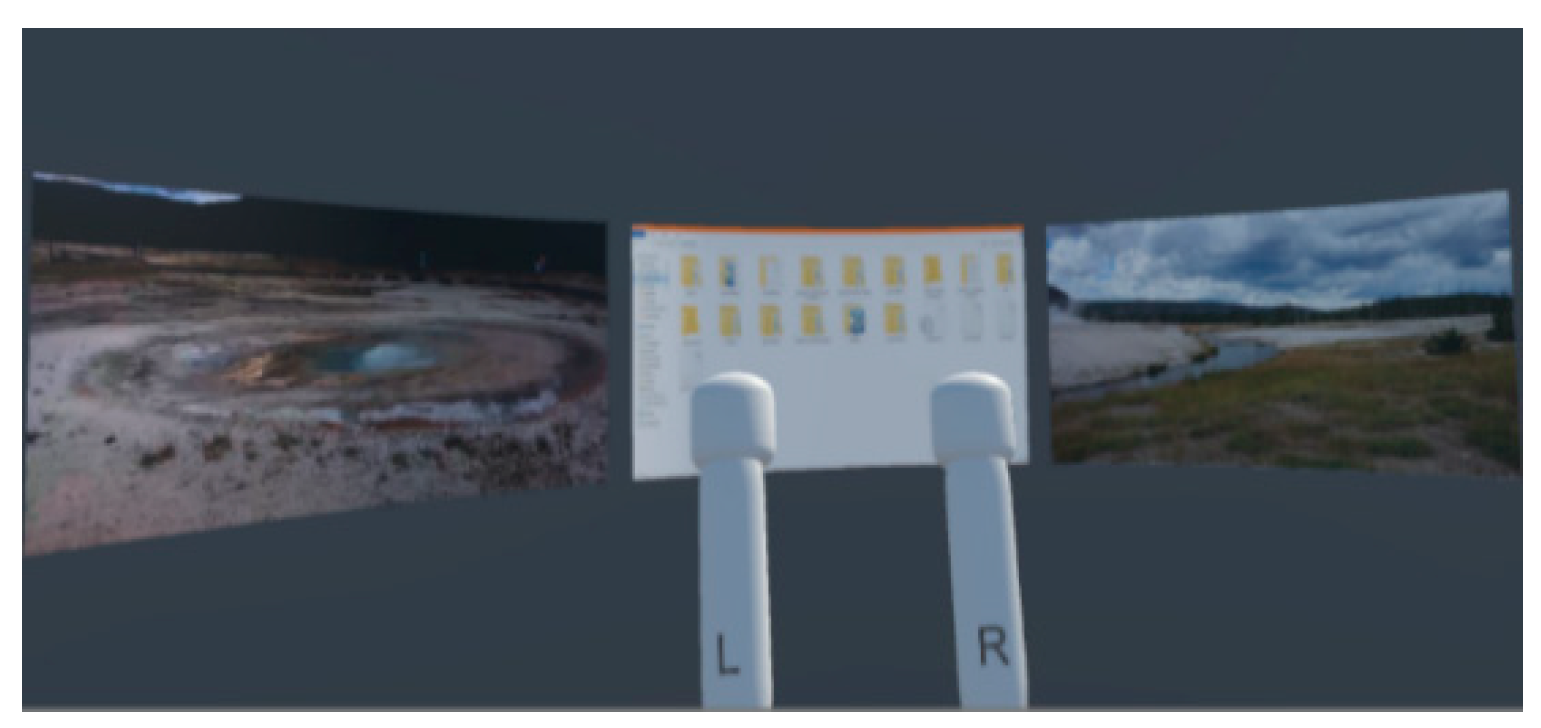
In this interface, a pair of Vive controllers is used for developing the interaction mode. The user uses both controllers to interact with objects in the immersive VR 3D desktop environment. The Vive controllers have sensors that are tracked by the base stations. A combination of controller’s inputs and movements was used to perform the desktop tasks. An example of user interaction in the controller-based DM UI is found in
Figure 7. A visualization of both controllers (right and left) is also presented on the 3D UI, where each controller is named by a letter “R” or “L” to distinguish between them. Only two input methods for the Vive controller are used, the trigger button and grip button. The user can open, delete, and duplicate by pushing/taping the intended objects using one of the controllers (right or left one), it does not matter. While to close a certain object, the user needs to press the grip button using one of the controllers (right or left one), it does not matter. To perform the scrolling task, the user should move one controller right or left, while keeping the trigger button clicked on. Whereas to perform the scale task, the user should use both controllers; by moving the controllers away from each other (zoom in) or towards each other (zoom out), while keeping the trigger button on both controllers clicked on. A summary of the tasks and their corresponding interactions using the controller-based UI is found in
Table 1. The user can display and access the menu that contains the different types of objects by flipping the left controller only.
3.5. Gesture-Based Interaction
In the gesture-based UI, the user performs a certain set of hand gestures to manipulate the common desktop tasks in the immersive VR environment. The natural UI should always be designed on specific users and with use context in mind [
3]. The aim is to focus on the common natural hand gestures that users know and can apply from their lives; taking advantage of their existing knowledge. Introducing completely new gestures is out of the scope of this work as it would enforce a new learning curve that might be hard for the users to learn and remember. The design took into consideration that the same hand gestures could have different meanings in different cultures [
11]. Therefore, the aim was to choose the most common natural hand gestures based on the people’s level of familiarity with mobile devices and touch screen input. For example, people can directly perform an in-air tap gesture, similar to the tap gesture on the touch screen. Additionally, pinch to zoom and slide to scroll are very familiar gestures. Finally, the only novel gesture is closing a window by closing the fists. It does not directly relate to a touch-based gesture, but it conforms to the task description and consequently should result in a quicker recall.
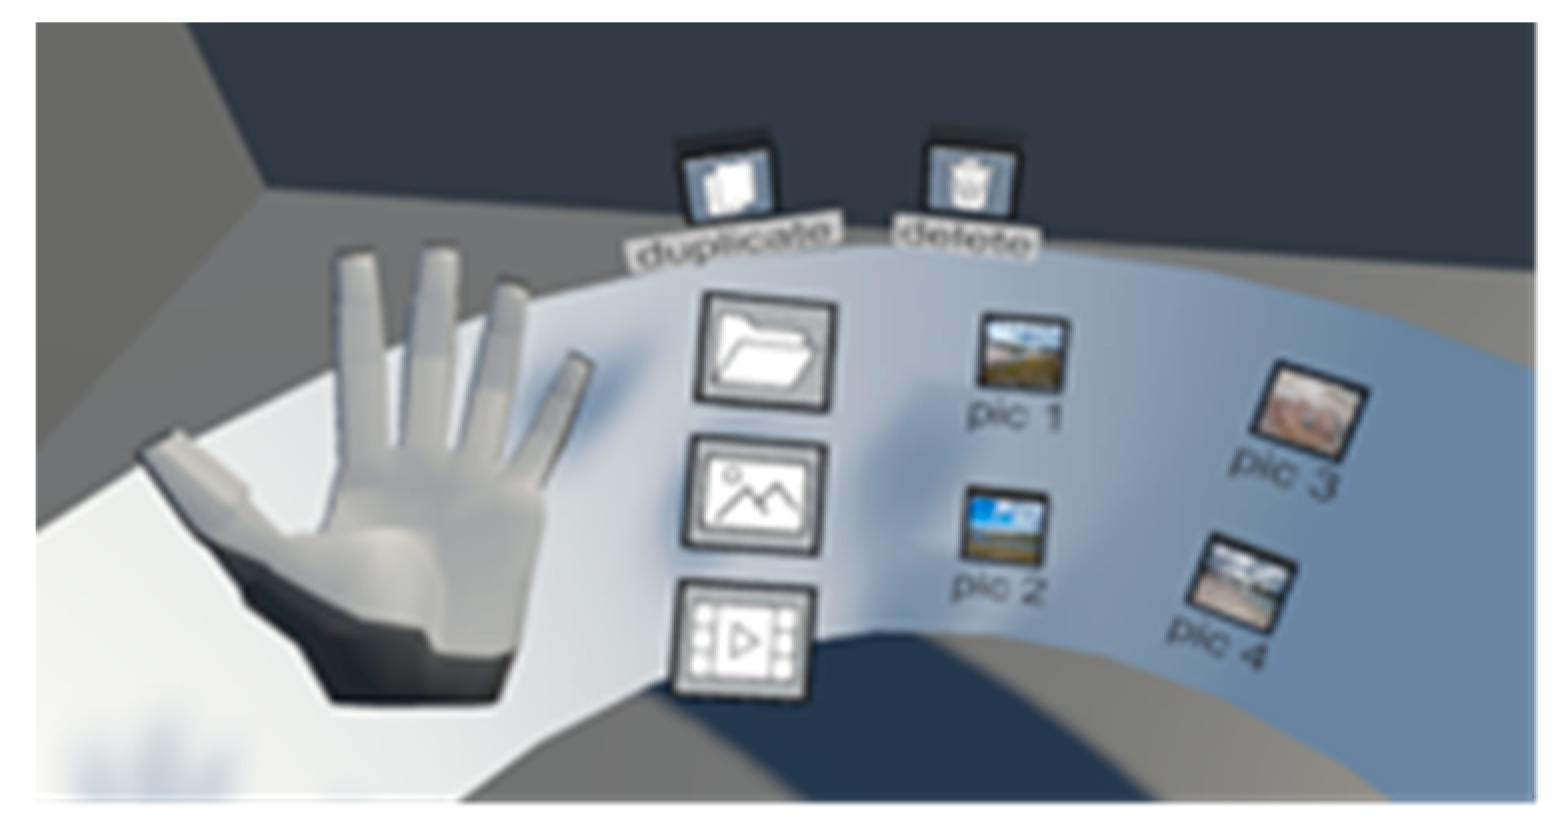
An example of the user interaction in the gesture-based UI, showing the visualization of the user’s hands as well, is found in
Figure 8. Each task in the interface is assigned a different hand gesture. The proper script is activated when the user’s hand is recognized performing the intended gesture. The Leap Motion device is used for hand gesture recognition. A summary of the tasks and their corresponding hand gestures interactions using the gesture-based UI is found in
Table 2. The users can display and access the menu that contains the different types of objects by flipping their left hand only.
Figure 12 shows the employed gesture recognition algorithm. After acquiring and processing the data from the Leap Motion controller, the system is able to recognize the hand gestures without the need to have predefined gestures or calibration. The gesture classification is subject independent, which means that obtaining subject specific parameters during the training phase is not needed to be used in the testing phase. In addition, given the nature of the gestures, and the data acquired from the Leap Motion, the gestures are recognized using heuristics rather than a classification method.
4. User Study and Experiment Setup
4.1. Experimental Evaluation
To evaluate the viability of the proposed 3D UI, a user study was performed to analyze the three different interaction modes for an immersive VR 3D desktop environment. In addition, other user evaluation methods popular in the HCI field were also performed. The aim was to provide a comprehensive usability study in terms of the following standard usability issues: precision, efficiency, effectiveness, ease-of-use, fatigue, naturalness, and overall satisfaction. In addition to the user experience; the way users feel about the UI using the three different interactions mode for 3D desktop in an immersive VR environment. The work in [
37] presented a summary for the common types of AR user evaluation, which can also be applied for VR user evaluation. User evaluation means evaluating the work through user participation. A mix of the user evaluation techniques available in the literature to analyze the usability and user experience for each interface were employed. The mixed of the user evaluation techniques used in this study are:
Observational methods;
Query techniques.
4.2. Observation Methods
During the testing sessions in the controlled experiment, the following observation methods were used:
Direct observation: the participants were asked to use the think-aloud protocol; where the users were observed performing a task; while they were to describe what they were doing and why, what they think was happening, etc. Most of the users managed to apply the think-aloud techniques during the testing to give direct feedback, others were mostly focused on fulfilling the requested tasks.
Indirect observation: the users’ activities were tracked e.g., analyzing the recorded video, eye gaze, footstep movements, and errors occurred.
4.3. Query Technique
Two query techniques were employed:
Semi-structured interview: the participants were interviewed after testing each UI under each condition (the different interactions modes and the VR experience) as well after finishing the whole usability test (exit interview). The interview was guided by a script of one closed question for each interaction. The question was about how they assess their success level for each interaction (easily completed or completed with difficulty or help). The exit interview was about the overall feedback on the whole experience and the UI design. It gives a good balance between feedback and replicability. Some interesting issues were explored in more depth.
Questionnaire: a comprehensive questionnaire including a clear purpose of study was developed, with different styles of question e.g., closed, open-ended, scalar, multi-choice, and ranked. The questionnaire was designed by combing different usability questions based on the standard questionnaires available in the literature to suit the context. The questionnaire was used at the end of the testing session, the participants were requested to rate their satisfaction on a scale of 1 to 5 (5 for strongly agree and 1 for strongly disagree) for features on all the interfaces under each experimental condition, and to complete an overall satisfaction questionnaire.
The questionnaire consisted of five main parts as follows:
- Part 1:
Personal Information
- Part 2:
Point-and-click UI
- -
Standing VR Experience
- -
Seated VR Experience
- Part 3:
Controller-based DM UI
- -
Standing VR Experience
- -
Seated VR Experience
- Part 4:
Gesture-based UI
- -
Standing VR Experience
- -
Seated VR Experience
- Part 5:
Overall Experience
In Parts 2, 3, and 4, three sets of questions in each part were designed. One set of questions for user satisfaction on selected usability goals, the second set of questions for user satisfaction on the idea of menu for accessing the different folders/categories of objects, and the last set for selecting the user experience from predefined answers that contain both positive and negative user experiences. Moreover, these three parts were repeated for each UI under both experience conditions, standing and seated positions. The last part in the questionnaire was designed for the overall user experience which contains multi-choice, ranked, closed and open-ended questions.
Based on the data collected from the above evaluation techniques, an appropriate qualitative and quantitative analysis was used to analyze the data and provide a comprehensive usability study. In the following sections, both the qualitative and quantitative analysis are discussed.
4.4. Quantitative Analysis
During the testing session, various forms of quantitative data were measured: the task completion time, the scenario completion time, number of eye gazes, and footstep movements. Task time refers to the individual time taken for each task in the test case scenario. Based on these measures, the average completion time of the task and scenario for each interaction modes under each condition (standing and seated) were calculated. This result was used to determine if there could be any correlation between the usability, the UX and the mean time spent on each interaction mode. Both simple quantitative analysis and statistical technique for further analysis were employed, as described below.
Number of eye gaze and footstep movements were calculated manually from video recordings that were captured during the testing session using a camera placed in front of the participants.
Simple quantitative analysis: numerical methods were used to analyze the completion time as follows:
- -
Percentages, averages, maximum, minimum.
- -
Graphical representations of data.
Statistical technique: a two-way repeated analysis of variance (ANOVA) was used to check if the user interfaces were significantly different from each other under various factors. The independent variables factors that were used in the study are:
Factor 1: the input devices (pointer, controller, gesture) or they can be called interaction modes.
Factor 2: the experiences (standing, seated) positions.
4.5. Qualitative Analysis
Both the questionnaire and unstructured interviews provided different elements of the qualitative data. The qualitative data was categorized into questionnaire results, and user feedback from the interviews.
A simple qualitative analysis was used to express the nature of elements and was represented as patterns by categorizing data and looking for critical incidents. Feedback from users’ interviews was divided in three categories: positive, negative, and neutral for the overall experience and the UI design and their success level for each interaction (easily completed or completed with difficulty or help). Simple numerical methods were employed to analyze the results of the closed questions from the questionnaire e.g., weighted average and percentage. Following this, a visual representation of the qualitative data was made by putting the frequency of each category into a chart. This way, it was possible to see whether there was a consensus about the UX and usability for each interaction mode.
The last part in the questionnaire was designed for the overall user experience which contains multi-choice, ranked, closed and open-ended questions. User interaction and menu questionnaires can be seen in
Appendix A.
4.6. Experiment Setup
The experiment setup included the hardware and software used, the participants that contributed to the experiment, the experimental conditions, and finally the experiment workflow.
This work utilized three types of hardware, HTC Vive, Leap Motion controller, and a laptop with Core i7 and GeForce Ti 1050. HTC Vive was used as the immersive VR display. The HTC Vive controllers were used to implement the pointer and controller-based interfaces. Leap Motion was used to implement the gesture-based interface. For the software part, Unity was used to construct the VR environment as it is a cross-platform game engine with a built-in IDE developed by Unity Technologies. Leap Motion Orion SDK was used for the hand tracking.
4.7. Participants
The participants were selected through random sampling/selection on ease of access and their availability. Since the usability study was conducted in the context of a specific application, the target user population was defined to evaluate the most diverse user population possible in terms of age, and gender, and community group. It was ensured that there were enough participants to get a valid and feasible result. Therefore, a collaboration of 21 volunteer users (11 female and 10 male), aged from 18 to 55 (the majority between 25 and 34), randomly from a pool of 40 was assembled. They were from different community groups, most of them from the university. These community groups included faculty members (4), university students (7), administrative staff (7), and others (3). Some of the participants (5 out of 21) had experience in using VR systems.
4.8. Experimental Condition
In the experiment, a random assignment was applied, where the participants for the sample were assigned at random to experimental control conditions during the testing session to avoid a biased user experience.
The two experimental conditions in the work are as follow:
Each participant tested the interface under each condition. There were three interaction modes/input devices and two experiences; therefore, in total there were six permutations of tests for each user. The participant tested each interaction in both experiences, e.g., the point-and-click interaction was tested twice for standing and seated positions separately. The assignment for the order on how each participant tested each interface is shown in
Table 3.
The study employed a total of 21 participants. Based on condition 1 the participants were divided into three equal groups of seven participants each based on the initial interface. Therefore, the point-and-click group (total of seven), controller-based group (total of seven), and the gesture-based group (total of seven). Then each group was divided into two groups. For example, the point-and-click group was dived into group 1 and group 2, where each one started with the point-and click interface but with a different sequence for the remaining interfaces. The same procedure was applied exactly for the controlled-based group and the gesture-based group. For condition 2, the experience, all the groups in condition 1 had the same sequence of experiences.
The sequence for the experience was assigned based on the interface’s sequential order in condition 1. For example, in the first interface of all group sequences in condition 1, the user started the testing in standing then seated position. While for the second interface in all group sequences in condition 1, the user started the testing in seated then standing position. Finally, for the third interface in all group sequences in condition 1, the user started the testing in standing then seated position. As mentioned before the random assignment was done to avoid any biased user experiences that may have occurred as much as possible.
4.9. Experimental Workflow
In this work, a controlled experiment was performed, using a within-subjects experimental design. In the controlled experiment, the room setup and the hardware setup were kept, particularly the position of the base stations, the same for all participants; to avoid disrupting the tracking process and the required setting up of the testing area again, which may affect the reliability of the experiment. In within subjects design, each participant tested the UI using the three interaction modes under each condition for both standing and seated positions.
The experiment started with a short introduction to the immersive VR 3D desktop environment, its goals, the 3D UI, the hardware (HMD and controllers) used, the three different interaction modes, and a reference to the questionnaire to be completed at the end of the experiment.
After going through the introduction, the observer performed a live demonstration in front of the user on how to interact with the 3D UI using the three interaction modes. All the tasks and how to perform it using the three interaction modes were explained in detail to the user. The demonstration was repeated with the same specific order for all the participants as follows: starting with the point-and-click UI, then the controller-based DM UI, and finally the gesture-based UI.
4.10. Testing Procedures
As shown in
Figure 13, during the testing session both the participants and the observer had tasks to perform. The experimental conditions were discussed in detail earlier in this section. The testing session started by asking the participant to perform a sequence of specific tasks by the observer for each interface.
The sequence of specific tasks (scenario) that the participant needed to perform was identified in advance. The use of the scenario was to ensure that users performed every type of possible task on the UI at least once. The same case scenario was applied to all interfaces using the two positions, standing and seated. During the testing session, the observer was monitoring the user performance by recording the completion time for each task and for the scenario in both standing and seated positions using each interaction mode, also by taking down relevant information e.g., errors and success rate. All the testing sessions were videotaped for further observations.
The test case scenario used in the experiment consisted of the following tasks:
- -
Open video 1 and play it and then open folder #3.
- -
Zoom in and out the objects on the upper layer.
- -
Duplicate folder #2.
- -
Scroll right and left and close the opened video.
- -
Delete picture #4.
Finally, the participant was asked to complete an online comprehensive questionnaire about each tested UI and the overall experience to gather quantitative data about the UX and usability (see
Appendix A for questionnaire). The feedback from the users for each interaction and for overall feedback on the experience and UI design (exit interview) was collected that was used for further analysis.
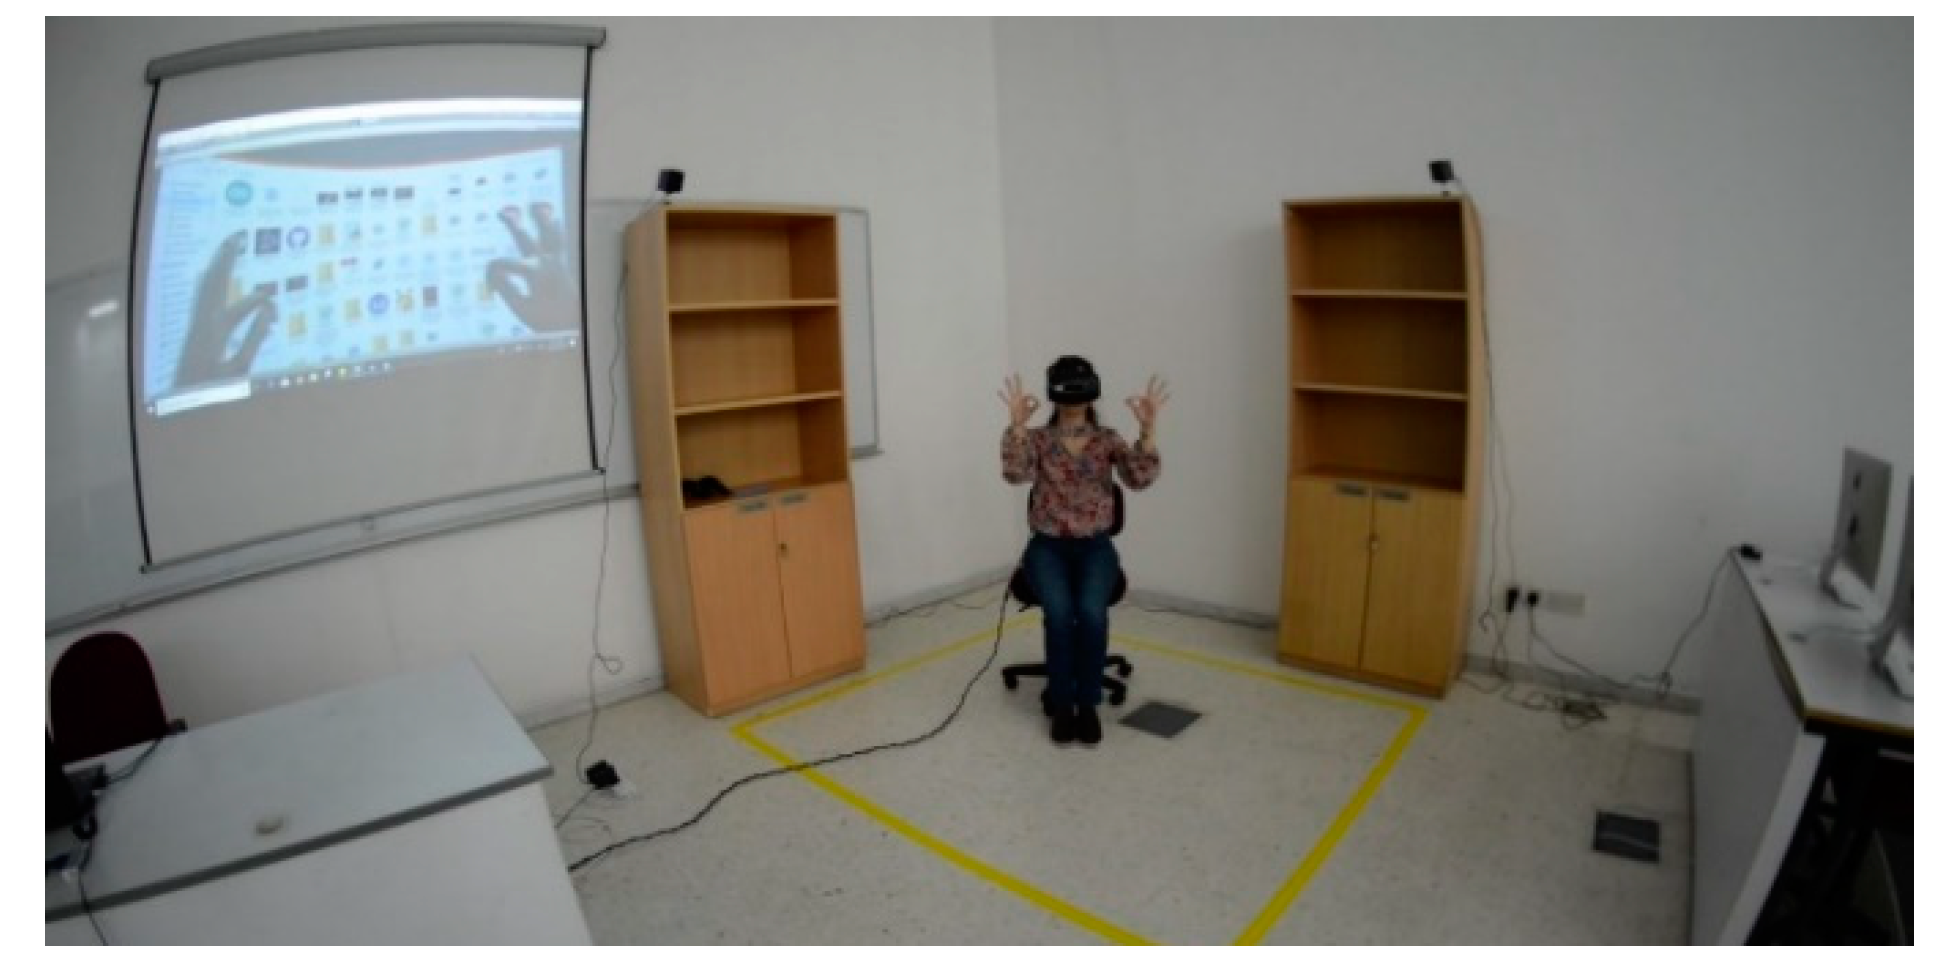
Figure 14 and
Figure 15 show two of the participants in a testing session in standing and seated positions.
5. Results and Data Analysis
The results from the main study provided a comprehensive dataset to be analyzed through statistical analysis. In the following sections, the results and analysis are presented for scenario completion time, task completion time, two-way ANOVA, observations and interview results, questionnaire results, and finally the summary and findings. All the data analysis was performed using the Data Analysis tool in Excel.
5.1. Scenario Completion Time
The scenario completion time refers to the total time taken to complete the test case scenario that is explained in
Section 4. The scenario completion time was measured for each user interaction mode and for each experience.
Completion Time by Interaction Mode: the time taken to complete the scenario by each participant for each user interaction mode can be seen in
Table 4, with the minimum, maximum, and mean times at the bottom. In general, the maximum time ranges from 108 s (pointer-based) to 136 s (gesture-based). Similarly. The minimum time ranges from 34 s (pointer-based) to 47 s (gesture-based). This shows that the pointer-based interface is the preferable mode of interaction for the user even in a VR environment because of their familiarity with the interface.
Completion Time by Experience: the time taken to complete the scenario by each participant for each user experience, standing and seated, can also be seen in
Table 4.
As can be seen in
Table 4, the overall maximum time ranges from 131 s (standing) to 136 s (seated). Similarly, the minimum time ranges from 34 s (seated) to 36 s (standing). The mean time for completing the tasks in standing experience is 72.92 s and in seated experience is 69.32 s. This shows that the difference between their individual means and grand mean (68.12 s) is not significant enough regarding the results for completion time. The grand mean is the mean of sample means or the mean of all observations combined, irrespective of the sample.
Completion Time by Initial Interface: the time taken to complete the scenario by a participant in each initial interface group can be seen in
Table 5, with minimum, maximum, and mean times shown at the bottom. The maximum time ranges from 109 s (controller-based) to 101 s (gesture-based). Similarly, the minimum time ranges from 44 s (pointer-based) to 75 s (controller-based). This shows that the controller-based interface is the least preferable mode of interaction for the user.
Completion Time by Gender: the time taken to complete the scenario by male and female participants for each user interaction mode and experience can be seen in
Table 6. There were 10 male and 11 female participants. Based on the initial condition of the UI and random assignments used in the experiment, four out of 10 males started with point-and-click UI (group 1), another four out of 10 males started with controller-based UI (group 2), and two out of 10 males started with gesture-based UI (group 3). While three out of 11 females started with point-and-click UI (group 1), another three out of 11 females started with controller-based UI (group 2), and five out of 11 females started with gesture-based UI (group 3). As can be seen in
Table 7, the maximum time for completing the tasks by gender for each interaction mode varies according to the users. Furthermore, the summary shows that for male participants, the difference between individual means of each interaction mode and grand mean (67.38 s) is significant enough regarding the results for completion time. Whereas, for female participants, the difference between individual means of each interaction mode and grand mean (77.20 s) is not significant enough regarding the results for completion time.
5.2. Task Completion Time
The average time taken to complete each individual task by all participants for each combination of user interaction mode and experience (six combinations of tests) is depicted in
Table 8. The average task completion time in the point-and-click UI is shorter than the other two interfaces for both experiences. The maximum task completion time is 15.9 s for task 5 (scroll) in gesture-based UI—standing experience, while the minimum is 5.48 s for the task 5 (scroll) also, but in the point-and-click UI—seated experience. For further analysis the average of a specific task which is the open task that occurred twice in the test case scenario was computed (task 1: open a video file, and task 2: open and a folder file). The results can be seen in
Table 9. It was found that the average time for the open task (included both experiences) in point-and-click UI is 7.98 s, while in controller-based UI took 11.35 s, and in gesture-based UI took 10.74 s. In general, this shows that the open task can be performed faster in the point-and-click UI than the other two interfaces.
5.3. Analysis of Variance (ANOVA)
Among the different factors under evaluation, a two-way repeated ANOVA was carried out for the two independent variables:
- -
The interaction modes or input device (pointer vs. controller and gesture).
- -
The experience (standing vs. seated).
The following analysis shows standard deviation and means for different variables in the forms of Mvariable (e.g., Mpointer is the mean for pointer-based interaction) and SDvariable (e.g., SDstanding is the standard deviation for standing experience). Moreover, F (df, MS) is the test statistic (F-ratio) in which df and MS are the degrees of freedom and mean square, respectively, for the variables. The F-ratio was calculated using MSvariable(s)/MSerror(s) and
p is the probability value. All analyses was concluded at alpha of 0.05 significance level and for 21 participants. The results are presented in
Table 10.
The null hypothesis was tested for the effect of different interaction modes on the scenario completing time using the two-way repeated ANOVA. The hypothesis here is: “All three interaction modes will give the same interaction experience in terms of time.” To reject the null hypothesis or not, the following conditions need to be satisfied:
The analysis illustrates that for variable 1, the interaction modes: F (2,6556.357) = 14.613, p = 0.00000209 (Mpointer = 57.81, SDpointer = 3.08 vs. Mcontroller = 72.95, SDcontroller = 3.03 vs. Mgesture = 82.60, SDgesturer = 3.59). The p-value < alpha (0.05). This illustrates that interaction mode has a significant effect on time.
For variable 2, the experience: F (1,408.960) = 0.911, p = 0.341 (Mstanding = 72.92, SDstanding = 3.09 vs. Mseated = 69.32, SDseated = 2.76), the p-value > alpha (0.05), which illustrates that the experience position does not have a significant effect on time.
Moreover, the analysis shows no significant effect on time for variables 1 and 2 combined F (1,14.198) = 0.0316, p = 0.969, the p-value > alpha. Therefore, it can be concluded that interaction modes and experience did not have any combined effect on the time. Based on the above, the null hypothesis is rejected meaning that interaction modes significantly affect the time taken to complete the scenario in the 3D UI.
5.4. Observation and Interview Results
The results of different observations collected during the testing session with analysis of the video recordings are presented in this section. The observations include the number of eye gazes, the footstep movements, and the errors. In addition, the interview results which include the user feedback for each interaction and for the overall experience of performing the desktop tasks in the immersive VR environment using the 3D UI design are also presented.
Number of Eye Gazes: all the video recordings for the 21 participants were analyzed, specifically the video of initial interface for each participant under the standing experience only. The number of eye gazes were calculated for a specific task, which was task 2 (open a specific folder) in the test case scenario. Ideally, the user needs two gazes only to perform the open task using the 3D UI, one gaze at the lower (interaction) layer to choose the intended file, and the second gaze to look at the upper (screen) layer to view the opened file. The number of eye gazes for each participant for that specific task were calculated manually. It was found that all users were able to perform the task using two gazes only. This shows a good indication that the participants were able to understand the 3D UI design and interact with it effectively.
Number of Footsteps: the users’ footstep movements during the testing session by observing the movement outside the defined boundary mentioned in
Section 3 were analyzed. Additionally, for certain cases, the video recordings were watched for further confirmation. It is to be noted that the interface does not rely on any type of lower body motion, e.g., walking. The purpose of tracking footsteps is to find if there is any design flaw associated with the interface that results in user making physical movements that are not required. The analysis did not find any significant effect of the footstep movements on the UI or interaction modes. None of the participants went outside the defined boundary, rather a slight movement in terms of rotation was noticed since the 3D UI allows to interact with multiple screens portrayed within a curved 360-degree effective field of view available for the user. It was concluded that there is no significant relationship between the physical movement and the interactions modes.
Error Analysis: during the testing sessions, the observer observed and wrote the comments for any errors that might occur in each UI. The observation did not find any significant errors in any UI. Rather, some participants forget how to perform certain tasks. For example, in the point-and-click UI, one participant forgot how to perform the close task. This suggests that the need to enhance the visibility of the close button, either in terms of size, color, or label. It is intended to be explored in future work. While in the controller-based DM UI, one participant forgot how to perform the close task using the controller twice in standing and seated positions. Another one forgot how to perform the scroll task. An additional participant forgot to switch the controllers; the user was trying to display the menu using the right controller. The reason might be that the training given to the users was short. This will be explored in the future work.
Interview Results: the participants were interviewed after each UI test under each condition of the experience. The interview was guided by a script consisting of one closed question. The question was “how do you assess your success level for completing the scenario using each interaction mode? (Answers: 1. easily completed or 2. completed with difficulty or help)”. As seen in
Table 11, the results show a higher percentage for completing the scenario easily using the pointer-based interface (90.48% for standing, 85.7% for seated), followed by the gesture-based interface (90.48% for standing, 76.19% for seated), finally the controller-based interface (71.73% for standing, 85.71% for seated).
In addition to that, the participants were asked a general question about the overall experience after finishing the whole usability test (exit interview). Most of the users had a positive experience with the 3D UI and an overall pleasing and productive experience.
5.5. Questionnaire Results
Participants were asked 26 questions to rate their satisfaction for each interaction. The same survey was employed for both standing and seating experiences. The interaction satisfaction questionnaire can be seen in the
Appendix A. Furthermore, five questions were asked about their satisfaction with the provided menu system in that particular interaction. This questionnaire can be seen in the
Appendix B. For each question, the participants were asked to rate their satisfaction from 1 to 5 (5 for strongly agree, 4 for agree, 3 for neutral, 2 for disagree, 1 for strongly disagree). The rating weighted average for each question was calculated, as seen in Equation (1), where: w = weight of answer choice, and x = response count for answer choice.
The majority of the weighted average results were 4 and above, which means that the usability goals are met with more than 80% approval.
For the user experience results, the highest percentages in all UIs were for the following answers: “satisfying”, “enjoyable”, “fun”, and “wonderful”. This shows that most of the users had a positive experience with the 3D UI and an overall pleasing and productive experience.
5.6. Summary and Findings
Table 12 shows the answers of the interface ranking for the most suitable interface for 3D desktop in VR environment by the participants. The average ranking was calculated as follows, where: w = weight of ranked position, x = response count for answer choice.
The first choice has a weight of 3, the second choice has a weight of 2, and the third choice has a weight of 1. As seen in the table above, the point-and-click interface has the largest value for average ranking, therefore it is the most preferred UI according to user feedback, followed by the controller-based interface as the second highest choice and finally the gesture-based interface as the third highest choice.
The ranking in
Table 12 and
Table 13 shows that the most suitable interface for the desktop VR environment chosen by participants was the point-and-click UI (57.14%), followed by the gesture-based interface (33.33%), and finally the controller-based UI (9.52%). User’s familiarity with the point-and-click interface can be one reason for being the most preferred interface by the participants for the desktop on VR. The percentage for the gesture-based interface shows a promising capability for utilizing the gesture as an interaction mode in the desktop VR. The reason for the lowest percentage for the controller-based interface could be that most of the users are not familiar with controller’s device, in addition to the short training given.
Although the previous results show that the point-and-click UI is the most preferred interface for the desktop in VR from the participant’s point of view, a further analysis reveals that participants are still preferring to perform some certain tasks using the other interaction modes. For example, as seen in
Table 14 they prefer to perform the scale task using the controller-based interface, but the gesture-based to display the menu.
For each task available in the 3D UI, its corresponding preferred interface from a participants’ point of view are as follow:
- -
Close: Both point-and-click UI and gesture-based UI (42.86%).
- -
Open: Point-and-click UI (57.14%).
- -
Scroll: Point-and-click UI (47.62%).
- -
Scale: Controller-based UI (38.10%).
- -
Delete: Point-and-click UI (52.38%).
- -
Duplicate: Point-and-click UI (61.90%).
- -
Display the menu: Gesture-based UI (52.38%).
Table 15 shows that 52.38 % of the participants prefer to keep the interaction simple in the 3D UI for the desktop in VR using one interaction mode only. While 47.62% prefer to implement a hybrid approach by combining the gesture-based interaction and physical-device based interaction. The results are very close and point towards a hybrid approach as future research.
6. Conclusions and Future Work
In the following section the final concluding discussion and limitations of the work are presented followed by the future work.
6.1. Discussion
This work presented a new dual-layered 3D UI for a 3D desktop environment in Virtual Reality. The UI allows the user to visualize the desktop screens on a 360-degree wide effective field of view. A downward gaze raises the secondary layer that allows the user to perform common desktop tasks. The UI was evaluated using three different interaction modes. The pointer-based point and click interface along with a controller-based DM interface use the physical device. The UI was also evaluated using a gesture-based controller free user interaction mode. A comprehensive qualitative and quantitative user study was performed to validate both the usability and user experience of the 3D UI.
The user study shows that the pointer-based interface is fastest in terms of task completion time, with more than 80% of the users expressing satisfaction with the interface in terms of both usability and the user experience. The average task completion time in the pointer-based interface is shorter than the other two interfaces for both experiences, which if considered within a TAM point of view is related to the anticipated ease of use and usefulness to complete the task within this mode.
The two-way repeated ANOVA was used with a null hypothesis for the effect of different interaction modes on the scenario completion time. The results show that the interaction modes significantly affect the time taken to complete the scenario in the 3D UI. While the standing or seated experience did not have any effect on time, this can also be read as an indication that participant behavioral intentions and attitudes towards completing the task were not influenced with body positions and the perceived control over actions either being seated or standing. The results of the different observations collected show that the users understand the proposed 3D UI design and interact with it effectively in terms of number of eye gazes needed. The footstep analysis did not find any significant relationship between body movement and the interaction modes. The results of interview show a higher percentage of support for completing the scenario easily using the pointer-based interface, which supported by the questionnaire results for the most suitable interface for desktop VR. Where the results shown in
Table 13, confirm that the point-and-click UI (57.14%) is the most suitable interface, then the gesture-based interface (33.33%), finally the controller-based UI (9.52%).
Although the results show that the point-and-click UI is the most preferred interface for the desktop in VR from the participants’ point of view, participants still prefer to perform some tasks using other interaction modes. For example, they prefer to perform the scale task using controller-based interface and to display the menu using the gesture-based interface. In general, 52.38% of the participants prefer to keep the interaction simple in the proposed 3D UI for the desktop in VR using one interaction mode only rather than using a hybrid approach.
In conclusion, the mixed methods approach shows that the point-and-click UI is the most suitable user interaction mechanism for the proposed 3D UI for the desktop environment in an immersive VR. However, according to the results the gesture-based interface was the second preferable UI. This indicates a promising capability for utilizing the gesture as an interaction mode in desktop VR. This leads to the following two questions: How can the natural UI (specifically the gesture-based interface) be improved? What factors affect an NUI in the immersive VR environment?
The total immersive nature of VR gives it its uniqueness and sets it apart from other media experiences by giving the audience an extreme close-up and all-encompassing visualization experience. One suggestion for improving the NUI can be changing the nature of scenario design from the desktop to another scenario, for example, a game. This may lead to different results and improve the usability and user experience of the NUI in an immersive VR.
As mentioned before, the gesture-based interaction is one type of natural user interaction, where a gesture may be defined as a physical movement of the human body or some of its parts (hands, arms, face, etc.) intended to convey information, actions, or meaning. One factor that might affect the NUI is the choice of gestures. Therefore, designing a new set of gestures or letting the users choose their own gestures from a set of predefined gestures to perform the available tasks will provide more flexibility to the UI design. Consequently, it may lead to improving the user interaction.
6.2. Limitations
Although the user interaction modes for desktop VR work with a very good accuracy, there are a few limitations that might be considered.
The hardware limitation of Leap Motion: the sensor is still having trouble accurately tracking a user’s hands in situations when one finger covers the other. Fingers right next to each other also pose a problem for the cameras and might not be recognized individually. Additionally, the real-life performance may not translate on to the computer model as expected. In addition, the device is not able to perform well under all lighting conditions.
The setup limitation because of using a wired HMD: Limited freedom to move, required room space, and an advanced cable management system. In addition to that, the participants were asked a general question about the overall experience after finishing the whole usability test (exit interview). Most of the users had a positive experience with the 3D UI and an overall pleasing and productive experience.
6.3. Future Work
As future work, the following tasks might be implemented:
Extend the system and analyze it with an extended degree of control over the user interaction modes.
Test the system on a larger data sample to demonstrate the robustness of the system.
Add the navigation task to the interaction space.
Increase the time for training given to the user because there were some time constraints to keep the testing time tractable.
Enhance the design of the menu.
Change the concept of the lower layer to a temporary layer (contextual layer) as an overlay without the downward gaze. It would require more research in finding the natural gesture to toggle the overlay.
Add more feedback to the gesture-based interface to indicate if the user is performing the correct gesture or not, e.g., add some hints in case of difficulty.
Finally, implement a hybrid approach by combining the gesture-based interaction and physical-device based interaction.


