Article

Motion Recognition and an Accuracy Comparison of Left and Right Arms by EEG Signal Analysis

1
Department of Electrical, Electronics and Communication Engineering, Korea University of Technology and Education, Cheonan 31253, Chungnam, Korea
2
Department of Electromechanical Convergence Engineering, Korea University of Technology and Education, Cheonan 31253, Chungnam, Korea
*
Author to whom correspondence should be addressed.
Appl. Sci. 2019, 9(22), 4885; https://doi.org/10.3390/app9224885
Submission received: 30 September 2019 / Revised: 6 November 2019 / Accepted: 11 November 2019 / Published: 14 November 2019

Abstract

:
An electromyogram (EMG) is a signal for muscle output that indicates the degree of muscle contraction and relaxation. For these muscle signals to be output, certain signals must be received from the brain. To analyze these relations, electroencephalograms (EEGs) of the brain are measured to extract brain waves that are active at that time, although it is difficult to identify or distinguish expression patterns of the brain signal through EMG output. However, the brain signal operates via a partially reached signal and transmits the results of the operation. In this study, we analyze signals transmitted in this process and confirm whether human motion can be predicted from brain signals. It is not easy to guess the exact protocol of the brain using a general method, because a biosignal is a signal that differs from person to person. However, by analyzing the signals displayed by a particular user through actions, it is possible to determine the presence or absence of a signal to distinguish muscle movements. In the course of signal transduction, the energy of the left and right brain waves changes in the form of energy or signals that cause an arm’s movement. Responding to this, we analyze the signal transmission process of brain signals and EMGs to analyze loss and generated output. We extract EEG data from brain waves and determine EMG signals from the energy characteristics; we then collect and merge the results of spectra analysis through the Common Spatial Pattern (CSP) filter and explore the basis for predicting wills during muscle signals and stimulation transmission. The active information of the data within the working time of left and right brain waves depends on the changes of the left and right brain waves. It is proposed that the appearance of similar signals at these specific timescales can help identify the operations of the arms and outputs by the left and right biceps.

1. Introduction

Human biological signals are triggered and controlled by an internally connected neural network, sending and receiving electrical signals to and from each other. Because the brain waves produced in this process are indirect signals delivered in the form of ions inside the skin, the shape and characteristics of the signals vary depending on the distance of movement and the location of the transmission parts of the signals [1]. From the perspective of these signals, the transmission signal of the muscles is made by measurement of an electromyogram (EMG), but its meaning is difficult to derive from the pattern or shape of the control signal. Here, electroencephalogram (EEG) signals are extracted in a similar way to muscle signals. However, because the speed at which the situation or time changes is very fast compared to the EMG, it is difficult to identify the motion or intention with the time domain output. Therefore, it is necessary to properly convert and use EEG output information of that time to analyze motion or activity of a particular muscle.
This study is interested in whether the output of brain waves that change during muscle activity can distinguish specific movements of muscles. EMG shows information by muscle contractions as an electrical signal. Therefore, if a brain wave changes at the time of muscle output, the EEG information at that time can be analyzed to understand the meaning of the output signal from the brain. There are a variety of studies on brainwave analysis related to muscle movements. There is a study based on nonnegative matrix factorization (NMF) that analyzes brain signals according to the bending of 10 fingers and records accuracy [2]; there is also a study that analyzes EMG signals related to seven hand movements to predict the users’ intentions and analyzes the accuracy [3]. Furthermore, there are various studies on the classification of brain signal patterns for the correct classification of EEG patterns [4,5]. These analytical techniques allow various processes to be controlled by biological signals and quickly predicted and utilized by brain signals, and for the output states of signals transmitted within a person’s body to be accurately determined.
Because the EMG contraction voltage signal is mostly output by muscle contraction, as shown in Figure 1, it is likely that a number of signals will be mixed or transmitted in a special form if the size of a particular signal exists. When the output of this signal is divided into sections, the EMGs show different outputs (Figure 1), even though there is no muscle change. Therefore, the process of defining the period of signals delivered through the muscles is important. Also, because these signals are measured by noninvasive methods, they are somewhat less reliable in accuracy than the extraction of electrical signals through needle electrodes or chips inserted into the subcutaneous layer.
In addition, it is somewhat unfamiliar to the subjects and difficult to apply the method of measurement by inserting a needle or surgery in a specific way within a person’s body. Thus, in the process of analyzing brain waves or processing bio-signals, it is common to use a safe and easy way to acquire data, even if it is an indirect signal. Also, because these are indirect signals, various research attempts, verification processes and applications are required to identify the actual internally transmitted form. Thus, in this study, the experimental target is selected and the signal extraction method is defined firstly, then the data is processed and analyzed secondarily. After describing the extraction process and data selection process in the secondary process, the large number of collected data, algorithms and conversions for the process are analyzed.
Depending on the experimental environment or method of experimentation, a filtering process is needed to extract as clean a signal as possible by removing the noise that is mixed in the signal. Because eye flickering noise can cause a large distortion in brain signals, a prior treatment process is needed to eliminate this effect. In this regard, studies are being conducted to eliminate various noise rejection methods or interference with signals [6,7,8]. For more accurate experiments, the experimental environment must be tightly controlled. In addition, a data acquisition process is essential in which the output of the brain signal minimizes small changes in the subject’s motion or disturbance when the muscle movement occurs. At the end of the previous series of processes, the analysis of the resulting data defines the characteristics of the EEG during right- and left-handed operations to confirm and verify whether the data of the brain waves delivered through the two signals affect muscle activity triggers.

2. Biological Signal Extraction and Processing

2.1. EMG and EEG Signal Abstraction

Measurement of EMG signals is derived from the biceps and triceps of the right and left arms. The output of the muscle may vary from user to user, and the output may degrade and change depending on the activity of the muscle and the muscle fatigue. When muscle conduction occurs, neurons are activated in the brain, and the movement of each electron causes vibrations with a specific individual frequency, which is shown through the EEG. In this study, we gather the activity of neurons according to the activation of these brains and muscles to determine if there is any basis for generating specific motion signals. The channels of EEG are measured from the center of the brain with a patch attached, as shown in Figure 2a. The EMG is measured by attaching two electrodes to each of the two channels, the biceps and the triceps, as shown in Figure 2b. In the case of an EMG signal, the type depends on the subject’s state, so the definition and conditions of muscle activity in the experimental environment design must be maintained accurately.

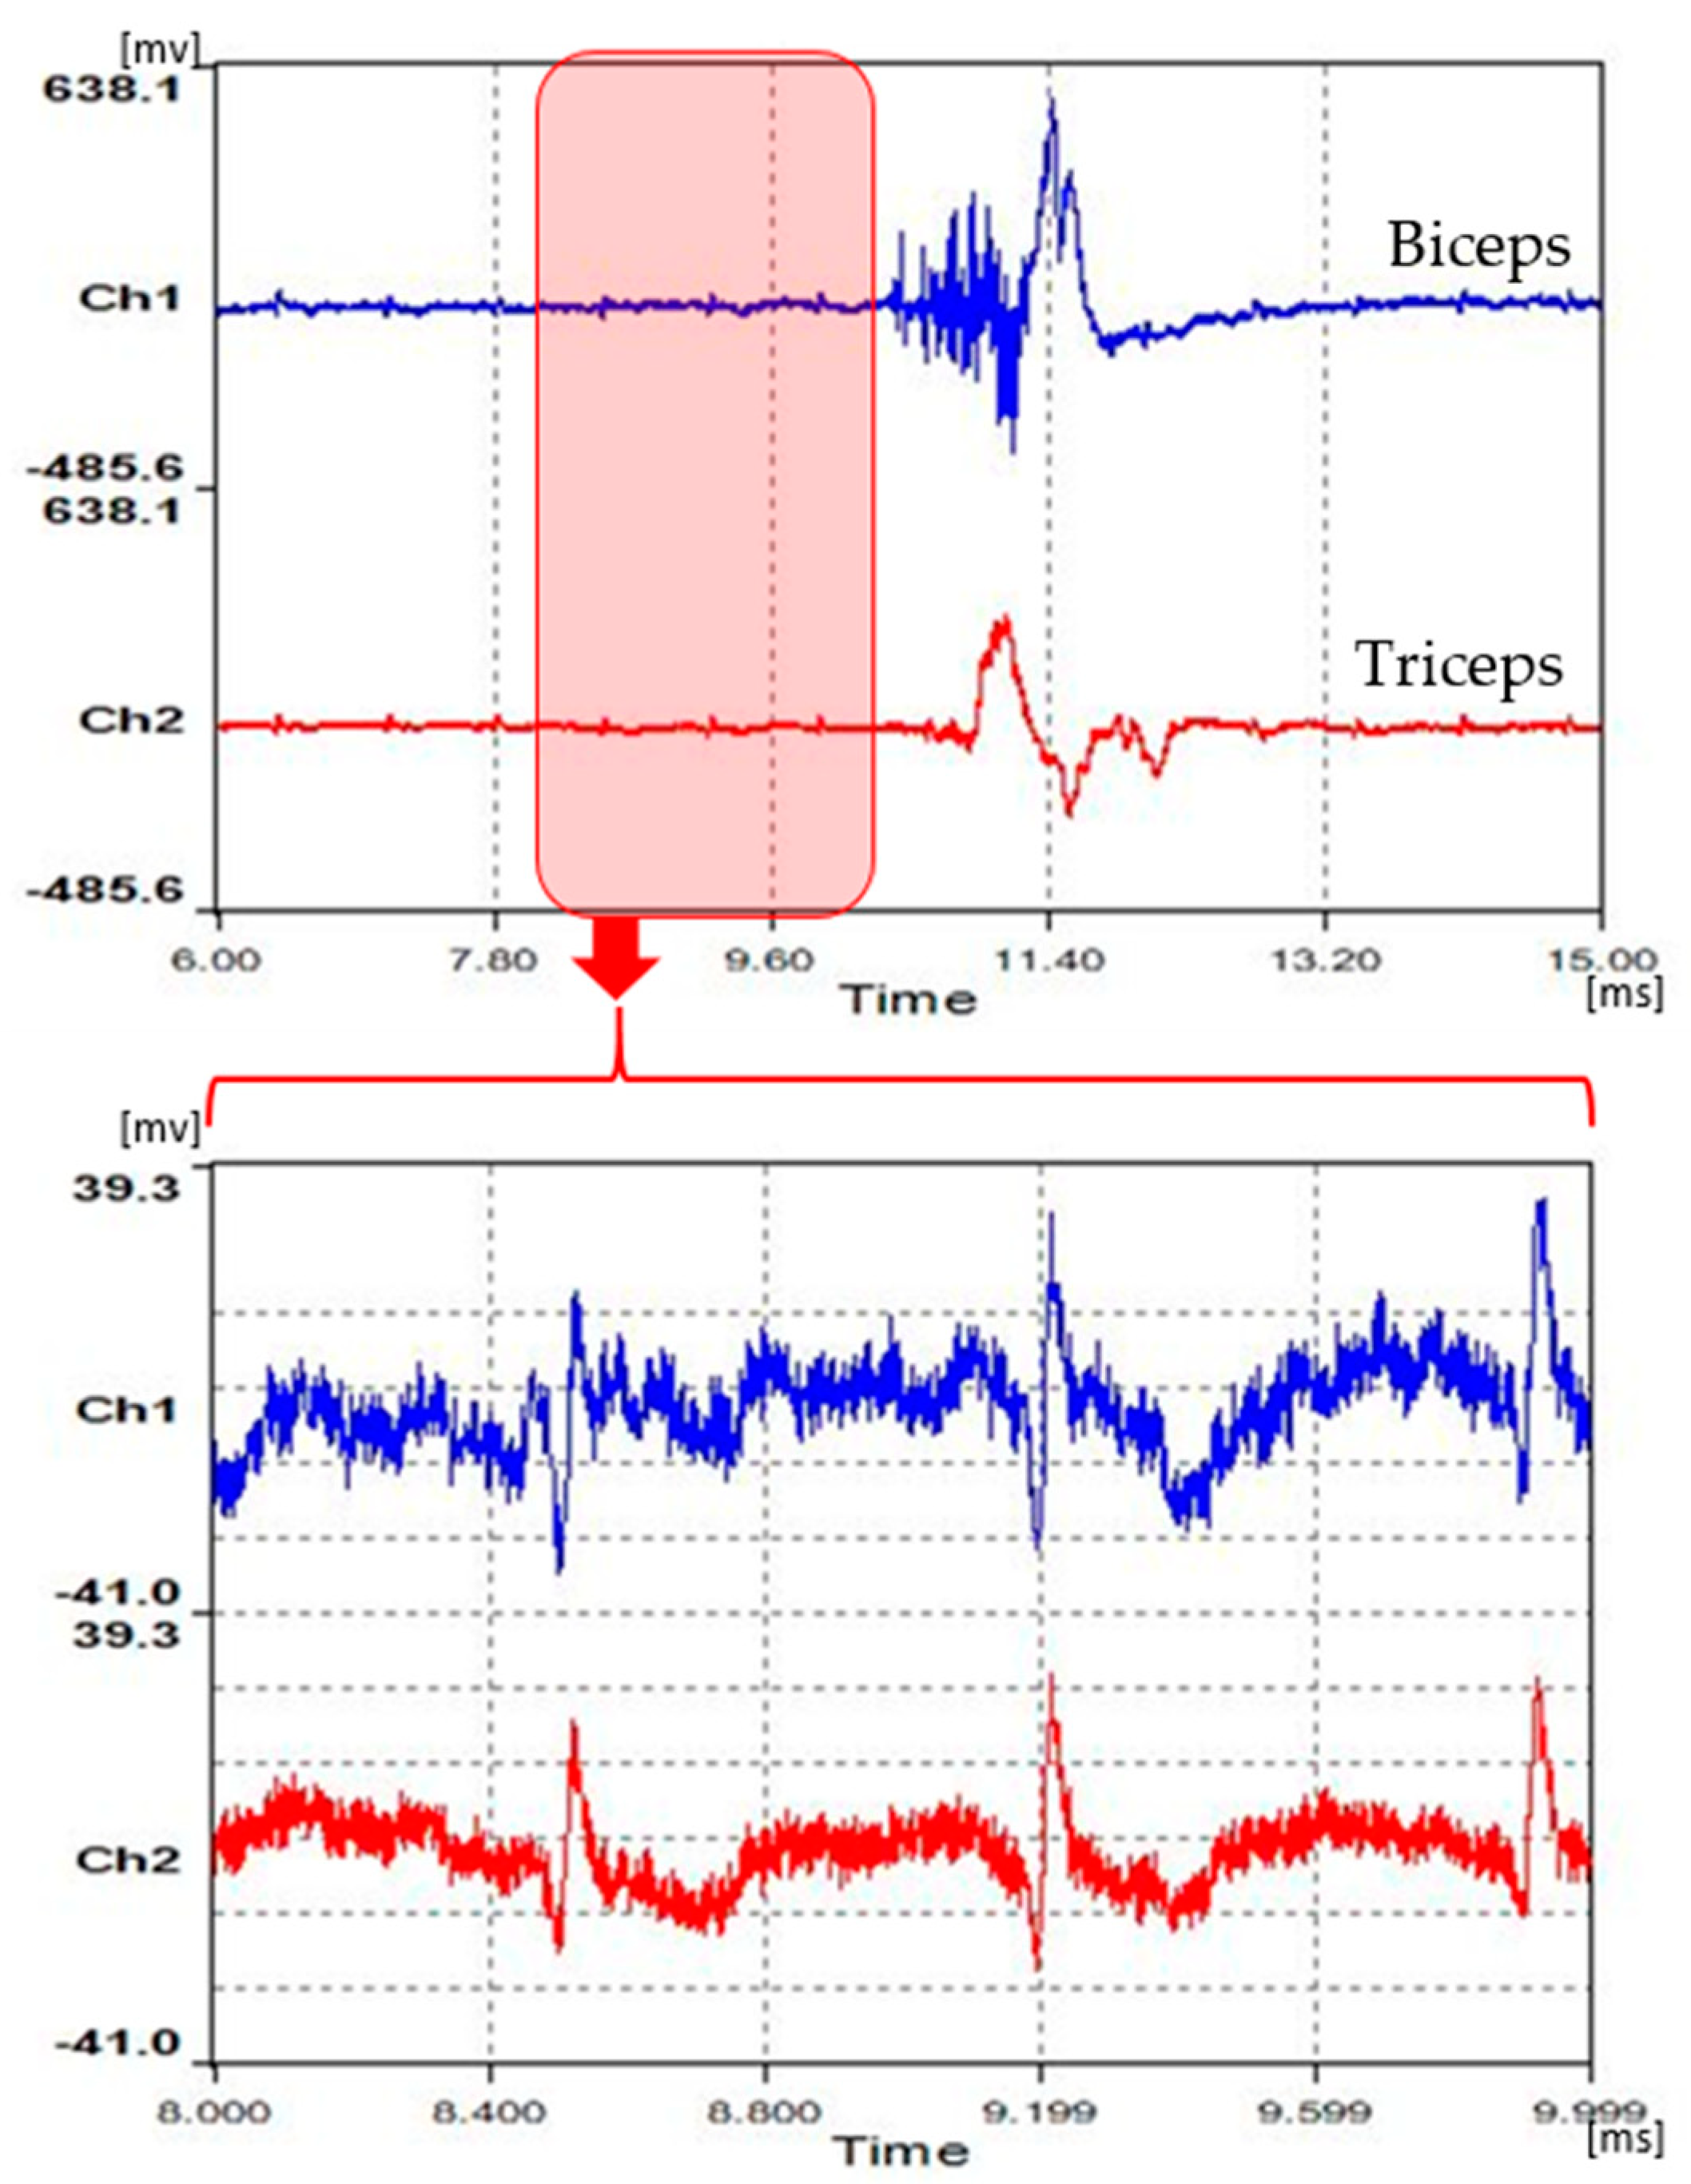
2.1.1. Measurement and Extraction of EMG

For extraction of surface muscle information due to muscle activation, an EMG sensor and an Ag/Cl electrode are used. Three electrodes are used to measure muscle activity information due to muscle contractions and relaxation. Muscle information is measured through the active electrode (measurement electrode) and reference electrode to generate zero potential through the ground electrode. To extract electrical signals from a specific area through both sensor signals, it is recommended that measurements be made as close as possible. The chemical properties of the electrodes are activated three to five minutes after attachment [9]. The electrical signal can be obtained by attaching the electrodes that can measure the circuit using a snap electrode for muscle signals. The signals with frequency activity below 10–500 Hz are typically extracted and used as a valid signal range [10]. In some cases, up to 2 kHz is used, and some studies use signals less than 300 Hz as a valid signal [11]. The sampling frequency of the signal can be applied at 500 Hz to a size of 2 kHz. If small differences in precise signals can affect the output of the system, the signal can be measured with a high sample rate. The output of the muscle signal has a small amplitude, from several μV to several mV, or usually less than 10 mV with a voltage level. Thus, the measuring circuit uses the differential amplification circuits with the filter circuit for filtering the effective signal to increase the output. Generally, circuits amplified up to 300–800 times can be applied independently, depending on the type of measurement sensor or area of measurement. Figure 3 shows the process and method of EMG sensing for measurements. Muscles activated through electrodes are amplified at a constant amplification rate via radio frequency interference (RFI) filter circuits [12] for high-frequency noise and interference removal, and are output through frequency filters. This output is digitized via the analogue to digital converting (ADC) circuit for conversion to data for analysis, and the resulting data is defined as “raw EMG”. The muscle output of the data is measured with the minimum amount of muscle contractions by the subjects. Experimentation minimizes the EMG of subjects because brain waves can increase the noise impacted on the output if muscle flexion increases during muscle operation.
EMG outputs also vary depending on the subject’s condition or muscle activity, so it is necessary to make them as general as possible using information about the subject’s characteristics. In this study, the EMG data first served as an analysis of changes in brain waves through muscle signals, which were then measured to determine whether the movement of the arm could be distinguished from brain waves in the event of muscle contractions.

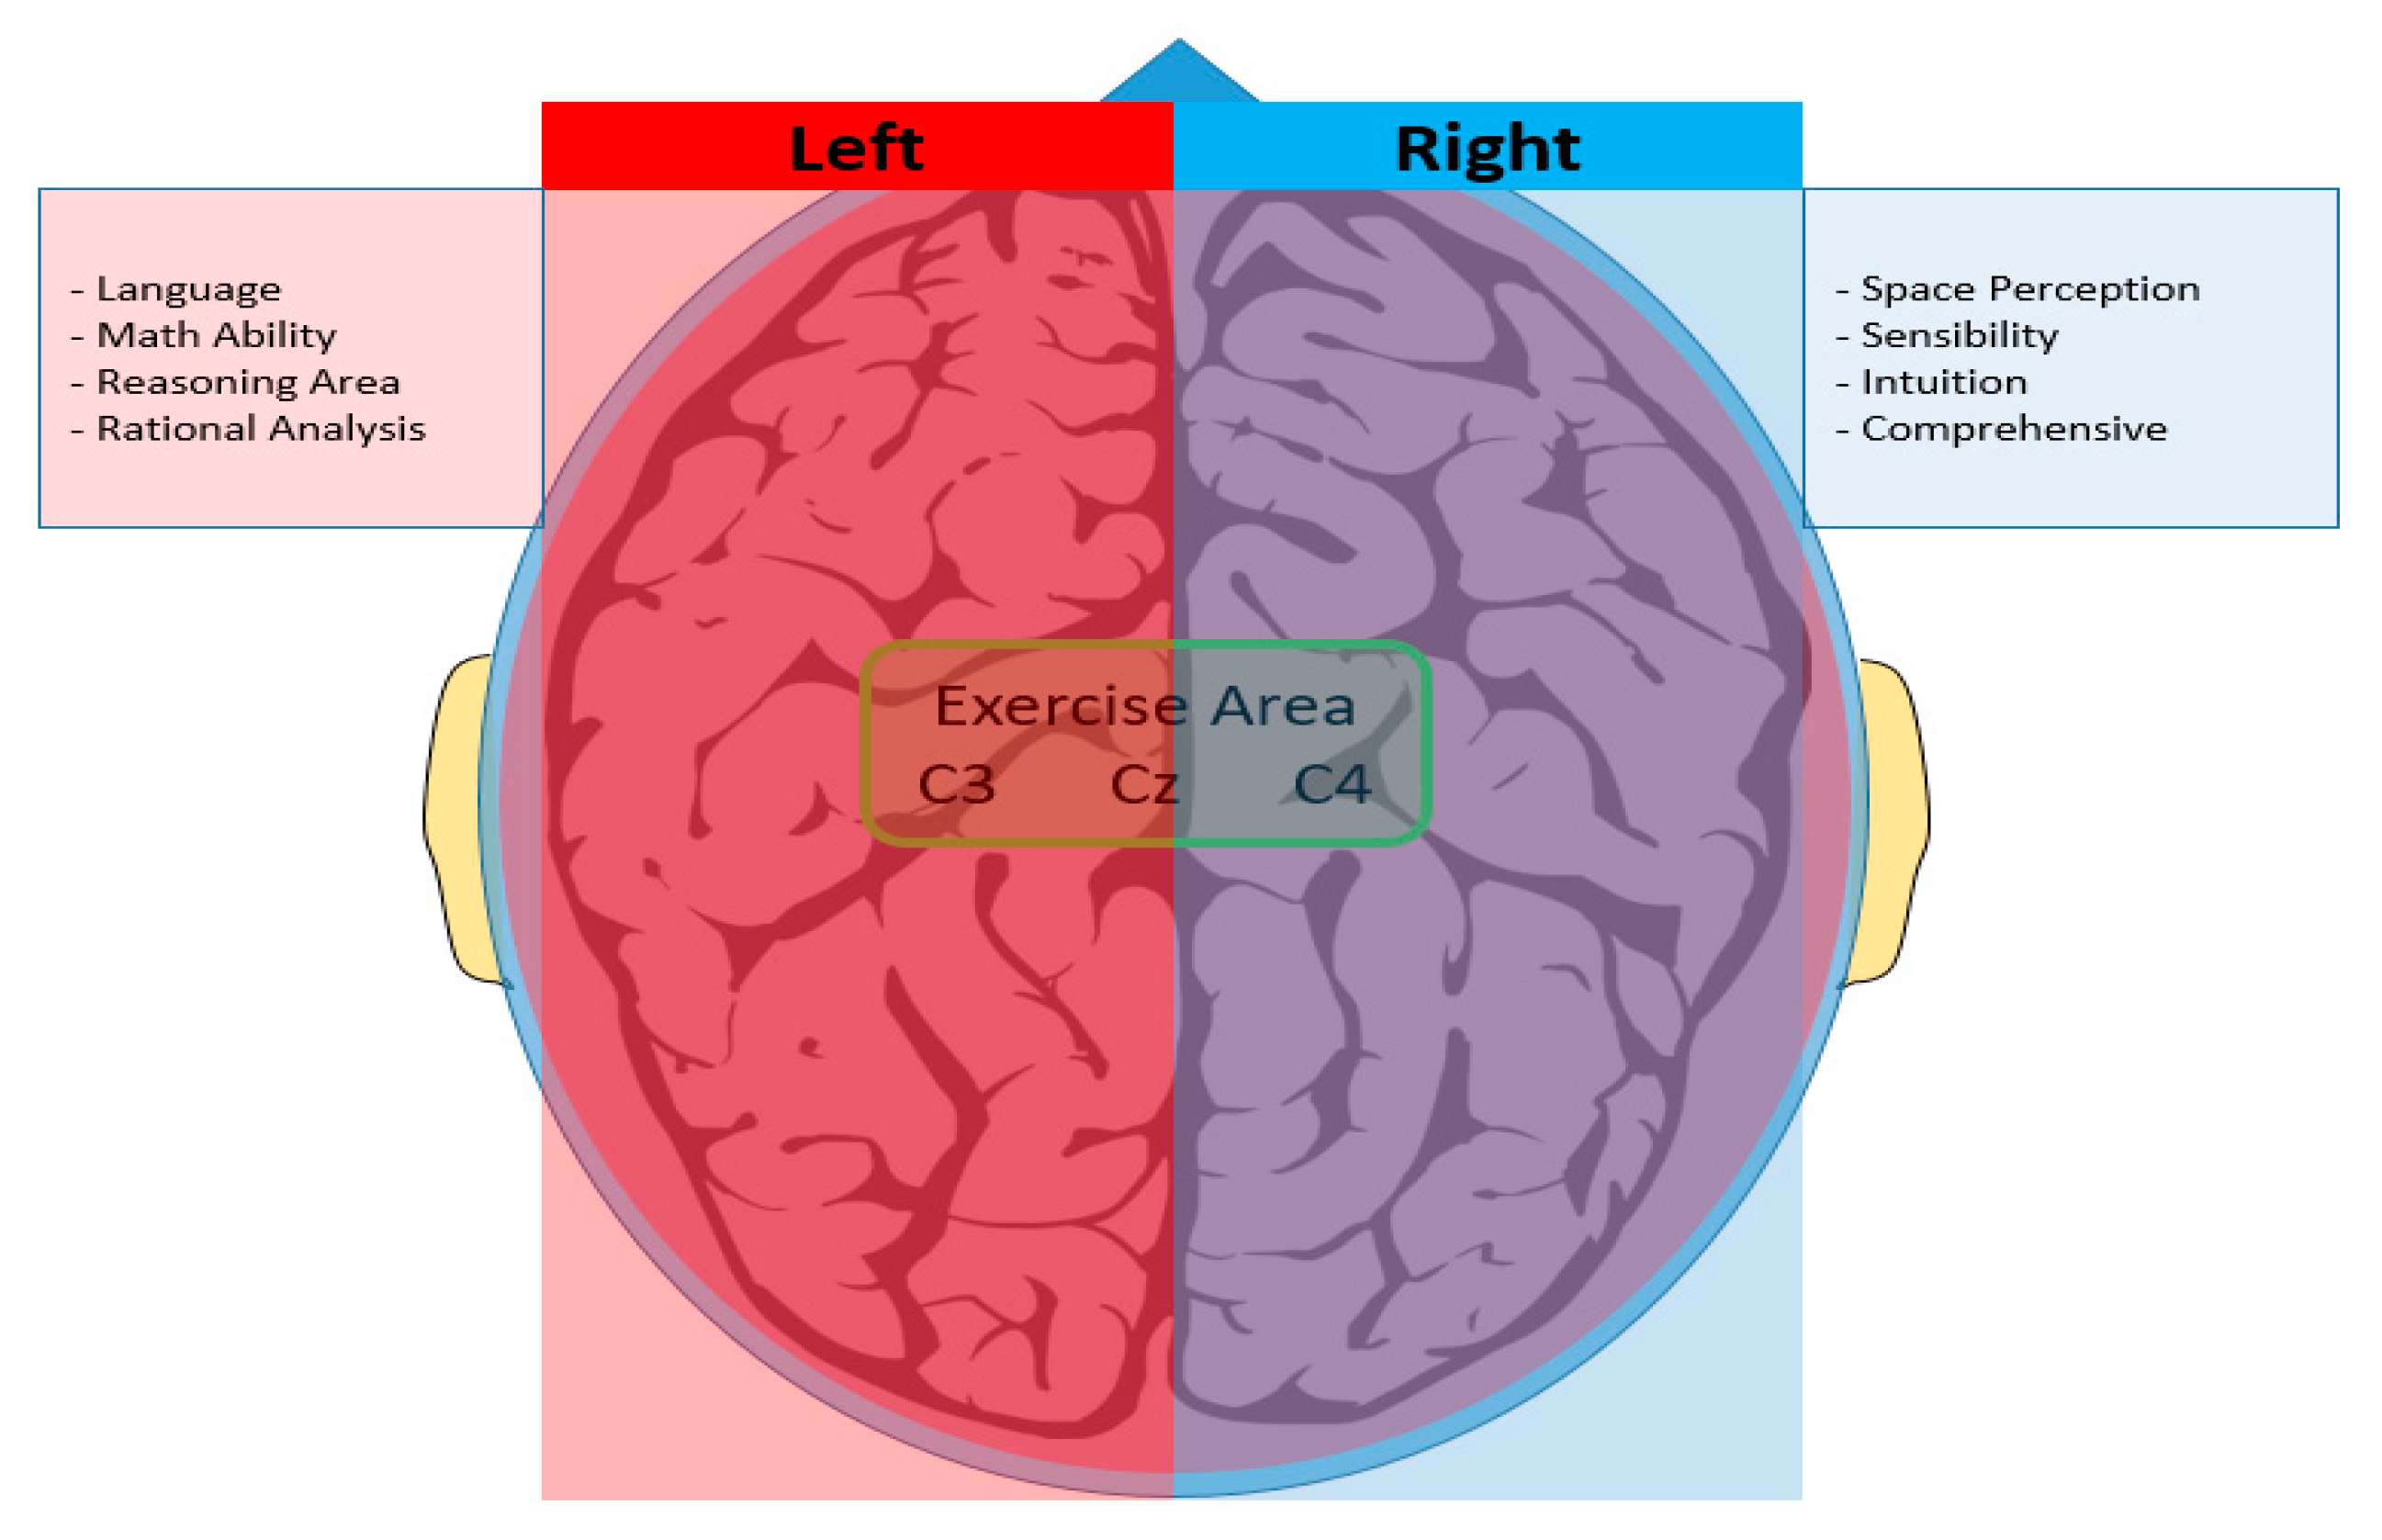
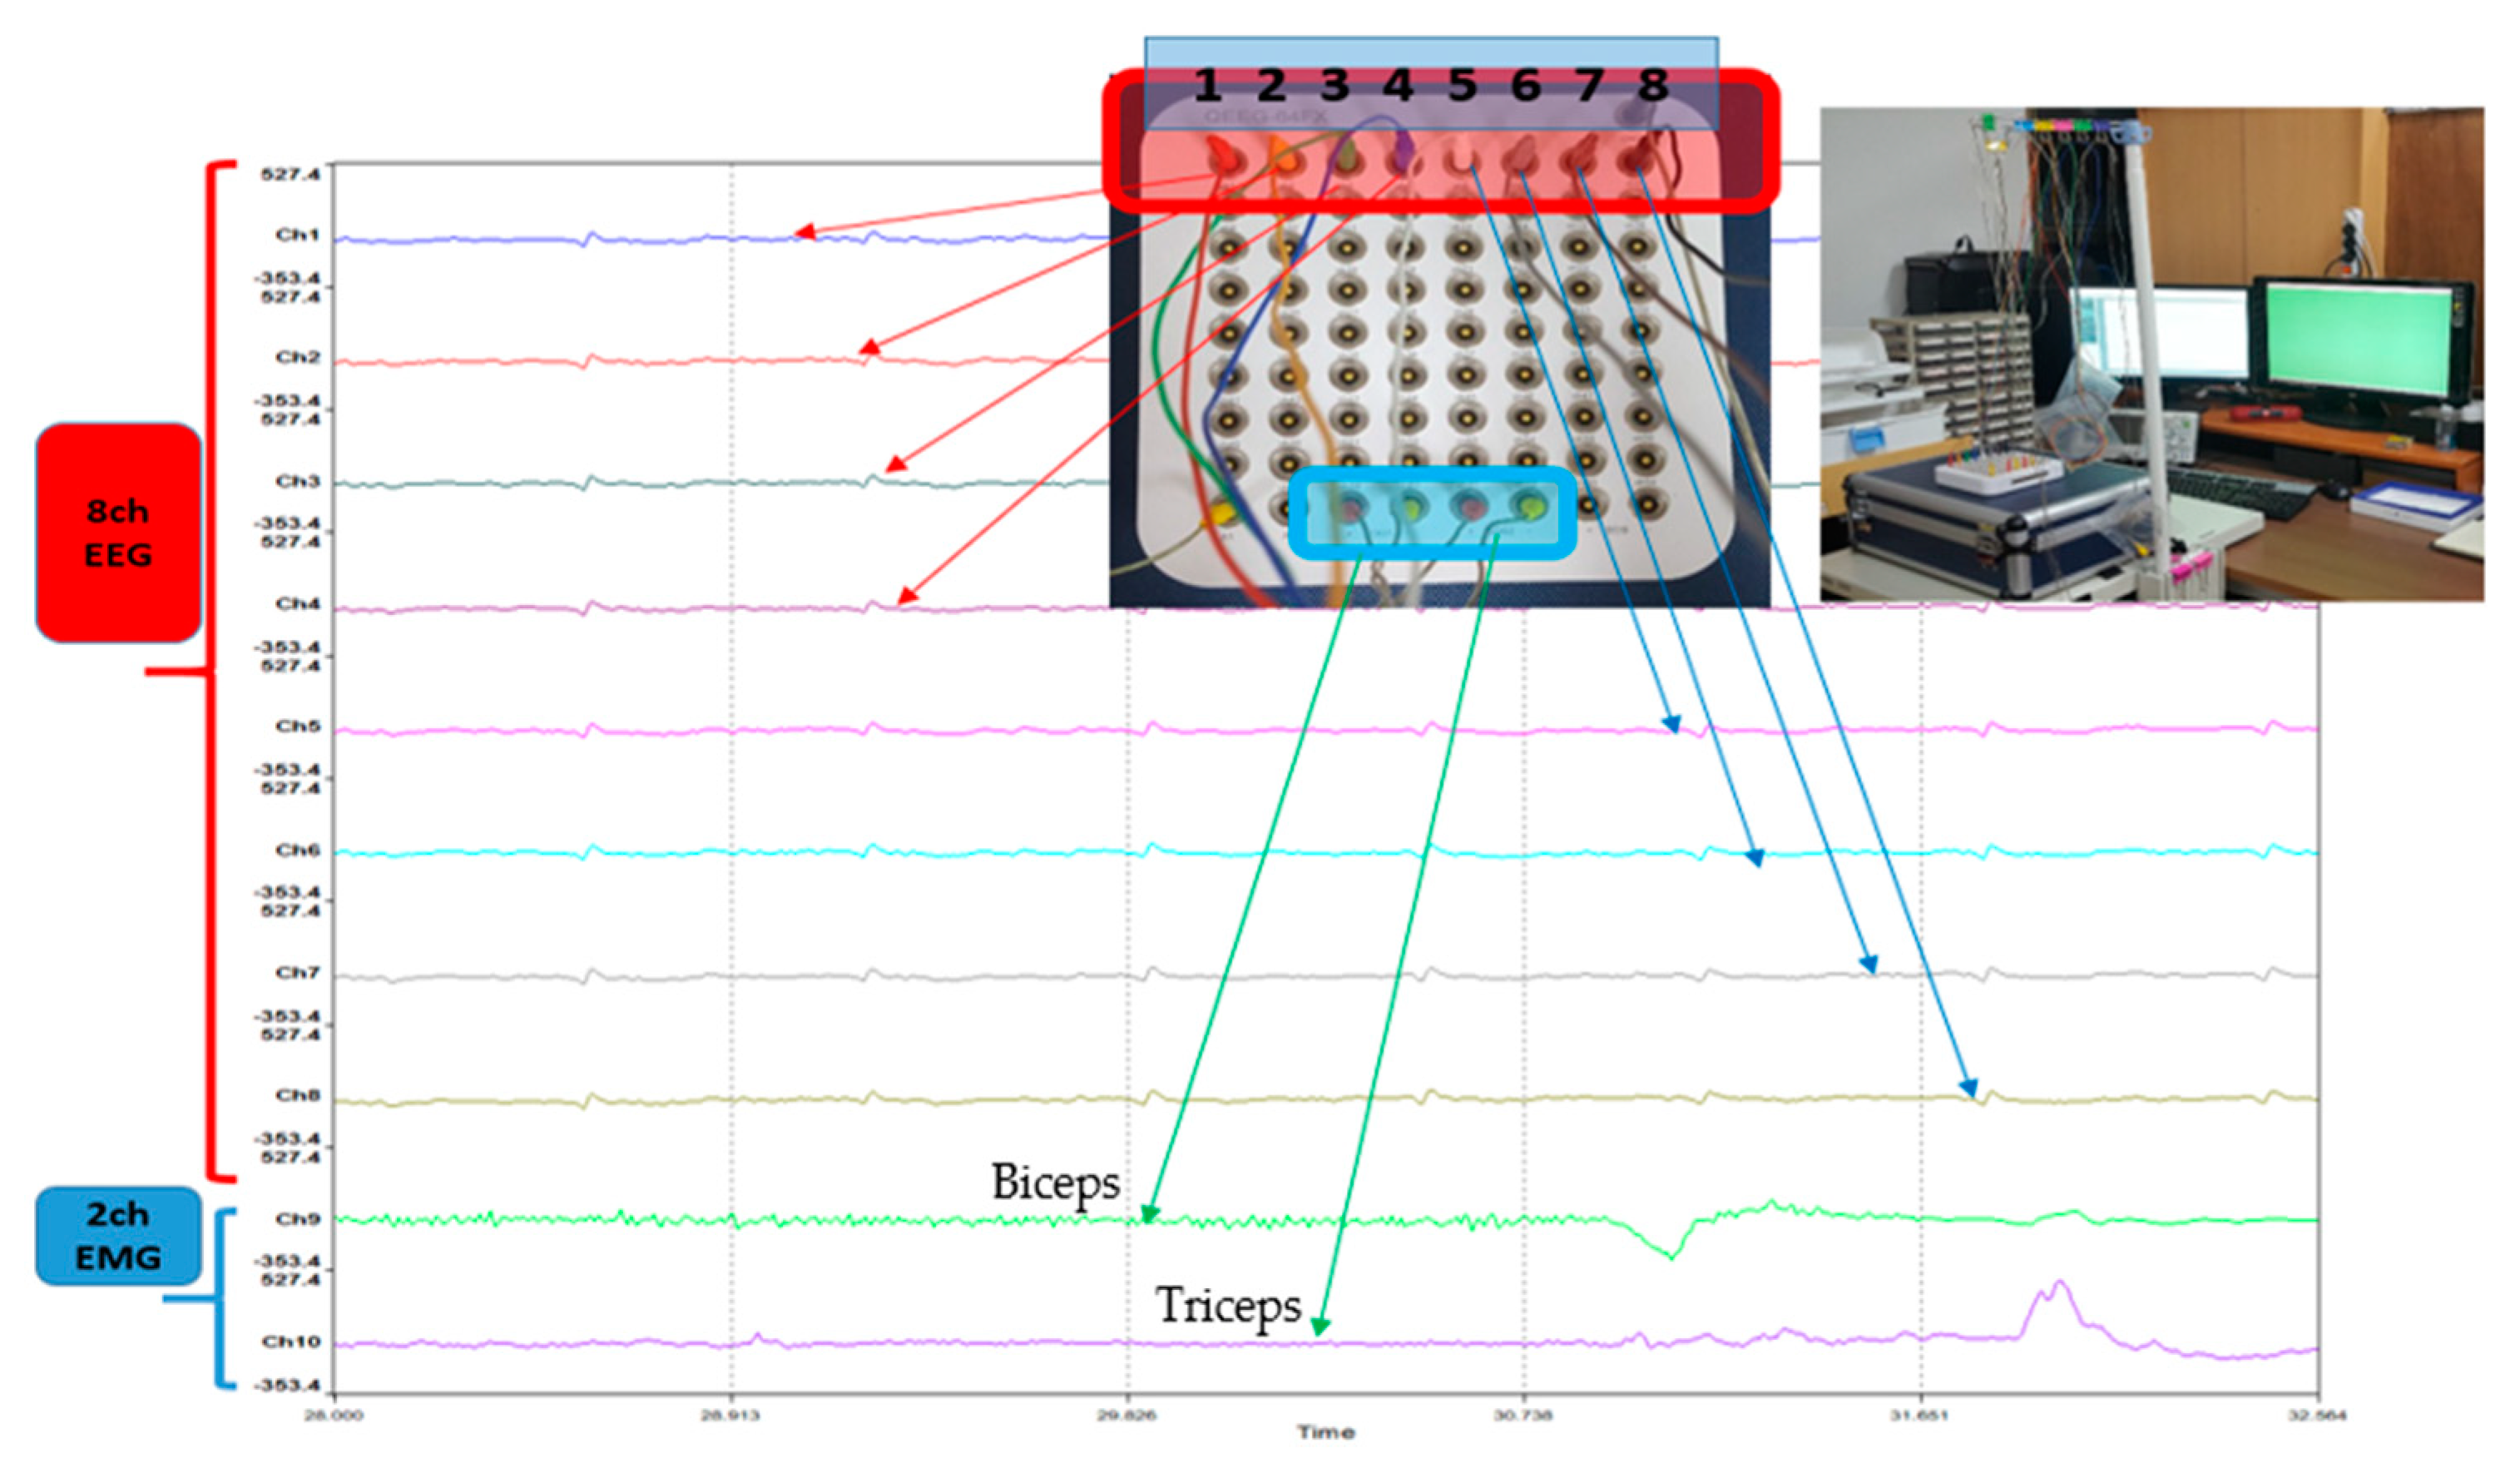
2.1.2. EEG Measurement and Synchronization of Two Signals

An electroencephalograph (EEG) is typically composed of signals below 50 Hz [13], because the output of a signal has amplitude and energy output characteristics significantly smaller than EMG. Due to the frequency band also being low, it is difficult to identify signals delivered to the muscle through simple comparisons or signals received from the muscles. Therefore, it is necessary to limit the point of special events or stimuli occurrences, and experiments should be organized to compare data before and after the stimulation to ensure the user behavior and willingness. Electroencephalography is divided into areas in which motion or emotion are deduced according to the region. Surely, it is difficult to present a pattern that precisely matches the distribution and situation of the pattern, but in general it is possible to define output characteristics that show intensity step by step according to the site. Figure 4 shows regions of the brain according to the output of the EEG signal. The area of brain waves related to movement or physical activity in humans was measured mainly by designating areas of C3 and C4 and eight points around them based on Cz as the center of the brain.

2.2. Configuring the Experimental Environment for Data Extraction

Before organizing the data to be analyzed, the experimental procedures and environment should be properly configured to extract reliable data. Subjects should limit their movement as much as possible and close their eyes to minimize noise and distortion caused by eye movement. The subject naturally flexes their arms (approximately 45 degrees from the ground) by listening to the beep sound at the time the stimuli are presented.
The experiment is configured to minimize the near-field output that can occur during muscle contractions, in order to reduce the output caused by muscular contraction and to reduce the distortion of signals associated with a user’s behavior and will through action. Figure 5 shows the synchronized output and frequency conversion output of EEG and EMG for extraction, as well as the EEG measurement point and location of EMG extraction. As a result, the data were extracted by organizing eight channels of EEG and two channels of EMG, respectively. For measurements, independent experimental spaces were constructed to avoid the effects of external stimuli and data errors caused by electromagnetic waves, as much as possible.

2.3. Data Collection Process

The extracted signals are collected, processed in batches and converted for use. In this study, after defining one set of experiments, a total of 80 measurements were divided into 20 sets of the left and right arms and divided into 20 sets of operation sections for each set. The block diagram for acquiring one set of outputs and data is shown in Figure 6. After the signal stabilization interval for the initial 10 s, the experimental section performs the first action at the end of the 10-s period, and three more actions at 5-s intervals when sound stimulation occurs over the next 15 s, resulting in a total of four outputs per set.

2.4. CSP Filter and Raw Data

Based on the extracted signals, the output signals consisting of the CSP filter [14] with raw data are compared in an experimental order for signal analysis. The movements of the left and right arms are divided before and after the presentation of the stimuli, and the signals are separated over time. Here, raw EMG is used as evidence to predict the change in output represented by EEG after receiving the muscle stimuli. The common spatial pattern (CSP) filtering method is one of the ways to divide classes by separating the boundaries of uncertain output waveforms, such as brain waves. The covariance results of two classes are used to classify the specificity and characteristics of signals for the distinction of behavior within the existing data by maximizing and minimizing the covariance results [15]. In this study, the data of the subjects collected were converted into (n by m) matrix-type data and then compared with the original signal using CSP filters to distinguish the relevance of the brain wave signals during the arms’ operations. Algorithms for data processing and data analysis of the output of the CSP and raw EEG and EMG signals can be found in Figure 7 below.

3. Data Analysis and Processing Method

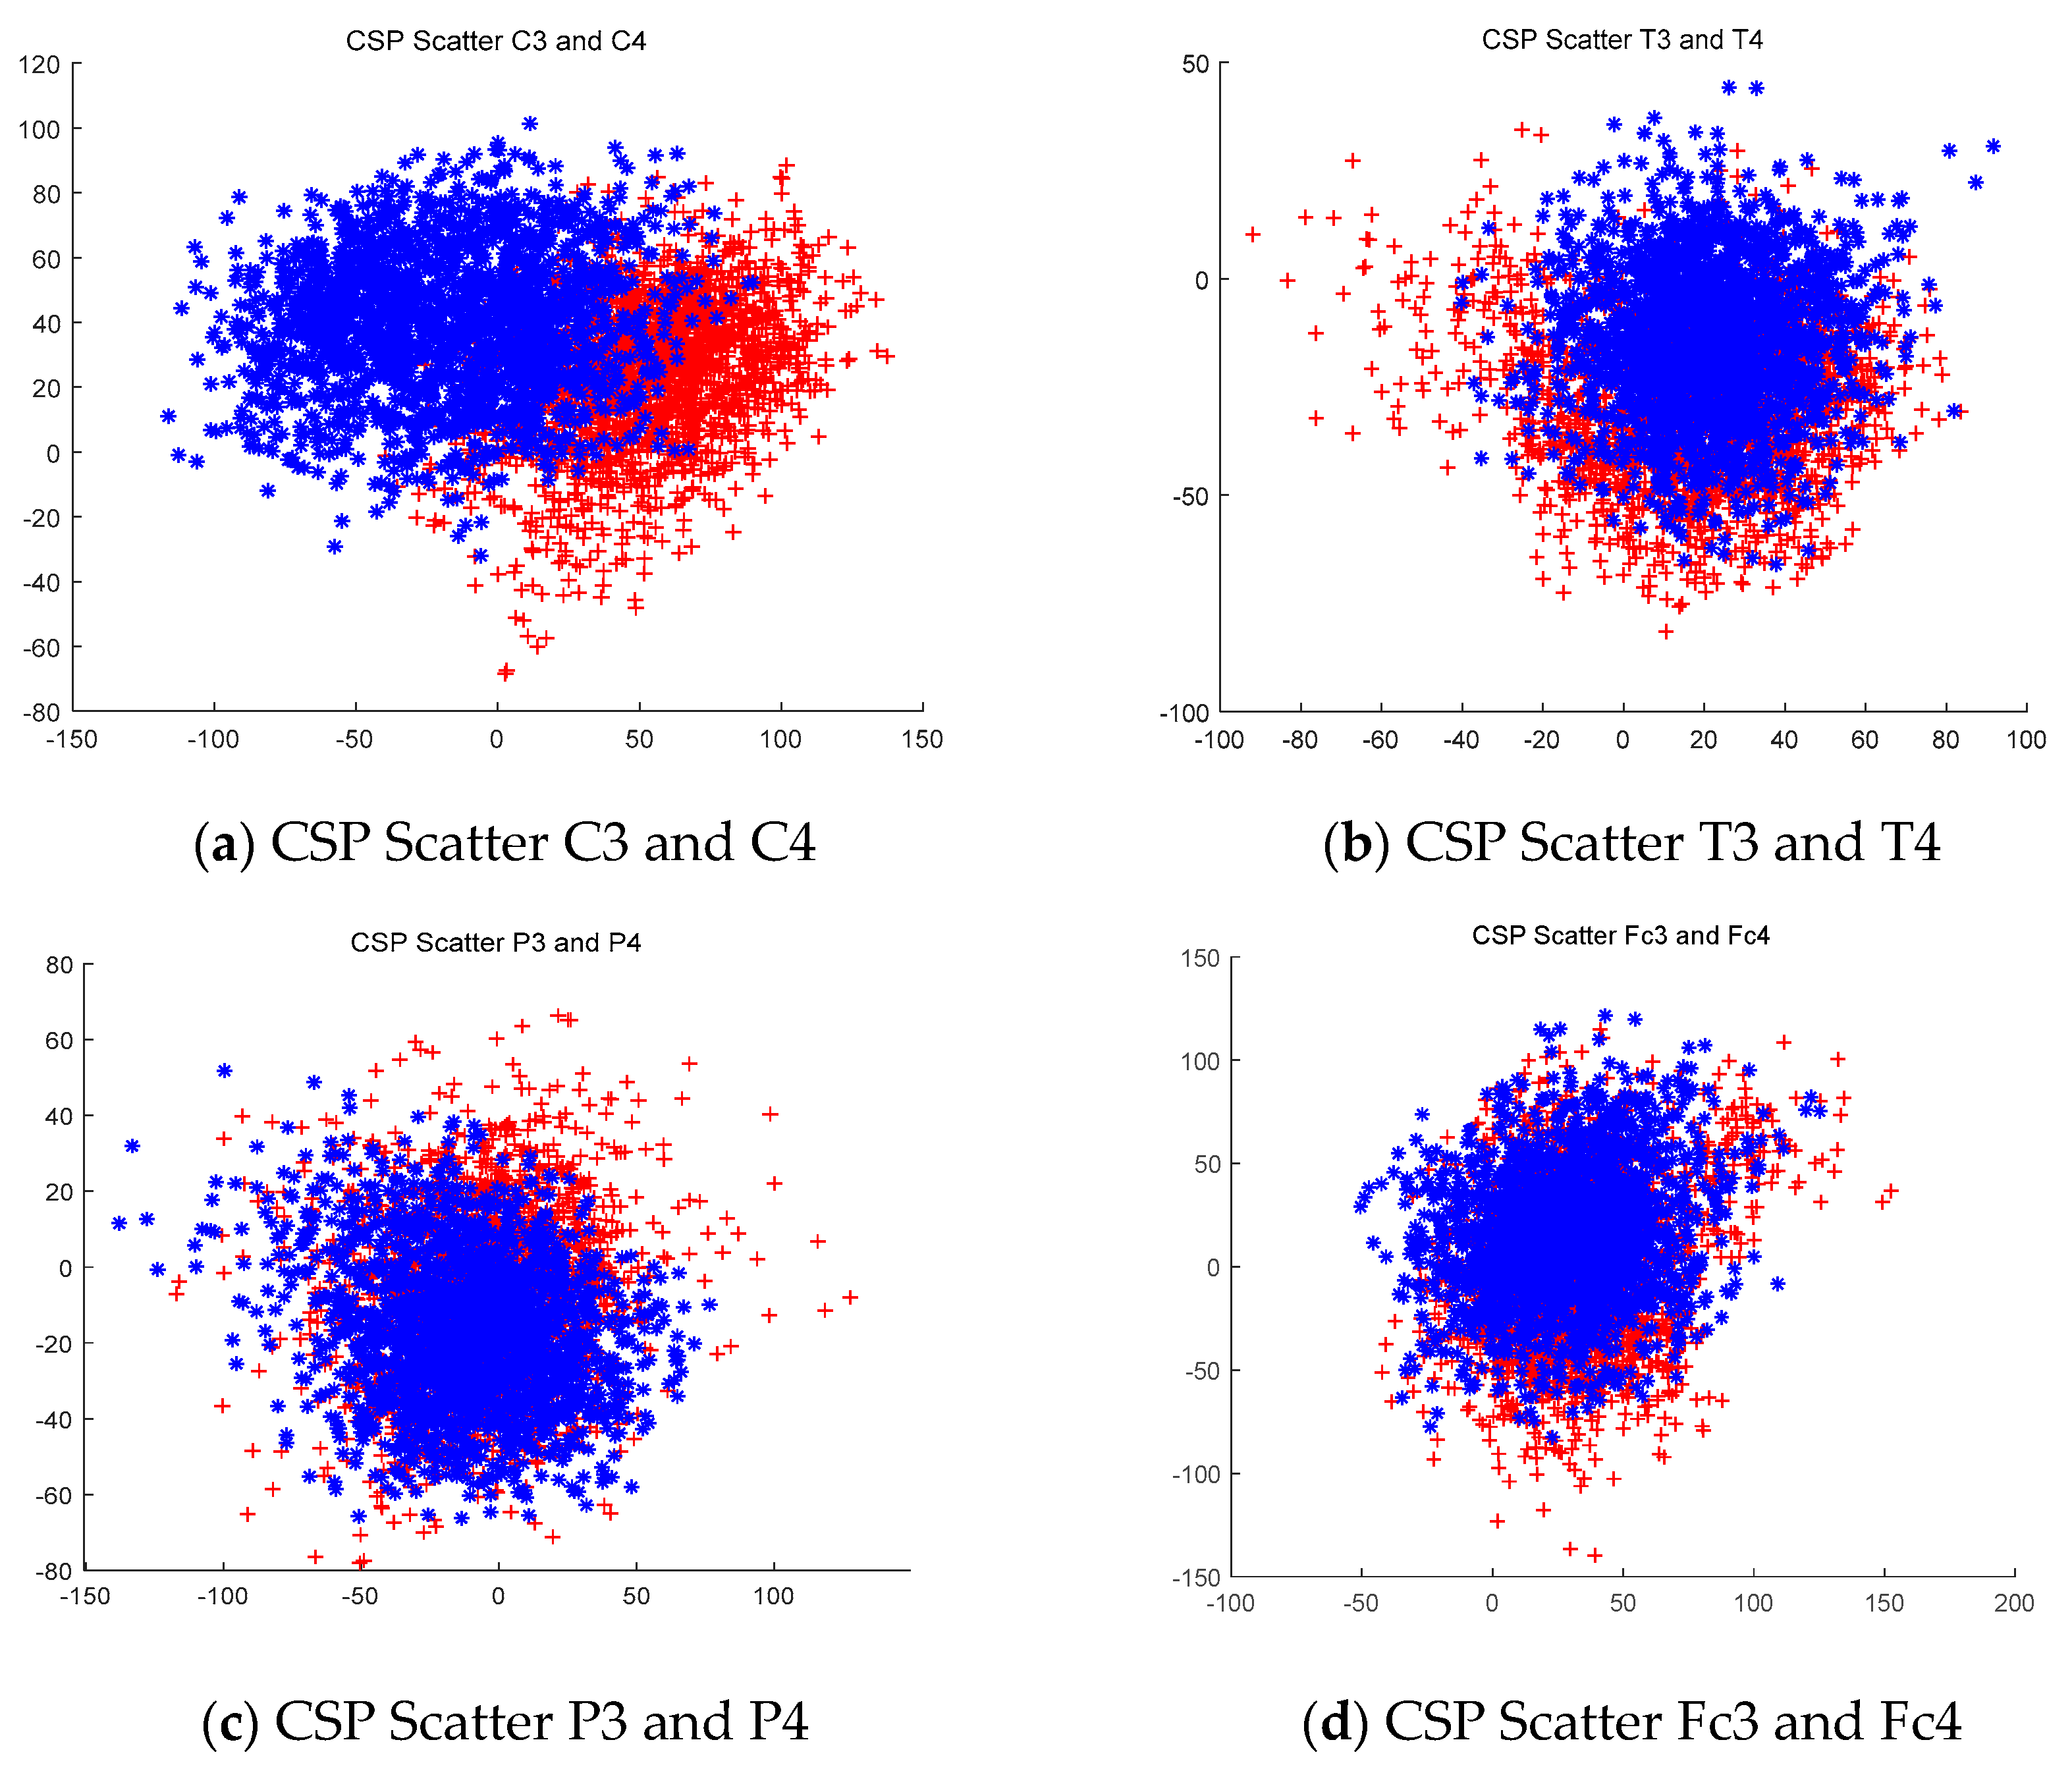
3.1. Data Extraction using the CSP Filtering Method

After extraction and processing of the original EEG and CSP-filtered data, regularize the data by channel to increase readability, and the data will have a value between 0 and 1. For analysis, the brain waves of subjects are tested from 20 sets, and 160 data are analyzed for each channel on the left and right. All data are acquired with a sampling rate of 1 kHz and divided left and right into 1000 three-dimensional matrices. Divide between right and left to form a filter matrix of 8 × 8 to enable the CSP filter application of 8 × 1000 × 80. The data of the CSP filter are organized based on the maximum and minimum variances of each matrix component. Multiply the CSP filter by the three-dimensional data and separate it from the original data to create a secondary data set. The formulas for the construction and application of filters are shown in the following Equations (1)–(5). Defining each sample of data on N channels as S gives the matrix of N×S in each experiment, and assuming the number of experiments is 30 (N×S), the total number of data samples obtained is 30 (N×S). This matrix allows the value of the covariance matrix by the number of experiments to be expressed as Equation (1).
C = X X t r a n s p o s e ( X X )
Obtain the covariance with the number of experiments for each class and calculate the average of the covariance by class. Since the number of experiments for the first class is 160, the mean value can be obtained by adding the covariance to each of the 160 samples and dividing by the number of objects in the class.
C i ¯ = m e a n ( C i )
Adding an average covariance matrix for all classes allows the creation of a composite covariance matrix, which is calculated by Q through the eigenvector (U) and eigenvalues (λ) of the matrix. This white-colored conversion sequence has a unique vector with the same mean covariance matrix of the experimental data as Equation (4). When a passed brain signal is defined as Z, it can be represented as Equation (5).
Q = λ 1   U
S i = Q C i ¯ Q ,   W = Q B
Z = WX
The diagram of the CSP filter applied in the previous content is briefly described in Figure 8.

3.1.1. Analyze the Extracted Data

After extraction and processing of the original EEG data and CSP-filtered data, the data are regularized by channel to increase readability; the data will have a value between 0 and 1. Before processing the data, similarities and differences between the two data are distinguished (Figure 9). The two signals within the same interval appear to be the same, but differences before and after CSP filter processing can be distinguished.
Left- and right-handed data for each normalized channel are added by the global summing method, which is divided left-to-right to extract the intensity of the frequency. The results of the FFT (fast Fourier transform) conversion of raw data produced by this process and the energy distribution and channel-specific contrast results can be shown in Figure 10.

3.1.2. CSP Filtering Method Compared with the Raw Signal

The difference between raw EEG and CSP-filtered signals is shown in Figure 10 and Figure 11. Based on the data pair point of EEG for each channel, the difference between the two data can be verified before and after the application of the CSP filter. In the case of raw data, the distinction between two movements is not apparent, but CSP filters enable the distinction between two arms and, in particular, the distinction between C3 and C4 is relatively pronounced. In the case of subjects, it can be determined that the brain waves in the C3 and C4 regions of the motor domain can be used as signals to distinguish between right- and left-handed behavior. However, it is difficult to define the baseline of two signal classifications accurately, and more experimental data will be needed through improved algorithms and the diversification of measurement points.

3.2. Spectrum Normalization and Energy Conversion

Frequency analysis shows the distribution of energy converted through normalized output. Figure 12 shows the frequency distribution for each channel, separated by color, for the average frequency intensity of an area of 0–20 Hz. The order of the right and left sides from top to bottom, and the four left diagrams of each row, represent the output of the left regions of the brain and the other four right regions of the brain, respectively. Where the signal strength of the CSP filtering data collected from each set of experiments is high, it is depicted in red; where the signal strength has a lower intensity, it is depicted in blue. The effective range of the output frequency is from 1 to 20 Hz, and the horizontal axis refers to the time (1 s) of the sampled interval.
Figure 13 shows the composition of the frequency component distribution of generalized outputs.

4. Results and Analysis

Separating Left and Right Motion Output by EEG

We experimented to compare the output of EEGs according to the motion of right and left arm. A Support Vector Machine (SVM) [16] was applied to quantify the performance of the classification. Because the performance of the SVM depends on parameters, the cost value (C, the degree to which the data sample is distributed in different classes) is used for linear isolation based on accuracy, and the cost value and gamma (the distance one data sample affects) is used for RBF (Radial Basis Function; Kernel SVM). Cost values and gamma values should be selected by empirically, and a combination of the two parameters was made using a method called grid search, which selects the parameter values with the greatest average accuracy on average. Grid Search was tested for both linear and RBF when the cost values and gamma values had the correct number of arrays (1 × 10⁻⁶, 1 × 10⁻⁵, 1 × 10⁻⁴, 1 × 10⁻², 1 × 10²), and applied the most accurate parameter values for each signal source. Furthermore, since there were fewer samples of the right-handed/left-handed total of 160 experimental data, k-fold was applied to obtain the mean classification accuracy and error. The 10-fold method was used for cross-checking, and the mean and error were obtained by repeating the process 10 times to calculate accuracy.
All the brain wave signals from eight channels were collected through a band-pass filter of 0.5–200 Hz, and a 60 Hz notch filter was applied during the processing. The results by cross-validation can be summarized in Figure 14. In Figure 14, A had a classification accuracy of 0.718 (71.8%) and an error of ±0.234 when raw data was applied without any pre-processing. B represents the CSP-applied data with an accuracy of 0.828 (82.8%) and an error of ±0.181. The accuracy of CSP filter data was 11% higher than that of the raw data. The data from C and D were treated with power spectrum density (PSD) processing, respectively, and normalized to a value of 1.0–20 Hz for a value of 0–1. This is the output obtained from the processed data that applies the mean difference between the sample class (right data) and the other class (left data). The results showed that C and D had classification accuracies of 0.731 (73.1%) and 0.828 (82.8%) and error rates of ±0.2 and ±0.135, respectively, and that the output of CSP filtering increased by 10%.
Through the application of CSP filters, the distribution of data appears to have some level of classification efficiency in C3 and C4 areas by analyzing data at the point in the brain at which motion occurs. Although not all points showed efficient results, it is expected that more accurate classification would be possible if more standardized data were obtained by re-establishing data points and diversifying behavior.
The frequency output distribution shows that data from the right and left arms were activated in specific areas through the analysis of differences and the summing algorithm following the CSP filter. Figure 15 shows the distribution of characteristic areas by frequency. In the case of raw EEG, the right-hand side operation showed high energy around 4–6 Hz, and some channels showed high energy values of 10–12 Hz. In the case of left-handedness, it was found that energy near 8–14 Hz was high compared to right-handedness. On the other hand, data analyzed by CSP filtering showed that signals activated in the 10–15 Hz band were common for the left-hand side, and that the energy band of 6–8 Hz for the right-hand side was high. It is estimated that the output of the subject’s brain waves can be inferred from the brain signals that classify the movements of the muscles. Also, it is hypothesized that the types of brain waves activated by the frequency of the data will vary depending on the motion or subject, but this would require a comparison of various groups of experiments to determine.

5. Conclusions

For the analysis of brain waves, the experimental environment was constructed to detect signals from desired areas and to distinguish the types of brain waves according to the movements of the arms. We extracted brain waves from various areas of the brain, and recognized that the study of finding characteristics of muscle behavior in the brain wave signal was the priority; however, the combination of factors was so complex that we could not find any particular association with the results of muscle action. Previous studies of the CSP algorithm have determined the method used in conventional EEG studies that could standardize data sorting areas in pure brain waves. In this study, the CSP method was used to distinguish muscle activity signals contained in brain waves, and the difference in studies based on the ideal results (EMG signals) of the EEG signals were derived simultaneously [17,18,19,20,21]. The results of the test showed that the accuracy of the operation increased by more than 10% when the CSP filter was applied. Moreover, when CSP filters were applied to the left and right arm movements of the brain waves, the difference in the average value of the output frequency of the EEG was found to be more than 10% more accurate than if the difference value was not applied. It can be interpreted from this that the difference in spectral distribution of the two types of brain waves affected the identification of motion by the two arms in specific brain regions.
The CSP algorithm was used to analyze EEG data with uncertain time characteristics and to find signals that distinguish arm movements by analyzing signal differences during operation, and to analyze frequency signals, the distribution of average result values occurring in low-frequency areas (0–20 Hz) was used. Because the signal EEG is essentially an indirect measurement, it has very uncertain and nonlinear characteristics that prevent its use as a control signal. However, if a study is conducted that can identify the occurrence or manifestation of muscle signals through various analysis methods, such as the approach covered in this study, a more reliable control method will be implemented for analysis in the future. Although it is difficult to predict potential accurately in the current situation, it is expected that brain waves can produce and utilize many motion-related brain maps, and that if we study the various brain wave analysis techniques that occur during human operations, we can proceed and verify the proper means of noise elimination that occur along with the operation. Furthermore, future studies will validate algorithms against a large number of subjects and identify differences from the results. In the future, we will categorize muscle movement time (1 s) in stages and then compare the output characteristics according to time intervals. Moreover, the next study will select a larger number of subjects (5–10 left- and right-handed), to increase the number of samples used for data analysis and compare the results. If noise cancellation is applied step by step, a comparable study will be conducted to see how the resulting data will differ depending on the noise environment.

Author Contributions

Conceptualization, H.C.C.; Methodology, B.I.J. and J.K.; Software and Experiment, B.I.J. and B.J.K.; Visualization, B.J.K. and J.K.; Validation, H.C.C.; Writing–Original Draft, B.I.J.; Review & editing, B.I.J. and H.C.C.; Project Administration, H.C.C.

Funding

This research received no external funding.

Conflicts of Interest

The authors declare no conflict of interest.

References

  1. Suleiman, A.B.R.; Fatehi, T.A.H. Features Extraction Techniques of EEG Signal for BCI Applications; Faculty of Computer and Information Engineering Department College of Electronics Engineering, University of Mosul: Mosul, Iraq, 2007. [Google Scholar]
  2. Naik, G.R.; Nguyen, H.T. Nonnegative matrix factorization for the identification of EMG finger movements: Evaluation using matrix analysis. IEEE J. Biomed. Health Inform. 2015, 19, 478–485. [Google Scholar] [CrossRef]
  3. Menon, R.; Caterina, G.D.; Lakany, H.; Petropoulakis, L.; Conway, B.A.; Soraghan, J.J. Study on interaction between temporal and spatial information in the classification of EMG signals in myoelectric prostheses. IEEE Trans. Neural Syst. Rehabil. Eng. 2017, 25, 1832–1842. [Google Scholar] [CrossRef]
  4. Guo, Y.; Naik, G.R.; Huang, S.; Abraham, A.; Nguyen, H.T. Nonlinear multiscale maximal Lyapunov exponent for accurate myoelectric signal classification. Appl. Soft Comput. 2015, 36, 633–640. [Google Scholar] [CrossRef]
  5. Gu, Y.; Yang, D.; Huang, Q.; Yang, W.; Liu, H. Robust EMG pattern recognition in the presence of confounding factors: Features, classifiers and adaptive learning. Expert Syst. Appl. 2018, 96, 208–217. [Google Scholar] [CrossRef]
  6. Bhardwaj, S.; Jadhav, P.; Adapa, B.; Acharyya, A.; Naik, G.R. Online and automated reliable system design to remove blink and muscle artifact in EEG. In Proceedings of the 2015 37th Annual International Conference of the IEEE Engineering in Medicine and Biology Society(EMBC), Milan, Italy, 25–29 August 2015; pp. 6784–6787. [Google Scholar]
  7. Kwon, Y.; Kim, K.I.; Tompkin, J.; Kim, J.H.; Theobalt, C. Efficient learning of image super-resolution and compression artifact removal with semi-local Gaussian processes. IEEE Trans. Pattern Anal. Mach. Intell. 2015, 37, 1792–1805. [Google Scholar] [CrossRef] [PubMed]
  8. Jadhav, P.N.; Shanamugan, D.; Chourasia, A.; Ghole, A.R.; Acharyya, A.A.; Naik, G. Automated detection and correction of eye blink and muscular artefacts in EEG signal for analysis of Autism Spectrum Disorder. In Proceedings of the 2014 36th Annual International Conference of the IEEE Engineering in Medicine and Biology Society, Chicago, IL, USA, 26–30 August 2014; pp. 1881–1884. [Google Scholar]
  9. Steinhardt, C.R.; Bettthauser, J.; Hunt, C.; Thakor, N. Registration of EMG Electrodes to Reduce Classification Errors due to Electrode Shift. In Proceedings of the 2018 IEEE Biomedical Circuits and Systems Conference (BioCAS), Cleveland, OH, USA, 17–19 October 2018. [Google Scholar]
  10. Jeon, B.I.; Cho, H.C.; Jeon, H.T. The Implementation of the Intelligent Exoskeleton Robot Arm Using ElectroMiogram (EMG) vital Signal. J. Korean Inst. Intell. Syst. 2012, 22, 533–539. [Google Scholar] [CrossRef]
  11. Afsharipour, B.; Soedirdjo, S.; Merletti, R. Two-dimensional surface EMG: The effects of electrode size, interelectrode distance and image truncation. Biomed. Signal Process. Control 2019, 49, 298–307. [Google Scholar] [CrossRef]
  12. Lee, J.; Hsu, H.-H.; Ho, Y.-E. Scalable Package-level RFI Filter for Digital Clock Noise Mitigation in 5-GHz and future 6-GHz WiFi Applications. In Proceedings of the 2019 IEEE International Symposium on Electromagnetic Compatibility, Signal & Power Integrity (EMC+ SIPI), New Orleans, LA, USA, 22–26 July 2019. [Google Scholar]
  13. Miskovic, V.; MacDonald, K.J.; Rhodes, L.J.; Cote, K.A. Changes in EEG multiscale entropy and power-law frequency scaling during the human sleep cycle. Hum. Brain Mapp. 2019, 40, 538–551. [Google Scholar] [CrossRef] [PubMed]
  14. Christensen, S.M.; Holm, N.S.; Puthusserypady, S. An Improved Five Class MI Based BCI Scheme for Drone Control Using Filter Bank CSP. In Proceedings of the 7th International Winter Conference on Brain-Computer Interface, Jeongseon, Korea, 18–20 February 2019. [Google Scholar]
  15. Jin, Y.; Mousavi, M.; de Sa, V.R. Adaptive CSP with subspace alignment for subject-to-subject transfer in motor imagery brain-computer interfaces. In Proceedings of the 2018 6th International Conference on Brain-Computer Interface (BCI), GangWon, Korea, 15–17 January 2018. [Google Scholar]
  16. Al-Shargie, F.; Tang, T.B.; Badruddin, N.; Kiguchi, M. Towards multilevel mental stress assessment using SVM with ECOC: An EEG approach. Med. Biol. Eng. Comput. 2018, 56, 125–136. [Google Scholar] [CrossRef] [PubMed]
  17. Lóopez-Larraz, E.; Birbaumer, N.; Ramos-Murguialday, A. A hybrid EEG-EMG BMI improves the detection of movement intention in cortical stroke patients with complete hand paralysis. In Proceedings of the 2018 40th Annual International Conference of the IEEE Engineering in Medicine and Biology Society (EMBC), Honolulu, HI, USA, 18–21 July 2018. [Google Scholar]
  18. Pan, L.-L.H.; Yang, W.-W.; Kao, C.-L.; Tsai, M.-W.; Wei, S.-H.; Fregni, F.; Chen, V.C.-F.; Chou, L.-W. Effects of 8-week sensory electrical stimulation combined with motor training on EEG-EMG coherence and motor function in individuals with stroke. Sci. Rep. 2018, 8, 9217. [Google Scholar] [CrossRef] [PubMed]
  19. Caramia, N.; Lotte, F.; Ramat, S. Optimizing spatial filter pairs for EEG classification based on phase-synchronization. In Proceedings of the 2014 IEEE International Conference on Acoustics, Speech and Signal Processing (ICASSP), Florence, Italy, 4–9 May 2014; pp. 2049–2053. [Google Scholar]
  20. Igasaki, T.; Yamashita, K.; Ushijima, T. Force-Temporal Characteristics of EEG-EMG Coherence During Isometric Contraction of the Tibialis Anterior Muscle. In Proceedings of the 2018 11th Biomedical Engineering International Conference (BMEiCON), Chiang Mai, Thailand, 21–24 November 2018. [Google Scholar]
  21. Guarnieri, R.; Marino, M.; Barban, F.; Ganzetti, M.; Mantini, D. Online EEG artifact removal for BCI applications by adaptive spatial filtering. J. Neural Eng. 2018, 15, 056009. [Google Scholar] [CrossRef] [PubMed]
Figure 1. EMG (electromyogram) output during muscle movement and EMG output at specific intervals.
Applsci 09 04885 g001
Figure 2. Measurement points for EEG (electroencephalogram) and EMG. (a) EEG pole measurement point; (b) EMG pole measurement point.
Applsci 09 04885 g002
Figure 3. Block diagram for raw EMG measurement.
Applsci 09 04885 g003
Figure 4. The region in charge of motion in the brain and the basic characteristics of the left and right hemispheres.
Applsci 09 04885 g004
Figure 5. Experimental environment configuration for the output and data extraction of EMG and EEG signals.
Applsci 09 04885 g005
Figure 6. Procedure for extracting experimental data.
Applsci 09 04885 g006
Figure 7. EMG synchronization and EEG output and data analysis procedures.
Applsci 09 04885 g007
Figure 8. Procedure for CSP algorithm of raw data output.
Applsci 09 04885 g008
Figure 9. Comparison between raw data and CSP filtered data according to electrode attachment location. (a) Raw EEG output for right-hand (upper) and left-hand (lower) C3 and C4 channels, respectively; (b) CSP EEG output for right-hand (upper) and left-hand (lower) C3 and C4 channels.
Applsci 09 04885 g009
Figure 10. Comparison of the output of raw data in left- and right-handed operations.
Applsci 09 04885 g010
Figure 11. Comparison of the output of CSP filtering data in left- and right-handed operations.
Applsci 09 04885 g011
Figure 12. Outputs by frequency of raw EEG and CSP EEG for channels 1–8. (a) RAW EEG output for channels 1–8 right (upper) and left (lower); (b) CSP EEG output for channels 1–8 right (upper) and left (lower).
Applsci 09 04885 g012
Figure 13. Outputs by frequency of Diff raw EEG and Diff CSP EEGs for channels 1–8. (a) Right-hand (upper) and left-hand (lower) channel Diff raw EEG outputs; (b) right-hand (upper) and left-hand (lower) channel Diff CSP EEG outputs.
Applsci 09 04885 g013
Figure 14. Comparison of classification accuracy of left and right arms EEGs according to the experimental samples.
Applsci 09 04885 g014
Figure 15. Comparison of characteristic areas for frequency output and two arms’ (left and right arm) operations for channels 1–8.
Applsci 09 04885 g015

