Article

Identification of Novel Markers of Prostate Cancer Progression, Potentially Modulated by Vitamin D

1
Department G.F. Ingrassia, Section of Anatomic Pathology, University of Catania, 95123 Catania, Italy
2
Department of Biomedical and Biotechnological Sciences, Human Anatomy and Histology Section, School of Medicine, University of Catania, 95123 Catania, Italy
3
Department of Drug Sciences, University of Catania, Viale A. Doria 6, 95125 Catania, Italy
4
Department of Surgery, Urology Section, University of Catania, 95123 Catania, Italy
5
Obesity Unit, CETAC Medical and Research Center, 81100 Caserta, Italy
*
Author to whom correspondence should be addressed.
Appl. Sci. 2019, 9(22), 4923; https://doi.org/10.3390/app9224923
Submission received: 27 August 2019 / Revised: 27 October 2019 / Accepted: 13 November 2019 / Published: 15 November 2019
(This article belongs to the Special Issue Immunohistochemical Expression)

Abstract

:
Prostate cancer (PCa) is one of the most common cancers in men. The main risk factors associated with the disease include older age, family history of the disease, smoking, alcohol and race. Vitamin D is a pleiotropic hormone whose low levels are associated with several diseases and a risk of cancer. Here, we undertook microarray analysis in order to identify the genes involved in PCa. We analyzed three PCa microarray datasets, overlapped all genes significantly up-regulated, and subsequently intersected the common genes identified with the down-regulated genes transcriptome of LNCaP cells treated with 1α,25(OH)2D3, in order to identify the common genes involved in PCa and potentially modulated by Vitamin D. The analysis yielded 43 genes potentially involved in PCa and significantly modulated by Vitamin D. Noteworthy, our analysis showed that six genes (PRSS8, SOX4, SMYD2, MCCC2, CCNG2 and CD2AP) were significantly modulated. A Pearson correlation analysis showed that five genes out of six (SOX4 was independent), were statistically correlated with the gene expression levels of KLK3, and with the tumor percentage. From the outcome of our investigation, it is possible to conclude that the genes identified by our analysis are associated with the PCa and are potentially modulated by the Vitamin D.

Graphical Abstract

1. Introduction

Vitamin D is synthesized in the body through a complex series of steps beginning in the skin, under the influence of ultraviolet light, where a cholesterol precursor molecule (7-dehydrocholesterol) is transformed into the Vitamin D hormone precursor, cholecalciferol (also known as Vitamin D3). Vitamin D3 is subsequently hydroxylated in the liver by the 25-hydroxycholecalciferol and transformed in calcidiol or calcifediol (25(OH)D3 or 25D3), and this latter is subjected, in the kidney, to an hydroxylation, to yield the most active hormone form of these compounds, calcitriol (1,25-dihydroxycholecalciferol or 1,25(OH)2D3 or 1,25D3) [1]. The three main stages in Vitamin D metabolism, 25-hydroxylation, 1α-hydroxylation and 24-hydroxylation, are all performed by cytochrome P450 mixed-function oxidases (CYPs).
These enzymes are distributed either in the endoplasmic reticulum (ER) (CYP2R1) or in the mitochondria (CYP27A1, CYP27B1 and CYP24A1). The 24-hydroxylase (CYP24A1) and 1-hydroxylase (CYP27B1) enzymes are considered to be pivotal determinants of the local concentration of active vitamin D. When Vitamin D3 is transferred to the liver, it is hydroxylated (by CYP27A1) and then converted to 25-hydroxyvitamin D3, which is the major form of vitamin D present in the blood. In this form it is also hydroxylated in other tissues, predominantly the kidney, through 1-α hydroxylase (CYP27B1), which is then converted to 1,25-dihydroxyvitamin D3. This form is able to bind to vitamin D-binding proteins (VBP) in the bloodstream and modulate the transcription of its target gene through binding to the vitamin D receptor (VDR) in tissues. The last steps of Vitamin D3 catabolism are played by the catalytic enzyme, 24-hydroxylase, encoded by CYP24A1 and responsible for vitamin D catabolism, which is then metabolized to calcitroic acid, a bile secretion [2].
Serum 25(OH)D3 is the barometer for Vitamin D status. Serum calcitriol provides no information about Vitamin D status, and it is often at physiological or even elevated due to secondary hyperparathyroidism associated with Vitamin D deficiency.
The Vitamin D plays a relevant role in bone formation, activates the immune cells [3,4,5], regulates the host defense against microbial and virus infections [6,7,8], inhibits several tumor pathways, such as the proliferation and angiogenesis [9] and it has been hypothesized that it is able to reduce prostate cancer (PCa) risk [10]. In this regard, it has been shown that a ‘U’ shaped relationship may exist between Vitamin D status (cholecalciferol, calcidiol, calcitriol and calcitroic acid) and PCa, and that the optimal range of circulating 25(OH)D3 for PCa prevention may be narrow [11].
Prostate cancer (PCa) is one of the most common causes of morbidity and mortality in men. Several factors have been linked to the incidence of PCa and its aggressiveness. Among these, age, race and family history are some of the strongest [12]. The incidence rate is high in men 65–74 years of age with a median age at diagnosis of 66. The percent of PCa deaths is highest among men between 75 to 84 years old with a median age at death of 80 [13] Epidemiologic studies regarding PCa showed that there are significant differences in geographical distribution and race. The African-American race, for example, experiences an incidence rate of 60% compared to Caucasian men, other than more aggressive forms and worse treatment management, leading to increased mortality [14]. Interestingly, one of the major correlations between Vitamin D levels and PCa is based on studies on African-American men. In these individuals, 25(OH)D3 levels are often low (probably for the effect of skin pigmentation on the synthesis of Vitamin D), and PCa risks are clearly higher than those of Caucasian men. Nowadays, the mechanisms for this association are still unclear.
There are a large number of epidemiologic studies linking Vitamin D and prostate cancer risk and outcomes. The high serum vitamin D3 levels, estimated by measuring 25(OH)D3, play important roles in the prevention of various forms of cancer, including prostate cancer [15]. An in vitro study using prostate cancer LNCaP cells reported that a potent analog of 1,25(OH)2D3 (EB108928) plays an inhibitory role on the growth of cancer cells [16]. In another study in immortalized human prostate cell lines (PZ-HPV-7 cells), 10 nM of 25(OH)D3 was reported to have growth inhibitory activity [16]. In 2018, a meta-analysis study, composed of seven eligible cohort studies with 7808 participants, suggested that higher 25(OH)D3 level was associated with a reduction of mortality in prostate cancer patients, suggesting that Vitamin D can be considered an important protective factor in the progression and prognosis of prostate cancer [17]. Recently, it has been shown that dietary Vitamin D causes a dose-dependent increase in serum 25(OH)D3 levels and a reduction in the percentage of mice with adenocarcinoma, but it did not improve bone mass. In contrast, high calcium did suppress serum 1,25(OH)2D3 levels, leading to an increased incidence of adenocarcinoma and improved bone mass. These data support the hypothesis that the loss of Vitamin D signaling accelerates the early stages of prostate carcinogenesis [18]. Furthermore, it is important to note that several factors could influence the anticancer action played by Vitamin D on PCa, such as the polymorphism of its receptor (VDR) [19] or the expression of the enzymes (CYP24A1 and CYP27B1) that regulate its metabolism [20].
The aim of this study was to find new target genes of PCa, and those potentially modulated by the action of Vitamin D (1,25D3 and 25D3). We explored several microarray datasets in order to investigate and identify possible cancer gene pathways hypothetically modulated by the action of Vitamin D.

2. Materials and Methods

2.1. Dataset Selection

In our analysis, we have selected several microarray datasets based on mRNA expression profiling available on the NCBI GEODataset (https://www.ncbi.nlm.nih.gov/gds/). Mesh terms “Prostate cancer” and “Vitamin D” were used to identify potential datasets of interest. We sorted the obtained datasets by the number of samples (High to Low) and for clinical data made available by the authors. Three dataset of PCa and two of the LNCaP cell line were selected: GSE70770 [21,22], GSE62872 [23], GSE6919 [24,25], GSE64657, and GSE107438 [26].
The GSE70770 (platform GPL10558), was composed by 293 prostate biopsies samples obtained by 74 matched benign tissue (indicated as healthy) and 219 patients subjected to robotic radical prostatectomy (RRP) surgery. As regards the GSE62872 (platform GPL19370), the overall design included 160 normal prostate tissue samples from the Health Professionals Follow-up Study (indicated as healthy) and 264 with a prostate tumor. In the GSE6919 (platform GPL8300), we selected 18 adjacent normal prostate tissue biopsies free of any pathological alteration (indicated as healthy) and 65 primary prostate tumor biopsies from patients subjected to prostatectomy. Furthermore, our study included a further one dataset (GSE64657, platform GPL4133) of an in-vitro model of the PCa cell line (LNCaP) after 24 h treatment with different nuclear receptor ligands, and with time-matching control. We have decided to consider only the data coming from the LNCaP treatment with Vitamin D (100 nM 1,25D3 for 24 h), the natural ligand for VDR. There is no publication available for this dataset. The experimental details are recoverable on the following link (https://www.ncbi.nlm.nih.gov/geo/query/acc.cgi?acc=GSE64657). In order to verify the gene pathways modulation by Vitamin D in prostate cancer, we analyzed the GSE107438 dataset, composed by LNCaP cells line transfected with control siRNA (siCT), siRNA for CYP27B1 (siCYP27B1) or siRNA for VDR (siVDR) followed by 100 nM of 25(OH)D3 (25D3) or 1,25(OH)2D3 (1,25D3) treatment for another 24 h. Complete experimental details are available in the following publication [26].
Complete demographic data of patients and healthy controls can be obtained from the relative publication cited above.

2.2. Data Processing

To process and identify significant differentially expressed genes (SDEG) in data sets, we used the MultiExperiment Viewer (MeV) software (The Institute for Genomic Research (TIGR), J. Craig Venter Institute, Rockville, MD, USA). In cases where multiple genes probes have insisted on the same GeneID NCBI, we have used those with the highest variance. The significance threshold level for all data sets was p < 0.05. The genes with p < 0.05 were selected for further analysis. For all datasets we performed a statistical analysis with GEO2R, applying a Benjamini & Hochberg (False discovery rate) to adjust p values for multiple comparisons [27,28,29]. From GSE70770, we identified, respectively, 2279 and 9785 genes that were significantly up-regulated and down-regulated, comparing the prostate biopsies samples of healthy vs. tumor patients. Regarding GSE62872, we obtained a total of 2312 and 1060, respectively, of significantly up-regulated and down-regulated genes, comparing the prostate biopsies samples of healthy vs. tumor patients. The analysis of GSE6919 produced 1747 and 1060 genes, respectively, that were significantly up-regulated and down-regulated in prostate biopsies samples of healthy vs. tumor patients. Furthermore, the analysis of GSE64657 produced 995 up-regulated and 2196 down-regulated and significantly expressed genes, comparing the LNCaP cells line treated with vehicle (ethanol) and 1,25D3 (100 nM) for 24 h. All data analysis are available in Table S1.
In order to identify genes commonly modulated between the four GSEs, we performed a Venn diagram analysis, using the web-based utility Venn Diagram Generator (http://bioinformatics.psb.ugent.be/webtools/Venn/). To analyze a 2 × 2 contingency table, a chi-square with Yates correction was performed by GraphPad Prism software (http://graphpad.com/quickcalcs/contingency1.cfm). The association between rows (groups) and columns (outcomes) with p < 0.01 was considered to be statistically significant.
The genes Ontology analysis was performed using the web utility GeneMANIA (http://genemania.org/, http://genemania.org/) [30] and the GATHER (Gene Annotation Tool to Help Explain Relationships) (http://changlab.uth.tmc.edu/gather/) [31]. The GeneMANIA was also used for built the weighted gene networks commonly modulated. GeneMANIA searches publicly-available genomics and proteomics data, including data from gene and protein expression profiling studies and primary and curated molecular interaction networks and pathways, to find related genes. The network weighting method is ‘Gene-Ontology (GO)-based weighting, Biological Process-based’. This weighting method assumes the input gene list is related in terms of biological processes (as defined by GO).
GHATER (Gene Annotation Tool to Help Explain Relationships) (http://changlab.uth.tmc.edu/gather/) is an online tool that explains the function of a group of genes, such as a cluster of co-regulated genes from microarrays. The tool is a comprehensive system that combines gene function, ontology, pathways and statistical tools that enable researchers to analyze large-scale, genome-wide data from sequencing, proteomics or gene expression experiments. The analysis of gene ontology is based on the Bayes factor. This is a measure of the strength of the evidence supporting an association of an annotation with your gene list. Higher Bayes factors indicate stronger evidence that the annotation is relevant to your genes. The p value restituted during the analysis is calculated based on the probability of seeing a Bayes factor of a particular magnitude in a query. Complete explanation of the online tool can be retrieved in the following publication [31] and in the following online website (http://changlab.uth.tmc.edu/gather/FAQ.html).

2.3. The Immunohistochemistry (IHC) Analysis by the Human Atlas Project

The analysis of the data from the microarray provided results about the mRNA expression levels. To confirm these results, we decided to use the web utility “The Human Protein Atlas” (https://www.proteinatlas.org/) [32,33,34]. This web site is licensed under the Creative Commons Attribution-ShareAlike 3.0 International License (https://creativecommons.org/licenses/by-sa/3.0/) for all copyrightable parts (https://wiki.creativecommons.org/wiki/Data) of the database. We selected the immunohistochemistry analysis available on the web site. For each antibody, the observed staining has been assigned a validation score. The validation score is based on the result of two different validations that are separately evaluated. The different levels of validation score are Supported, Approved or Uncertain (https://www.proteinatlas.org/about/antibody+validation#ifv). Annotation parameters include an evaluation of staining intensity (SI) (negative, weak, moderate or strong), fraction of stained cells (rare, <25%, 25–75% or >75%) and subcellular localization (nuclear and/or cytoplasmic/membranous). The reliability scores are based on the following criteria:
Supportive: Two independent antibodies yielding similar or partly similar staining patterns; two independent antibodies yielding dissimilar staining patterns, both supported by experimental gene/protein characterization data; one antibody yielding a staining pattern supported by experimental gene/protein characterization data; one antibody yielding a staining pattern with no available experimental gene/protein characterization data, but supported by other assay within the protein atlas; one or more independent antibodies yielding staining patterns not consistent with experimental gene/protein characterization data, but supported by siRNA assay.
Uncertain: Two independent antibodies yielding partly similar staining patterns, but not consistent with experimental protein/gene characterization data; two independent antibodies yielding dissimilar staining patterns with no available, or partly supportive/partly conflicting, experimental gene/protein characterization data; one antibody yielding a staining pattern with no available, or partly supportive/partly conflicting experimental gene/protein characterization data.
Details of analysis performed are available in Table S1.

2.4. Statistical Analysis

For statistical analysis, Prism 7 software (GraphPad Software, San Diego, California, USA) was used. Based on the Shapiro-Wilk test, almost all data were skewed, so nonparametric tests were used. Significant differences between groups were assessed using the Mann–Whitney U test, and a Kruskal-Wallis test was performed to compare data between all groups followed by Dunn’s post hoc test. Correlations were determined using Spearman’s ρ correlation. All tests were two-sided and significance was determined at p < 0.05. To analyze a 2 × 2 contingency table, a Chi-square with Yates correction was performed by GraphPad Prism software (http://graphpad.com/quickcalcs/contingency1.cfm). The association between rows (groups) and columns (outcomes) with p < 0.0001 was considered to be extremely statistically significant.
The analysis of microarray data by Z-score transformation was used in order to allow the comparison of microarray data independent of the original hybridization intensities [35].

3. Results

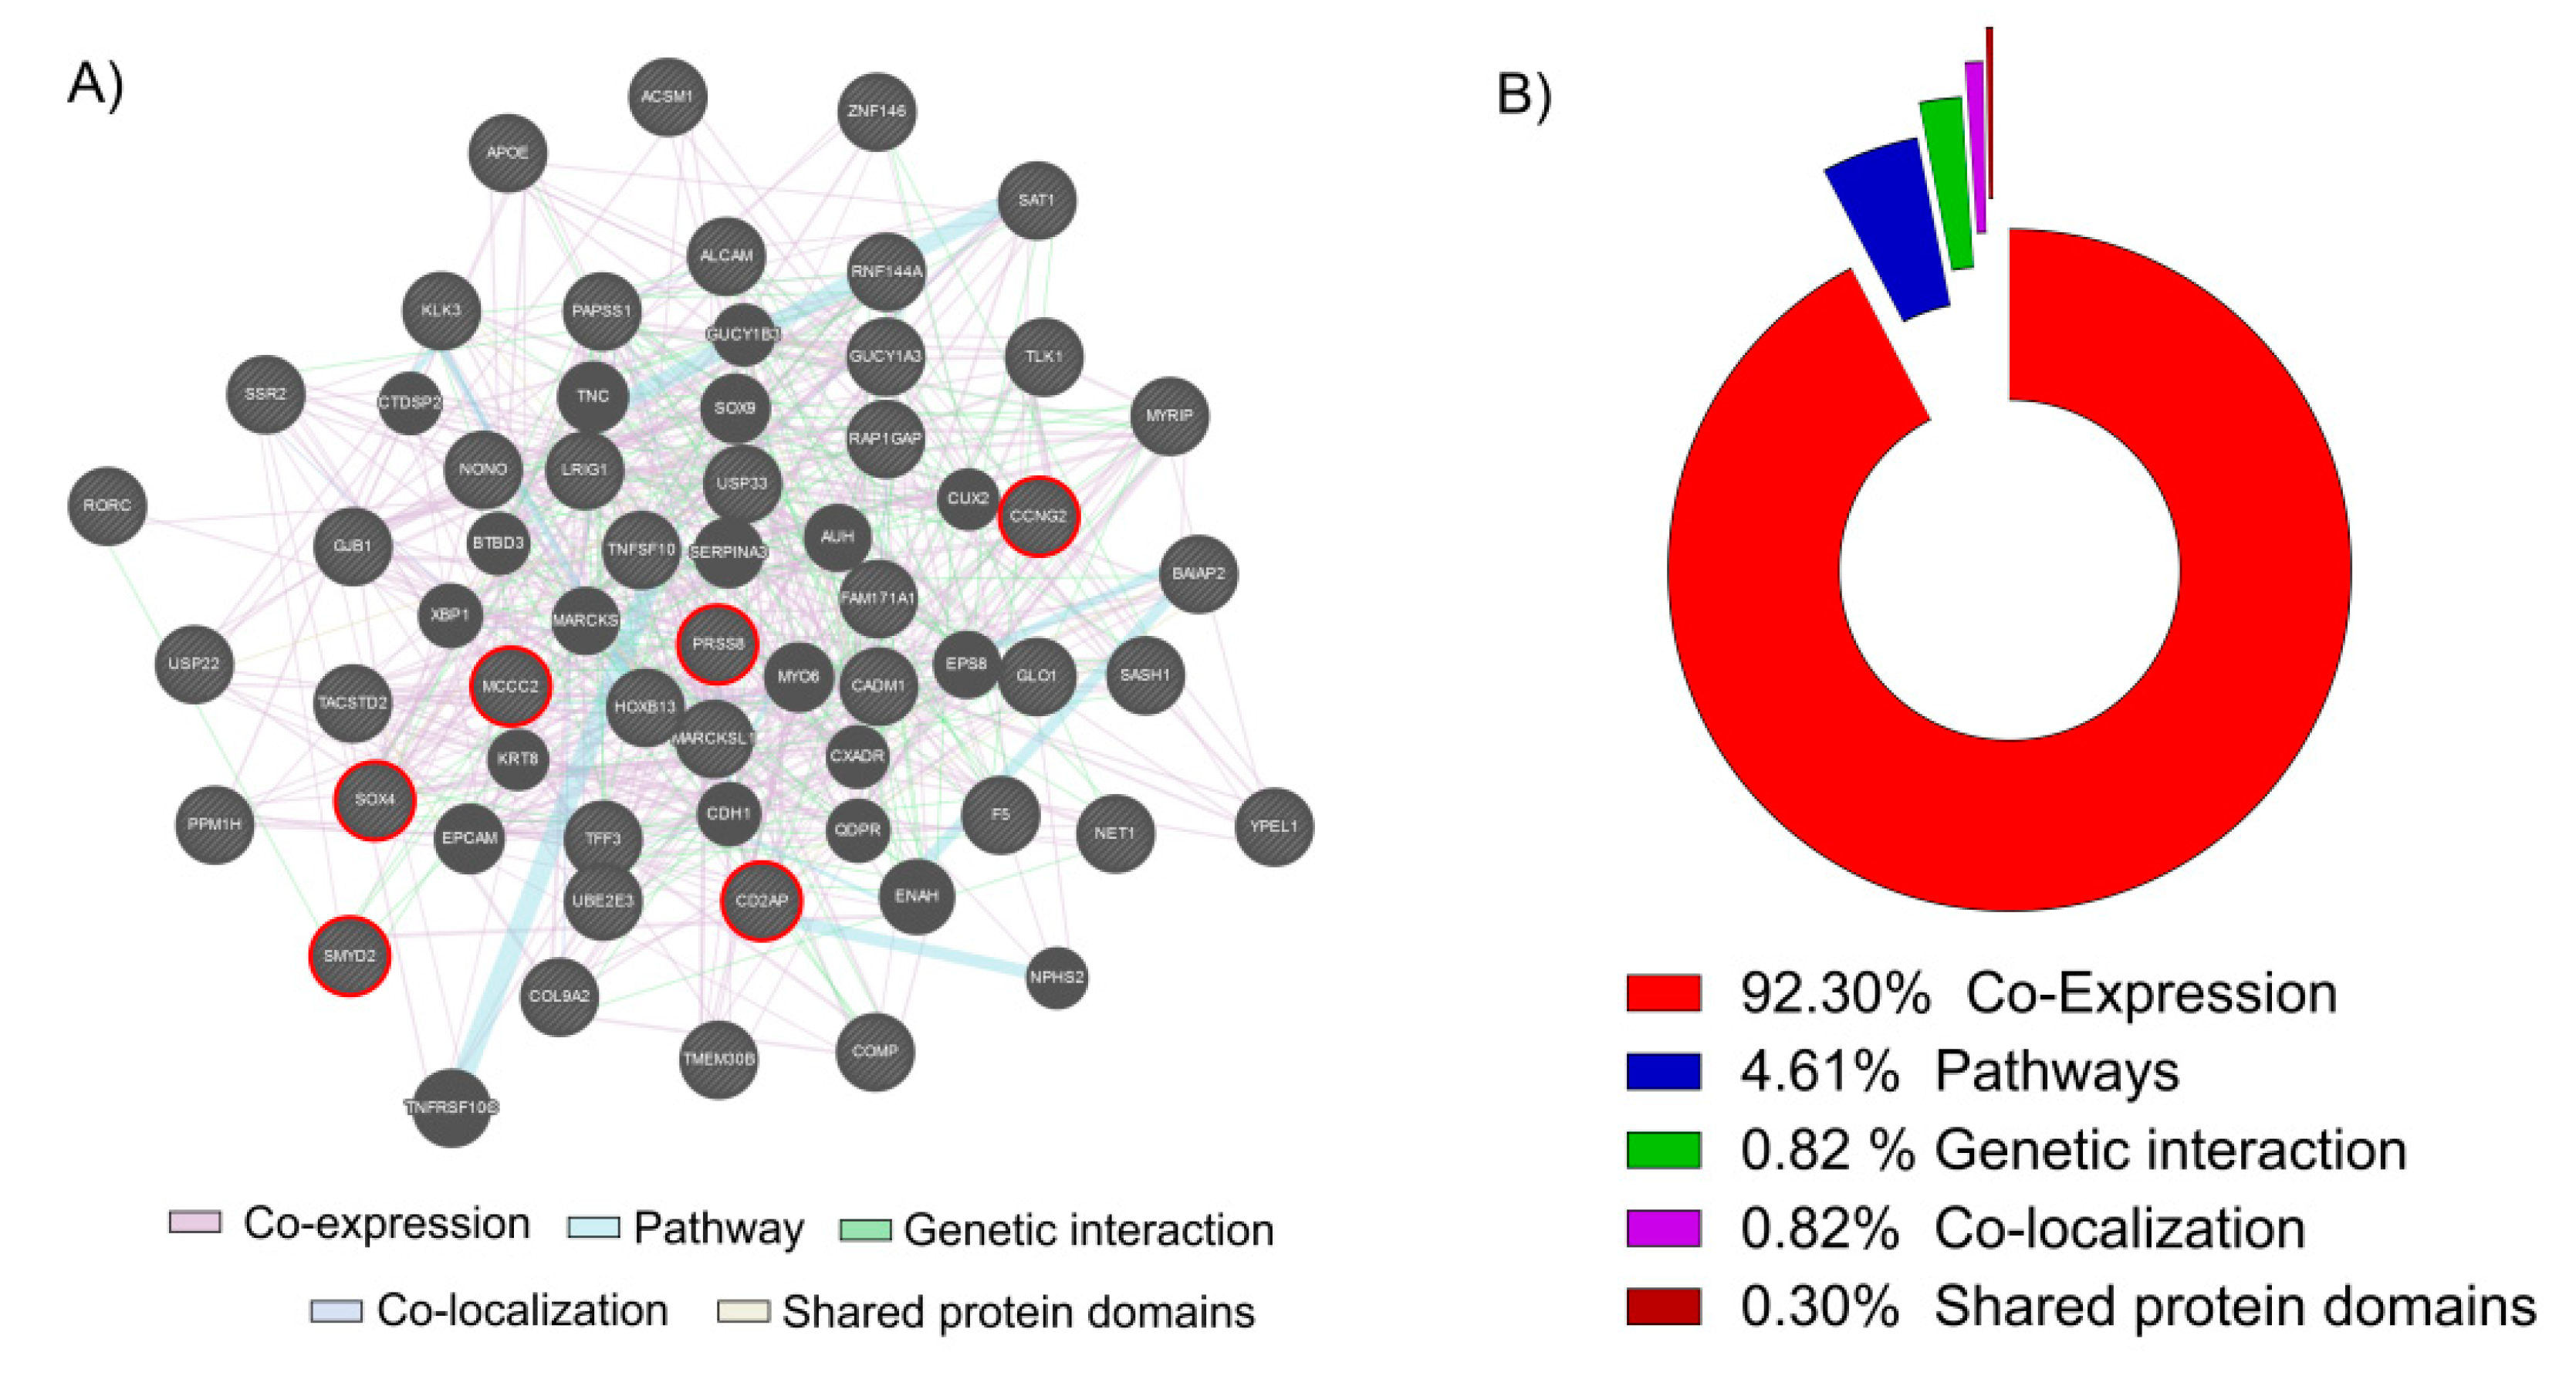
3.1. The Vitamin D Is Able to Modulate 43 Key Genes in PCa

The comparison of the three human PCa datasets (GSE70770, GSE62872 and GSE6919) produced 276 common significantly up-regulated genes (458 down-regulated genes) (Figure 1A) (Table S1).
These common regulated key genes were compared to significantly down-regulated genes in GSE64657, composed by the transcriptome of the LNCaP cell line, treated for 24 h with 100 nM of 1,25D3 (Figure 1B). The data overlapping produced 43 genes significantly in common between the dataset (chi-square p < 0.0001), namely meaning being virtually modulated by the action of Vitamin D in PCa. Gene Ontology (GO) analysis of the 43 genes belonging to the common group modulated by Vitamin D identified six main molecular functions as statistically significant: organogenesis (GO:0009887)(neg ln(p value) = 6.37); organ development (GO:0048513)(neg ln(p value) = 6.37); skeletal development (GO:0001501)(neg ln(p value) = 5.43); regulation of chromatin assembly or disassembly (GO:0001501)(neg ln(p value) = 5.06); morphogenesis (GO:0009653)(neg ln(p value) = 4.95); cell migration (GO:0016477)(neg ln(p value) = 4.41) (Figure 1C). Complete annotation, significance and genes involved are available in Table S1, section Gather Analysis.
We also overlapped the common down-regulated key genes in PCas obtained by the Venn analysis of the three datasets, with the significantly up-regulated genes in GSE64657. The overlap produced 41 genes significantly in common between the dataset (chi-square p < 0.0001), also modulated by Vitamin D (Table S1).
In this study, we decided to focus our analysis only to the 43 key genes in common obtained overlapping the up-regulated genes in cancer and the genes down-regulated by the Vitamin D. We used these 43 genes to generate a network analysis by GeneMania web utility software (Figure 2A).
The 92.30% of genes resulted co-expressed, 4.61% belonging to the same pathways, 1.97% present a genetic interaction, 0.82% were co-localizated and 0.30% shared the same protein domains (Figure 2B). Complete data report is available in Table S2. Belonging to among the 43 key genes, we selected the six most significantly up-regulated in PCa and down-regulated by the action of Vitamin D in LNCaP cell line: serine protease 8 (PRSS8); SRY-box 4 (SOX4); SET and MYND domain containing 2 (SMYD2); methylcrotonoyl-CoA carboxylase 2 (MCCC2); cyclin G2 (CCNG2); CD2 associated protein (CD2AP). We decided to perform a Z-score transformation in order to allow the comparison of microarray data independent of the original hybridization intensities.
The three microarray dataset clustering (GSE70770, GSE62872 and GSE6919) allowed us to obtain a large number of samples (251 healthy control and 548 PCa samples). Complete demographic data of patients and healthy controls can be retrieved from the relative publication and in the Table S1. The samples were homogeneous for the age (Table S1). We showed that all genes increased significantly with respect to the single dataset (Figure 3A) (Figure S1).
In order to verify a possible correlation between the selected genes and the PCa tumor progression, we correlate the z-score intensity expression levels of all six genes highlighted with the genes expression of kallikrein related peptidase 3 (KLK3). The KLK3 is a serine protease produced by epithelial cells in the prostate and its protein is also known as PSA (prostate specific antigen). It is largely demonstrated that the serum levels of PSA increase in the presence of cancer [36].We showed a significantly positive correlation between all genes and KLK3 gene expression (Figure 3B). SOX4 was an exception (Table S1).
Interesting data were obtained when we decided to analyze the correlation between the z-score expression levels of the six genes and the histological parameter of tumor percent, available in the datasets. We showed that all genes were significantly positively correlated to the tumor % (p < 0.0001 with r = 0.3246 for PRSS8; p = 0.0003 with r = 0.2449 for MCCC2; p = 0.0045 with r = 0.1922 for SOX4; p < 0.0001 with r = 0.3734 for CCNG2; p < 0.0001 with r = 0.3030 for SMYD2; p < 0.0001 with r = 0.3162 for CD2AP) (Figure 3C) (Table S1), particularly, we identified that CCNG2 was the most correlated to the tumor %.
Furthermore, we also hypothesized that the genes involved in the production and inactivation of Vitamin D could be modulated in PCa patients. The expression levels analysis of the cytochrome P450 family 27 subfamily B member 1 (CYP27B1), the cytochrome P450 family 24 subfamily A member 1 (CYP24A1), the cathelicidin antimicrobial peptide (CAMP) and the vitamin D receptor (VDR) showed interesting results (Figure 4).
All genes, except CYP27B1 (p = ns), were downregulated in PCa patients compared to healthy controls subjects (CYP24A1 p < 0.0001; CAMP p < 0.0001; VDR p< 0.0001) (Figure 4A). In addition, we showed that the expression levels of VDR and CYP24A1 were negatively correlated with KLK3 in healthy (CYP24A1 with r = −0.1513 and p = 0.0164; VDR with r = −0.1616 and p = 0.0103) (Figure 4B) and in PCa patients (CYP24A1 with r = −0.1975 and p < 0.0001; VDR with r = −0.2651 and p < 0.0001) (Figure 4C).

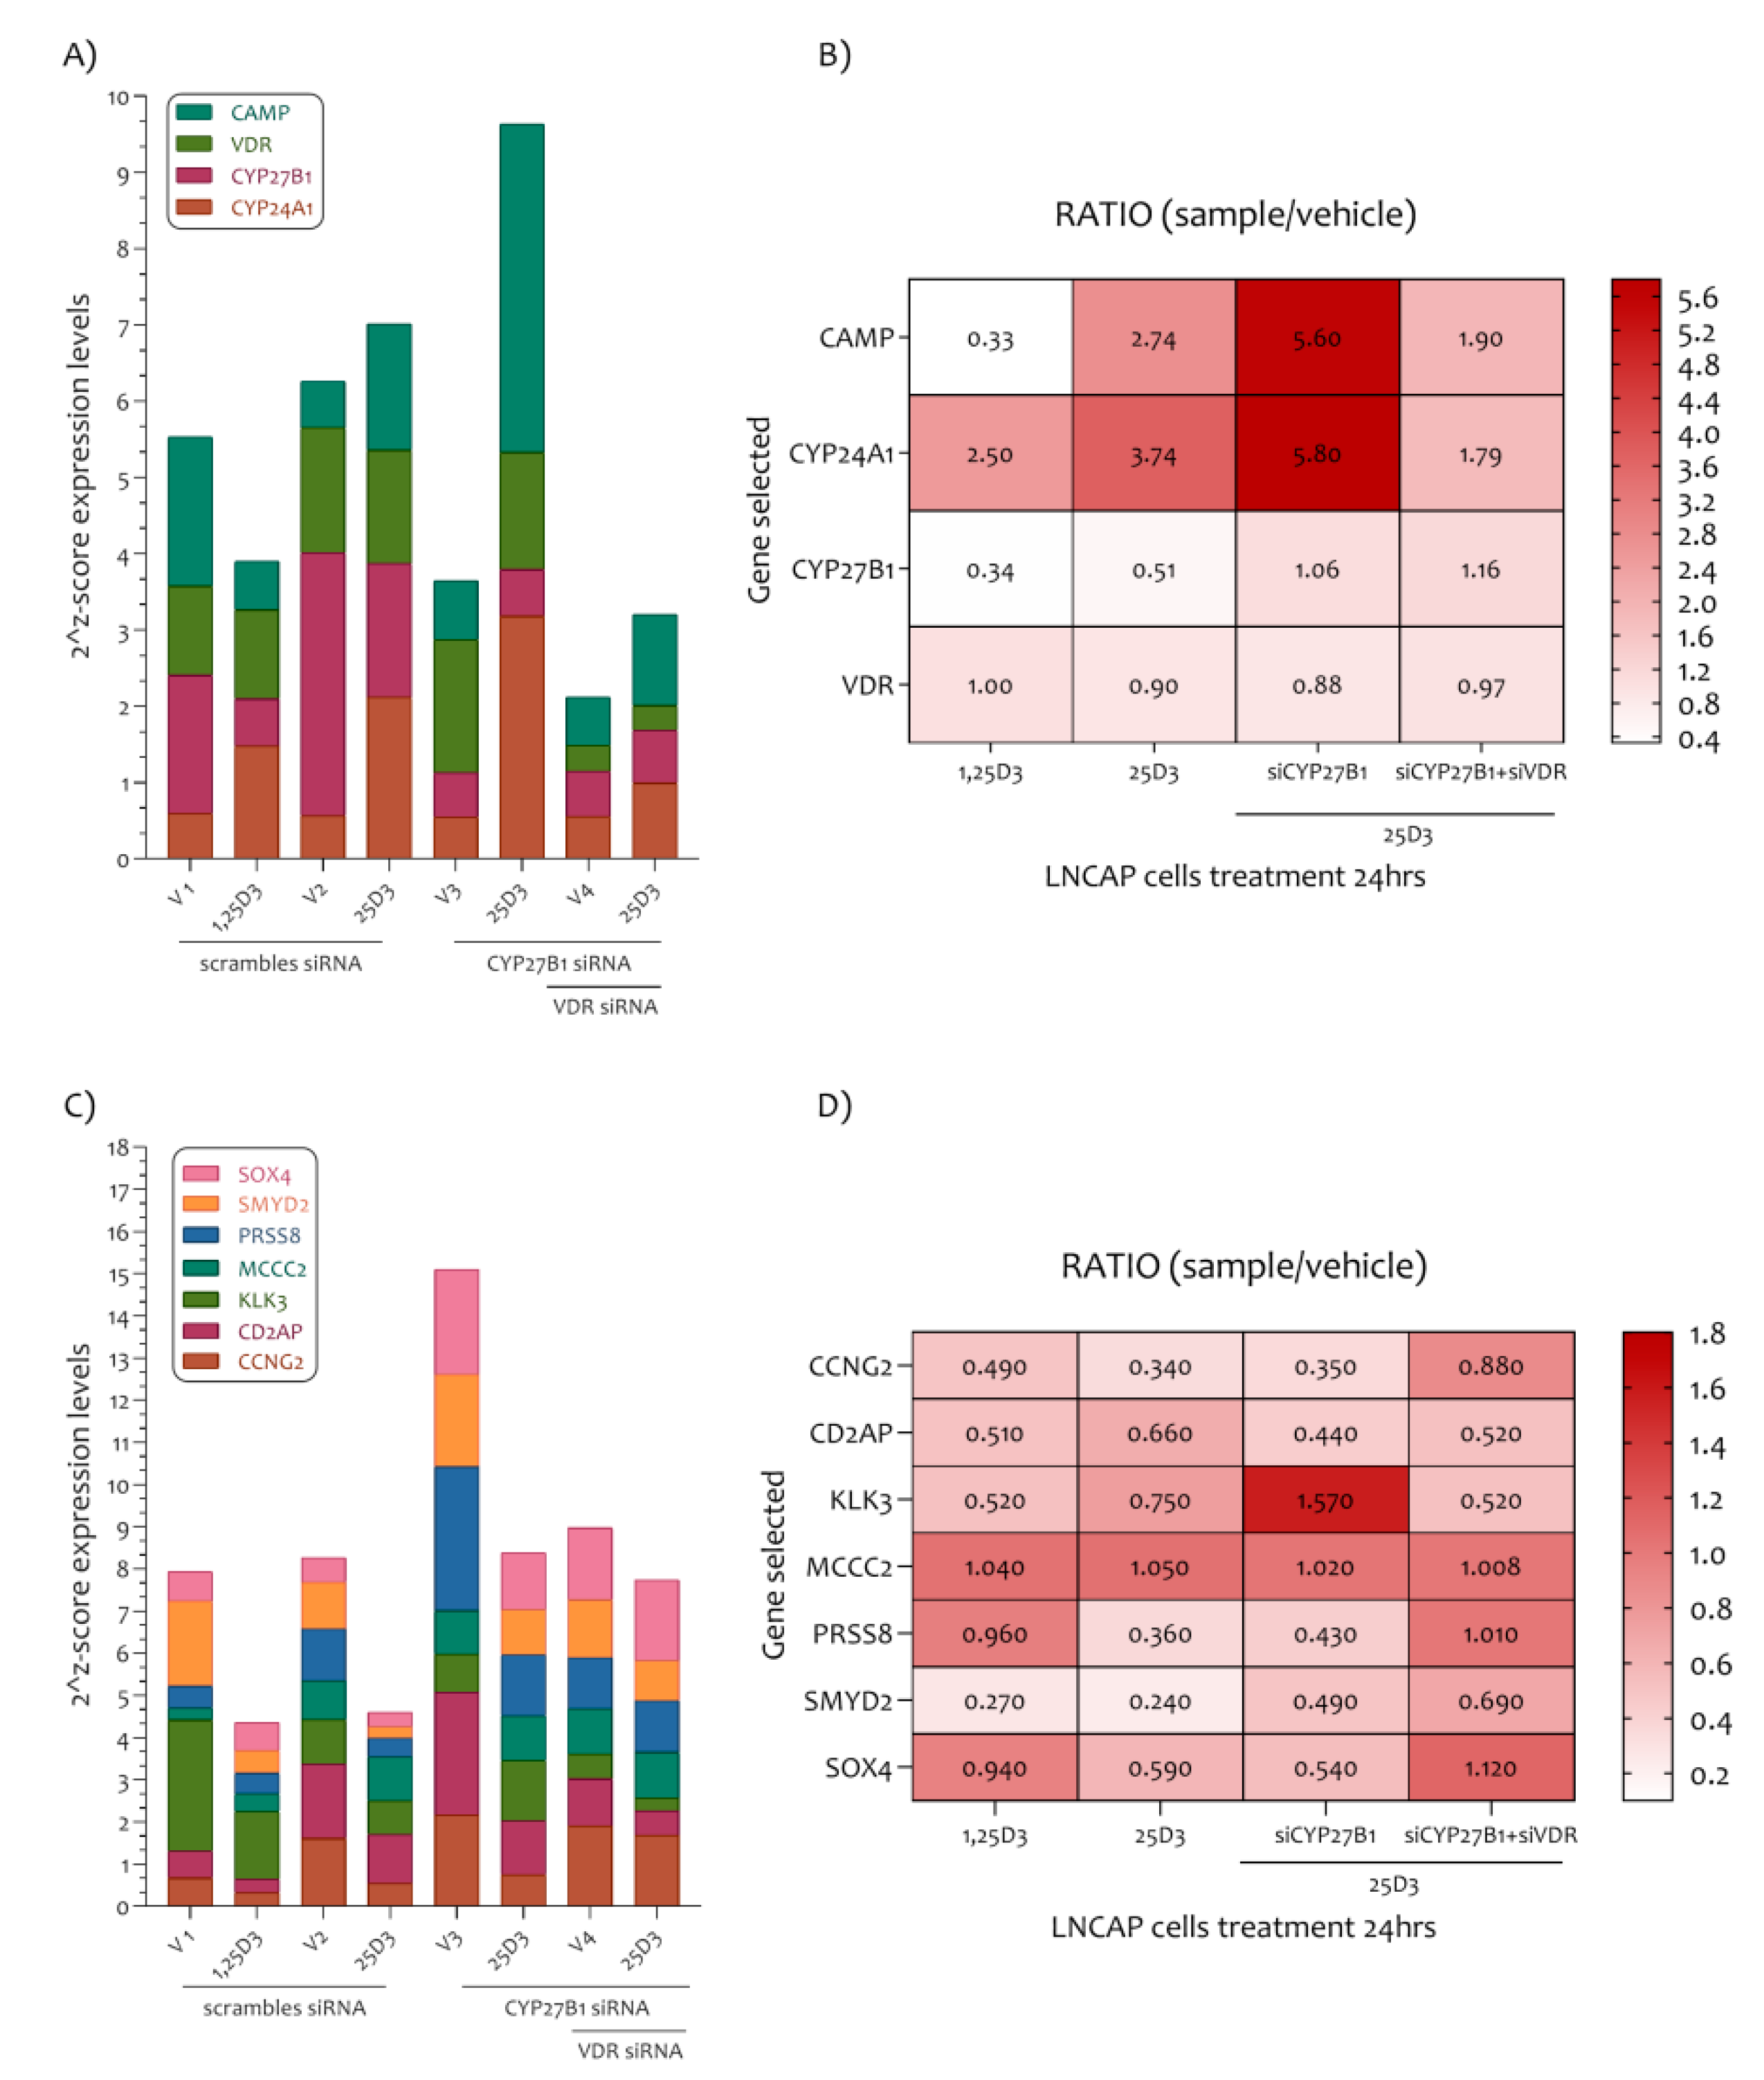
3.2. PCa Related Genes Were Modulated by Vitamin D in LNCaP Cell Line

In the LNCaP cell line, the 1,25D3 played significant modulatory effect on the expression levels of PRSS8 (p = 0.0006), SOX4 (p = 0.0004), SMYD2 (p = 0.0049), MCCC2 (p = 0.0002), CCNG2 (p = 0.0074) and CD2AP (p = 0.0048). Indeed, all genes were significantly down-regulated by the 1,25D3 (100 nM for 24 h) (Figure 5A).
Noteworthy, we investigated the expression levels of Vitamin D target genes such as CYP27B1, CYP24A1, VDR and CAMP, and we showed that CYP24A1 (p < 0.0001) and CAMP (p = 0.0015) were significantly up-regulated in LNCaP cells treated with 1,25D3 for 24 h (no significantly modulation was observed for CYP27B1, p = 0.8430) (Figure 5B). Conversely, the VDR gene expression levels were significantly downregulated by 1,25D3 treatment (p = 0.0012) (Figure 5B).

3.3. The Vitamin D Regulatory Mechanism on the Six PCa Genes Selected

In order to explain how Vitamin D plays a role in the modulation of the marker genes highlighted in our study, we analyzed a new dataset (GSE107438) composed of LNCaP cells transfected with control siRNA (siCT), siRNA for CYP27B1 (siCYP27B1) or siRNA for VDR (siVDR), followed by 100 nM of 25D3 or 1,25D3 treatment for a further 24 h. The analysis of genes belonging to the Vitamin D pathway such as CAMP, VDR, CYP27B1 and CYP24A1 demonstrated that in this LNCaP cell line, the 1,25D3 reduced the expression levels of CYP27B1 and CAMP, and on the contrary, increased the expression levels of CYP24A1. No variation was observed for VDR expression levels (Figure 6A,B).
These results showed accordance with the analysis previously effectuated (Figure 5, GSE64657). In addition, the 25D3 LNCaP cell treatment strongly increases CAMP and CYP24A1 expression levels. The siCYP27B1 and siVDR LNCaP cells treatment have demonstrated that CYP24A1 and CAMP are regulated principally by 25D3 in LNCaP cells via CYP27B1 and VDR. As regards the PCa genes highlighted in our analysis, we have demonstrated that all genes were sensitive to the effect of 1,25D3 and 25D3 at the dose of 100 nM for 24 h (were an exception the expression levels of MCC2) (Figure 6C,D). Furthermore, the siCYP27B1 and siVDR LNCaP cells treatment showed that the downregulation of KLK3 depends strictly on the CYP27B1 gene transcription. More mildly, the PRSS8 and SMYD2 genes expression also depends on the transcription of the CYP27B1 gene. Co-silencing of the CYP27B1 and VDR genes was determinant in the transcription of the CCNG2, PRSS8, SMYD2 and SOX4 genes (Figure 6C,D).
We showed that all selected genes were modulated by 1,25D3 and its precursor 25D3. In addition, 25D3 downregulates KLK3 and SMYD3 genes expression with CYP27B1 activity. Furthermore, 25D3 modulates the expression levels of CCNG2, CD2AP, PRSS8, SMYD2 and SOX4 via VDR transcription (Figure 6).

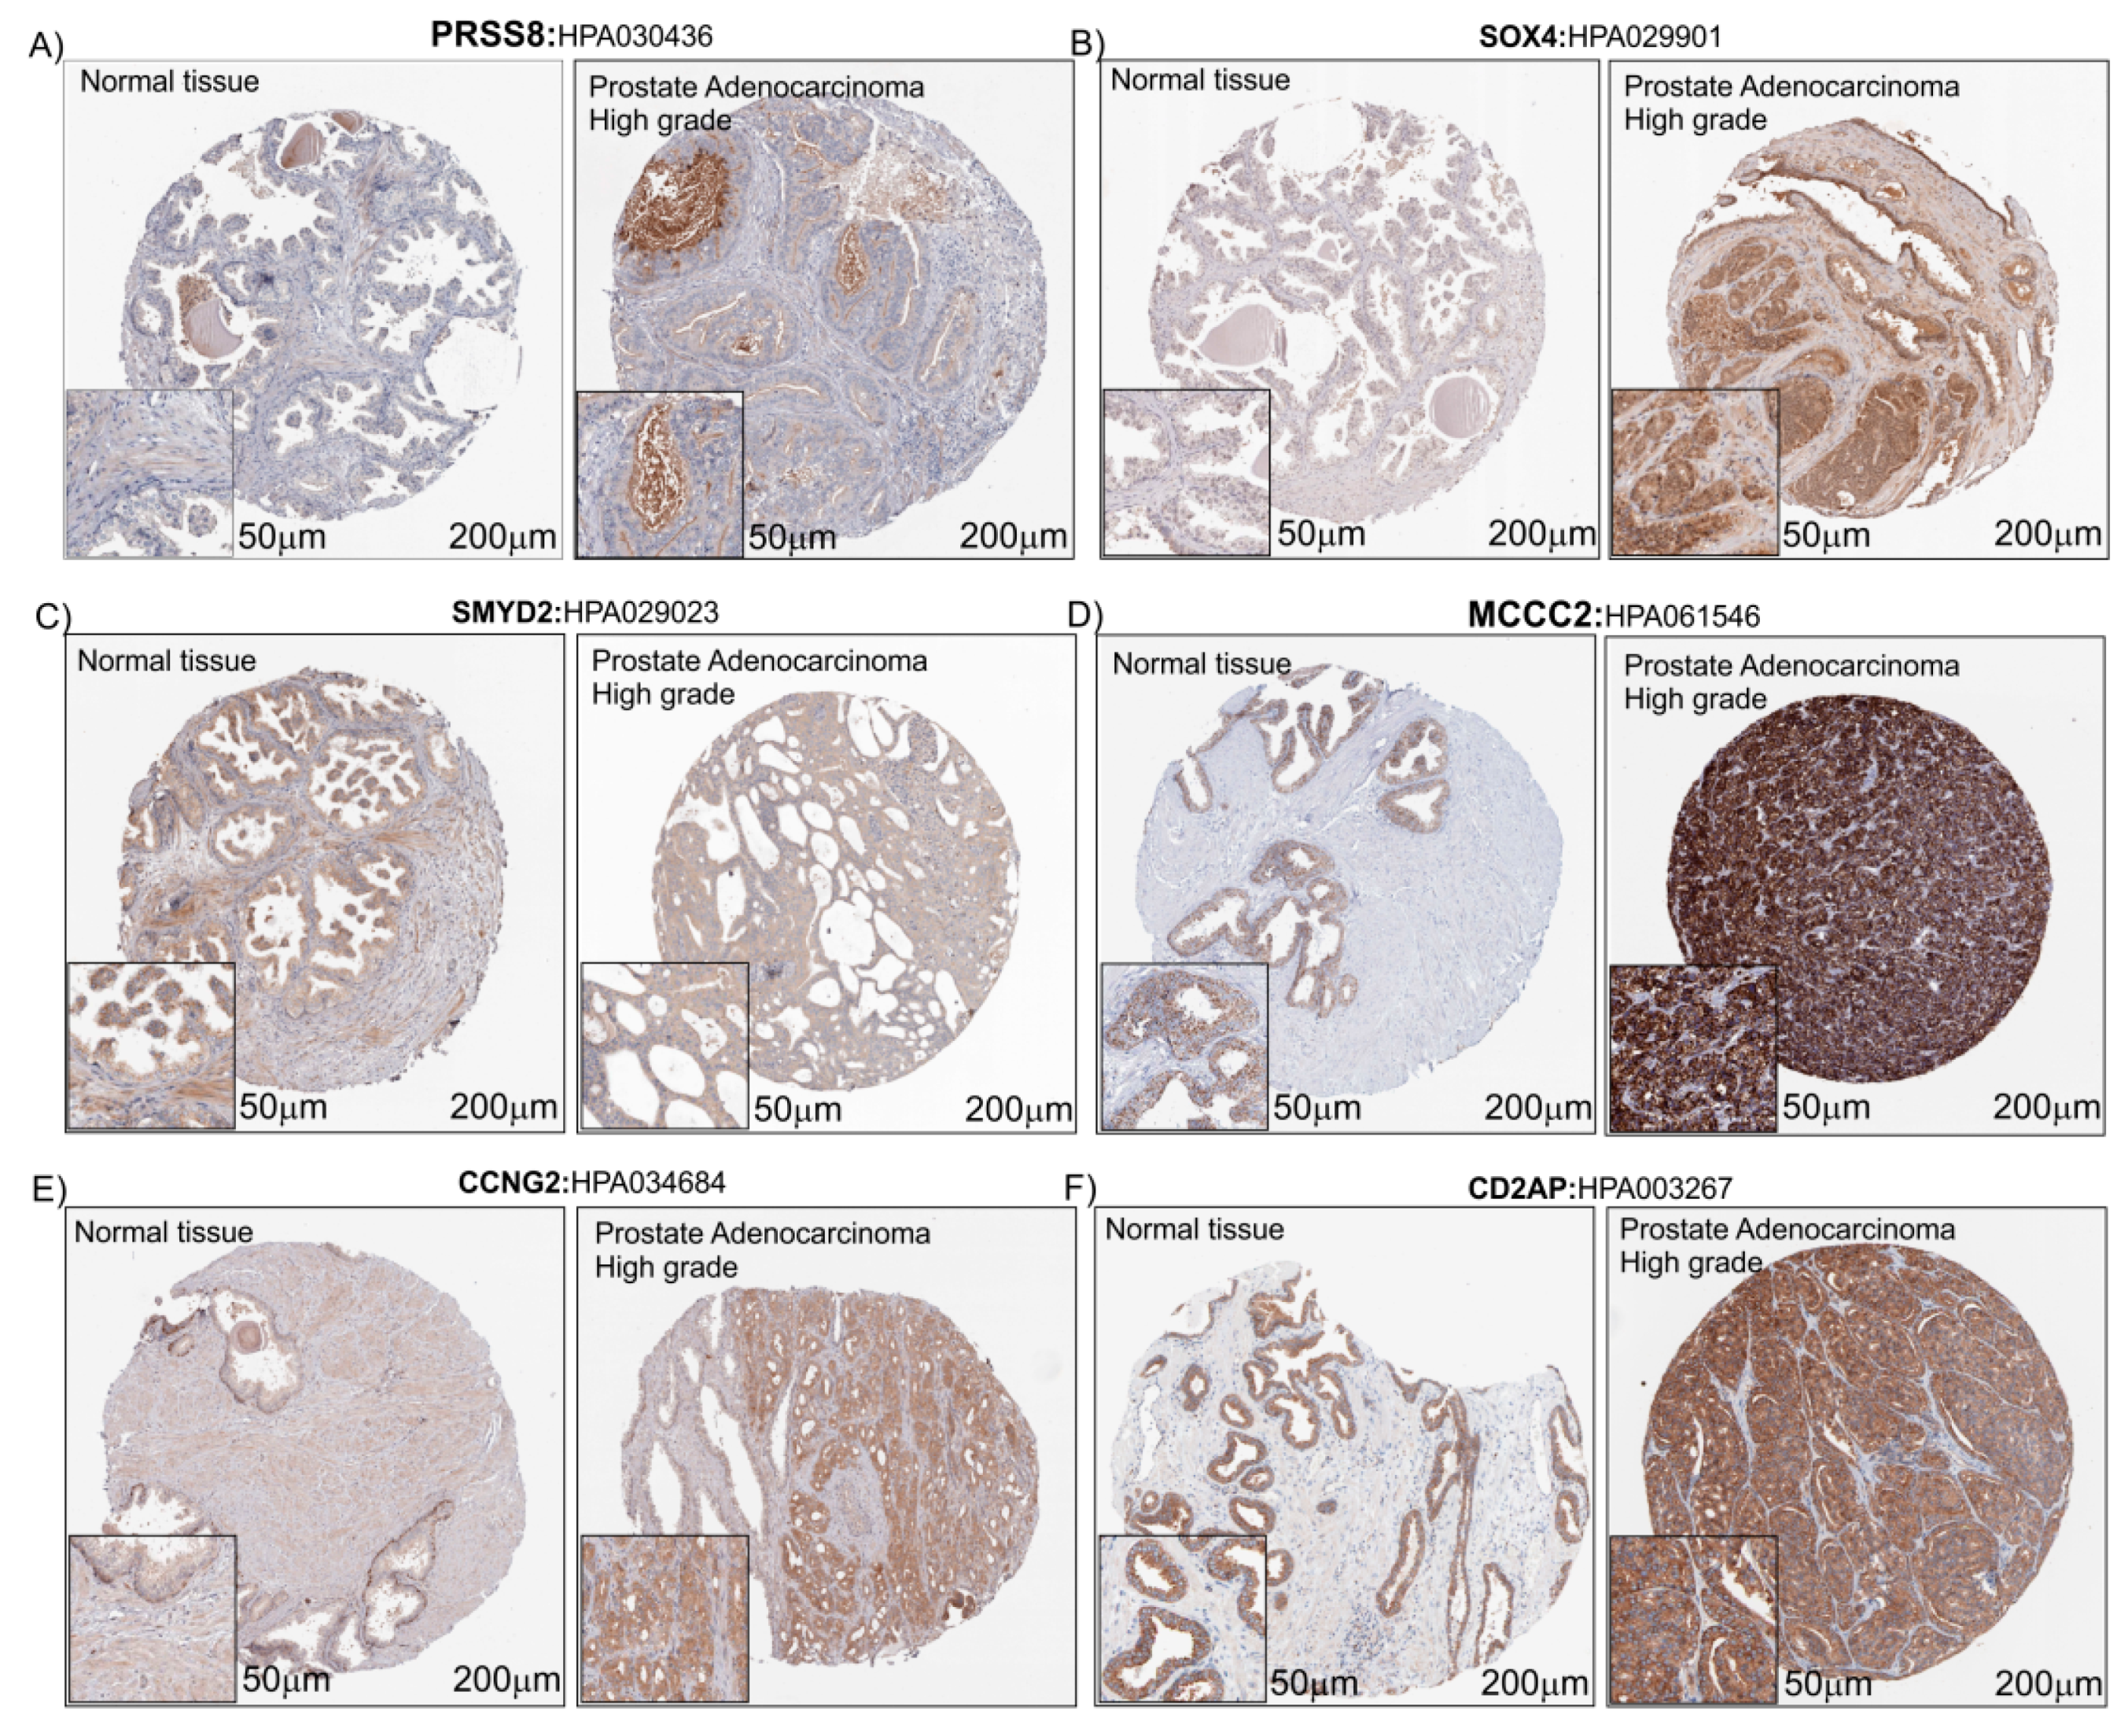
3.4. Immunohistochemistry Analysis of the Six PCa Genes Selected

In order to evaluate the protein expression levels of PRSS8, SOX4, SMYD2, MCCC2, CCNG2 and CD2AP in heathy subjects and PCa patients, we explored the Human Atlas project portal. Aware that the number of biopsies available on The Human Protein Atlas database was small (Table 1), taking into consideration the limits related to this, but in order to verify our hypothesis, we decided to proceed by analyzing the histological biopsies of healthy and pathological tissue with protein staining of the six genes that were the object of our study. For all protein detected, we found a potentially increased staining in prostate adenocarcinoma with High grade compared to healthy prostate tissue biopsies, except for SMYD2 which did not present changes in intensity between the healthy and pathological prostate tissue (Figure 7).
Particularly, MCCC2, CD2AP and SOX4 presented an higher intensity staining in adenocarcinoma with High grade compared to healthy prostate tissue biopsies (Figure 7B,D,F) (Table 1).
The immunostaining details are reported in Table 1 and in Table S1. However, as regards CD2AP and MCCC2, the protein expression levels seemed quite high in normal epithelium; the higher staining observed in cancer is probably due to the higher number of epithelial cells in cancer tissue.

4. Discussion

In this paper, we undertook an analysis to identify the key genes involved in PCa. We analyzed three PCa microarray datasets (GSE70770, GSE62872 and GSE6919), merged all the genes significantly up-regulated and subsequently, intersected the common genes identified (n = 276) with the transcriptome of genes down-regulated in the LNCaP cell line treated with Vitamin D, in order to identify the common key genes involved in PCa and potentially modulated by the action of Vitamin D. The analysis yielded 43 genes involved in PCa significantly modulated by Vitamin D. These genes were involved in different molecular processes, among which the most interesting were organogenesis, morphogenesis and cell migration, all mechanisms involved in the genesis and in the tumor progression. Noteworthy, our analysis showed that six genes (PRSS8, SOX4, SMYD2, MCCC2, CCNG2 and CD2AP) were significantly modulated in both PCa biopsies and in the LNCaP cell line treated with Vitamin D. A literature investigation showed that all these genes were involved in different tumor progressions. Furthermore, a Z-score transformation of all datasets allowed us to group all the healthy prostate samples (n = 251) and PCa (n = 548), thus significantly increasing the court of subjects included in the study. A Spearman’s ρ correlation analysis showed that five genes out of six (PRSS8, SMYD2, MCCC2, CCNG2 and CD2AP), were positively and statistically correlated with the gene expression levels of KLK3 and with the tumor %. Contrary note, SOX4 expression levels were positively correlated only with the tumor %, but not with KLK3 gene expression levels. Furthermore, the analysis of the data deriving from GSE107438, the treatment of LNCaP cell line with siCYP27B1 and siVDR, showed that a downregulation of KLK3 expression levels depends strictly on the CYP27B1 gene transcription. More mildly, the PRSS8 and SMYD2 genes expression also depends on the transcription of the CYP27B1 gene. Co-silencing of the CYP27B1 and VDR genes was determinant in the transcription of the CCNG2, PRSS8, SMYD2 and SOX4 genes. Our results have been in part confirmed by the immunostaining obtained by the Human Atlas Project portal. The immunohistochemistry analysis showed that five genes (PRSS8, SOX4, MCCC2, CCNG2 and CD2AP) out of six appeared more expressed in PCa biopsies compared to healthy prostate tissue. No difference was observed for SYMD2.
Prostasin (PRSS8) is a serine protease, mainly expressed in normal prostate epithelia, the prostate gland and in seminal fluid [37]. This protein is implicated in epithelial sodium channel regulation and essential for terminal epithelial differentiation [38]. Nowadays, the role played by this molecule in cancer is unclear. It was shown that it may be related to tumor promoter mechanisms [39] as well as tumor suppression [40,41,42]. In several studies it has been shown that PRSS8 plays a role as a tumor suppressor in various malignancies, such as in hepatocellular carcinoma [43]. In 2016 Tamir et al. showed that abundant amounts of secreted prostasin found in the sera of early stage ovarian cancer (OVC) can potentially be used as a minimally invasive screening biomarker for early stage OVC [44]. As regarding the role of PRSS8 and PCa, there is no large bibliography. Noteworthy, in 2003, Takahashi and colleagues demonstrated that in 54 patients (Japanese), the PRSS8 mRNA expression levels, measured by northern blot analysis, were not correlated with the clinical stage of human PCa. Furthermore, almost in all cases of metastatic and hormone-refractory cancers, these demonstrated a down-regulation of prostasin expression. The authors at the end of their manuscript suggested that prostasin cannot be regarded as a prognostic indicator for human PCa, although it may be a useful marker for tumor differentiation [45]. In light of this, our results are totally contrasting with the results obtained by Takahashi in 2003. It must be kept in mind that the samples analyzed in this study come from different ethnic groups, and there was also a difference in the number of the subjects recruited (54 with respect the 548 present in our analysis) and the control samples, healthy, were subjects with benign prostatic hyperplasia (BPH). This difference could be the basis for the different results obtained in the study.
In any case, the increase in mRNA levels in prostate tumor biopsies, their positive correlation with the tumor percentage and the messenger of KLK3 and their modulation by Vitamin D, need further confirmation from an in vitro experimental point of view.
As regard SOX4, in our analysis we showed that the expression levels were increased in PCa patients’ biopsies compared to the healthy prostate subjects. These results are totally in agreement with the recent bibliography [46,47]. SOX4 is a transcription factor involved in the regulation of embryonic development. SOX4 is highly expressed in several human cancers of epithelial origin and is associated with a poor clinical outcome. It has been related with the loss of epithelial features and the gain of mesenchymal traits, including cell migration and invasion [48]. SOX4 knockdown repressed the cell proliferation and migration ability. Moreover, inhibition of SOX4 could reverse the epithelial-mesenchymal transition processes through up-regulation of adhesion molecules such as E-cadherin and the down-regulation of vimentin [47]. In our analysis we showed that Vitamin D was able to reduce significantly the expression of SOX4 in the LNCaP cell line. Noteworthy, it has been shown that the Vitamin D is able to induce E-cadherin expression in breast cancer cells by promoter demethylation [49]. Taking all of this into consideration, the Vitamin D could be able to reduce the tumor cell migration and invasion, via SOX4 down-regulation and consequently up-regulation of E-Cadherin.
SMYD2 (SET and MYND domain-containing protein 2) is a histone lysine methyltransferase enzyme, belonging to the family that contains five enzymes that share two highly conserved domains (the catalytic SET domain and the MYND domain) [50]. This enzyme is highly expressed in a variety of cancers [51,52]. Recently, it has been shown that SMYD2 inhibits tumor suppressor proteins p53 [53] and PTEN [54]. However, to date, there has been no report on the clinical and prognostic significance of SMYD2 in patients with PCa. In our analysis, we showed that mRNA of SYMD2 is over-expressed in PCa and the treatment of the LNCaP cell line with Vitamin D reduces the expression levels, but this result was not confirmed by the PCa biopsies observation. Consequently, the Vitamin D could increase PTEN expression via a down-regulation of SYMD2, and inhibit cell proliferation in PCa. In support of this hypothesis, it has been shown that the Vitamin D plays an inhibitory effect on the hepatocellular carcinoma cells proliferation through the down-regulation of HDAC2 and up-regulation of PTEN [55].
The expression analysis of MCCC2 in PCa biopsies, showed an over-expression on mRNA and a positive correlation with KLK3 gene expression levels and tumor %. This enzyme catalyzes the carboxylation of 3-methylcrotonyl-CoA to form 3-methylglutaconyl-CoA. There is evidence that mutations of this gene is associated with 3-Methylcrotonylglycinuria, an autosomal recessive disorder of leucine catabolism [56]. As regards its role in cancer, there exist only two reports that bind it to tumor development. These two reports identified MCCC2 over-expression linked to LNM PCa tissues [57] and to low-grade PCa [58]. Our results could be a good start to investigate the role of MCCC2 in cancer.
In our analysis, another interesting molecule identified as potentially a marker of PCa was CCNG2. This molecule belongs to the cyclin family, and its expression is significantly higher in cell cycle-arrest [59]. The current literature suggests that CCNG2 plays an important inhibitory role in cancer initiation and progression [60]. It has been shown that CCNG2 dysregulation is related to cancer progression and could play an important role in cell transformation and the early stages of cancer development [60,61]. Seemingly, our findings would seem to contrast with the role played by CCNG2 in cancer. Recently, Canovas et al. demonstrated that primary prostate tumors show a significantly higher expression of PTOV1, CCNG2 and MYC compared to benign tissue [62]. Furthermore, in this set of tumors, the expression of CCNG2 significantly correlates with prostate tumor aggressiveness. The authors concluded their study, hypothesizing that CCNG2 is as potential markers of metastasis and bad prognosis when detected in primary prostate tumors. These results are in good agreement with our finding. Moreover, it has been shown that the Vitamin D plays an anti-proliferative effect in the LNCaP cell line reducing the cyclin-dependent kinase 2 activity [63].
The CD2AP is a protein closely associated with the cytoskeleton structure. This protein interacts with the filamentous actin and a variety of cell membrane proteins. Its expression is involved in kidney diseases, including nephrin and polycystin-2 [64]. Although several studies have indicated that CD2AP regulates cell shape and movements, little attention has been paid to the cancer [65]. To date, there has been no report on CD2AP expression levels in PCa. To our knowledge, this is the first study which suggests the role of CD2AP in PCa.

5. Conclusions

Investigating the target genes, significantly up-regulated in the present analysis and down-regulated by the Vitamin D action, may help to discover the molecular mechanisms involved in PCa progression. The large cohort of our analysis allowed us to improve the diagnostic meaning of our results. Further IHC analysis on a much broader court than the one analyzed in our study could further confirm our results. From the outcome of our investigation, it is possible to conclude that the mechanism involved during the PCa progression could be modulated by Vitamin D. Further research on the role played by the Vitamin D on PCa key genes is necessary to extend our results and to try an answer to the several questions which still remain to be addressed.

Supplementary Materials

The following are available online at https://www.mdpi.com/2076-3417/9/22/4923/s1. Figure S1: The six key genes expression levels in GSE70770, GSE62872 and GSE6919. Table S1: Contains the complete analyzes used for the realization of this manuscript. Table S2: The GeneMania-report of the 43 key genes selected.

Author Contributions

M.D.R.; Data curation, S.R. and M.D.R.; Formal analysis, V.F. and M.D.R.; Funding acquisition, R.C.; Investigation, R.C.; L.S. and R.I.; Methodology, I.B.; Project administration, R.C.; Resources, S.R.; Software, M.D.R.; Supervision, M.D.R.; Validation, P.C.; Visualization, M.A.S. and G.M.; Writing—original draft, M.D.R.; Writing—review & editing, I.B. and G.M.

Funding

This research gained the support of the University Research Project Grant (Triennial Research Plan 2016–2018), Department of Biomedical and Biotechnological Sciences (BIOMETEC), University of Catania, Italy.

Acknowledgments

We would like to show our gratitude to the authors of microarray datasets made available online, for consultation and re-analysis.

Conflicts of Interest

The authors declare no conflict of interest.

References

  1. Trump, D.L.; Aragon-Ching, J.B. Vitamin D in prostate cancer. Asian J. Androl. 2018, 20, 244–252. [Google Scholar] [CrossRef] [PubMed]
  2. Bikle, D.D. Vitamin D metabolism, mechanism of action, and clinical applications. Chem. Biol. 2014, 21, 319–329. [Google Scholar] [CrossRef] [PubMed]
  3. Pinzone, M.R.; Di Rosa, M.; Celesia, B.M.; Condorelli, F.; Malaguarnera, M.; Madeddu, G.; Martellotta, F.; Castronuovo, D.; Gussio, M.; Coco, C.; et al. LPS and HIV gp120 modulate monocyte/macrophage CYP27B1 and CYP24A1 expression leading to vitamin D consumption and hypovitaminosis D in HIV-infected individuals. Eur. Rev. Med Pharmacol. Sci. 2013, 17, 1938–1950. [Google Scholar] [PubMed]
  4. Di Rosa, M.; Malaguarnera, L.; Nicolosi, A.; Sanfilippo, C.; Mazzarino, C.; Pavone, P.; Berretta, M.; Cosentino, S.; Cacopardo, B.; Pinzone, M.R.; et al. Vitamin D3: An ever green molecule. Front. Biosci. 2013, 5, 247–260. [Google Scholar] [CrossRef] [PubMed]
  5. Malaguarnera, L.; Marsullo, A.; Zorena, K.; Musumeci, G.; Di Rosa, M. Vitamin D3 regulates LAMP3 expression in monocyte derived dendritic cells. Cell. Immunol. 2017, 311, 13–21. [Google Scholar] [CrossRef] [PubMed]
  6. Nunnari, G.; Fagone, P.; Lazzara, F.; Longo, A.; Cambria, D.; Di Stefano, G.; Palumbo, M.; Malaguarnera, L.; Di Rosa, M. Vitamin D3 inhibits TNFalpha-induced latent HIV reactivation in J-LAT cells. Mol. Cell. Biochem. 2016, 418, 49–57. [Google Scholar] [CrossRef] [PubMed]
  7. Jimenez-Sousa, M.A.; Martinez, I.; Medrano, L.M.; Fernandez-Rodriguez, A.; Resino, S. Vitamin D in Human Immunodeficiency Virus Infection: Influence on Immunity and Disease. Front. Immunol. 2018, 9, 458. [Google Scholar] [CrossRef]
  8. Pinzone, M.R.; Di Rosa, M.; Malaguarnera, M.; Madeddu, G.; Foca, E.; Ceccarelli, G.; d’Ettorre, G.; Vullo, V.; Fisichella, R.; Cacopardo, B.; et al. Vitamin D deficiency in HIV infection: An underestimated and undertreated epidemic. Eur. Rev. Med. Pharmacol. Sci. 2013, 17, 1218–1232. [Google Scholar]
  9. Di Rosa, M.; Malaguarnera, M.; Zanghi, A.; Passaniti, A.; Malaguarnera, L. Vitamin D3 insufficiency and colorectal cancer. Crit. Rev. Oncol. Hematol. 2013, 88, 594–612. [Google Scholar] [CrossRef]
  10. Gilbert, R.; Martin, R.M.; Beynon, R.; Harris, R.; Savovic, J.; Zuccolo, L.; Bekkering, G.E.; Fraser, W.D.; Sterne, J.A.; Metcalfe, C. Associations of circulating and dietary vitamin D with prostate cancer risk: A systematic review and dose-response meta-analysis. Cancer Causes Control CCC 2011, 22, 319–340. [Google Scholar] [CrossRef]
  11. Kristal, A.R.; Till, C.; Song, X.; Tangen, C.M.; Goodman, P.J.; Neuhauser, M.L.; Schenk, J.M.; Thompson, I.M.; Meyskens, F.L., Jr.; Goodman, G.E.; et al. Plasma vitamin D and prostate cancer risk: Results from the Selenium and Vitamin E Cancer Prevention Trial. Cancer Epidemiol. Biomark. Prev. A Publ. Am. Assoc. Cancer Res. Cosponsored By Am. Soc. Prev. Oncol. 2014, 23, 1494–1504. [Google Scholar] [CrossRef]
  12. Patel, A.R.; Klein, E.A. Risk factors for prostate cancer. Nat. Clin. Pract. Urol. 2009, 6, 87–95. [Google Scholar] [CrossRef] [PubMed]
  13. Siegel, R.L.; Miller, K.D.; Jemal, A. Cancer statistics, 2018. CA A Cancer J. Clin. 2018, 68, 7–30. [Google Scholar] [CrossRef] [PubMed]
  14. Odedina, F.T.; Akinremi, T.O.; Chinegwundoh, F.; Roberts, R.; Yu, D.; Reams, R.R.; Freedman, M.L.; Rivers, B.; Green, B.L.; Kumar, N. Prostate cancer disparities in Black men of African descent: A comparative literature review of prostate cancer burden among Black men in the United States, Caribbean, United Kingdom, and West Africa. Infect. Agents Cancer 2009, 4 (Suppl. 1), S2. [Google Scholar] [CrossRef] [PubMed]
  15. Trump, D.L.; Deeb, K.K.; Johnson, C.S. Vitamin D: Considerations in the continued development as an agent for cancer prevention and therapy. Cancer J. 2010, 16, 1–9. [Google Scholar] [CrossRef]
  16. Munetsuna, E.; Kawanami, R.; Nishikawa, M.; Ikeda, S.; Nakabayashi, S.; Yasuda, K.; Ohta, M.; Kamakura, M.; Ikushiro, S.; Sakaki, T. Anti-proliferative activity of 25-hydroxyvitamin D3 in human prostate cells. Mol. Cell. Endocrinol. 2014, 382, 960–970. [Google Scholar] [CrossRef] [PubMed]
  17. Song, Z.Y.; Yao, Q.; Zhuo, Z.; Ma, Z.; Chen, G. Circulating vitamin D level and mortality in prostate cancer patients: A dose-response meta-analysis. Endocr. Connect. 2018, 7, R294–R303. [Google Scholar] [CrossRef]
  18. Fleet, J.C.; Kovalenko, P.L.; Li, Y.; Smolinski, J.; Spees, C.; Yu, J.G.; Thomas-Ahner, J.M.; Cui, M.; Neme, A.; Carlberg, C.; et al. Vitamin D Signaling Suppresses Early Prostate Carcinogenesis in TgAPT121 Mice. Cancer Prev. Res. 2019, 12, 343–356. [Google Scholar] [CrossRef]
  19. Singh, P.K.; Doig, C.L.; Dhiman, V.K.; Turner, B.M.; Smiraglia, D.J.; Campbell, M.J. Epigenetic distortion to VDR transcriptional regulation in prostate cancer cells. J. Steroid Biochem. Mol. Biol. 2013, 136, 258–263. [Google Scholar] [CrossRef]
  20. Farhan, H.; Wahala, K.; Cross, H.S. Genistein inhibits vitamin D hydroxylases CYP24 and CYP27B1 expression in prostate cells. J. Steroid Biochem. Mol. Biol. 2003, 84, 423–429. [Google Scholar] [CrossRef]
  21. Ross-Adams, H.; Lamb, A.D.; Dunning, M.J.; Halim, S.; Lindberg, J.; Massie, C.M.; Egevad, L.A.; Russell, R.; Ramos-Montoya, A.; Vowler, S.L.; et al. Corrigendum to “Integration of Copy Number and Transcriptomics Provides Risk Stratification in Prostate Cancer: A Discovery and Validation Cohort Study” [EBioMedicine 2 (9) (2015) 1133–1144]. EBioMedicine 2017, 17, 238. [Google Scholar] [CrossRef]
  22. Whitington, T.; Gao, P.; Song, W.; Ross-Adams, H.; Lamb, A.D.; Yang, Y.; Svezia, I.; Klevebring, D.; Mills, I.G.; Karlsson, R.; et al. Gene regulatory mechanisms underpinning prostate cancer susceptibility. Nat. Genet. 2016, 48, 387–397. [Google Scholar] [CrossRef] [PubMed]
  23. Penney, K.L.; Sinnott, J.A.; Tyekucheva, S.; Gerke, T.; Shui, I.M.; Kraft, P.; Sesso, H.D.; Freedman, M.L.; Loda, M.; Mucci, L.A.; et al. Association of prostate cancer risk variants with gene expression in normal and tumor tissue. Cancer Epidemiol. Biomark. Prev. A Publ. Am. Assoc. Cancer Res. Cosponsored By Am. Soc. Prev. Oncol. 2015, 24, 255–260. [Google Scholar] [CrossRef] [PubMed]
  24. Chandran, U.R.; Ma, C.; Dhir, R.; Bisceglia, M.; Lyons-Weiler, M.; Liang, W.; Michalopoulos, G.; Becich, M.; Monzon, F.A. Gene expression profiles of prostate cancer reveal involvement of multiple molecular pathways in the metastatic process. BMC Cancer 2007, 7, 64. [Google Scholar] [CrossRef] [PubMed]
  25. Yu, Y.P.; Landsittel, D.; Jing, L.; Nelson, J.; Ren, B.; Liu, L.; McDonald, C.; Thomas, R.; Dhir, R.; Finkelstein, S.; et al. Gene expression alterations in prostate cancer predicting tumor aggression and preceding development of malignancy. J. Clin. Oncol. Off. J. Am. Soc. Clin. Oncol. 2004, 22, 2790–2799. [Google Scholar] [CrossRef]
  26. Susa, T.; Iizuka, M.; Okinaga, H.; Tamamori-Adachi, M.; Okazaki, T. Without 1alpha-hydroxylation, the gene expression profile of 25(OH)D3 treatment overlaps deeply with that of 1,25(OH)2D3 in prostate cancer cells. Sci. Rep. 2018, 8, 9024. [Google Scholar] [CrossRef]
  27. Xiao, J.; Cao, H.; Chen, J. False discovery rate control incorporating phylogenetic tree increases detection power in microbiome-wide multiple testing. Bioinformatics 2017, 33, 2873–2881. [Google Scholar] [CrossRef]
  28. Smyth, G.K. Linear models and empirical bayes methods for assessing differential expression in microarray experiments. Stat. Appl. Genet. Mol. Biol. 2004, 3, 3. [Google Scholar] [CrossRef]
  29. Davis, S.; Meltzer, P.S. GEOquery: A bridge between the Gene Expression Omnibus (GEO) and BioConductor. Bioinformatics 2007, 23, 1846–1847. [Google Scholar] [CrossRef]
  30. Zuberi, K.; Franz, M.; Rodriguez, H.; Montojo, J.; Lopes, C.T.; Bader, G.D.; Morris, Q. GeneMANIA prediction server 2013 update. Nucleic Acids Res. 2013, 41, W115–W122. [Google Scholar] [CrossRef]
  31. Chang, J.T.; Nevins, J.R. GATHER: A systems approach to interpreting genomic signatures. Bioinformatics 2006, 22, 2926–2933. [Google Scholar] [CrossRef]
  32. Uhlen, M.; Fagerberg, L.; Hallstrom, B.M.; Lindskog, C.; Oksvold, P.; Mardinoglu, A.; Sivertsson, A.; Kampf, C.; Sjostedt, E.; Asplund, A.; et al. Proteomics. Tissue-based map of the human proteome. Science 2015, 347, 1260419. [Google Scholar] [CrossRef] [PubMed]
  33. Thul, P.J.; Akesson, L.; Wiking, M.; Mahdessian, D.; Geladaki, A.; Ait Blal, H.; Alm, T.; Asplund, A.; Bjork, L.; Breckels, L.M.; et al. A subcellular map of the human proteome. Science 2017, 356. [Google Scholar] [CrossRef] [PubMed]
  34. Uhlen, M.; Zhang, C.; Lee, S.; Sjostedt, E.; Fagerberg, L.; Bidkhori, G.; Benfeitas, R.; Arif, M.; Liu, Z.; Edfors, F.; et al. A pathology atlas of the human cancer transcriptome. Science 2017, 357. [Google Scholar] [CrossRef] [PubMed] [Green Version]
  35. Cheadle, C.; Vawter, M.P.; Freed, W.J.; Becker, K.G. Analysis of microarray data using Z score transformation. J. Mol. Diagn. JMD 2003, 5, 73–81. [Google Scholar] [CrossRef] [Green Version]
  36. Jyoti, S.K.; Blacke, C.; Patil, P.; Amblihalli, V.P.; Nicholson, A. Prostate cancer screening by prostate-specific antigen (PSA); a relevant approach for the small population of the Cayman Islands. Cancer Causes Control CCC 2018, 29, 87–92. [Google Scholar] [CrossRef] [PubMed]
  37. Yu, J.X.; Chao, L.; Chao, J. Prostasin is a novel human serine proteinase from seminal fluid. Purification, tissue distribution, and localization in prostate gland. J. Biol. Chem. 1994, 269, 18843–18848. [Google Scholar] [PubMed]
  38. Vallet, V.; Chraibi, A.; Gaeggeler, H.P.; Horisberger, J.D.; Rossier, B.C. An epithelial serine protease activates the amiloride-sensitive sodium channel. Nature 1997, 389, 607–610. [Google Scholar] [CrossRef]
  39. Yu, J.X.; Chao, L.; Ward, D.C.; Chao, J. Structure and chromosomal localization of the human prostasin (PRSS8) gene. Genomics 1996, 32, 334–340. [Google Scholar] [CrossRef]
  40. Chen, L.M.; Hodge, G.B.; Guarda, L.A.; Welch, J.L.; Greenberg, N.M.; Chai, K.X. Down-regulation of prostasin serine protease: A potential invasion suppressor in prostate cancer. Prostate 2001, 48, 93–103. [Google Scholar] [CrossRef]
  41. Narikiyo, T.; Kitamura, K.; Adachi, M.; Miyoshi, T.; Iwashita, K.; Shiraishi, N.; Nonoguchi, H.; Chen, L.M.; Chai, K.X.; Chao, J.; et al. Regulation of prostasin by aldosterone in the kidney. J. Clin. Investig. 2002, 109, 401–408. [Google Scholar] [CrossRef]
  42. Chen, L.M.; Chai, K.X. Prostasin serine protease inhibits breast cancer invasiveness and is transcriptionally regulated by promoter DNA methylation. Int. J. Cancer. J. Int. Du Cancer 2002, 97, 323–329. [Google Scholar] [CrossRef] [PubMed] [Green Version]
  43. Zhang, L.; Jia, G.; Shi, B.; Ge, G.; Duan, H.; Yang, Y. PRSS8 is Downregulated and Suppresses Tumour Growth and Metastases in Hepatocellular Carcinoma. Cell. Physiol. Biochem. Int. J. Exp. Cell. Physiol. Biochem. Pharmacol. 2016, 40, 757–769. [Google Scholar] [CrossRef] [PubMed]
  44. Tamir, A.; Gangadharan, A.; Balwani, S.; Tanaka, T.; Patel, U.; Hassan, A.; Benke, S.; Agas, A.; D’Agostino, J.; Shin, D.; et al. The serine protease prostasin (PRSS8) is a potential biomarker for early detection of ovarian cancer. J. Ovarian Res. 2016, 9, 20. [Google Scholar] [CrossRef] [PubMed] [Green Version]
  45. Takahashi, S.; Suzuki, S.; Inaguma, S.; Ikeda, Y.; Cho, Y.M.; Hayashi, N.; Inoue, T.; Sugimura, Y.; Nishiyama, N.; Fujita, T.; et al. Down-regulated expression of prostasin in high-grade or hormone-refractory human prostate cancers. Prostate 2003, 54, 187–193. [Google Scholar] [CrossRef]
  46. Liu, E.; Sun, X.; Li, J.; Zhang, C. miR30a5p inhibits the proliferation, migration and invasion of melanoma cells by targeting SOX4. Mol. Med. Rep. 2018, 18, 2492–2498. [Google Scholar] [CrossRef]
  47. Liu, Y.; Zeng, S.; Jiang, X.; Lai, D.; Su, Z. SOX4 induces tumor invasion by targeting EMT-related pathway in prostate cancer. Tumour Biol. J. Int. Soc. Oncodevelopmental Biol. Med. 2017, 39, 1010428317694539. [Google Scholar] [CrossRef] [Green Version]
  48. Lourenco, A.R.; Coffer, P.J. SOX4: Joining the Master Regulators of Epithelial-to-Mesenchymal Transition? Trends Cancer 2017, 3, 571–582. [Google Scholar] [CrossRef]
  49. Lopes, N.; Carvalho, J.; Duraes, C.; Sousa, B.; Gomes, M.; Costa, J.L.; Oliveira, C.; Paredes, J.; Schmitt, F. 1Alpha,25-dihydroxyvitamin D3 induces de novo E-cadherin expression in triple-negative breast cancer cells by CDH1-promoter demethylation. Anticancer Res. 2012, 32, 249–257. [Google Scholar]
  50. Spellmon, N.; Holcomb, J.; Trescott, L.; Sirinupong, N.; Yang, Z. Structure and function of SET and MYND domain-containing proteins. Int. J. Mol. Sci. 2015, 16, 1406–1428. [Google Scholar] [CrossRef] [Green Version]
  51. Sakamoto, L.H.; Andrade, R.V.; Felipe, M.S.; Motoyama, A.B.; Pittella Silva, F. SMYD2 is highly expressed in pediatric acute lymphoblastic leukemia and constitutes a bad prognostic factor. Leuk. Res. 2014, 38, 496–502. [Google Scholar] [CrossRef]
  52. Komatsu, S.; Ichikawa, D.; Hirajima, S.; Nagata, H.; Nishimura, Y.; Kawaguchi, T.; Miyamae, M.; Okajima, W.; Ohashi, T.; Konishi, H.; et al. Overexpression of SMYD2 contributes to malignant outcome in gastric cancer. Br. J. Cancer 2015, 112, 357–364. [Google Scholar] [CrossRef] [PubMed] [Green Version]
  53. Huang, J.; Perez-Burgos, L.; Placek, B.J.; Sengupta, R.; Richter, M.; Dorsey, J.A.; Kubicek, S.; Opravil, S.; Jenuwein, T.; Berger, S.L. Repression of p53 activity by Smyd2-mediated methylation. Nature 2006, 444, 629–632. [Google Scholar] [CrossRef] [PubMed]
  54. Nakakido, M.; Deng, Z.; Suzuki, T.; Dohmae, N.; Nakamura, Y.; Hamamoto, R. Dysregulation of AKT Pathway by SMYD2-Mediated Lysine Methylation on PTEN. Neoplasia 2015, 17, 367–373. [Google Scholar] [CrossRef] [PubMed] [Green Version]
  55. Huang, J.; Yang, G.; Huang, Y.; Zhang, S. Inhibitory effects of 1,25(OH)2D3 on the proliferation of hepatocellular carcinoma cells through the downregulation of HDAC2. Oncol. Rep. 2017, 38, 1845–1850. [Google Scholar] [CrossRef]
  56. Morscher, R.J.; Grunert, S.C.; Burer, C.; Burda, P.; Suormala, T.; Fowler, B.; Baumgartner, M.R. A single mutation in MCCC1 or MCCC2 as a potential cause of positive screening for 3-methylcrotonyl-CoA carboxylase deficiency. Mol. Genet. Metab. 2012, 105, 602–606. [Google Scholar] [CrossRef]
  57. Pang, J.; Liu, W.P.; Liu, X.P.; Li, L.Y.; Fang, Y.Q.; Sun, Q.P.; Liu, S.J.; Li, M.T.; Su, Z.L.; Gao, X. Profiling protein markers associated with lymph node metastasis in prostate cancer by DIGE-based proteomics analysis. J. Proteome Res. 2010, 9, 216–226. [Google Scholar] [CrossRef]
  58. Marques, R.B.; Dits, N.F.; Erkens-Schulze, S.; van Ijcken, W.F.; van Weerden, W.M.; Jenster, G. Modulation of androgen receptor signaling in hormonal therapy-resistant prostate cancer cell lines. PLoS ONE 2011, 6, e23144. [Google Scholar] [CrossRef] [Green Version]
  59. Horne, M.C.; Goolsby, G.L.; Donaldson, K.L.; Tran, D.; Neubauer, M.; Wahl, A.F. Cyclin G1 and cyclin G2 comprise a new family of cyclins with contrasting tissue-specific and cell cycle-regulated expression. J. Biol. Chem. 1996, 271, 6050–6061. [Google Scholar] [CrossRef] [Green Version]
  60. Kim, Y.; Shintani, S.; Kohno, Y.; Zhang, R.; Wong, D.T. Cyclin G2 dysregulation in human oral cancer. Cancer Res. 2004, 64, 8980–8986. [Google Scholar] [CrossRef]
  61. Hasegawa, S.; Nagano, H.; Konno, M.; Eguchi, H.; Tomokuni, A.; Tomimaru, Y.; Wada, H.; Hama, N.; Kawamoto, K.; Kobayashi, S.; et al. Cyclin G2: A novel independent prognostic marker in pancreatic cancer. Oncol. Lett. 2015, 10, 2986–2990. [Google Scholar] [CrossRef] [Green Version]
  62. Canovas, V.; Punal, Y.; Maggio, V.; Redondo, E.; Marin, M.; Mellado, B.; Olivan, M.; Lleonart, M.; Planas, J.; Morote, J.; et al. Prostate Tumor Overexpressed-1 (PTOV1) promotes docetaxel-resistance and survival of castration resistant prostate cancer cells. Oncotarget 2017, 8, 59165–59180. [Google Scholar] [CrossRef] [PubMed] [Green Version]
  63. Zhuang, S.H.; Burnstein, K.L. Antiproliferative effect of 1alpha,25-dihydroxyvitamin D3 in human prostate cancer cell line LNCaP involves reduction of cyclin-dependent kinase 2 activity and persistent G1 accumulation. Endocrinology 1998, 139, 1197–1207. [Google Scholar] [CrossRef] [PubMed]
  64. Lehtonen, S.; Ora, A.; Olkkonen, V.M.; Geng, L.; Zerial, M.; Somlo, S.; Lehtonen, E. In vivo interaction of the adapter protein CD2-associated protein with the type 2 polycystic kidney disease protein, polycystin-2. J. Biol. Chem. 2000, 275, 32888–32893. [Google Scholar] [CrossRef] [PubMed] [Green Version]
  65. Rizvi, H.; Paterson, J.C.; Tedoldi, S.; Ramsay, A.; Calaminici, M.; Natkunam, Y.; Lonardi, S.; Tan, S.Y.; Campbell, L.; Hansmann, M.L.; et al. Expression of the CD2AP adaptor molecule in normal, reactive and neoplastic human tissue. Pathologica 2012, 104, 56–64. [Google Scholar]
Figure 1. Venn diagram analysis of PCa transcriptome. (A) The three PCa datasets (GSE70770, GSE62872 and GSE6919) overlapping produced 276 common significantly up-regulated key genes. The overlapping between GSE70770 (2279 SUG) vs. GSE62872 (2312 SUG) showed 1010 genes in common (the sum of 276 and 734). As regard GSE6919 (1747 SUG) vs. GSE70770 overlapping, we identified 411 genes. Similar results were obtained when we compared GSE6919 vs. GSE62872 (444 genes in common). (B) The analysis of the intersection between the transcriptome of genes common up-regulated in the three PCa datasets (276) and the transcriptome of the down-regulated genes in LNCaP cell line treated with Vitamin D for 24 h (2196 SUG), showed 43 (almost 15%) significantly common regulated (chi-squared, p < 0.0001). (C) When we loaded the 43 genes in the GATHER browser, we showed that the biological process most significantly regulated by these genes were organogenesis, organ development, skeletal development, chromatin assembly, morphogenesis and cell migration.
Applsci 09 04923 g001
Figure 2. Network and GO analysis by GeneMania. (A) The 43 key genes up-regulated in PCa biopsies and down-regulated in the LNCaP cell line treated with Vitamin D (100 nM for 24 h) were loaded into GeneMania, in order to generate a GO and a Regulatory molecular network. Red circle genes represent the six most significantly up-regulated in PCa and down-regulated by the action of Vitamin D in our LNCaP cell line (B). The analysis showed that 92.30% of genes resulted co-expressed, 4.61% belonging to the same pathways, 1.97% present a genetic interaction, 0.82% were co-localizated and 0.30% shared the same protein domains.
Applsci 09 04923 g002
Figure 3. Selection of six key genes modulated in PCa. (A) In order to allow the comparison of microarray datasets independent of the original hybridization intensities, we decided to apply a Z score transformation. The normalization allowed us to applicate a Z test for the six genes most significantly up-regulated in PCa and down-regulated by the action of Vitamin D in the LNCaP cell line. We obtained 251 healthy subjects and 548 PCa samples. All genes selected (KLK3, PRSS8, SOX4, SMYD2, MCCC2, CCNG2 and CD2AP) resulted significantly up-regulated in PCa biopsies compared to prostate biopsies of healthy subject (p < 0.0001) (B). A significantly positive correlation was observed between all six key genes selected and KLK3 expression levels. (C) Similar results were obtained when we analyze the correlation between the six genes’ z-score expression levels and the tumor percent. Data are expressed as z-score intensity expression levels and presented as vertical scatter dot plots. p values < 0.05 were considered to be statistically significant **** p < 0.00005).
Applsci 09 04923 g003
Figure 4. The Vitamin D metabolism genes modulated in PCa patients. (A) The expressions of CYP24A1, CAMP and VDR were significantly down-regulated in PCa patients compared to healthy controls subjects. Also, the expression levels of VDR and CYP24A1 were correlated negatively with KLK3 in healthy (B) and in PCa patients (C). Data are expressed as expression levels and presented as vertical bars. p values < 0.05 were considered to be statistically significant (** p < 0.005; **** p < 0.00005).
Applsci 09 04923 g004
Figure 5. The Vitamin D-modulated PCa related genes. (A) The expression of PRSS8, SOX4, SMYD2, MCCC2, CCNG2 and CD2AP were significantly down-regulated in this LNCaP cell line at 24 h after exposition to 100 nM of 1,25D3. (B) In addiction, the expression levels of Vitamin D metabolism genes were significantly modulated in LNCaP cells line under 1,25D3 exposition (no significant modulation was observed for CYP27B1) (Data are expressed as expression levels and presented as vertical bars. p values < 0.05 were considered to be statistically significant ** p < 0.005; *** p < 0.0005; **** p < 0.00005).
Applsci 09 04923 g005
Figure 6. PCa-related genes modulated in the LNCaP cell line under 1,25D3 and 25D3 treatment. (A) In the LNCaP cell line the 1,25D3 reduced the expression levels of CYP27B1 and CAMP, and on the contrary increased the expression levels of CYP24A1. An exception were VDR expression levels. (B) The CYP24A1 and CAMP expression levels are regulated by 25D3 in LNCaP cells via CYP27B1 and VDR. (C) All PCa related genes were sensitive to the effect of 1,25D3 and 25D3 (an exception was MCC2). (D) The siCYP27B1 and siVDR LNCaP cells treatment showed a strong modulation of KLK3 gene transcription.
Applsci 09 04923 g006
Figure 7. IHC of the six PCa-selected genes. Immunostaining for PRSS8 (A), SOX4 (B), SMYD2 (C), MCCC2 (D), CCNG2 (E) and CD2AP (F) in Prostate Adenocarcinoma High grade compared to normal prostate tissue (Control) (see the text for the details). The images downloaded from the Human Atlas Project (https://www.proteinatlas.org/) have been re-adapted using CorelDraw. The original files web site links are available as well as the complete analyzes, in Table 1 and Table S1.
Applsci 09 04923 g007
Table 1. Immunostaining details recovered from The Human Atlas Project.
ProteinStateAntibodyStaining IntensityQuantityLocalizationCellsBiopsiesPatient ID
PRSS8HealthyHPA030436LowModerate<25%Cytoplasmic/membranousGlandular cells32472
HGPACMediumModerate75%–25%Cytoplasmic/membranousTumor cells43563
SOX4HealthyHPA029901LowWeak75%–25%NuclearGlandular cells32472
HGPACMediumModerate>75%Cytoplasmic/membranous/nuclearTumor cells73570
SMYD2HealthyHPA029023MediumModerate>75%Cytoplasmic/membranousGlandular cells32472
HGPACLowWeak75%–25%Cytoplasmic/membranousTumor cells12825
MCCC2HealthyHPA061546HighStrong>75%Cytoplasmic/membranousGlandular cells32472
HGPACHighStrong>75%Cytoplasmic/membranousTumor cells122816
CCNG2HealthyHPA034684LowModerate<25%Cytoplasmic/membranousGlandular cells32472
HGPACMediumModerate>75%Cytoplasmic/membranousTumor cells23978
CD2APHealthyHPA003267HighStrong>75%Cytoplasmic/membranousGlandular cells32053
HGPACHighStrong>75%Cytoplasmic/membranousTumor cells15250
HGPAC: High grade prostatic adenocarcinoma. Healthy: normal prostate tissue biopsies. The % indicates the fraction of stained cells (rare, <25%, 25–75% or >75%).

