Abstract
In the era of the Fourth Industrial Revolution, companies are focusing on securing artificial intelligence (AI) technology to enhance their competitiveness via machine learning, which is the core technology of AI, and to allow computers to acquire a high level of quality data through self-learning. Securing good-quality big data is becoming a very important asset for companies to enhance their competitiveness. The volume of digital information is expected to grow rapidly around the world, reaching 90 zettabytes (ZB) by 2020. It is very meaningful to present the value quality index on each data attribute as it may be desirable to evaluate the data quality for a user with regard to whether the data is suitable for use from the user’s point of view. As a result, this allows the user to determine whether they would take the data or not based on the data quality index. In this study, we propose a quality index calculation model with structured and unstructured data, as well as a calculation method for the attribute value quality index (AVQI) and the structured data value quality index (SDVQI).
1. Introduction
In the era of the Fourth Industrial Revolution, more and more people and things are connected to the internet, and big data are being produced explosively [1]. In order for industries to improve the competitiveness of products and services, big data are explosively being produced and utilized, and the government also encourages the creation of new job openings throughout the open and private sectors, as well as the utilization of public data [2]. The amount of digital information produced and circulated globally is expected to be 90 zettabytes in 2020 [1], and digital information in Korea is expected to increase by an annual average of 57% [3,4]. Digital information can be classified into unstructured data, such as image and voice, and structured data. Unstructured data account for an overwhelming proportion of 92% of the total amount of information, and structured data account for 8% [3]. Companies are focusing on enhancing the competitiveness of products and services using artificial intelligence (AI) technology, and machine learning, which is a core technology of artificial intelligence (AI), is a way for computers to acquire high-level characteristics through self-learning data. Securing high-quality big data is becoming an important asset to enhance corporate competitiveness. Also, with the advancement of data technology, the value of data utilization becomes higher; thus, systematic quality control is required. Until now, the quality control of data concentrated on structured data, with a very weak demonstration for unstructured data. Therefore, it can be said that a systematic study is needed to calculate the quality index of structured and unstructured data.
Major companies around the world are focusing on securing artificial intelligence (AI) technology, which is a core technology of the Fourth Industrial Revolution, to enhance competitiveness. Global information technology (IT) companies such as Google, Facebook, Microsoft, and IBM are releasing AI algorithms. The volume of digital information is rapidly increasing worldwide, data technology is being developed further, and the value of using stereotyped and unstructured data is getting higher. Companies are focusing on securing artificial intelligence to enhance their competitiveness. Machine learning, which is a core technology of artificial intelligence technology, requires high-quality data in a way that enables computers to acquire high-level characteristics through self-learning of data. Big data that artificial intelligence can learn are exploding, but research on data profiling for securing reliable and high-quality data is very lacking. In particular, it is very important to develop a data quality index for evaluating data quality in digital information [3]. In this paper, we propose a research model for calculating the quality index of fixed and unstructured data, and we derive attributes for data quality diagnosis, calculate the data attribute value quality index, and calculate the data value quality index.
2. Materials and Methods
2.1. Structured Data Quality Factors
Data quality is defined as a level that can provide useful value to users by securing data accuracy, interconnection, and up-to-date data [1,5]. In addition, it is defined as a level that can be continuously satisfied for various purposes or for the satisfaction of users who utilize data [6,7]. Data quality management refers to a series of activities performed to maximize user satisfaction by continuously maintaining and improving the quality of data [5,8]. The data quality error rate is calculated by applying the weight by area according to the importance of the value (70%), structure (20%), and standard (10%) of the data in the public data quality management manual [8]. This study provides seven big data quality indexes to measure the quality level of public institution data and 24 detailed indexes which reflect the detailed characteristics by index [8,9]. The seven indexes are readiness, completeness, consistency, accuracy, security, timeliness, and usability. Readiness is an index related to the preparation of policies, organizations, and procedures for quality control of data and it measures whether the data are faithfully managed with the latest contents. As a logical and physical structure in establishing a database, completeness is an index that measures whether data are stored in accordance with business requirements. Consistency is an index that measures whether data that have the same meaning conform to the standard with a consistent name and format and whether data sharing and linking remain consistent. Accuracy is an index that measures whether the stored data are in a range and format of values that fit the defined criteria and whether the data reflect the most recent value. Security is an index that measures whether data generation management subjects are managed and whether the security measures such as data access management level, authority of data, and encryption of important data are performed. Timeliness is an index that measures whether procedures for collection, processing, and provision according to data requirements are managed based on the level of response time, as well as on data requirements for the level being satisfied. Usability is an index that measures the level of data that users are satisfied with, the level of their convenience when accessing data, and whether they are working to improve the convenience of data usage. In a study on the quality factor of big data, it was suggested that it is desirable to determine the quality of data according to whether it is suitable for the purpose of use from the viewpoint of the user based on big data processing technology [10]. In terms of users, data types are classified into intrinsic, accessibility, contextual, and representational quality [10]. In order to secure data quality, it is said that the quality factors should be defined in consideration of data values, business rules, data standards, data hierarchy, and characteristics of industrial sites, and that continuous management is required through data quality management infrastructure (tool/system), quality management policy, and organization [11]. This study aims to find the quality index centered with a data value which is relatively important for big data quality measurement, which is rapidly increasing.
2.2. Unstructured Data Quality Factors
Quality standards for unstructured data should be applied somewhat differently from quality standards for structured data [3]. The types of unstructured target data refer to metadata, texts, images, sounds, videos, three-dimensional (3D) data, geographic information system (GIS) data, aerial photographs, weather satellite images, and cartographic satellite images, and the cases for classifying the contents in terms of establishing a database are shown in Table 1 [3].

Table 1.
Example of content classification.
The quality measurement for unstructured text was firstly considered for the target and scope of quality measurement, and the selection of measurement criteria for quality measurement, as well as the corresponding measurement items and contents, was arranged using a checklist [3,12]. It was used directly for quality measurement by checking the measurement contents recorded in the checklist of quality measurement [3]. The definition of quality criteria for unstructured text can be defined and used according to the purpose of use by the organization, company, or institution [3]. The scope of selection of quality measurement standards can be different based on the quality control policy and direction, and a clear direction should be defined according to the long-term vision and purpose when establishing the quality diagnosis plan, allowing the measurement criteria to be selected [3]. The method of defining the weights among the measurement criteria by calculating the importance of the unstructured text quality measurements may be done using a predefined method or an ad hoc method. The predefined method selects importance based on the matching measurement standard considering the object, the purpose of use, and the purpose of diagnosis to be diagnosed. The ad hoc method quantitatively calculates a weight between measurement standards through a statistical analysis method, so as to calculate a separate importance factor as it is not predefined.
2.3. Data Quality Diagnosis
Profiling is the estimation of potential error data through the analysis of data statistics and patterns [8,13,14]. Data profiling techniques are largely classified into column profiling, single-table profiling, and cross-table profiling techniques [8]. This study mainly uses column and single-table profiling techniques. Data profiling is a core function of data quality diagnosis and allows performing technical analysis of data values and structure. The profiling function includes analysis functions such as column analysis, date analysis, code analysis, referential integrity analysis, and pattern analysis [8,15,16,17]. The scope of the profiling defines the detailed functions in consideration of the type of data, the level of data quality control, and the goals [18]. The quality diagnosis method is divided into profiling, checklist (interview or questionnaire), business rule diagnosis, and unstructured survey, and Table 2 shows the methods of quality diagnosis of data value and unstructured data [8].
Table 2.
Quality diagnosis methods.
As big data are increasing explosively, it is hard for humans to diagnose data quality directly through actual measurement. This study focuses on the improvement of data value diagnostic profiling and the unstructured test method.
2.3.1. Calculation of Data Quality Errors
The value which diagnoses the quality level of the database is diagnosed from the viewpoint of data value, structure, and standardization, and the result is formulated and quantified as the data quality error rate [8]. Equation (1) is a calculation formula that applies a weight to the data value, structure, and standardization, which are quality factors of the data quality error rate [8].
where E is the error rate per quality factor, and W is the weight per quality factor. Value (accuracy) error rate () refers to error level for the value of data. Structure (completeness) error rate () refers to the degree that the structure of a database is not faithful. Normalization (consistency) error rate () refers to the degree to which the conformity to a database standard is insufficient. The weight of value (), weight of structure (), and weight of normalization () are 0.7, 0.1, and 0.2, respectively [8].
where i is a value diagnostic item, s is the number of total data, and e is the number of error data.
where n is the number of structural diagnosis items, i is the structural diagnosis item, and e is the error rate of each structural diagnosis item.
where n is the number of standard diagnostic items, i is the standard diagnostic item, and e is the error rate per standard diagnostic item. Equations (2)–(4) show the calculation formulas of the value, structure, and normalization error rates (%). The calculation standard of the database quality diagnosis error data for structured data is defined; however, the target attribute in principle performs data quality diagnosis for all attributes. Also, for unstructured data, the performer should carry out data value quality diagnosis through actual measurement. The value (accuracy) error rate calculation method is an inefficient method for massive data profiling.
2.3.2. Attribute Extraction Using Geometric Mean
In order to extract the attributes for big data quality diagnosis, it was confirmed that attribute extraction can be performed using a more scientific method, rather than using the subjective judgment of the performer, in a study featuring the attribute extraction model with the geometric mean [1].
where , n is the number of attribute selected among S’ set, is i-th attribute, is ith attribute weight, and is ith attribute correction value. However, for data attribute extraction, this study performed data profiling by targeting the attributes of numerical, categorical, and date types of structured data. The standard for data attribute extraction is shown in Table 3 [1].
Table 3.
Attribute weight extraction criteria. NA—not available.
The attribute correction value extraction criteria for data attribute extraction are shown in Table 4 [1,19,20].
Table 4.
Attribute correction value extraction criteria.
This study confirmed that the attribute extraction method using geometric mean is superior to the value (accuracy) error rate method [1]. Only the attribute extraction method for data quality diagnosis is suggested, and the attribute value quality index and the value quality index of the data profiling target table cannot be presented. This study proposes a method to calculate the quality index of the structured data attribute value quality index and the target table.
2.3.3. Data Quality Diagnostic Comparison
The calculation method of data quality error performs data profiling on all tables of the database and all attributes of each table in order to calculate a data quality error rate (quality error rate) of the database. The attribute extraction method using the geometric mean extracts an attribute with error possibility and performs data profiling targeting the extracted attribute. Table 5 shows a comparison of data quality diagnostic methods when targeting a single table.
Table 5.
Comparison of data quality diagnostic methods.
As can be seen from Table 5, the extraction method using geometric mean is more scientific and shows better performance [1]. However, attribute extraction using the geometric mean has a disadvantage in that it is not possible to determine the degree of data value quality for each attribute. Thus, it was judged that, if this method was complemented, it could be helpful to perform data profiling more promptly.
2.4. Feature Scaling
Feature scaling means normalizing the distribution of variable values [21,22]. Normalization involves subtracting the average of the data from the variable or dividing the variable by the standard deviation of the total data, so that the average of the values is zero and the degree of distribution of the values is also constant. The Z-score was used for data normalization, where Z-score is defined as the distance of standard deviation (s) from the average () [23], as shown in Equation (6).
where is i-th Z-score, and is i-th variable value. This study uses the scale () function provided in R package for Z-score calculation [21,24].
2.5. Research Model
2.5.1. Research Model for Data Quality Index Calculation
This study used the numerical, date, and categorical data attributes for structured data, and text data for unstructured data in order to calculate the data quality index. In order to calculate the value quality index of the structured data, this study analyzed descriptive statistics, missing values, and outliers, and used the term frequency inverse document frequency (TF-IDF) and neural network technique Word2vec to calculate the quality index of the unstructured data. The data profiling model using a neural network and statistical analysis (DPNS), which can calculate the data quality index, is presented in Figure 1.
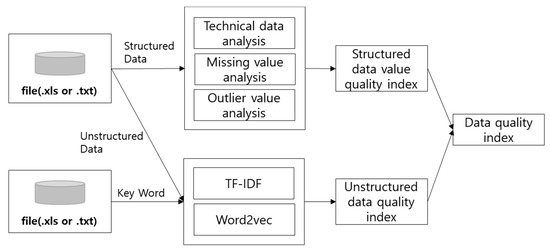
Figure 1.
Data profiling model using a neural network and statistical analysis (DPNS).
In this study, a structured data attribute value quality index was calculated, and a data profiling target attribute was derived using the calculated attribute value quality index. In addition, the value quality index of structured data using the data attribute value quality index was calculated.
2.5.2. Data Analysis Methods for Model Development
The data analysis methodology includes Knowledge Discovery in Database (KDD) and CRISP-DM (CRSS Industrial Standard Process for Data Mining) [25]. In this study, the existing methodology was customized. The big data analysis methodology of Korea Data Agency (KDA) is a hierarchical process model with three phases: Phase, Task, and step. The top level consists of analysis planning, data preparation, data analysis, system implementation, evaluation, and deployment [26]. Analysis planning is a step in understanding the business, identifying the problems of the domain, and determining the scope of the project. Data preparation is the step of preparing the datasets necessary for data analysis to develop models that reflect business requirements. Data analysis is the step of analyzing the data to achieve the goals established in the analysis planning stage using the fixed and unstructured data. System implementation is the step of implementing the results of exploratory data analysis or data analysis model as a system. The evaluation and deployment steps assess whether the objectives of the analysis planning phase are met, and they end the big data analysis project. KDD is a data mining methodology for discovering knowledge in a database. It is composed of data selection, data preprocessing, transformation, data mining, and interpreting/evaluation [27]. CRISP-DM is a hierarchical data mining methodology developed by many companies including Teradata, NCR, SPSS, and Daimler AG, which started in 1996 in the European Union ESPRIT project [28]. CRISP-DM consists of business understanding, data understanding, data preparation, modeling, evaluation, and deployment stages. Currently, many companies implement big data analysis methodology. The methodology applied to this study was customized to suit the data profiling of the big data analysis methodology, KDD, and CRISP-DM methodology of KDA. The methodology consisted of data preparation, data refining, modeling, and model evaluation, as shown in Figure 2.
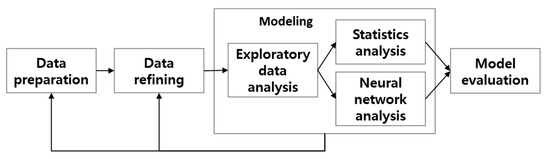
Figure 2.
Analysis method for DPNS model.
2.5.3. Data Value Quality Index Calculation Model
Outlier refers to a value apart from other observation values [26,29], and, in the case of 3 standard deviations, it is regarded as an extreme value [30]. This study used it to diagnose the data quality of numerical, date, and categorical data types. A flowchart for extracting attributes of the data value quality diagnosis target is shown in Figure 3.
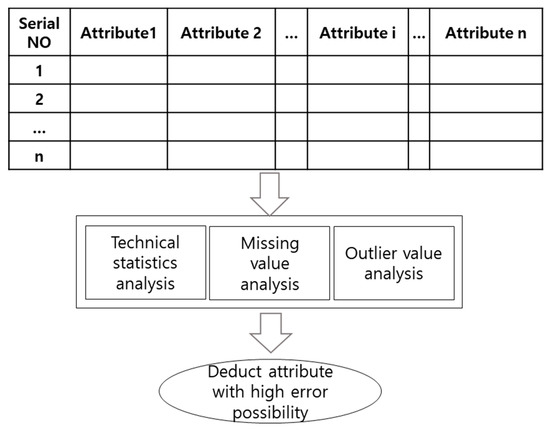
Figure 3.
Data value quality diagnosis target attribute extraction flowchart.
The attribute quality index calculation standard is shown in Table 6.
Table 6.
Calculation criteria of attribute quality index.
The calculation formula of the attribute value quality index (AVQI) of the i-th attribute in the data table is expressed by Equation (7).
where i is i-th attribute of the data table, k is a measurement item, n is the number of measurement items, is the value multiplied by weight (α) corresponding to the standard for applying the attribute quality index of the k-th measurement item, and is the number of records whose weight (α) of measurement item (k) is more than 0.0 (but, the AVQI of the attribute is 0.0, in the case of not having the number of records falling on the standard for applying an attribute quality index other than whose weight is 0.0).
where β is the attribute quality index applying standard falling on the measurement item, and α is the weight of the attribute quality index application criteria.
where β standard record number is the record number in which the weight (α) of the attribute quality index applying standard (β) is other than 0.0. The attribute value quality index (AVQI) becomes lower in error as it approaches 0. The calculation formula for the structured data value quality index (SDVI) is shown in Equation (10).
where i is the i-th attribute of the value quality index calculation target, n is the number of attributes for calculating the value quality index, is the value multiplied by weight (α) falling on the attribute quality index applying standard (β) of the i-th attribute, and is the number of records falling on the attribute quality index applying standard (β) of the i-th attribute. The structured data value quality index (SDVQI) becomes lower in error as it approaches 0.
3. Results
3.1. Data Collection and Analysis Method
For the performance evaluation, this study used the Delhi Weather dataset registered in Kaggle [31].
The Delhi Weather dataset includes a total of 20 attributes and uses the entire data (number of records = 100,990). If you remove the datetime_utc attribute by separating the datetime_utc attribute into date (_date) and time (_time) attributes, a total of 21 attributes remain. Based on the data types classified in Table 7, the attributes of _conds, _heatindexm, _precipm, _wdire, _wqustm, and _windchillm were excluded from the empirical study. For the empirical study, this study used R, a data analysis tool.
Table 7.
Collection data attributes.
3.2. Performance Evaluation Method
This study used the AVQI value derived from the attribute value quality index (AVQI) calculation formula presented in the research model for performance evaluation and compared the attribute results obtained using the attribute extraction method with the geometric mean. For the performance comparison, the data quality efficiency measurement value (DQEM) was used, calculated as follows [1]:
where S is the multiplication of the total number of attributes and the number of records, and m is the multiplication of the number of attributes and the number of records derived from the research model. The value of data quality efficiency measurement was excellent in terms of function as it was close to 100% [1]. For the performance evaluation, this study assumed the preconditions shown in Table 8.
Table 8.
Performance evaluation prerequisites.
3.3. Results of Data Attribute Derivation Experiment
Experimental results obtained by the attribute extraction model using geometric mean are shown in Table 9.
Table 9.
Attribute extraction experiment result using geometric mean.
A total of 13 attribute lists were extracted using Equation (5), without extracted _date and _time attributes. In the result calculated by the data value quality index calculation model, there were 13 attributes with AVQI values greater than 0.0, as shown in Table 10.
Table 10.
Attribute extraction test results using data attribute value quality index (AVQI).
The data value quality index (AVQI) calculation results using the data value quality index calculation model are shown in Table 11.
Table 11.
Attribute data quality index (AVQI) experiment result.
Using the data attribute value quality index (AVQI), the structured data value quality index (SDVQI) was calculated as follows:
The SDVQI of the Delhi Weather dataset used in the empirical study was 0.441, which indicates that the degree of data value quality was not good (SDVQI is less likely to have errors as it approaches 0). The data quality efficiency measurement value (DQEM) are shown in Table 12.
Table 12.
Data quality efficiency measurement results.
The DQEM for each data quality diagnostic model was calculated for 15 attributes from the Delhi Weather dataset using Table 6 criteria. The model of the value (accuracy) error rate performed data quality diagnosis for as many data records as possible per 15 attributes. This resulted in low-efficiency measurements when there were a large number of datasets or records. On the other hand, the attribute extraction model using geometric mean and the data value quality index calculation model had the same value of DQEM at 13.333%.
4. Discussion
Digital information volume is growing at a rapid pace, and companies are focusing on securing artificial intelligence (AI) technology to enhance competitiveness. Machine learning, a key technology in artificial intelligence, is a method via which computers acquire high-dimensional characteristics through self-learning of data. This requires continuous high-quality big data in order to raise accuracy. It is proven that securing high-quality big data is an important asset in enhancing corporate competitiveness. This study presented a structured/unstructured data quality index calculation model (DPNS). The quality index for each data attribute was calculated using the attribute value quality index (AVQI). When the AVQI value was 0.0 or more, it was considered that the probability of error was high, shown as 13.333% from the experimental result of attribution using geometric mean and the data value quality index calculation model (Table 12).
However, as can be seen in Table 9, from the attribute extraction experiment results using the geometric mean, the experimental result value calculated using the attribute list with error possibility and the attribute extraction model was 0.297 (weight value ≥ 0.1). As can be seen from the experimental results, the degree of data value quality of each attribute could not be evaluated (Table 11). As can be seen from the experimental results of the attribute data value index (AVQI), it is helpful for quickly data profiling the data value quality index for each attribute. It is possible to evaluate its data quality using data attributes extracted from the experimental result value (as the experimental data value approaches 1, the quality of data worsens). It is important for data quality to evaluate whether it is suitable for the purpose of use from the user’s perspective. Therefore, it is very meaningful to present the attribute value quality index (AVQI) for this. In addition, it is expected to confirm the data quality of a single table using the structured data value index (SDVQI) with the attribute value quality index (AVQI).
In this study, the SDVQI was calculated using the attribute value quality index (AVQI). As unstructured data are increasing, it is expected that the calculation of the unstructured data quality index will be helpful to determine the usefulness of unstructured data. In the future, we plan on completing the data profiling model using neural network and statistical analysis (DPNS).
Author Contributions
Data curation, S.-T.L.; Supervision, G.-Y.G.; Writing—original draft, W.-J.J.; Writing—review & editing, J.-B.K.
Funding
This research received no external funding.
Conflicts of Interest
The authors declare no conflict of interest.
References
- Jang, W.J.; Kim, J.Y.; Lim, B.T.; Gim, G.Y. A Study on Data Profiling Based on the Statistical Analysis for Big Data Quality Diagnosis. Int. J. Adv. Sci. Technol. 2018, 117, 77–88. [Google Scholar] [CrossRef]
- NIPA. Ride the Wind Big Data, Business Analytics Software Market is the Fastest Growing; IDC & Info Press: Seoul, Korea, 2012. [Google Scholar]
- Korea Data Agency. Korea Data Agency. Data Quality Diagnosis Procedures and Techniques; Korea Data Agency: Seoul, Korea, 2009. [Google Scholar]
- Korea Data Agency. Data Quality Management Maturity Model Ver1.0; Korea Data Agency: Seoul, Korea, 2006. [Google Scholar]
- Jung, S.H. A Study on the Influence Factors in Data Quality of Public Organizations. Ph.D. Thesis, Department Information Management, Dongguk University, Seoul, Korea, 2013. [Google Scholar]
- English, L.P. Information Quality Applied: Best Practices for Improving Business Information, Processes and Systems; Wiley Publishing Press: San Francisco, CA, USA, 2009. [Google Scholar]
- Madnick, S.E.; Wang, R.Y.; Lee, T.W.; Zhu, H. Overview and framework for data and information quality research. J. Data Inf. Qual. 2009, 1, 1–22. [Google Scholar] [CrossRef]
- Open Government Data Quality Management Manual, 2nd ed.; National Information Society Agency Press: Seoul, Korea, 2018.
- Kim, H.C. A Study on Public Data Quality Factors Affecting the Confidence of the Public Data Open Policy. Ph.D. Thesis, Department Business Administration, Soongsil University, Seoul, Korea, 2015. [Google Scholar]
- Choi, S.K.; Jeon, S.C. Aviation Communication Technique: A propose of Big data quality elements. J. Korea Navig. Inst. 2013, 17, 9–15. [Google Scholar]
- Park, H.G.; Song, H.G.; Jang, W.J.; Lee, S.R.; Lim, C.S. Fourth Industrial Revolution, Era of New Manufacturing; Heute Books Press: Seoul, Korea, 2017; pp. 80–99. [Google Scholar]
- Lee, C.N.; Yoo, K.H.; Mun, B.M.; Bae, S.J. Informal Quality Data Analysis via Sentimental analysis and Word2vec method. J. Korean Soc. Qual. Manag. 2017, 45, 117–128. [Google Scholar] [CrossRef]
- Johnson, T. Data Profiling. In Encyclopedia of Database Systems; Springer: Boston, MA, USA, 2009; pp. 604–608. [Google Scholar]
- Naumann, F. Data profiling revisited. ACM SIGMOD Rec. 2014, 42, 40–49. [Google Scholar] [CrossRef]
- Rahm, E.; Do, H.H. Data cleaning: Problems and current approaches. IEEE Data Eng. 2000, 23, 3–13. [Google Scholar]
- David, L.; Powell, R.J. Business Intelligence: The Savvy Manager’s Guide, Getting Onboard with Emerging IT; Morgan Kaufmann Press: San Francisco, CA, USA, 2003; pp. 110–111. [Google Scholar]
- David, L. Master Data Management; Morgan Kaufmann Press: San Francisco, CA, USA, 2009; pp. 94–96. [Google Scholar]
- Olson, J.E. Data Quality: The Accuracy Dimension; Morgan Kaufmann Press: San Francisco, CA, USA, 2003; pp. 140–142. [Google Scholar]
- Bonferroni, C. Teoria statistica delle classi e calcolo delle probabilita. Pubblicazioni del R Istituto Superiore di Scienze Economiche e Commericiali di Firenze 1936, 8, 3–62. [Google Scholar]
- Lee, D.S. Design of an Inference Control Process in OLAP Data Cubes. Ph.D. Thesis, Department Industrial Information System Engineering, Soongsil University, Seoul, Korea, 2009. [Google Scholar]
- Seo, M.K. Practical Data Processing and Analysis Using R; Gilbut Press: Seoul, Korea, 2014. [Google Scholar]
- Winston, C. R Graphics Cookbook; O’Reilly Media Press: Seoul, Korea, 2015. [Google Scholar]
- Gonick, L.; Smith, W. The Cartoon Guide to Statistics; KungRee Press: Seoul, Korea, 2015. [Google Scholar]
- Package Scale. Available online: http://cran.r-project.org/web/packages/scales/scales.pdf (accessed on 9 August 2018).
- Jang, W.J. An Empirical Study on Comparative Evaluation of Document Similarity between Machine Learning and an Expert. Ph.D. Thesis, Dept. IT Policy and Management, Soongsil University, Seoul, Korea, 2019. [Google Scholar]
- Korea Data Agency. The Guide for Advanced Data Analytics Professional; Korea Data Agency: Seoul, Korea, 2018. [Google Scholar]
- Fayyad, U.; Piatetsky-Shapiro, G.; Smyth, P. From data mining to knowledge discovery in databases. AI Mag. 1996, 17, 37–54. [Google Scholar]
- Azevedo, A.I.R.L.; Santos, M.F. KDD, SEMMA and CRISP-DM: A parallel overview. In Proceedings of the IADS-DM, Amsterdam, The Netherlands, 24–26 July 2008. [Google Scholar]
- Yoo, S.M. R-Statistical Analysis for Writing Academical Papers; Slow & Steady Press: Seoul, Korea, 2016; pp. 78–81. [Google Scholar]
- Shin, G.K. Partial Least Squares Structural Equation Mdeling (PLS-SEM) with SmartPLS 3.0; ChungRam Press: Seoul, Korea, 2018. [Google Scholar]
- Delhi Weather Data. Available online: https://www.kaggle.com/mahirkukreja/delhi-weather-data/data (accessed on 20 December 2017).


© 2019 by the authors. Licensee MDPI, Basel, Switzerland. This article is an open access article distributed under the terms and conditions of the Creative Commons Attribution (CC BY) license (http://creativecommons.org/licenses/by/4.0/).