Article

A New Method for Determining Critical Irrigation Period for Large Regions Based on Precipitation-Meteorological Yield Integral Regression Relationship—A Case Study of Winter Wheat in Shaanxi Province, China

Key Laboratory of Agricultural Soil and Water Engineering in Arid and Semiarid Areas, Ministry of Education, Northwest A&F University, Yangling 712100, China
*
Author to whom correspondence should be addressed.
Appl. Sci. 2019, 9(23), 5181; https://doi.org/10.3390/app9235181
Submission received: 17 November 2019 / Accepted: 26 November 2019 / Published: 29 November 2019
(This article belongs to the Section Environmental Sciences)

Abstract

:
Using the extremely limited water for deficit irrigation is a notable measure to improve crop yield in water shortage regions. Hence, determining a reasonable irrigation period in large regions is crucial. In this study, a simple and applicable process to determine the irrigation period in a large area by using the precipitation-yield integral regression method of crop growth period was proposed, and the winter wheat planting regions with a serious water shortage in Shaanxi, China were referred to as an example. According to the regional topography, soil, precipitation, temperature, and evaporation, the study area was first divided into four subregions; then, the rainfall water surplus and deficit characteristics of the subregions during the growth period of winter wheat were analyzed, and the precipitation-yield integral regression function of the subregions was calculated. In accordance with the sensitivity of rainfall to crop yield in different periods, the reasonable irrigation period of winter wheat in each subregion was determined. The results are basically consistent with irrigation habits of local farmers, and can be used to guide the irrigation of local winter wheat. They also demonstrate that the method has the advantages of requiring fewer data and being simple and reliable, and can overcome the problem that the existing method is difficult to determine the optimal irrigation period in the large-scale region, due to the lack of test points and representativeness. The proposed method application value in determining the deficit irrigation period with small water amount, in a large region lacking research materials.

1. Introduction

Global dryland occupies a large proportion of the total area of the earth [1], and current climate warming and rapid population growth trends are only increasing the risk of dryland area growth, especially in developing countries [2]. In many developing countries, water resources are scarce and cultivated land is fragmented, due to serious soil erosion, river channels, streams, dry gullies, poor agricultural infrastructure, and incomplete irrigation measures [3]. These problems have created severe food security challenges in these regions [4]. In regions where it is difficult to establish large-scale irrigation channels or pipelines to provide enough water for irrigation, only small-scale irrigation projects, such as water wells and rainwater harvesting projects, can be used to carry out limited irrigation with extremely limited water amount (the available total irrigation water amount in the whole growing season is commonly less than 40 mm) in the sensitive period of crop growth and water shortage to improve food production and alleviate poverty [5]. Several studies have investigated limit irrigation using small-scale water conservancy projects, such as rainwater harvesting projects [6]. Currently, research on rainwater harvesting has thoroughly explored rainwater harvesting technology and its impact on crop yield [7,8], whereas studies focused on determining the limit irrigation schedule of small-scale water conservancy projects are rarely published. Establishing an irrigation schedule is crucial to the development of small-scale water source supplementary irrigation agriculture [9,10,11].
Initiating a crop irrigation schedule requires study of the rational allocation of water during crops’ growing periods to achieve maximum crop yield or maximum benefit. Many methods can be used to determine an irrigation schedule, such as the empirical methods or field irrigation test methods. And among the field test methods, optimization methods have also been explored. The optimization method has experienced the development process from dynamic programming to intelligent optimization, and from single-objective optimization to multiobjective optimization. In recent years, some scholars have coupled crop models and optimization algorithms to determine irrigation schedules. Roy et al. [12] used HYDRUS-2D software to simulate water and nutrient flow, combined with the multiobjective optimization program of DSSAT crop model software, to determine the optimal irrigation schedule for wheat. Kropp et al. [13] combined the unified nondominated sorting genetic algorithms with the DSSAT crop model to determine the best irrigation schedule for maize. Li et al. [14] evaluated the ability of the AquaCrop model to simulate cotton in the North China Plain and optimized its irrigation strategy. In addition, determining irrigation schedules based on random rainfall has been studied [15,16]. However, these studies often depend on field experiments with long test cycles and a heavy workload. Moreover, determining the irrigation schedule over a long period is difficult. Furthermore, the topographic characteristics of farmland in a region are complex, and the representativeness of field test samples is insufficient, which makes it difficult to coordinate a final irrigation schedule with the topographic characteristics of the region. Therefore, determining a method that can overcome these shortcomings and adequately reflect crop yield with fewer variables to feasibly determine an irrigation schedule for crops over a long period is necessary.
Integral regression method has been widely used in many fields because of its substantial dimension reduction and limited loss of original information. According to the utilization of seasonal climate prediction information, Cho et al. [17] used the principle of integral regression as a downscaling method to refine the spatial scale and improve climate predictability. Pei et al. [18] studied the response of the initial flowering period of eight woody plants to climate change by using the integral regression method, and established an integral regression prediction model for early flowering periods. Deng et al. [19] analyzed the effects of eco-climatic adaptability and meteorological conditions on the yield of Angelica sinensis by using the integral regression method and field test data. In view of the advantages of the integral regression theory, this study attempts to use the integral regression theory to determine the optimal irrigation period of large-scale Winter Wheat under the condition of extremely limited available irrigation amount. It uses several years of precipitation and yield data to analyze the impact of rainfall on yield in different stages of crop growth, and determines the irrigation period according to the sensitive period of rainfall on winter wheat yield.
In this study, northern and central Shaanxi Province, which is arid and has limited water resources for irrigation, were taken as the study area. According to the terrain, the climate and soil characteristics of the area, the province was divided into different subregions. Representative counties of each subregion were selected to construct the precipitation winter wheat yield integral regression curve. According to the characteristics of the curve, the optimal irrigation period of different subregions was established, and the rationality of determining irrigation periods based on the response relationship of precipitation and yield of wheat growth was analyzed.

2. Methodology

2.1. Comprehensive Partition Method and Data Acquisition of Precipitation and Yield in Subregion

Considering that there are differences in topography, soil, temperature, precipitation and crop evapotranspiration on a large region, it is necessary to divide the large regions into several subregions and determine the best irrigation period of each subregion, so as to ensure the reliability and practical availability of the research results.
To simplify the study, the counties located in the middle of each subregion were selected as representative counties to study the precipitation yield response relationship of crops in each subregion. Precipitation data of representative counties in each subregion were obtained from the China Meteorological data network (https://data.cma.cn/). In order to prevent the problem of insufficient representation of crop yield data caused by the change of soil characteristics of the test site by using common test methods in the region, through the crop yield data released by the county government (http://data.cnki.net/), we can obtain the annual crop yield of the representative counties in each subregion to ensure the reliability of the crop yield used in the study. In addition, winter wheat in each typical county was planted from late September to early October and harvested from late May to early June of the following year.

2.2. Decomposing Method of the Trend Yield and Meteorological Yield of Each Subregion

The change in crop yield caused by an increase in productivity is called a trend yield, the fluctuation in crop yield caused by climatological factors is called a meteorological yield, and the change in crop yield caused by other factors is considered a random error. Therefore, the yield of crop any given year may be affected by trend yield, meteorological yield, or random error, and it can be calculated using the following equation:
y = y t + y w + ε ,
where y is the actual yield (kg/ha), y t is the trend yield (kg/ha), y w is the meteorological yield (kg/ha), and ε is the random error. Because ε has little influence on y , it is generally neglected.
The trend yield and meteorological yield were decomposed by using the crop yield data over the years of the representative counties in each subregion. An accurate understanding of the impact of meteorological conditions on crop yield must be based on the precise acquisition of meteorological yield. Therefore, it is necessary to select a suitable method that accurately separates the trend yield and meteorological yield from the actual yield. Logistic equations are widely used because they describe bounded growth and capture the long-term trend of time series growth more accurately than other methods [20,21,22]. Therefore, in this study, the logistic equation was selected to fit the trend yield, which is expressed as follows:
y t = K 1 + e b r t ,
where K, b, and r are the parameters of the equation. K is the carrying capacity, r is the instantaneous growth rate, and b is the integral constant. Thus, the meteorological yield y w can be calculated using Equations (1) and (2) (i.e., y w = y y t ).

2.3. Solving the Precipitation-Meteorological Yield Integral Regression Function of Each Subregion

Using the meteorological yield of many years and the corresponding years’ precipitation in each ten days of whole crop growth period, the integral regression curve of rainfall meteorological yield of typical counties in each subregion was calculated to determine the optimal irrigation period.
The principle of precipitation–meteorological yield integral regression is to divide the whole growth period of crop into several infinitely small periods. The relationship between precipitation and meteorological yield in each small period can be expressed using the following regression integral:
y ^ w = C + 0 T a ( t ) r ( t ) d t
where y ^ w is the estimated value of the meteorological yield of crop; C is the constant; T is the number of days of the whole growth period; r(t)dt is the precipitation from t to t + dt; and a(t) = ∆y/∆r is the relationship between precipitation at t and the meteorological yield, that is, the effect of each “additional” precipitation on meteorological yield at different growth stages. ∆y is the meteorological yield increment, and ∆r is the precipitation increment. This function can provide a basis for determining the irrigation period of the crop. Because a(t) is usually a continuous function that is slow to change, it can be quite precisely approximated to within a few terms of a polynomial expressed in time. Specifically, it can be expressed as follows by the orthogonal function φi(t) (i = 0, 1, 2, ……):
a ( t ) = a 0 φ 0 ( t ) + a 1 φ 1 ( t ) + ,
where ai (i = 0, 1, 2……) is a partial regression coefficient.
Substituting Equation (4) into Equation (3), the following equation is obtained:
y ^ w = C + 0 T ( a 0 φ 0 ( t ) + a 1 φ 1 ( t ) + ) r ( t ) d t = C + a 0 0 T φ 0 ( t ) r ( t ) d t + a 1 0 T φ 1 ( t ) r ( t ) d t +
Precipitation distribution coefficient ρi is defined as follows:
ρ i = 0 T φ i ( t ) r ( t ) d t ( i = 0 ,   1 ,   2 ,   ) .
Substituting Equation (6) into Equation (5), according to the definition of the orthogonal standard function, the following equation can be obtained:
y ^ w = C + a 0 ρ 0 + a 1 ρ 1 + .
The problem that can be seen from Equation (7) is determining ai (i = 0, 1, 2, ……). According to the precipitation distribution coefficient and meteorological yield of a region over the years, multivariate linear regression method can be used to derive ai. Then, using Equation (4), the influence value a(t) of the “additional” precipitation on meteorological yield at different periods can be obtained.
The calculation process of determining the optimal irrigation period of regions crops was as follows: First, the trend yield of crops in the region was calculated by using logistic fitting method, and the trend yield is subtracted from the actual yield to obtain the meteorological yield over the years. Second, according to the discretized orthogonal function φi(t) and the amount of precipitation in different periods, the precipitation distribution coefficient ρi over several years was deduced from Equation (6). Then, ai was calculated according to the meteorological yield and the precipitation distribution coefficient ρi over several years using Equation (7). Finally, according to the calculated ai, the influence coefficient a(t) of precipitation on the meteorological yield in different stages of crop growth was calculated using Equation (4).
If a(t) was larger at a certain crop growth stage (indicating that “additional rainfall” had a significant effect on crop yield at this stage), it could also be considered that irrigation can significantly improve crop yield at this stage. Using this method, a reasonable irrigation period was established.

3. Results and Discussion

3.1. Natural Characteristics and Water Deficit Distribution of Winter Wheat in Different Subregions

The topographic conditions, soil types, annual average rainfall, annual average temperature, and annual evaporation of Shaanxi Province are presented in Figure 1. Shaanxi Province lies between 105°29′–111°15′ E and 31°42′–39°35′ N and has a total area of 205,600 square kilometers. Its terrain is high in the north and south and low in the middle, and it is composed of a mixture of the plateau, mountain, plain, basin, and other landforms. The south of Shaanxi includes the south foot of the Qinling Mountains, the north foot of the Ta-pa Mountains, and the River Han. Its altitude is generally 700–3000 m. The central part of Shaanxi is north of the Qinling Mountains and mainly made up of plains on both sides of River Wei, with an altitude of 320–800 m. The northern part of Shaanxi largely consists of Loess Plateau, hills, and gullies, with an altitude of 900–1500 m.
In addition to the south of Shaanxi Province, the soil texture changes from sandy soil to cohesive soil from north to south. The main soil types are sandy loam, loam, silt loam, and silt clay loam. When examining the province as a whole, rainfall is substantially more prevalent in the south than in the north. Annual rainfall in the Ta-pa Mountains at the southernmost end, for example, averages 1240 mm, while annual rainfall at the northernmost end averages only 340 mm. The precipitation in all parts of the Shaanxi Province is concentrated from July to September, with the lowest precipitation in winter, accounting for only 2–5% of the total annual precipitation. Evaporation also gradually increases from south to north. The lack of precipitation and high evaporation in northern Shaanxi makes it difficult or even impossible to meet the water demand for crops. In addition, the terrain in the northern area is fragmented. The local surface groundwater resources are seriously lacking, the maximum available water in the whole year is only 40–60 mm, and 70% of the surface runoff of the river is mainly from July to September. Therefore, there is no large ground water source nor suitable conditions within which to build a large irrigation canal and pipeline irrigation system, and it is also difficult to transfer water from outside the region. Thus, there is an urgent need to use extremely limited water resources to develop deficit irrigation in the critical period of crop water demand.
Due to the different topography, soil, precipitation, evaporation, and temperature across Shaanxi Province, rice is mainly grown in the south, while winter wheat and summer maize are grown in the central and north regions. Notably, both sides of the Wei River in central Shaanxi Province have a flat terrain and favorable water source conditions. There are nine large-scale irrigation systems here, which mainly use full irrigation for winter wheat. Due to the low temperatures in the northernmost part of Shaanxi Province, winter wheat growth is difficult. However, other regions across the middle and northern parts of Shaanxi Province must develop deficit irrigation with a small amount of water for winter wheat.
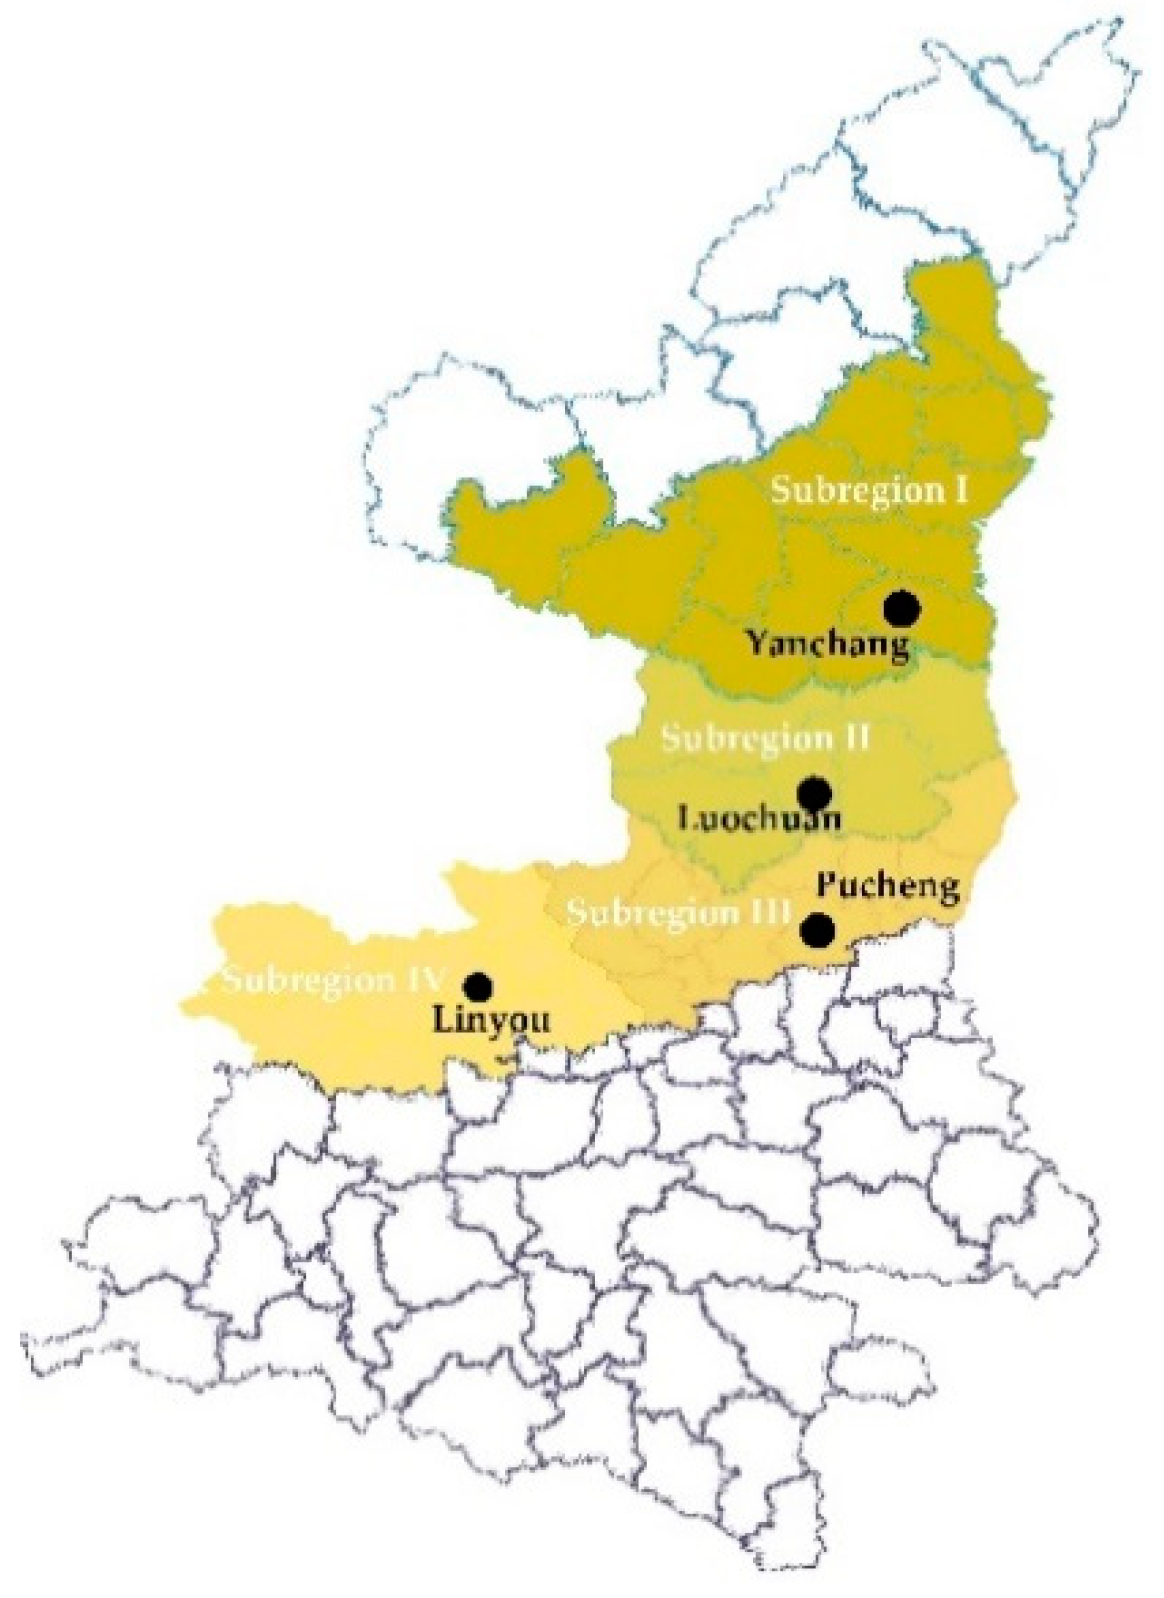
This study focused on determining the optimal irrigation period of winter wheat in the deficit irrigation regions with a small amount of water of Shaanxi Province mentioned above. As the natural conditions of the region vary considerably, the study region was divided into four winter wheat planting subregions (I, II, III, IV) according to terrain characteristics, soil characteristics, annual precipitation, and crop water demand during the growth period of winter wheat (Figure 2). The mean values of precipitation, evapotranspiration, and precipitation self-sufficiency rate (precipitation/evapotranspiration 100%) in different months during the growth period of winter wheat in each subregion are shown in Table 1.
Subregion I is the northernmost area of winter wheat growth in Shaanxi Province, with hills and gullies as the main terrain and loam as the main soil type. During the growth period of winter wheat, the mean precipitation is 187.4 mm, the mean evapotranspiration is 485.8 mm, and the mean water deficit is 298.4 mm. The water deficit is severe, especially during spring droughts, but is also a problem in autumn and winter.
Subregion II is located in the south of subregion I. Due to gully erosion, the cultivated land is mainly small terraces. Erosion around the terraces is severe, and the soil type is mainly silt loam. During the growth period of winter wheat, the mean precipitation is 229.1 mm, the mean evapotranspiration is 481.5 mm, and the mean water deficit is 202.4 mm. The precipitation self-sufficiency rate is low in spring, and the drought is relatively serious.
Subregion III is located in the southeast end of subregion II and to the east of River Jing, a tributary of River Wei. The soil type here is mainly silt clay loam, and the cultivated land is mainly tableland eroded by rivers or gullies. The area of the single tableland is relatively large. During the growth period of winter wheat, the mean precipitation is 216.1 mm, the mean evapotranspiration is 480.1 mm, and the mean water deficit is 264.0 mm. The rainfall is less than that in subregion II, and thus, the water deficit is more severe than that in subregion II.
Subregion IV is located in the southwest end of subregion II and to the west of River Jing. The soil type is mainly silt clay loam, and the land is mainly divided into the platform. The cultivated land condition is similar to that of subregion III. The area of the single tableland is relatively large. During the growth period of winter wheat, the mean precipitation is 256.8 mm, the mean evapotranspiration is 402.4 mm, and the mean water deficit is 145.6 mm. The rainfall here is notably heavier than that in the other three subregions, although the water deficit is still severe.

3.2. Trend Yield and Meteorological Yield of Winter Wheat in Typical Counties

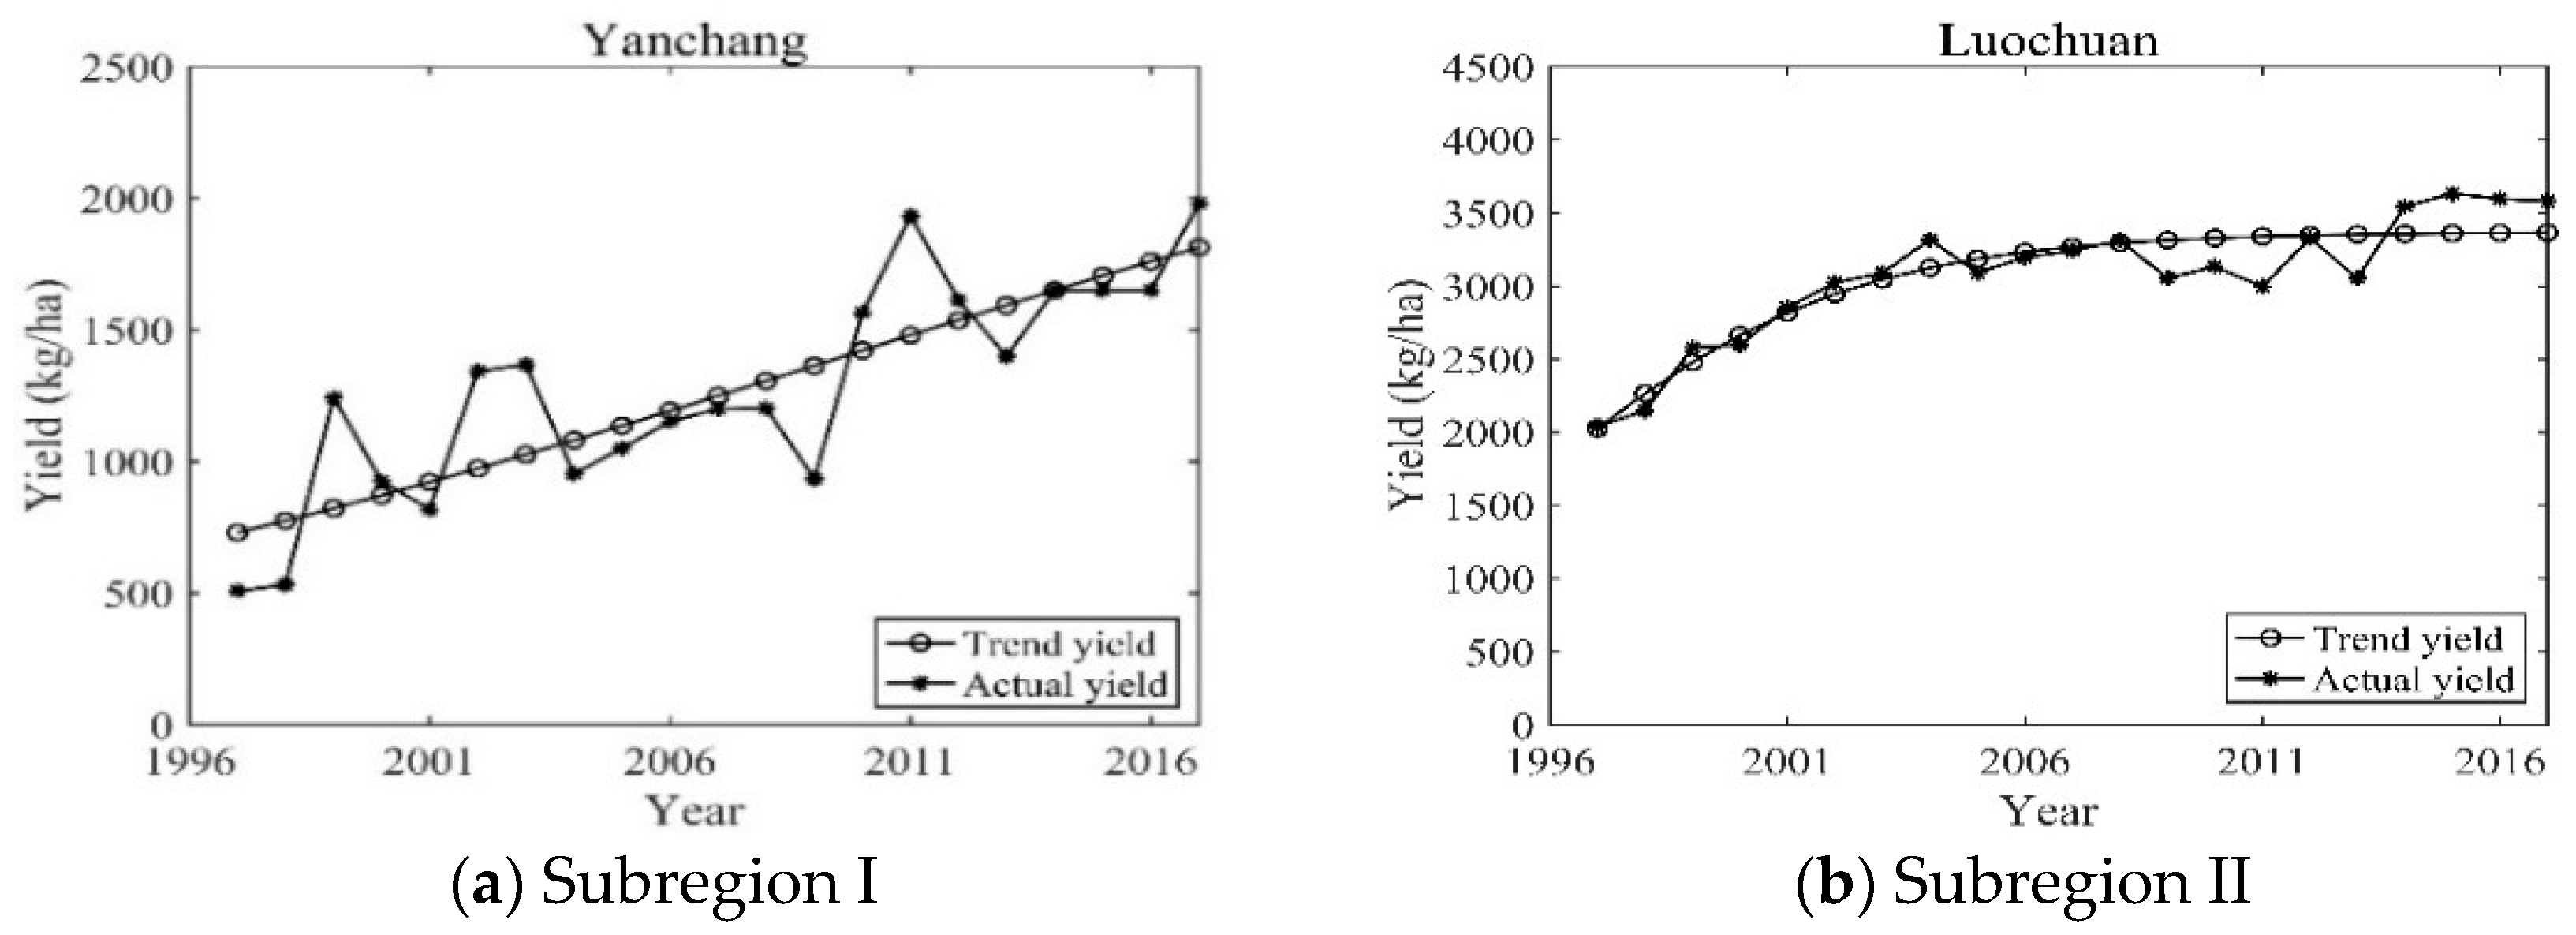
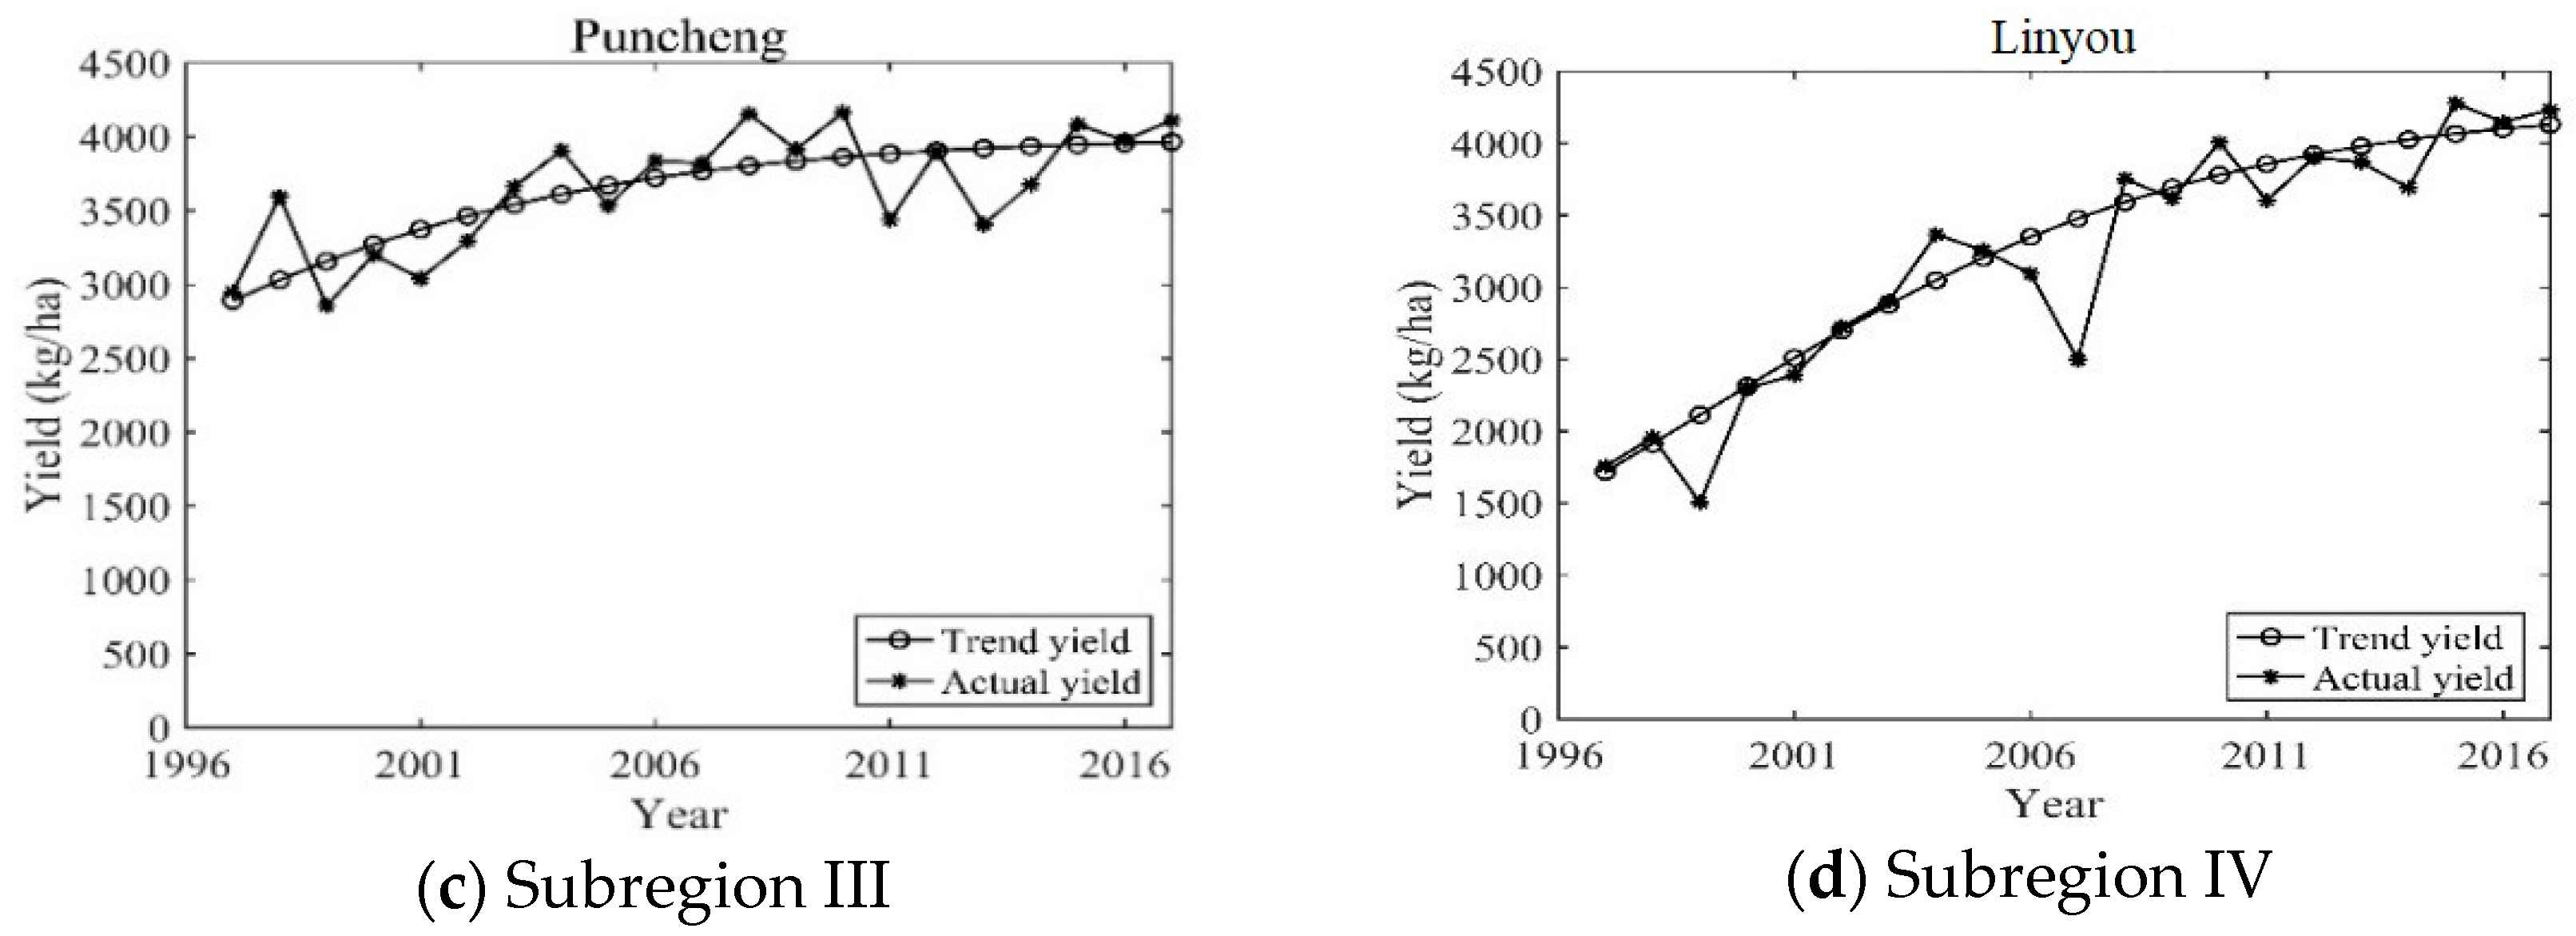
To reduce the amount of data to process, typical counties (Yanchang, Luochuan, Pucheng, and Linyou) with a large dry land area and suitable location were selected for study in subregions I, II, III, and IV, respectively. Using the yield data of winter wheat from 1997 to 2017 in typical counties of each subregion, the logistic equation mentioned in Section 2.1 was used to fit the trend yield of winter wheat in different typical counties. Trend yield and actual yield are shown in Figure 3.
In the past 20 years, the yield per unit area of winter wheat in each subregion showed an upward trend (Figure 3). The average growth rate per annum of yield per unit area of winter wheat in subregion I was the largest (7.04%), followed by the growth rates of subregions IV, II, and III (4.49%, 2.86%, and 1.68%, respectively). The change in the trend yield of winter wheat in each subregion was basically the same as that of the corresponding unit area yield. By comparing the average fluctuation range of the relative meteorological yield ( y w / y t ) in each subregion, it was found that the average fluctuation range of subregion I was the largest, with a value 16.38%, and that of subregions II, III, and IV were 4.26%, 5.94%, and 6.08%, respectively.
Notably, trend yields reflect changes in winter wheat yields, due to increased productivity over the long term. If the trend yield is overfitted with the actual yield, it is easy to exaggerate the impact of productivity levels on yield growth and ignore the impact of climate change on yields.

3.3. Optimum Irrigation Period of Winter Wheat

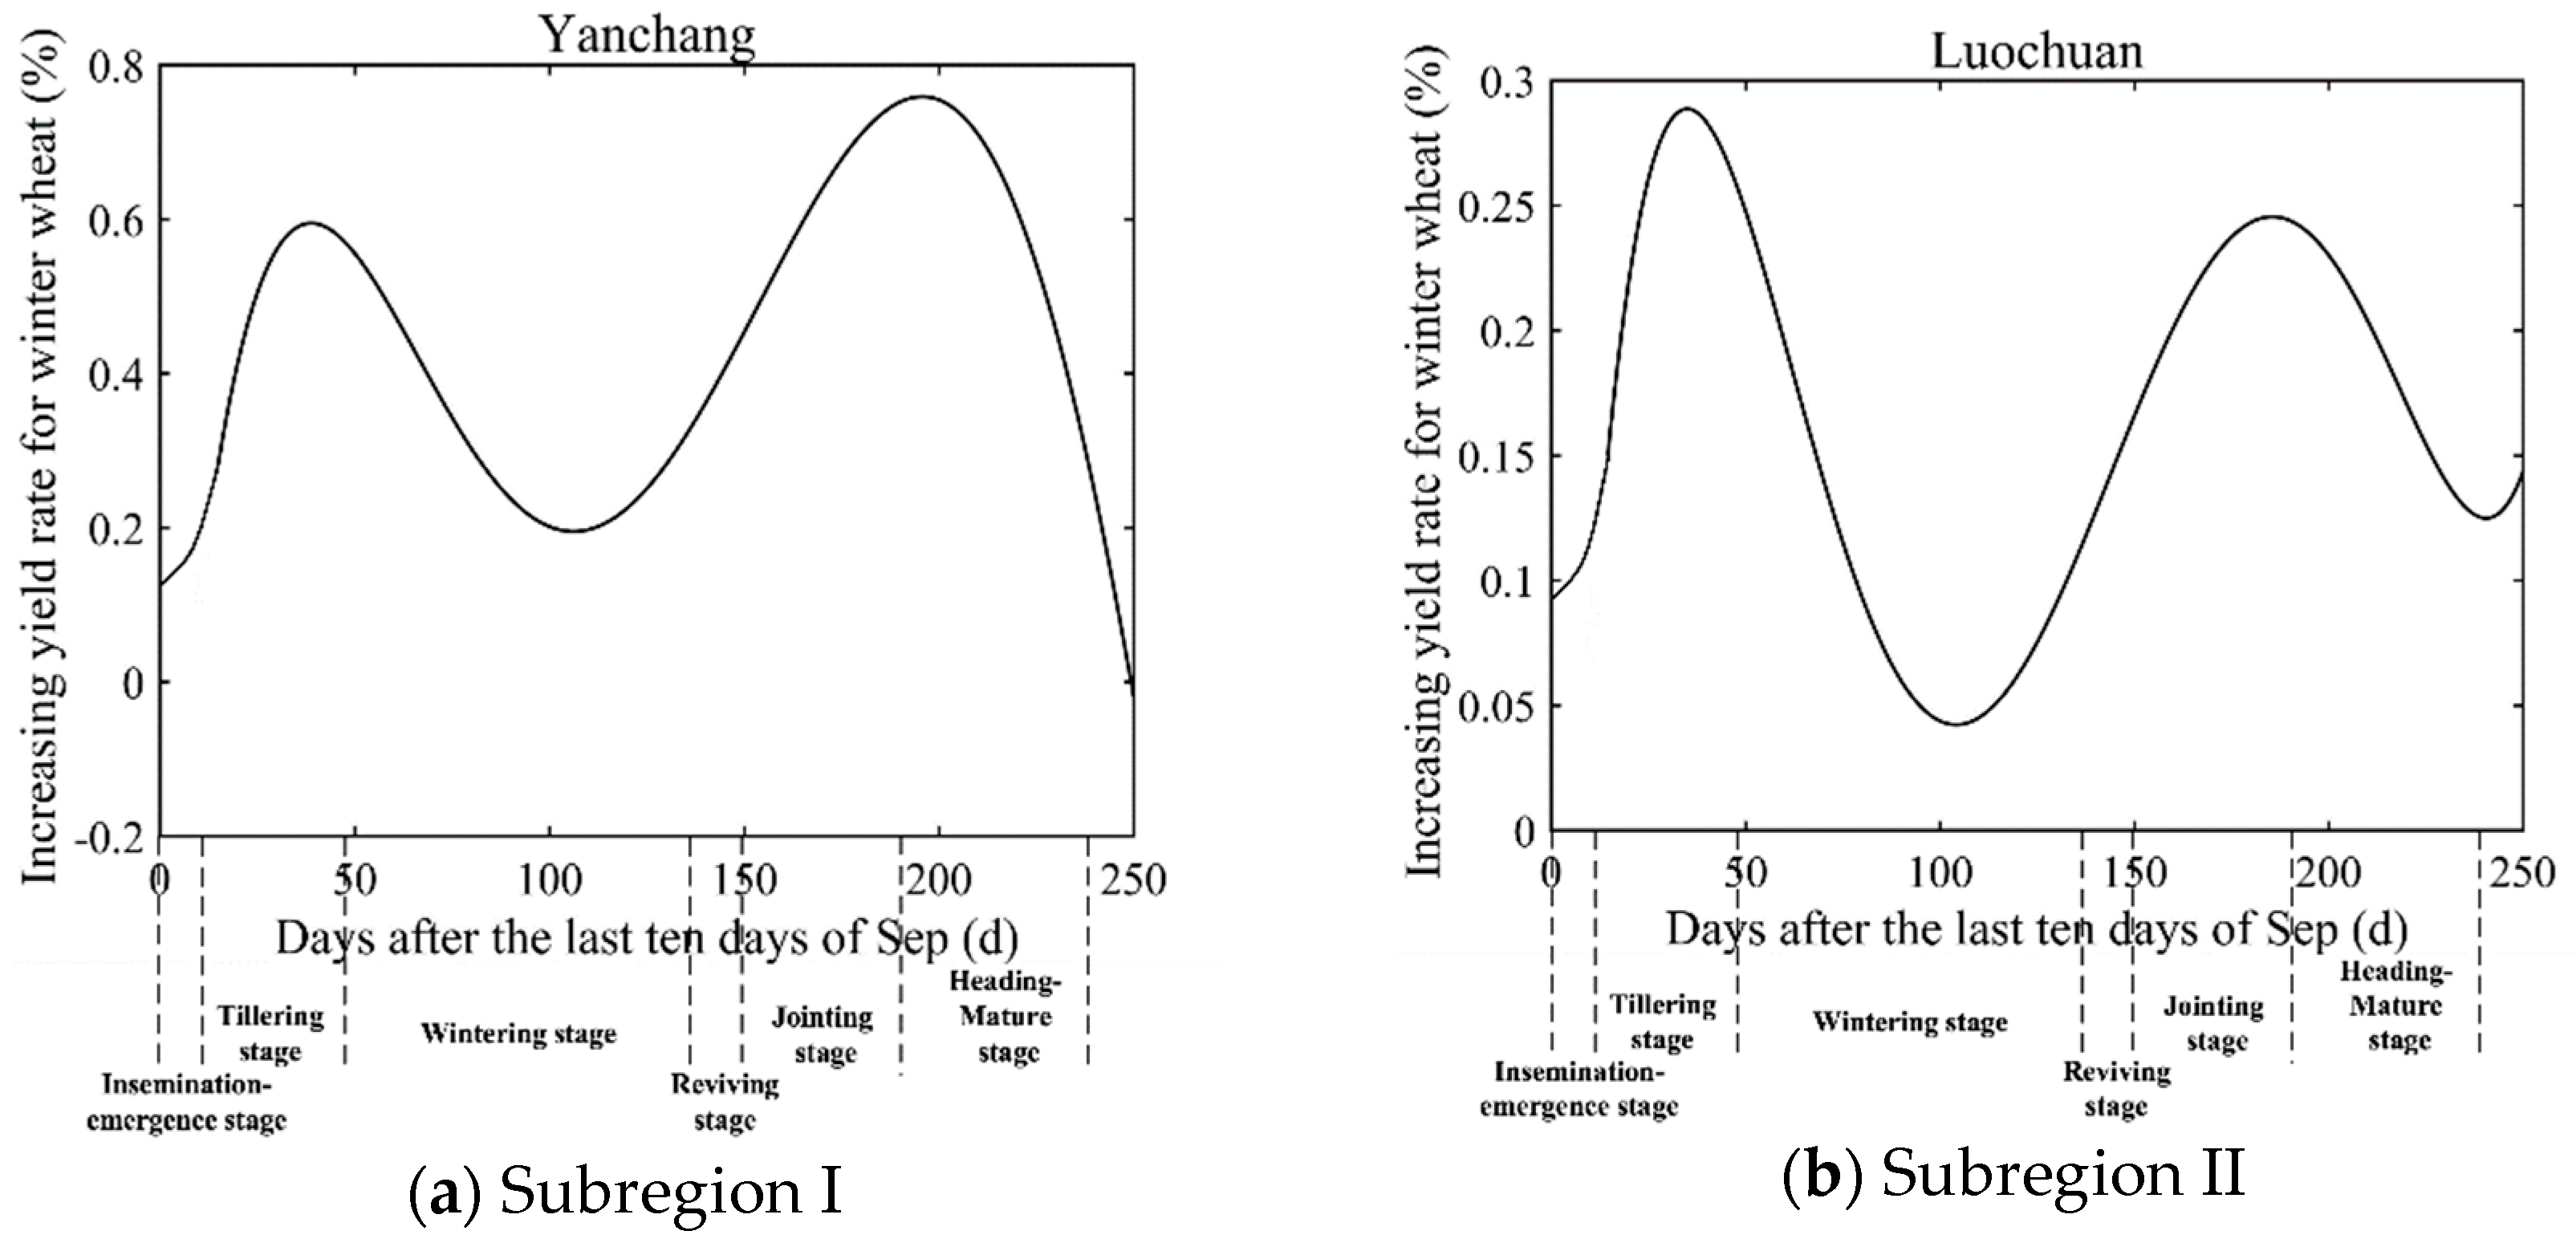
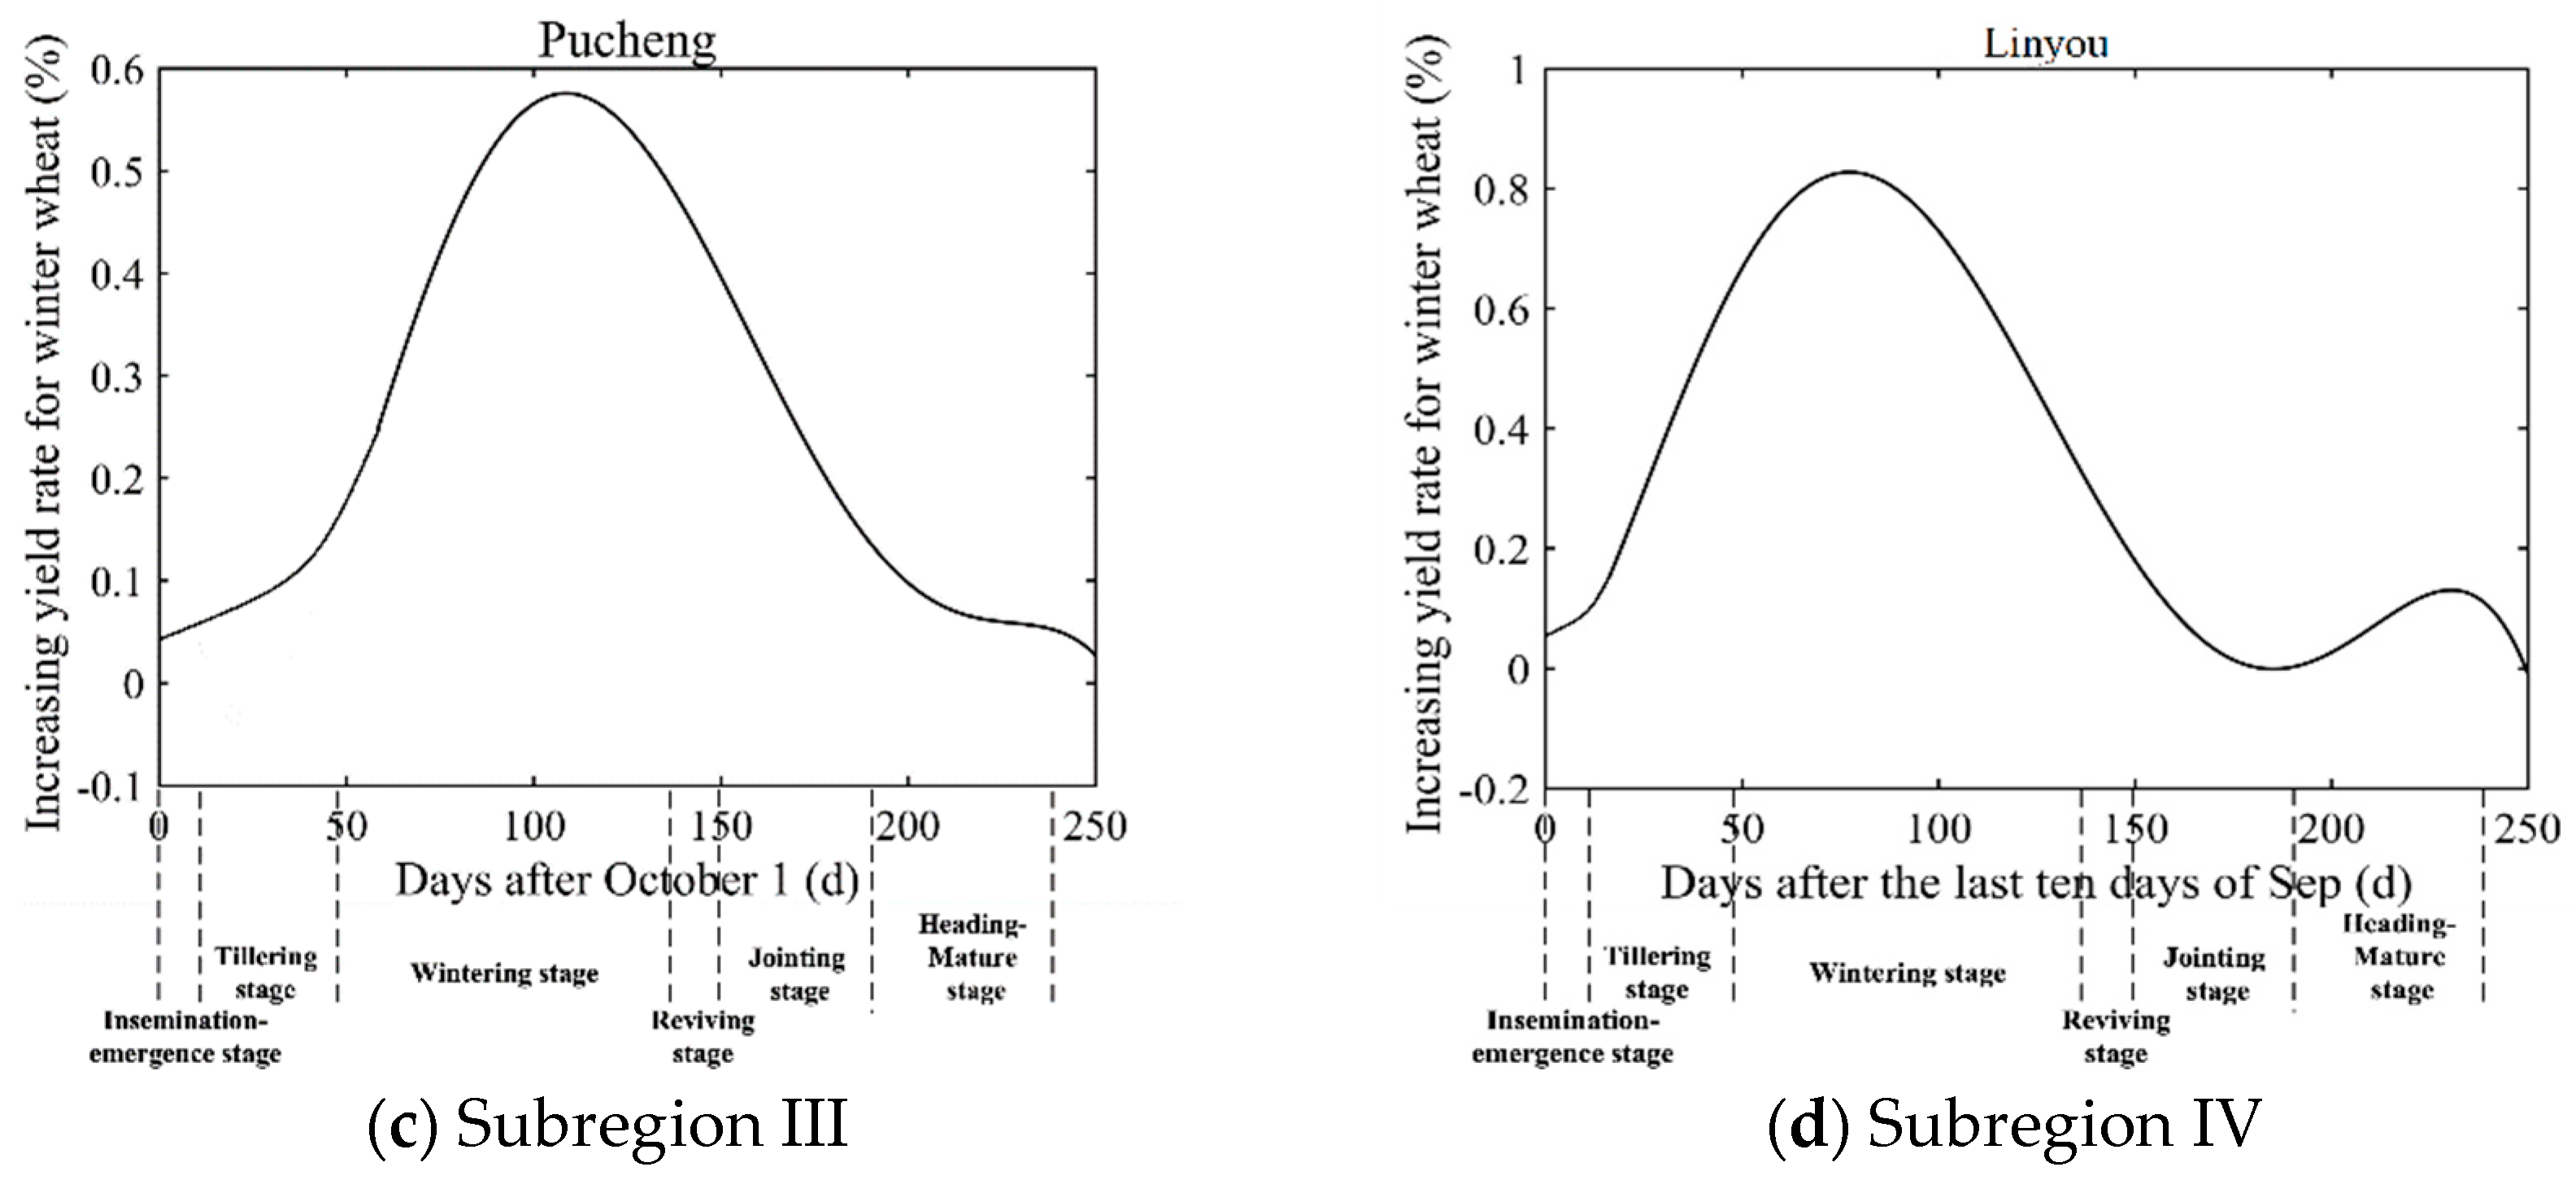
The precipitation–meteorological yield integral regression function was calculated using the winter wheat yield and precipitation data of these typical counties from 1997 to 2017. The effect of “additional” precipitation at different growth stages on yield is shown in Figure 4.
Figure 4a indicates that the precipitation–meteorological yield integrated regression function of winter wheat in subregion I shows a bimodal function. The peak value of the integral regression function appeared in the 40th to 50th days and in the 190th to 200th days after sowing, which were during the tillering and jointing stages, respectively. For every additional 1 mm rainfall increase during these two periods, the yield of winter wheat would increase by 0.6% and 0.8%, respectively. Therefore, irrigation should be conducted during these two periods.
As in subregion I, the precipitation–meteorological yield integrated regression function in subregion II shows a bimodal function (Figure 4b), and the integrated regression function also reaches its peak value in the 40th to 50th days and in the 190th to 200th days after sowing. Especially during the jointing stage, a strong evaporation capacity and frequent dry, hot wind, together with severe air and soil drought, resulting in serious water shortage, impeding winter wheat growth. Therefore, to improve the yield of winter wheat, irrigation should be performed during the tillering and jointing stages.
The amount of precipitation in subregion III is minimal, and the evaporation is large; it is another serious arid area next to subregion I. Therefore, precipitation has a greater impact on winter wheat yield. Moreover, subregion III is a summer maize–winter wheat rotation area, with poorly hydrated soil and water conservation characteristics, resulting in poor water conditions for winter wheat growth during the winter. The final precipitation–meteorological yield integral regression function shows a unimodal function (Figure 4c). The overwintering period is the sensitive period of water demand for winter wheat. From the 100th to 120th day after sowing, the yield of winter wheat can be increased by 0.6% for every additional 1 mm of precipitation. Therefore, irrigation should be performed during the winter wheat overwintering period.
The precipitation in the growth period of winter wheat in subregion IV is large, and the precipitation–meteorological yield integral regression function shows a bimodal function (Figure 4d). The maximum value of the integral regression function appeared in the 70th to 80th days after sowing. During this period, wheat enters the overwintering period, and an increase of precipitation is conducive to ensuring safe overwintering. Therefore, while irrigation is key to increasing wheat yield during this period, the temperature should be closely noted during winter irrigation, and it should be completed before freezing.

3.4. Discussion

In order to further analyze the reliability of the research results, the irrigation date determined by the study was compared with the actual local situation. From the research results, the reasonable irrigation of subregion I and II is mainly at the beginning of November and April. The irrigation of subregion I at the beginning of April is more important than that of the beginning of November of the previous year, while subregion II is the opposite. This is because the water shortage in the growth period accounts for 3/5 of the total water requirement, and the annual change is large. The precipitation in most years can not meet the water requirement of wheat growth. The water shortage stages are mainly in the seedling stage and the filling stage. Precipitation during the seedling period (from tillering to jointing) continued to decrease from July and August in the rainy season, which was very unfavorable for the development of tillering and jointing. From the perspective of precipitation in the growth period, July and August are rainy seasons, with relatively large rainfall. The water requirement for wheat seedling can be basically guaranteed, while the rainfall in early November and early April of the next year is not guaranteed. Therefore, irrigation should be carried out during these two stages. By comparing the effects of irrigation in winter and spring, it can be found that the effect of irrigation in spring on winter wheat yield in subregion I is more significant, while that in subregion II is the opposite, which may be due to the more drought in subregion I and the serious water shortage in jointing stage of winter wheat.
According to the research results, subregion III and subregion IV should be irrigated at the beginning of December or the beginning of January of the next year. This is because winter irrigation can promote the growth of tillering, the growth of roots, and meet the water demand of initial wheatear development. Timely winter irrigation can stabilize the ground temperature, reduce the temperature difference between day and night, and play an important role in cold prevention and seedling protection. From March to May of the next year, the precipitation in these two subregions is higher than that in subregions I and II, so irrigation is generally not required. Compared with the reasonable irrigation in winter in subregion III and subregion IV, it can be seen that the period of irrigation in subregion IV is relatively early, which may be due to the fact that subregion IV is in the west of subregion III, the temperature in winter is lower than that in subregion III, and if the irrigation period is late, it is easy to cause freezing on the surface of soil in the coldest January, and then cause freezing damage to winter wheat. The above analysis results are basically consistent with local farmers’ agricultural proverbs and irrigation habits of local farmers, and can be used to guide the irrigation of local winter wheat [23,24].
The supplementary effect of precipitation on soil water content is the same as that of irrigation, but the solar radiation value on the rainy day is smaller than that on the non-rainy day, and the temperature is slightly lower than that on the non-rainy day. Therefore, there will be a slight error in the optimal irrigation period determined by this method, but it will not affect the determined optimal irrigation period on the whole.
The method for determining the regional irrigation period proposed in this paper has the advantages of fewer data required, robust and reliable results, and simple and practical, although it is still unable to determine the corresponding exact irrigation amount in each period, there are certain limitations, but considering the fact that the amount of available water for irrigation in many dry areas is limited, only a small amount of available water can be used for irrigation. Therefore, the results of this study have important application value to determine the deficit irrigation period with small amount of water in large regions.

4. Conclusions

Analyzing the optimal period of crop irrigation in large areas is a complex problem. By examining the regional distribution differences of precipitation self-sufficiency rates during the growing period of winter wheat in Shaanxi Province, the regional variation of precipitation–meteorological yield integral regression function was studied and the effect of precipitation on winter wheat yield at different periods was discussed. Finally, the optimal irrigation period for winter wheat was determined. The main conclusions of this study are as follows:
(1)
Compared with the optimal irrigation period determined by the previous small area experiment, the method proposed in this study has the advantages of small workload and strong timeliness. It can overcome the shortcomings of the previous test method that the result is not stable, due to the small test area and the lack of representativeness.
(2)
The irrigation periods of winter wheat in subregions I and II are the overwintering and jointing periods, the irrigation period in subregion III is in the middle of the overwintering period, and the irrigation period in subregion IV is the early overwintering period, which is basically consistent with irrigation habits of local farmers, and can be used to guide the irrigation of local winter wheat. It also demonstrates that the method proposed in this paper has important application value in determining the deficit irrigation period with small water amount, in a large region lacking in research materials.

Author Contributions

Conceptualization, Y.W., T.Y. and X.M.; Data curation, Y.W., R.Z. and X.M.; Methodology, Y.W., T.Y. and K.J.; Writing—original draft, Y.W.; Writing—review and editing, X.M.

Funding

This research was funded by the Special Fund for Agro-scientific and Research in the Public Interest of China (201503124) and the National Natural Science Foundation of China (51279167).

Conflicts of Interest

The authors declare no conflicts of interest.

References

  1. FAO. Aquastat Database. 2015. Available online: http://www.fao.org/nr/water/aquastat/main/index.stm (accessed on 22 April 2015).
  2. Huang, J.; Li, Y.; Fu, C.; Chen, F.; Fu, Q.; Dai, A.; Shinoda, M.; Ma, Z.; Guo, W.; Li, Z.; et al. Dryland Climate Change: Recent Progress and Challenges. Rev. Geophys. 2017, 55, 719–778. [Google Scholar] [CrossRef]
  3. Burney, J.A.; Naylor, R.L.; Postel, S.L. The Case for Distributed Irrigation as a Development Priority in Sub-Saharan Africa. Proc. Natl. Acad. Sci. USA 2013, 110, 12513–12517. [Google Scholar] [CrossRef] [PubMed]
  4. FAO. Kenya Brief: Global Information and Early Warning System. 2017. Available online: http://www.fao.org/giews/countrybrief/country.jsp?Code=KEN/main/index.stm (accessed on 29 July 2017).
  5. Dile, Y.T.; Karlberg, L.; Temesgen, M.; Rockstrom, J. The Role of Water Harvesting to Achieve Sustainable Agricultural Intensification and Resilience against Water Related Shocks in Sub-Saharan Africa. Agric. Ecosyst. Environ. 2013, 181, 69–79. [Google Scholar] [CrossRef]
  6. Zhao, X.N.; Wu, P.T.; Feng, H.; Wang, Y.K.; Shao, H.B. Towards Development of Eco-Agriculture of Rainwater-Harvesting for Supplemental Irrigation in the Semi-Arid Loess Plateau of China. J. Agron. Crop Sci. 2009, 195, 399–407. [Google Scholar] [CrossRef]
  7. Baguma, D.; Loiskandl, W. Rainwater Harvesting Technologies and Practises in Rural Uganda: A Case Study. Mitig. Adapt. Strateg. Glob. Chang. 2010, 15, 355–369. [Google Scholar] [CrossRef]
  8. Freni, G.; Liuzzo, L. Effectiveness of Rainwater Harvesting Systems for Flood Reduction in Residential Urban Areas. Water 2019, 11, 1389. [Google Scholar] [CrossRef]
  9. Adekalu, K.O. Adapting Crop-Yield Models to Irrigation Scheduling in Nigeria. Food Rev. Int. 2004, 20, 309–328. [Google Scholar] [CrossRef]
  10. Jones, H.G. Irrigation Scheduling: Advantages and Pitfalls of Plant-Based Methods. J. Exp. Bot. 2004, 55, 2427–2436. [Google Scholar] [CrossRef] [PubMed]
  11. Neupane, J.; Guo, W.X. Agronomic Basis and Strategies for Precision Water Management: A Review. Agron. Basel 2019, 9, 21. [Google Scholar] [CrossRef]
  12. Roy, P.C.; Guber, A.; Abouali, M.; Nejadhashemi, A.P.; Deb, K.; Smucker, A.J.M. Crop Yield Simulation Optimization Using Precision Irrigation and Subsurface Water Retention Technology. Environ. Model. Softw. 2019, 119, 433–444. [Google Scholar] [CrossRef]
  13. Kropp, I.; Nejadhashemi, A.P.; Deb, K.; Abouali, M.; Roy, P.C.; Adhikari, U.; Hoogenboom, G. A Multi-Objective Approach to Water and Nutrient Efficiency for Sustainable Agricultural Intensification. Agric. Syst. 2019, 173, 289–302. [Google Scholar] [CrossRef]
  14. Li, F.W.; Yu, D.; Zhao, Y. Irrigation Scheduling Optimization for Cotton Based on the Aquacrop Model. Water Resour. Manag. 2019, 33, 39–55. [Google Scholar] [CrossRef]
  15. Boughton, W.; Droop, O. Continuous Simulation for Design Flood Estimation—A Review. Environ. Model. Softw. 2003, 18, 309–318. [Google Scholar] [CrossRef]
  16. Pham, M.T.; Vernieuwe, H.; De Baets, B.; Willems, P.; Verhoest, N.E.C. Stochastic Simulation of Precipitation-Consistent Daily Reference Evapotranspiration Using Vine Copulas. Stoch. Environ. Res. Risk Assess. 2016, 30, 2197–2214. [Google Scholar] [CrossRef]
  17. Cho, J.; Shin, C.M.; Choi, H.K.; Kim, K.H.; Choi, J.Y. Development of an Integrated Method for Long-Term Water Quality Prediction Using Seasonal Climate Forecast. Proc. Int. Assoc. Hydrol. Sci. 2016, 374, 175–185. [Google Scholar] [CrossRef]
  18. Pei, S.X.; Guo, Q.S.; Jia, Y.B.; Xin, X.B.; Ge-Xi, X.U. Integral Regressive Analysis on the Responses of First Flowering Date of Eight Woody Species to Climate Change in Baoding, China. J. Beijing For. Univ. 2015. [Google Scholar] [CrossRef]
  19. Deng, Z.Y.; Yin, X.Z.; Yin, D.; Yang, Q.G.; Zhu, G.Q.; Liu, M.C. Study on Eco-Climatic Applicability of Angelica Sinensis. China J. Chin. Mater. Med. 2005, 30, 889. [Google Scholar]
  20. Gu, J.X.; Yuan, M.X.; Liu, J.X.; Hao, Y.X.; Zhou, Y.T.; Qu, D.; Yang, X.Y. Trade-Off between Soil Organic Carbon Sequestration and Nitrous Oxide Emissions Fromwinter Wheat-Summer Maize Rotations: Implications of a 25-Year Fertilization Experiment in Northwestern China. Sci. Total Environ. 2017, 595, 371–379. [Google Scholar] [CrossRef] [PubMed]
  21. Workneh, F.; O’Shaughnessy, S.; Evett, S.; Rush, C.M. Relationships between Early Wheat Streak Mosaic Severity Levels and Grain Yield: Implications for Management Decisions. Plant Dis. 2017, 101, 1621–1626. [Google Scholar] [CrossRef] [PubMed]
  22. Jaleta, M.; Hodson, D.; Abeyo, B.; Yirga, C.; Erenstein, O. Smallholders’ Coping Mechanisms with Wheat Rust Epidemics: Lessons from Ethiopia. PLoS ONE 2019, 14, e0219327. [Google Scholar] [CrossRef] [PubMed] [Green Version]
  23. Wu, S.R.; Jia, X.T. Agricultural Resources Survey and Agricultural Regional Reporting Collection of Luochuan County, Shaanxi Province; Xi’an Map press: Xi’an, China, 1985; pp. 200–202. [Google Scholar]
  24. Su, F.C. Planting Resources and Zoning in Shaanxi Province; Shaanxi Science and Technology Press: Xi’an, China, 1986; pp. 322–374. [Google Scholar]
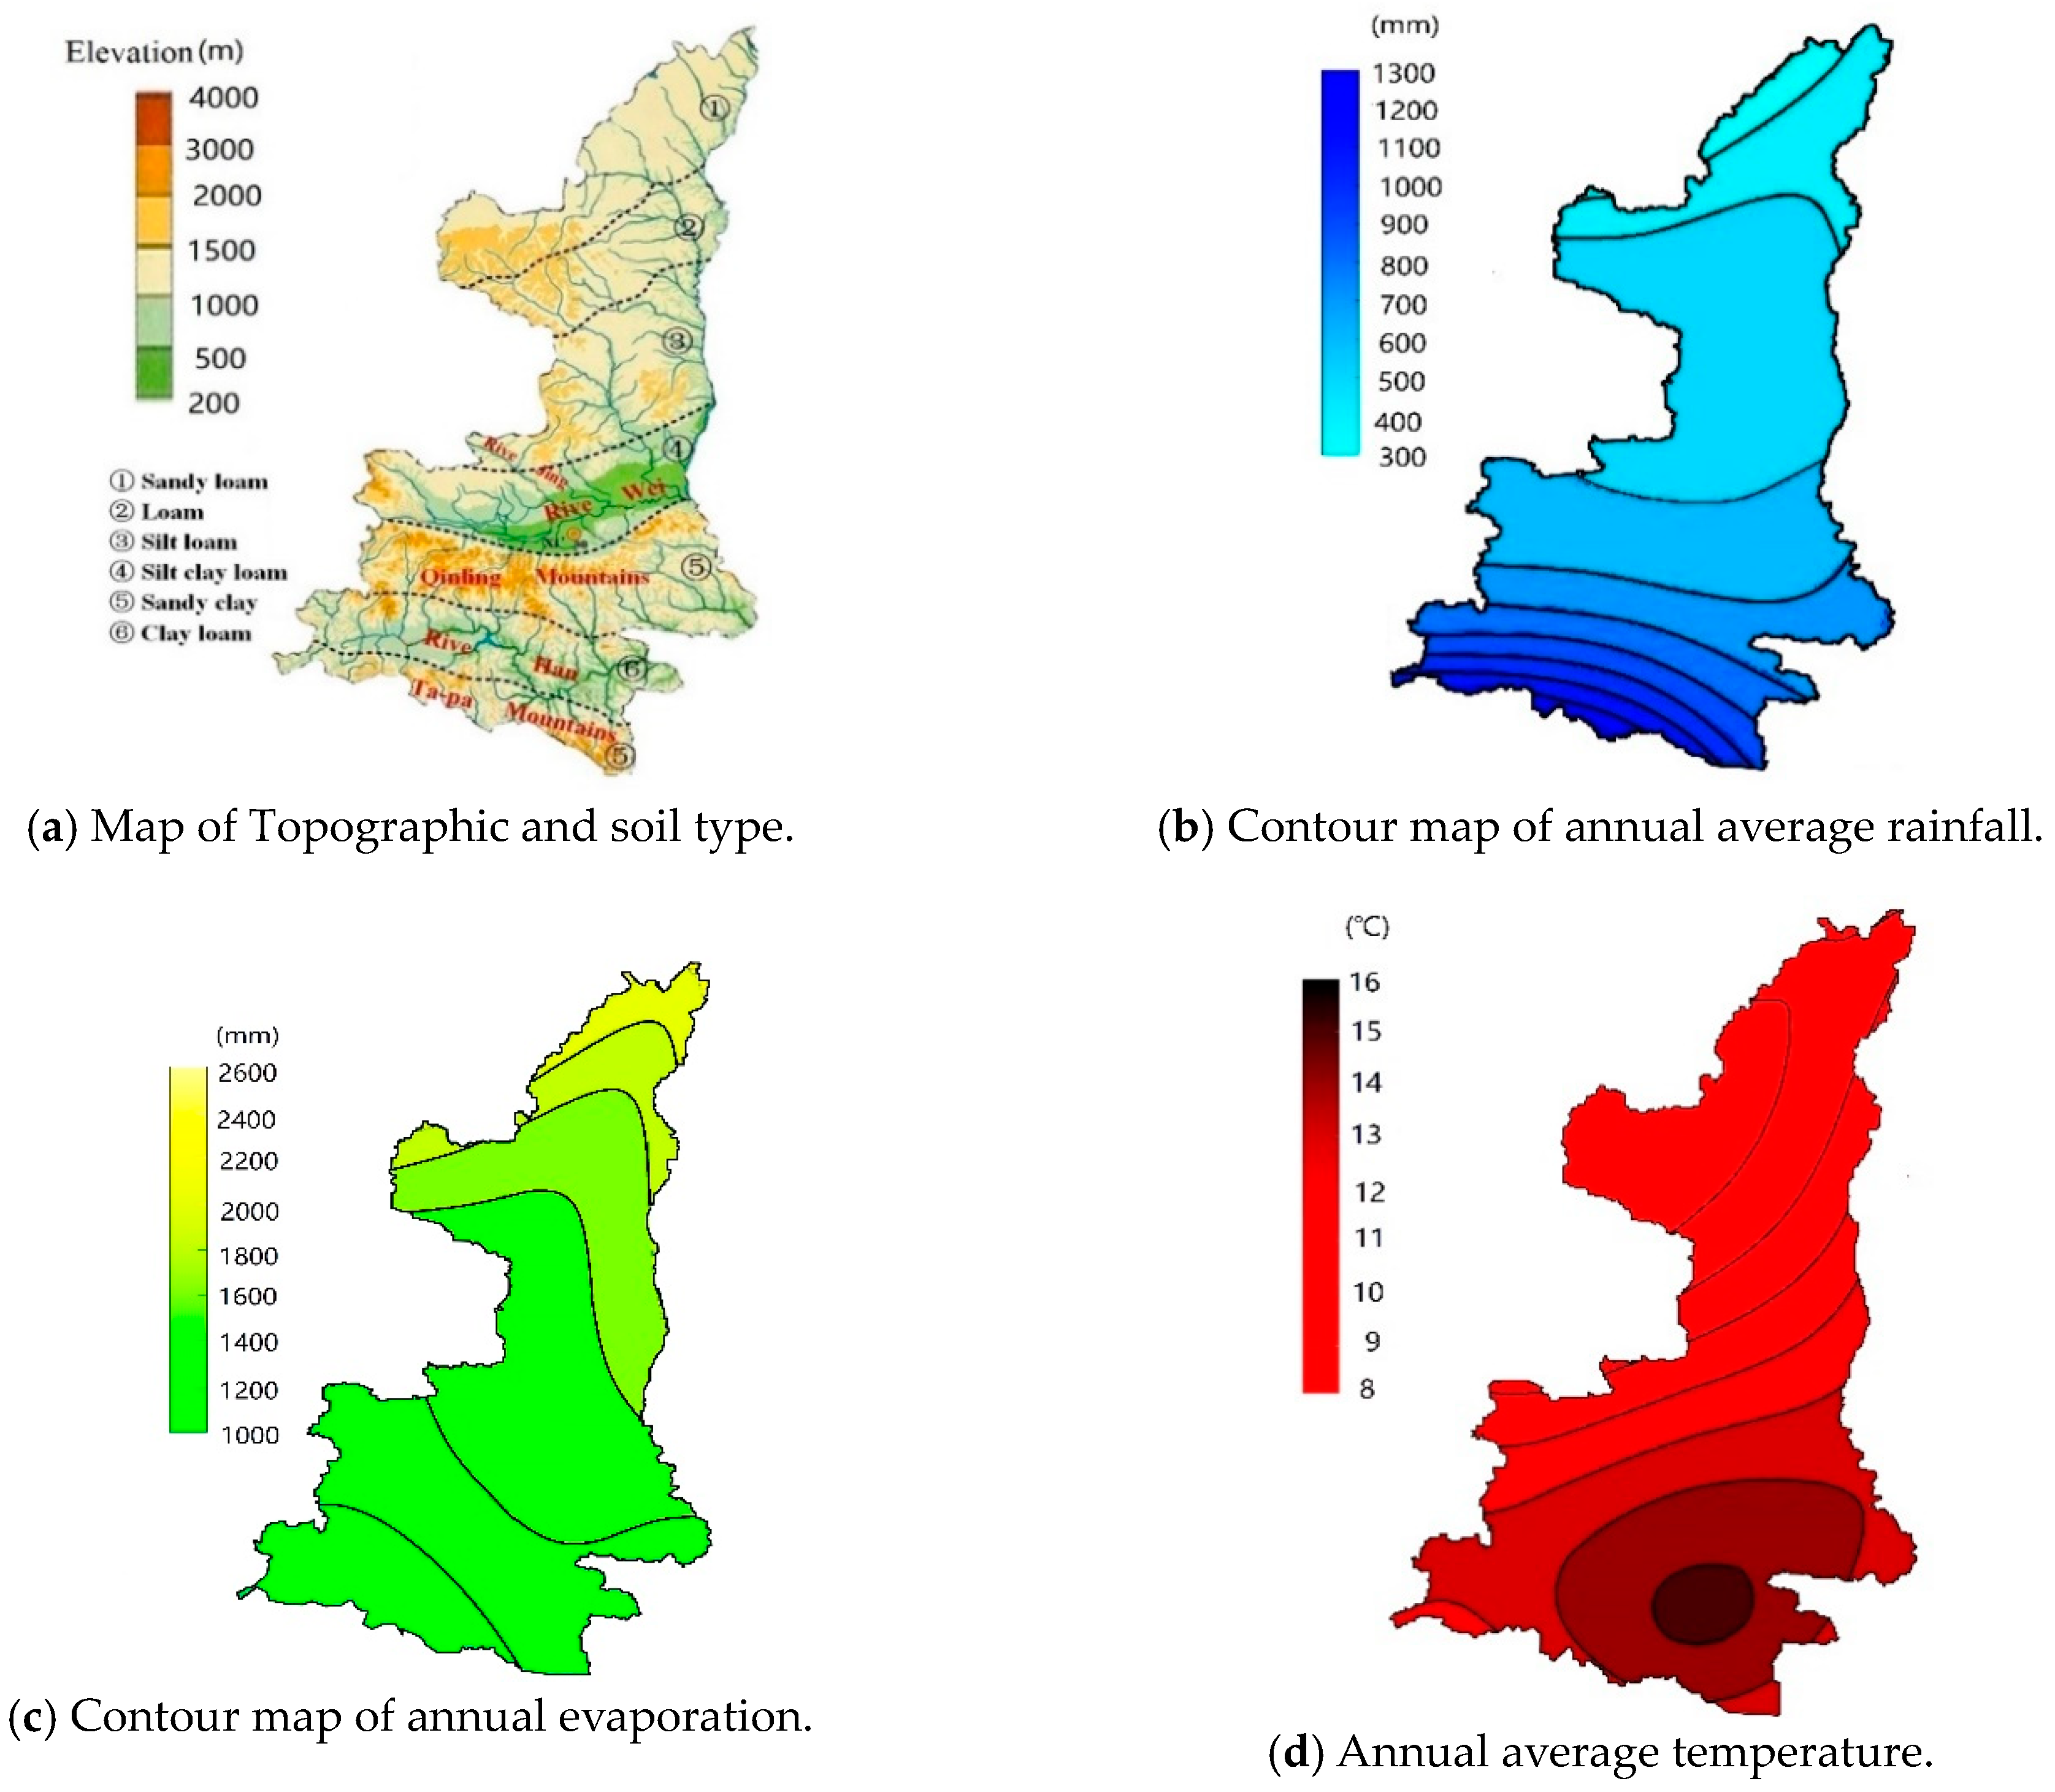
Figure 1. Characteristics of topography, soil, precipitation, evaporation, and temperature in Shaanxi Province.
Applsci 09 05181 g001
Figure 2. Water supply and demand division map of the winter wheat growth period in Shaanxi.
Applsci 09 05181 g002
Figure 3. Comparison of actual yield and a trend yield of winter wheat.
Applsci 09 05181 g003aApplsci 09 05181 g003b
Figure 4. The effect of each additional 1 mm of precipitation on wheat yield.
Applsci 09 05181 g004aApplsci 09 05181 g004b
Table 1. Water supply and demand characteristics of winter wheat in different regions.
SubregionPrecipitation/Evapotranspiration (%)Evapotrans-Piration (mm)Precipitation (mm)Water Deficit (mm)
OctNovDecJanFebMarAprMayThe First 10 Days of Jun
I68.868.790.332.840.430.331.420.449.4485.8187.4298.4
II80.681.541.926.252.746.051.434.963.1481.5229.1202.4
III92.562.725.010.930.925.242.139.550.2480.1216.1264.0
IV141.092.924.525.141.738.755.063.793.9402.4256.8145.6