Article

Low-Background Shielding Box for Autoradiography of Environmental Samples and the α-, β-, and γ-ray Sensitivities of the Imaging Plates

1
Graduate School of Engineering, Hiroshima University, Higashi-Hiroshima, Hiroshima 739-8527, Japan
2
Global Career Design Center, Hiroshima University, Higashi-Hiroshima, Hiroshima 739-8521, Japan
*
Author to whom correspondence should be addressed.
Present Address: Field Science Education and Research Center, Kyoto University, Kitashirakawa-oiwakecho, Sakyoku, Kyoto 606-8502, Japan.
Appl. Sci. 2019, 9(23), 5209; https://doi.org/10.3390/app9235209
Submission received: 24 October 2019 / Revised: 21 November 2019 / Accepted: 26 November 2019 / Published: 29 November 2019
(This article belongs to the Section Environmental Sciences)

Abstract

:

Featured Application

A large low-background shielding box is developed for the autoradiography of environmental samples. The sensitivity of the imaging plate to α-, β-, and γ-rays indicates that most images of environmental samples originate from α- or β-rays, not from γ-rays. This information is helpful in preparing samples for imaging; to that end, we find ideal covering films for samples and show that sample thickness should be thin enough not to reduce the α- or β-rays. The large shielding box is shown to be effective for visualizing the distribution of radionuclides in environmental samples contaminated by nuclear reactor accidents.

Abstract

Autoradiography using imaging plates is a conventional method for the visualization of the distribution of radionuclides. Imaging plates have high sensitivity to the charged particles of α- and β-rays but are also sensitive to γ-rays. When the radioactivity level in the sample is low, a longer exposure time is needed, and shielding of the natural background radiation is necessary. Large imaging plates (e.g., 35 × 40 cm), which can obtain the radioactivity distribution over a wider area, were developed. In this work, a low-background shielding box is developed for large imaging plates, and the shielding characteristics of the box and sensitivities of the imaging plate to α-, β-, and γ-rays are quantitatively investigated. It is shown, by considering the sensitivity of imaging plates to α-, β-, and γ-rays, that most images of environmental samples are the result of α- or β-rays emitted from radionuclides at the sample surface, but not from the whole sample. To exemplify autoradiography using the presented shielding box, some environmental samples contaminated with radioactive fallout from the Fukushima Daiichi Nuclear Power Plant accident are measured. The distribution of radionuclides is clearly visualized and, furthermore, information of the migration of radiocesium in the sample is obtained.

1. Introduction

Many techniques for detecting radiation using scintillators, semiconductors, and position-sensitive detectors were developed. X-ray films are commonly used in medicine to visualize the internal structure of organs in the body and in industry to inspect objects. The mechanism of photostimulated luminescence (PSL) is well documented [1,2,3]. Imaging plates (IPs) and computed radiography were developed by the Fuji Photo Film Co., Ltd. [4,5]. At present, IPs are used in a wide range of fields in both transmission radiography and autoradiography, due to their wide dynamic range, reusability, and high sensitivity.
In transmission radiography, an external high-dose-rate exposure of bremsstrahlung X- or γ-rays is applied over a short exposure time, and a transmission image of the artifact is obtained from scanning the exposed IP. In this case, the artifact itself is not radioactive and external radiation is used. Simpson and La Niece [6] applied X-ray radiography to analyze ancient bimetal swords from western Asia preserved in the British Museum. We used 137Cs and 60Co γ-ray irradiation sources for transmission radiography to inspect ancient bronze swords and reveal the structure of the iron cores inside their bronze hilts [7].
In autoradiography, charged α and β radiation particles emitted from radioactive elements in samples are recorded by the IP, from which two-dimensional information about the radioactivity distribution in the sample is obtained. After the Fukushima Daiichi Nuclear Power Plant (FDNPP) accident in 2011, IPs were used to analyze contaminated plants sampled from the environment [8,9,10], and advanced X-ray microradiography techniques for plant cells were also developed [11]. If the radioactivity level in a sample is low, the required IP exposure time can be one month or even longer. Therefore, a low-background shielding box is necessary to reduce environmental natural radiation.
Low-background shielding was studied extensively for Ge detectors in γ-ray spectrometers [12,13,14], but the shielding of the IP is not enough, as the IP has a high sensitivity to α- and β-rays but a low sensitivity to γ-rays. In the present work, a lead shielding box is designed for a 30 × 40 cm IP, and the sensitivities of the imaging plate to α-, β-, and γ-rays are investigated. The γ-ray to α-ray and γ-ray to β-ray sensitivity ratios are both quantitatively estimated. To demonstrate imaging of environmental samples using the presented shielding box, samples contaminated with radioactive fallout from the Fukushima Daiichi Nuclear Power Plant (FDNPP) accident are measured. The distribution of radionuclides is clearly visualized and, furthermore, information of the migration of radiocesium is obtained.

2. Materials and Methods

2.1. Design of Low-Background Shielding Box for IPs

Image analyzers (Typhoon FLA7000 and 9000, GE Healthcare, Tokyo, Japan) and IPs (BAS-III, Fujifilm, Japan; 20 × 25, 20 × 40, and 35 × 40 cm) were used. The radiation sensitivities of the IPs were measured after exposing them to α-, β-, and γ-ray sources. The radiation sources and characteristics are given in Table 1.
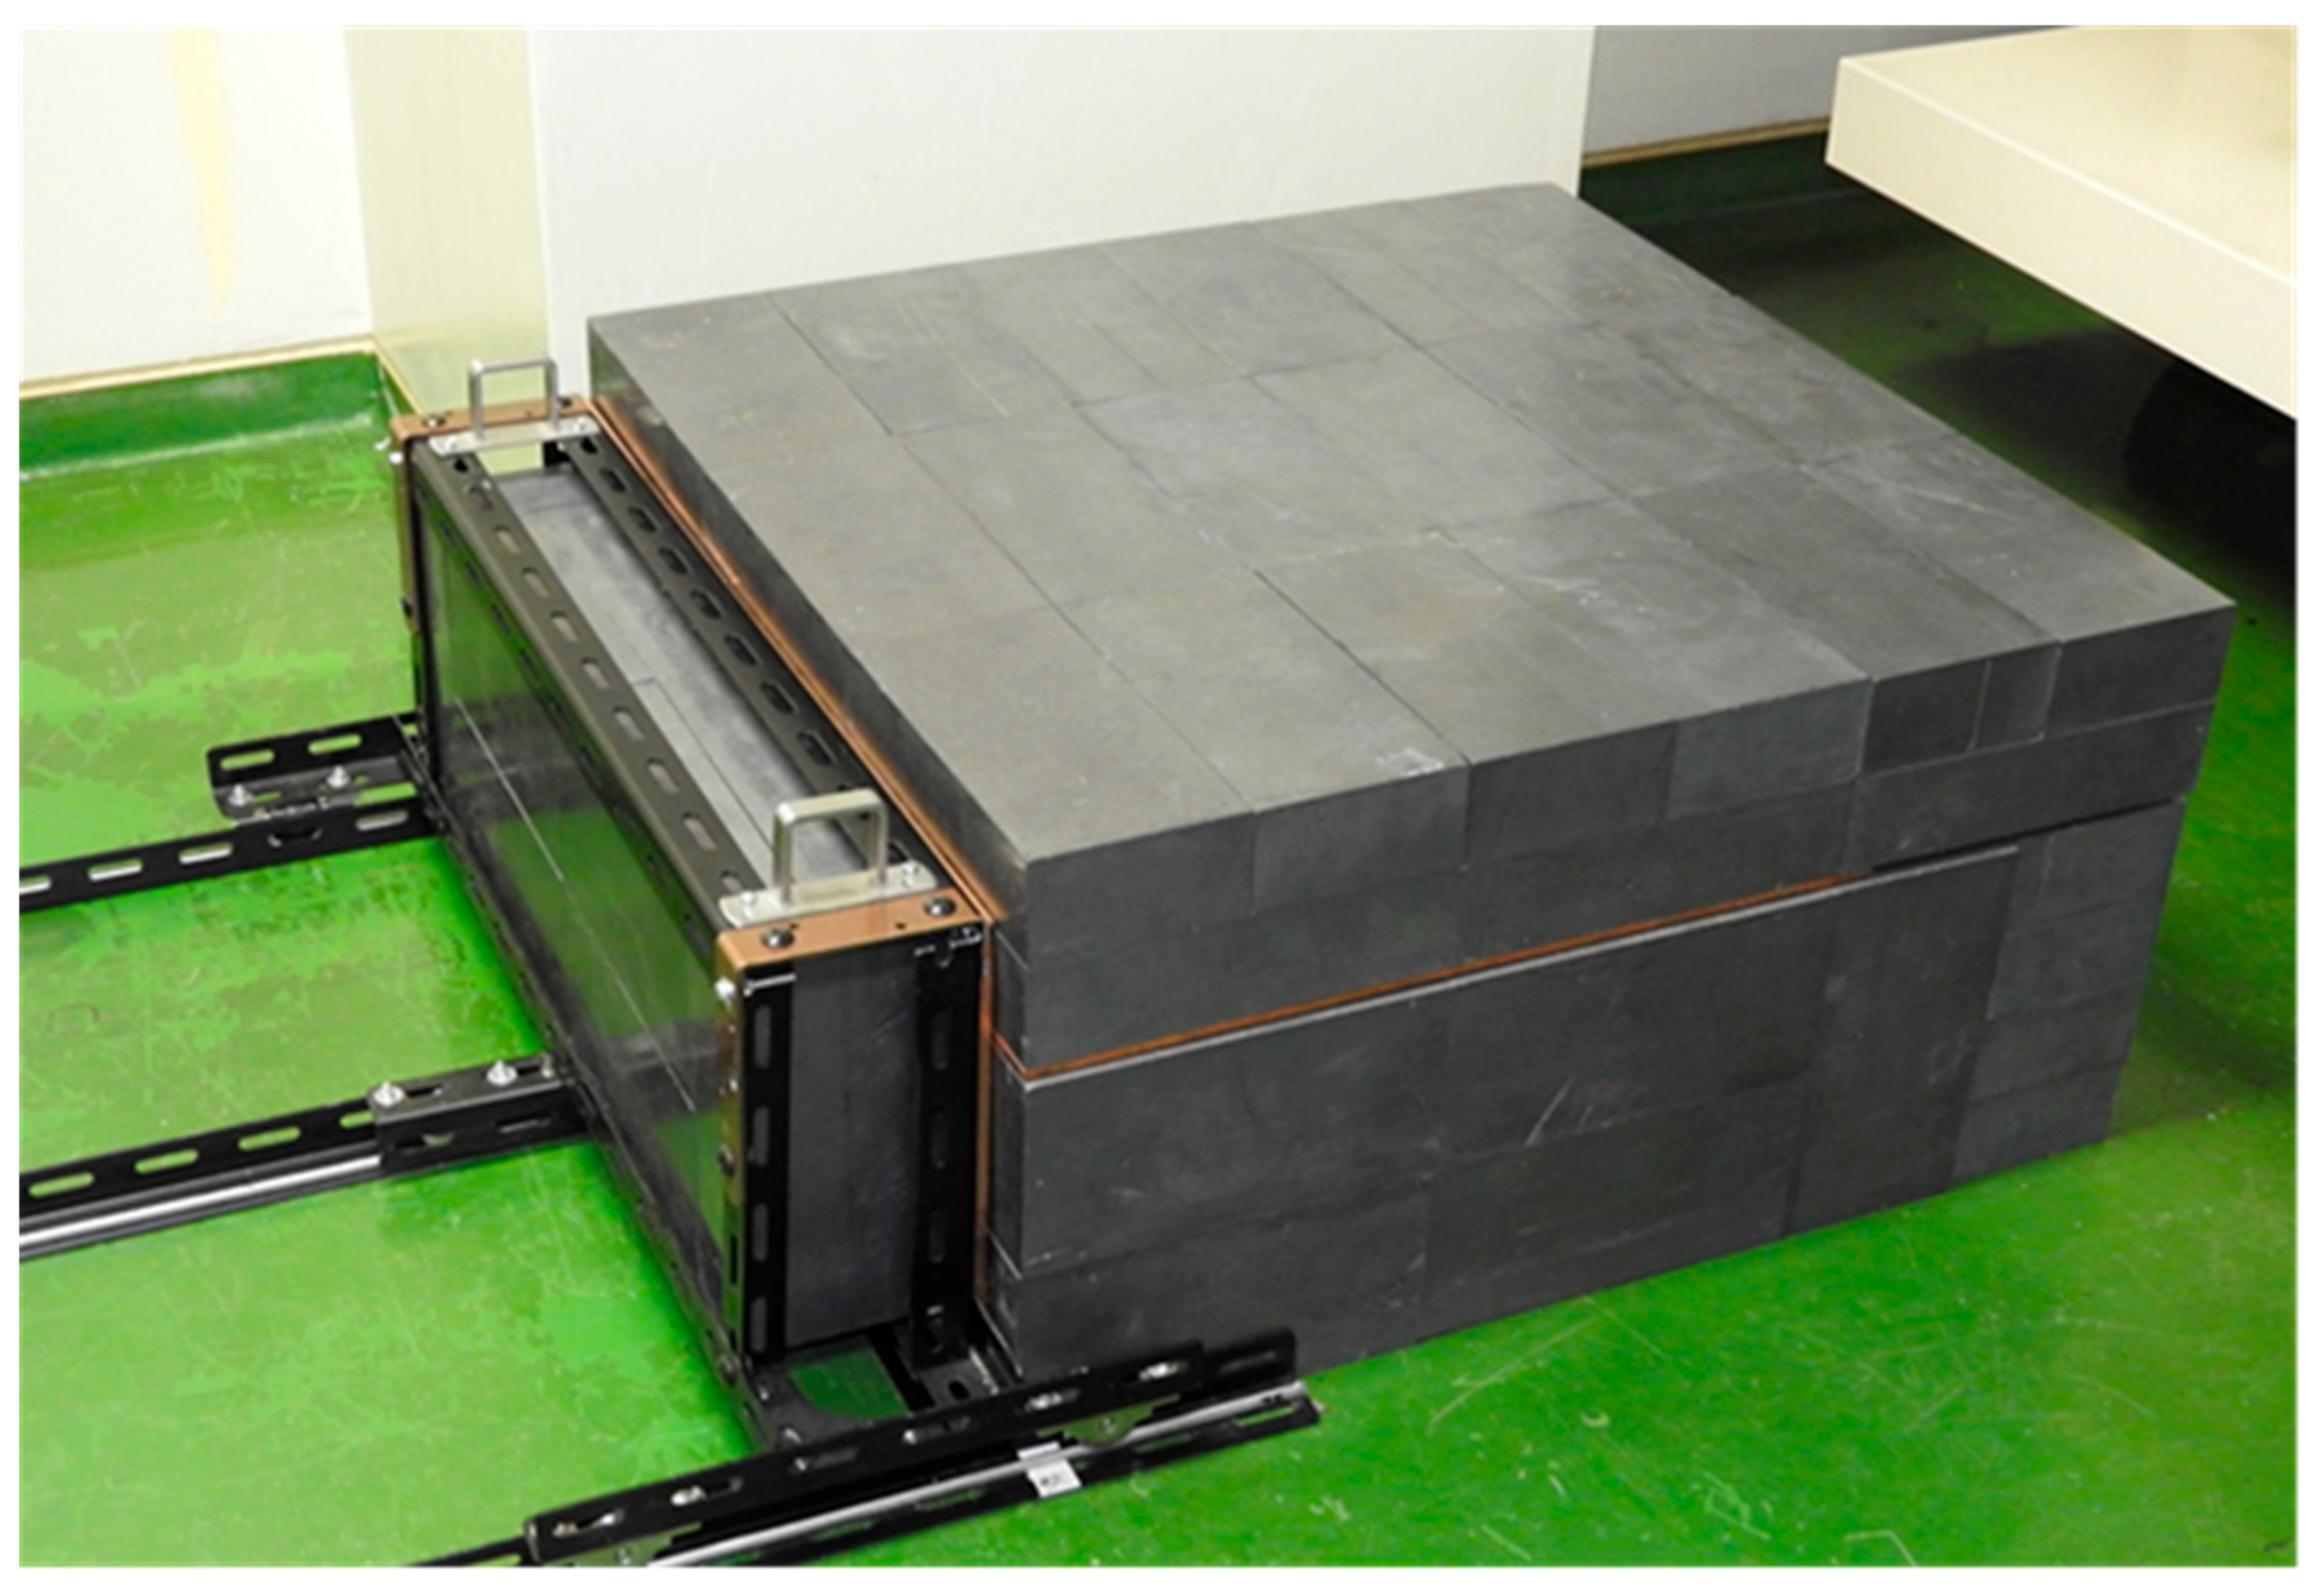
A background shielding box is required to expose an IP for up to about one month. IPs are highly sensitive to α- and β-rays but are also sensitive to γ-rays. Shielding boxes are commercially available for IPs of up to 20 × 40 cm, but a large shielding box is necessary for larger IPs. Sugita et al. [10] reported a large shielding box of 70 × 50 × 20 cm in size to investigate long leaves contaminated by 137Cs; however, the performance of the box was not so convenient. We designed a large shielding box for 35 × 40 cm IPs. The horizontal and side views are shown in Figure 1, and a photograph is shown in Figure 2. The internal space was sufficient to hold two IP cassettes. The lead blocks were 10 cm thick for the top, bottom, and both sides. The inside of the inner wall was covered with 5-mm-thick Cu plates, 1-mm-thick Cd plates, and 5-mm-thick acrylic plates. The door of the shielding box slid on an iron rail to allow the lead blocks (which weighed 110 kg) to be opened and closed smoothly.
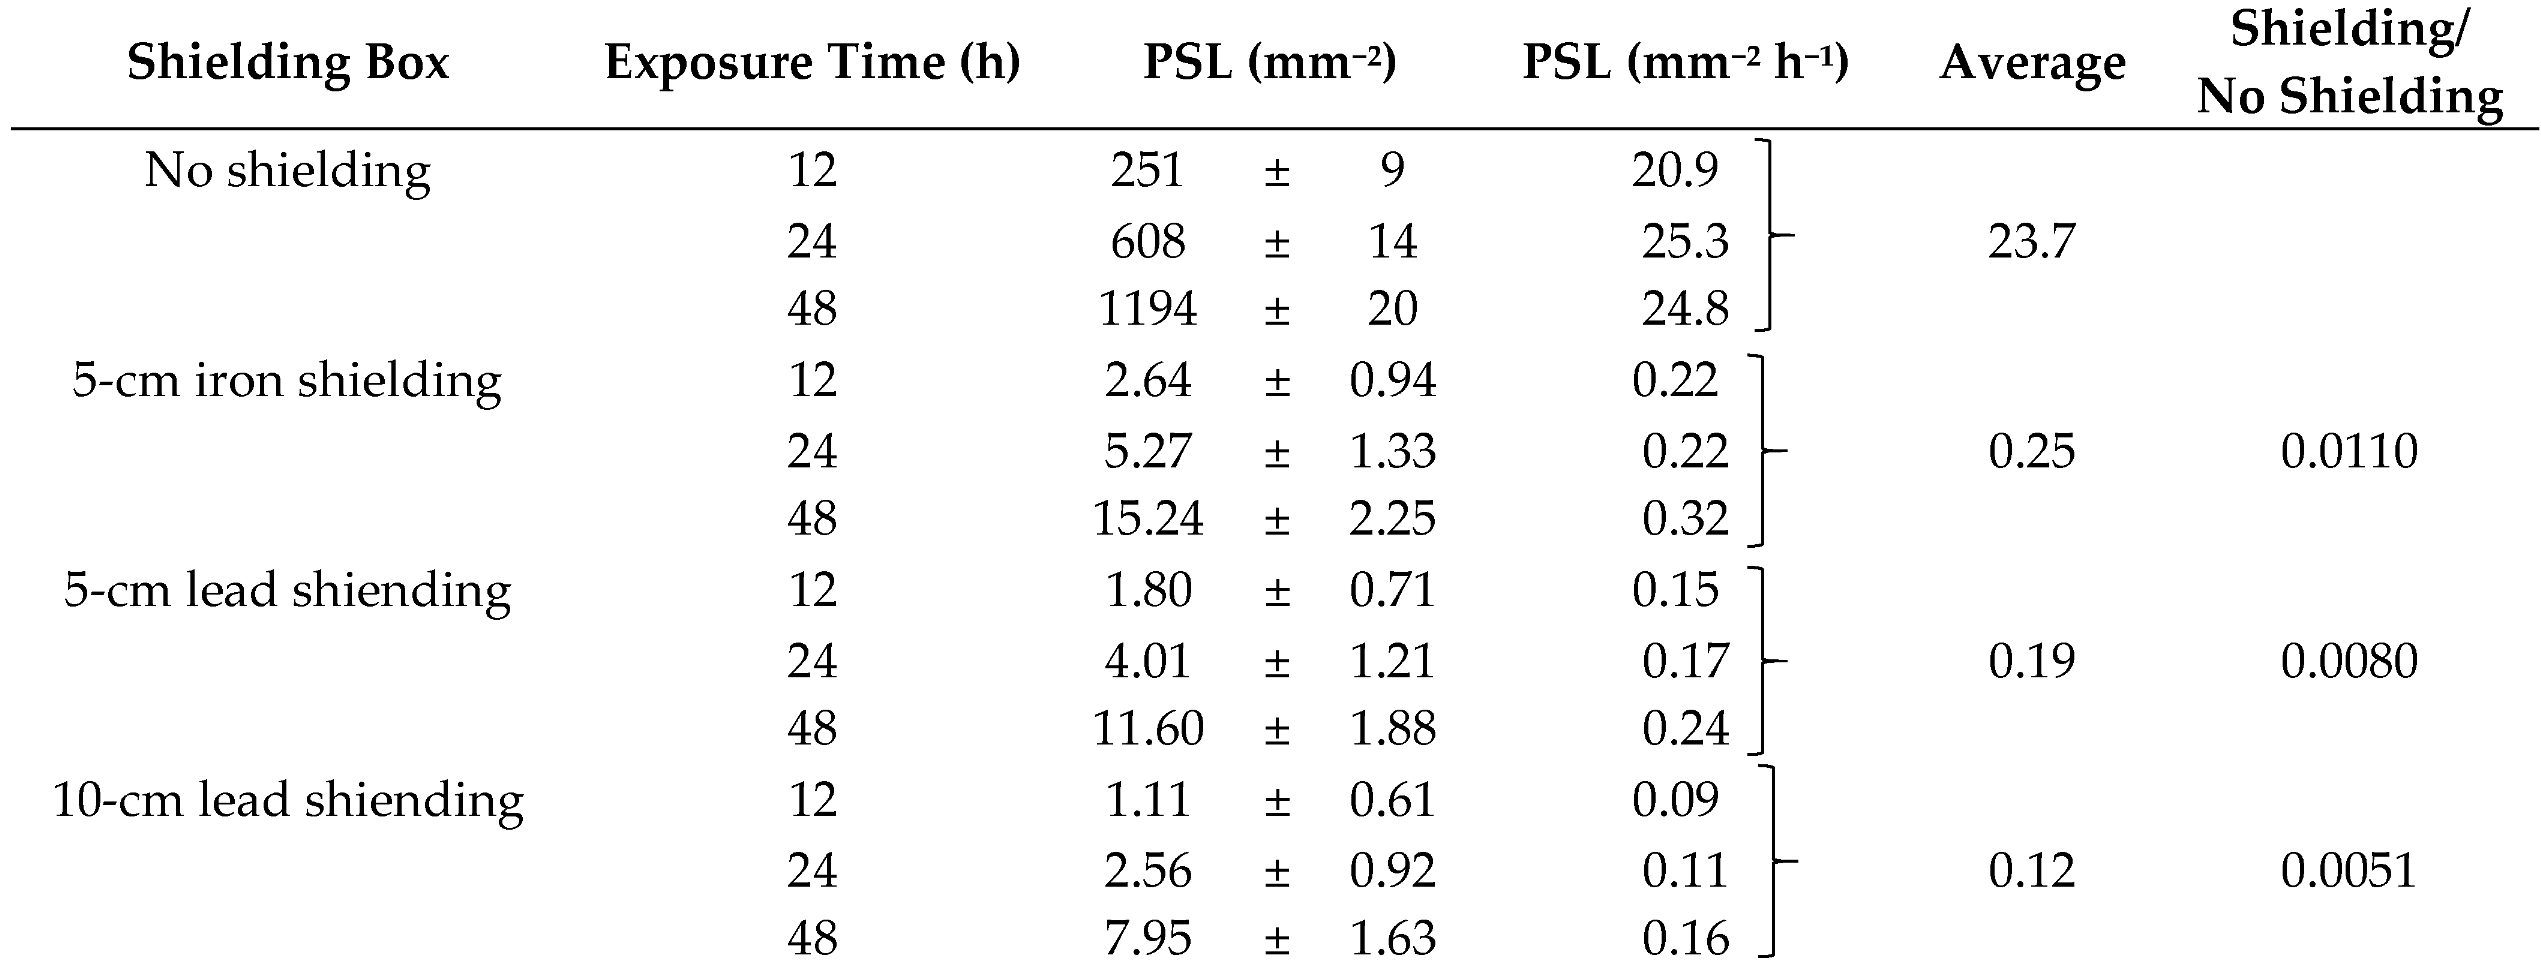
The background count rate of the IP was measured in the following shielding boxes: a cassette with no shielding, 5-cm-thick iron shielding, 5-cm-thick lead shielding, and 10-cm-thick lead shielding.

2.2. Background Reduction of Radon Progeny Nuclides

The surface of an IP should be kept dry and flat. The sample is normally covered with a thin film, such as a polyvinylidene chloride film (Saran wrap). However, Saran wrap is easily charged during unrolling, and the charged film easily collects radon progenies 214Pb and 214Bi, which emanate from concrete walls into the air. The half-lives of 214Pb and 214Bi are 27 and 19 min, respectively, and both nuclides emit β- and γ-rays. To reduce the radon progeny background, metal foils were tested. The background was measured using Saran wrap and Al foil. The films were unrolled in a normal experimental room and a 60Co γ-ray irradiation room [7], which was built of thick concrete and had no windows. The 214Pb concentration was typically 30 Bq/m3 in the normal experimental room and 270 Bq/m3 in the 60Co γ-ray irradiation room. A piece of Saran wrap about 30 × 30 cm was unrolled in the 60Co irradiation room and packed into a plastic container 5 cm in diameter and 3 cm high. The plastic container was measured with a low-background Ge detector. Then, γ-ray measurements were performed in a batch with a measuring time of 10 min and repeated 10 times. A piece of Saran wrap of the same size was also unrolled in the normal experimental room, and γ-ray measurements were performed in the same way. A piece of Al foil was also unrolled in the 60Co irradiation room and packed into a plastic container, and γ-ray measurements were performed.

2.3. α-ray Sensitivity of IPs

241Am (half-life: 432.2 years) decays to excited states of 237Np (half-life: 2.14 × 10⁶ years), emitting α- and γ-rays. The major α-ray energies are 5.486 (emission probability 83.2% per decay) and 5.443 MeV (13.1% per decay). Following α decay, γ-rays with energies of 59.5 (35.7% per decay) and 26.3 keV (2.4%), and L X-rays with energies of 13.3–20.8 keV are emitted. A point source of 241Am deposited on a 1 × 1 mm gold plate (3.7 × 10⁴ Bq) was used. The 241Am source was placed 1 cm from the IP, and 0.015-mm-thick Al foil was inserted between the source and IP. The thickness of the Al absorber was varied from 0.015 to 0.3 mm. The exposure time was 1 h for each measurement.

2.4. β- and γ-ray Sensitivity Measurement of IP

147Pm (half-life: 2.62 years) decays to the ground state of 147Sm (half-life: 1.06 × 10¹¹ years), emitting β-rays with a maximum energy of 0.224 MeV (100%). 147Pm was electrodeposited on the electrode of a commercially available FG-5P fluorescent tube, and the electrode was used as the β source. An Al foil absorber (0.03–0.12 mm thick) was inserted between the β source and the IP. The exposure time was 2 h for each measurement.
90Sr (half-life: 28.74 years) decays to 90Y (half-life: 64.1 h), emitting β-rays with a maximum energy of 0.546 MeV, and 90Y successively decays to the ground state of 90Zr (stable), emitting β-rays with a maximum energy of 2.28 MeV. As 90Sr and 90Y are in radioactive equilibrium, β-rays at 0.546 and 2.28 MeV are emitted simultaneously. A 90Sr (20 kBq) standard solution (10 μL, Japan Radioisotope Association (JRIA)) was deposited on a polyethylene plate and dried. The thickness of the Al absorber was varied from 0.015 to 0.6 mm. The exposure time was 5 min for each measurement.
137Cs (half-life: 30.04 years) decays to the excited and ground states of 137Ba (stable), emitting β rays with maximum energies of 0.514 (94.6%) and 1.176 MeV (5.4%), respectively; the 137Ba excited state also emits γ-rays with an energy of 0.662 MeV. A β- and γ-ray standard source of 137Cs (370 kBq; JRIA, code no. CS-402) was used. The thickness of the Al absorber was varied from 0.3 to 5 mm. The exposure time was 2 h for each measurement.
60Co (half-life: 5.271 years) decays to an excited state of 60Ni (stable), emitting β-rays with maximum energy of 0.318 MeV (99.92%) and γ-rays with energies of 1.173 and 1.333 MeV. A β- and γ-ray standard source of 60Co (370 kBq; JRIA, code no. CO-402) was used. The thickness of the Al absorber was varied from 0.015 to 0.6 mm thick. The exposure time was 30 min for each measurement.
40K (half-life: 1.28 × 10⁹ years) is a radionuclide which accounts for 0.0117% of natural K. Thus, 40K is a typical source of natural radioactivity in various environmental samples. 40K has a long half-life and makes branching decays to 40Ca (β decay with maximum energy of 1.31 MeV, 89.1%) and to 40Ar (electron capture decay, 10.7%). Potassium bromide powder (KBr powder) (6.317 g) was placed in a steel holder (5.0 cm diameter, 3 mm thick). The thickness of the Al absorber was varied from 0.015 to 6 m.

3. Results and Discussion

3.1. Background Characteristics of the Shielding Box

The background count rates (PSL mm−2·h−1) of the IPs were measured in different shielding boxes as a function of the exposure time for up to 48 h. The result is shown in Figure 3. The IP cassette itself had no shielding effect for natural background radiation, but it was effective for light shielding. The background count rates for no shielding, the 5-cm-thick iron shielding box, and the 5- and 10-cm-thick lead shielding boxes are presented in Table 2. The environmental γ-rays were reduced to about 1/90 of the count rate from no shielding by the 5-cm-thick iron shielding, 1/125 by the 5-cm-thick lead shielding, and 1/196 by the 10-cm-thick lead shielding. These results indicate that the background count rate was reduced as the thickness of the lead increased. However, the reduction ratio shows a small difference between 5- and 10-cm-thick lead shielding, mainly as the IP had a higher sensitivity to β-rays than to γ-rays.

3.2. Background Reduction from Radon Progeny Nuclei

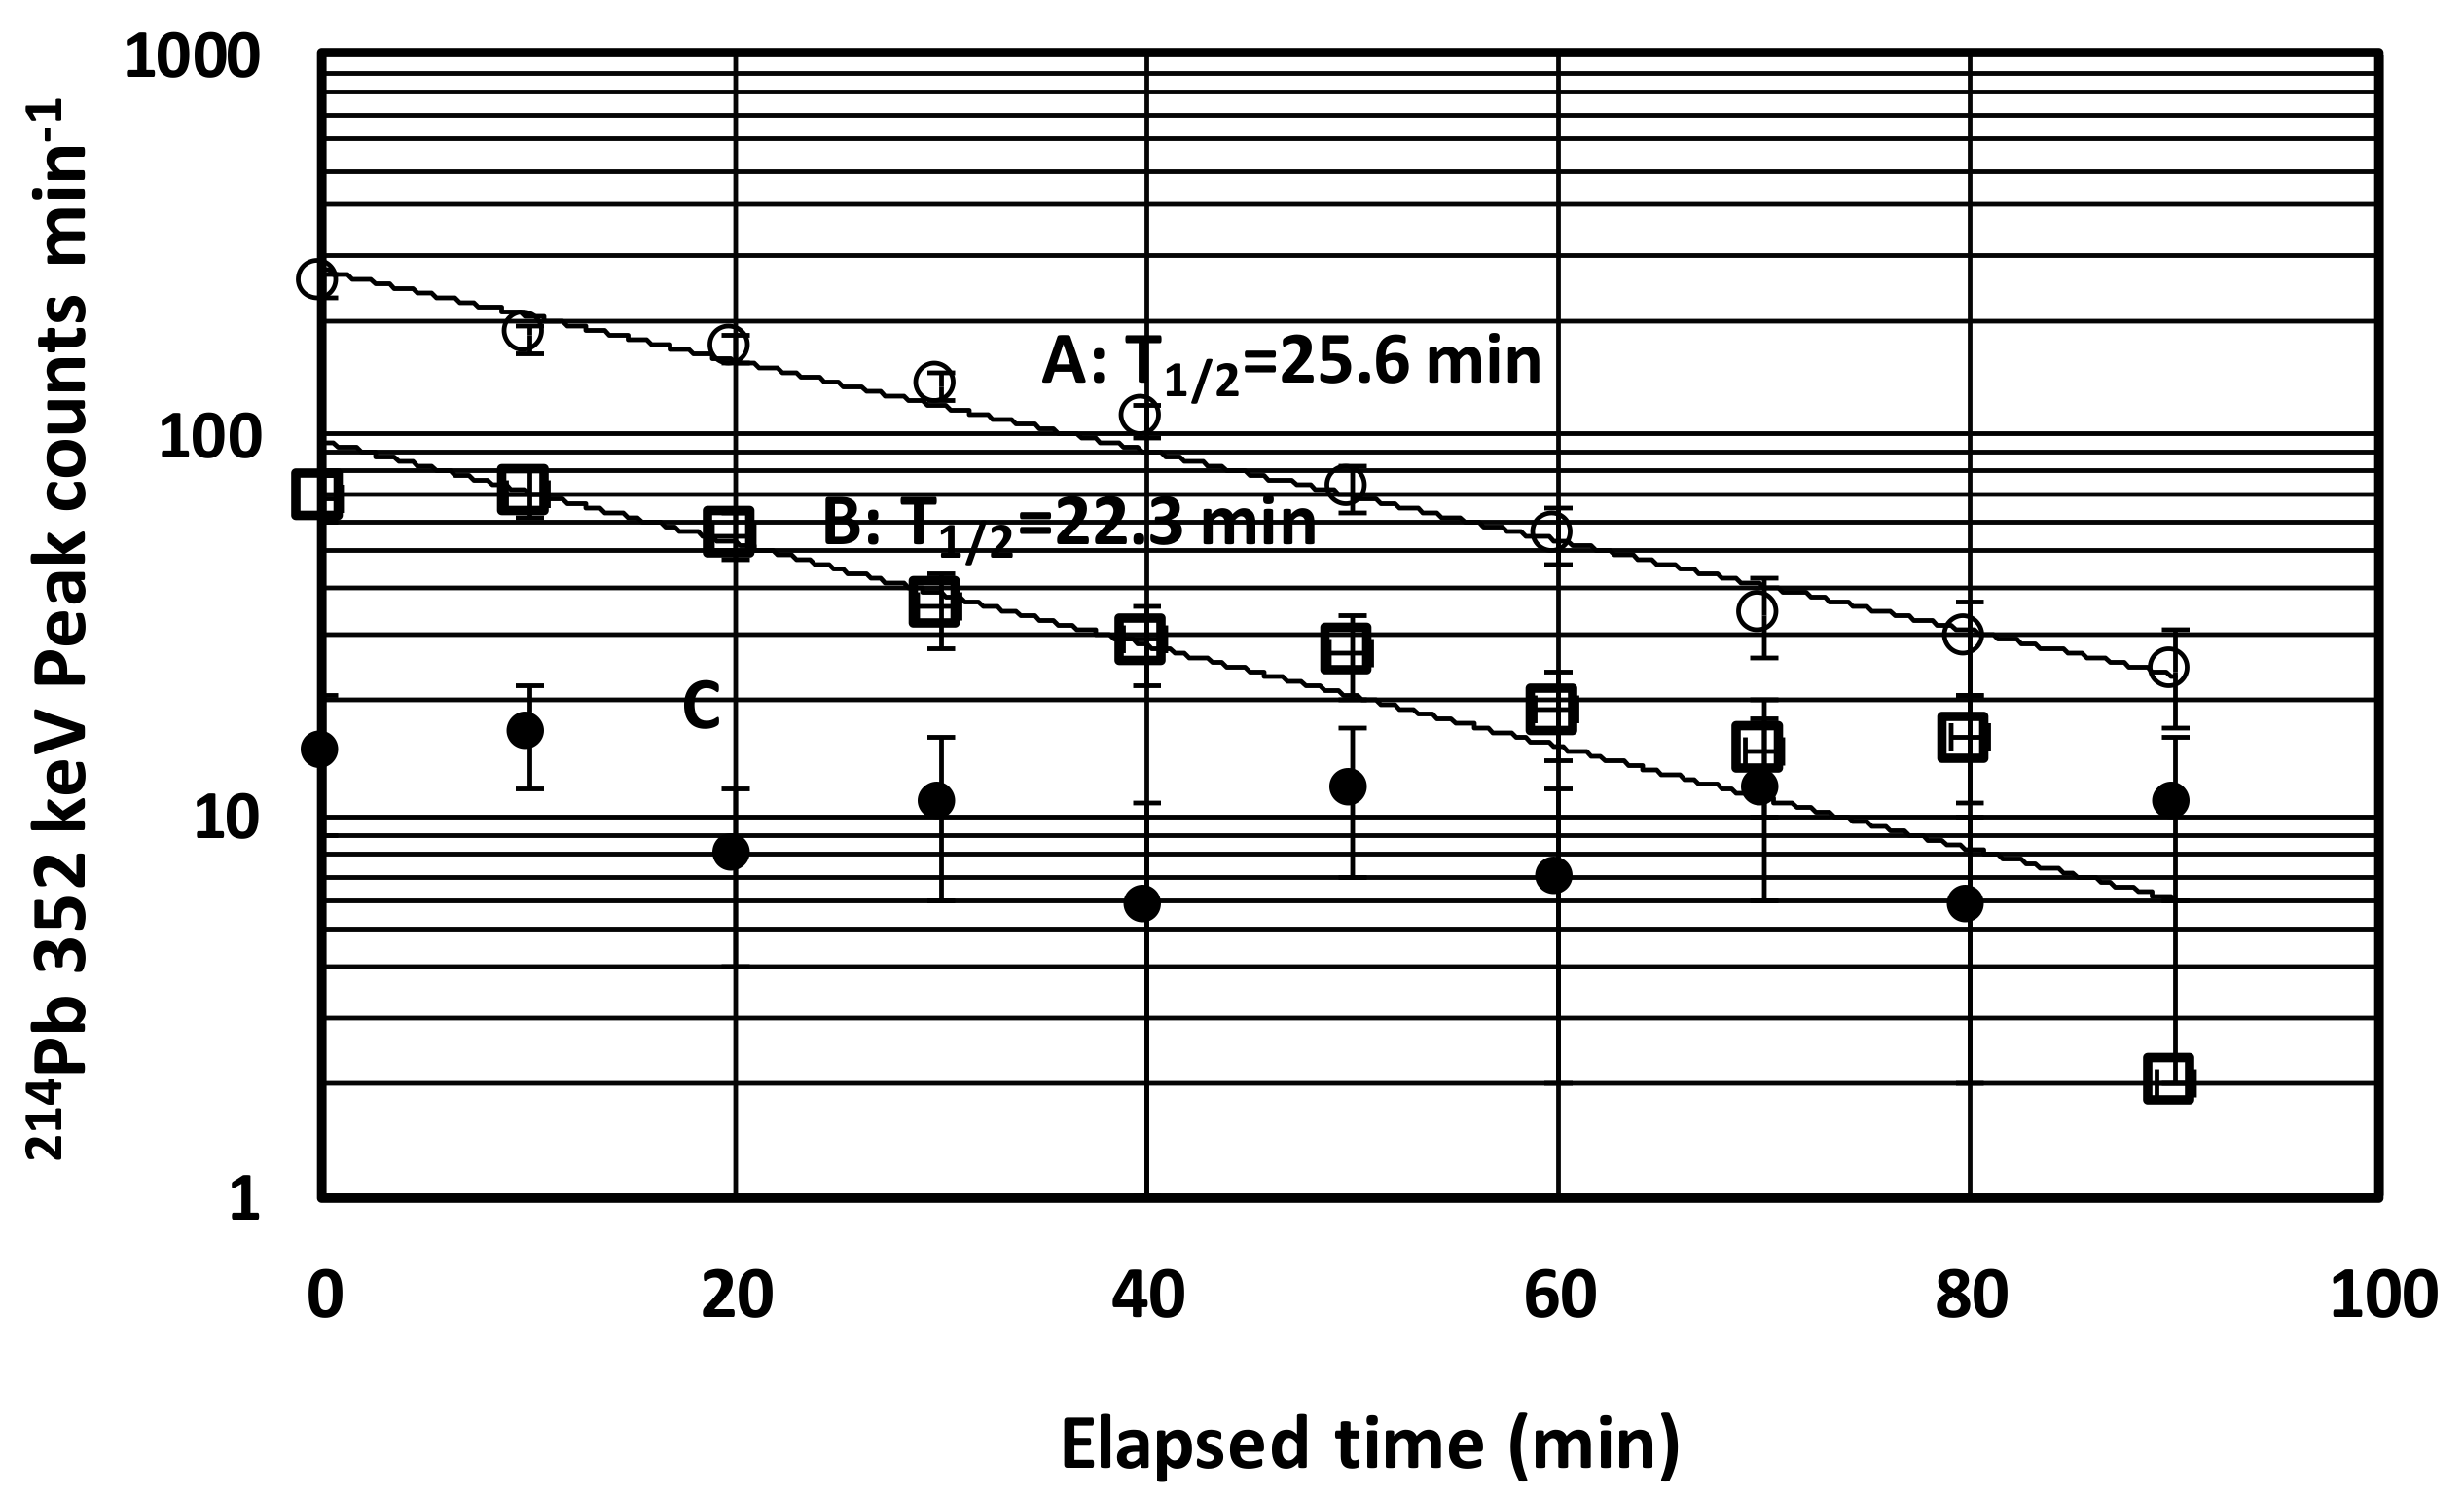
The γ-ray peak counts of 214Pb (half-life: 26.8 min) against the elapsed time for Saran wrap film and Al foil unrolled in the 60Co γ-ray irradiation room were measured with a Ge detector. Saran wrap film was also measured unrolled in the normal experimental room. The results are shown in Figure 4. Saran wrap films in both rooms showed a reduction of 214Pb as a function of elapsed time, whereas Al foil showed an almost constant count rate. These results indicate that Saran wrap films collect 214Pb radon progeny from the air easily during unrolling. As the β-rays emitted from 214Pb and 214Bi affect IPs, it was concluded that metal foil is effective in preventing charging of the thin film itself.

3.3. α-ray Sensitivity of IPs

The time-normalized PSL count rate as a function of the Al absorber for 241Am is shown in Figure 5. The thickness of the Al absorber was varied from 0.015 to 0.3 mm. The PSL count rate of 241Am consisted of a rapid decrease for 0.015-mm-thick Al foil, and an almost constant count rate for 0.015–0.3-mm-thick foil. This decrease was attributed to the α-ray (5.4 MeV) component emitted by 241Am, and the constant count rate was attributed to the γ-ray components from 241Am.
The α-ray range in Al, RAl, can be calculated based on the α-ray range in air, Rair. According to Tsoulfanidis [12], the range of α-rays (5.4 MeV from 241Am) in the air is expressed as
R a i r = 0.05 T + 2.85 T 3 / 2 ,   4   <   T <   15   MeV ,
where T is the α-ray energy. Taking T = 5.4 MeV, R a i r = 39.15 mm is obtained from Equation (1).
A more detained calculation is given by using the Bragg–Kleeman rule [12],
R A l R a i r = ρ a i r ρ A l A A l A a i r ,  
where ρ A l is the density of aluminum (kg∙m−3), ρ a i r is the density of air (kg∙m−3), A A l is the atomic mass of aluminum, and A a i r is the effective atomic mass of air. Taking ρ A l = 2.7 kg∙cm−3, ρ a i r = 1.29 × 10⁻³ kg∙m−3, A A l = 26.98 u, and A a i r = 14.74 u, R a i r = 25.3 μm is obtained.
The experimental results indicate that the α-ray range was smaller than 25.3 μm. This is because the surface of the IP was covered with a layer of PET ((C2H4)n) about 10 μm thick. Thus, the additional 15-μm-thick Al foil was enough to stop the 5.5-MeV α-rays. The ratio of the IP sensitivity for α-rays to that of γ-rays was estimated from the ratio of the count rate without an absorber to that with an absorber: Nα/Nγ = 1700/190 = 8.9. This result indicates that the sensitivity to α-rays was about 8.9 times higher than that of γ-rays, in the case of 241Am.

3.4. β- and γ-ray Sensitivity of IPs

The number of β particles, N, that penetrate an absorber with thickness x (cm) is represented by
N x = N 0 e x p ( μ x ) ,
where μ (cm−1) is a linear attenuation coefficient. As the mass attenuation coefficient in Al, μm [14], is represented as a function of the maximum energy Eβ (MeV),
μm = 1.7 Eβ−1.14,
the linear attenuation coefficient in Al is given as
μAl = ρAlμm = ρAl 1.7Eβ−1.14.
The mass and linear attenuation coefficients (as functions of Eβ) are given in Table 3.
147Pm emits β-rays with a maximum energy of 0.226 MeV and no γ-rays. The time-normalized PSL count rate, as a function of Al absorber thickness, is shown in Figure 6. The solid line indicates the calculated attenuation curve, where the count rate for no absorber is normalized to the measurement. The calculated attenuation curve agrees with the measurement.
90Sr–90Y emits β-rays with maximum energies of 0.546 (100%) and 2.28 MeV (100%), respectively, and emits no γ-rays. A radioactive equilibrium is formed between these isotopes. The time-normalized PSL count rate, as a function of Al absorber thickness, is shown in Figure 7. Calculations with the two components are shown as dotted and dashed lines, and the solid line shows the sum of the two components. The count rate with no absorber is normalized to the measurements. The calculated curve agrees with the measurements.
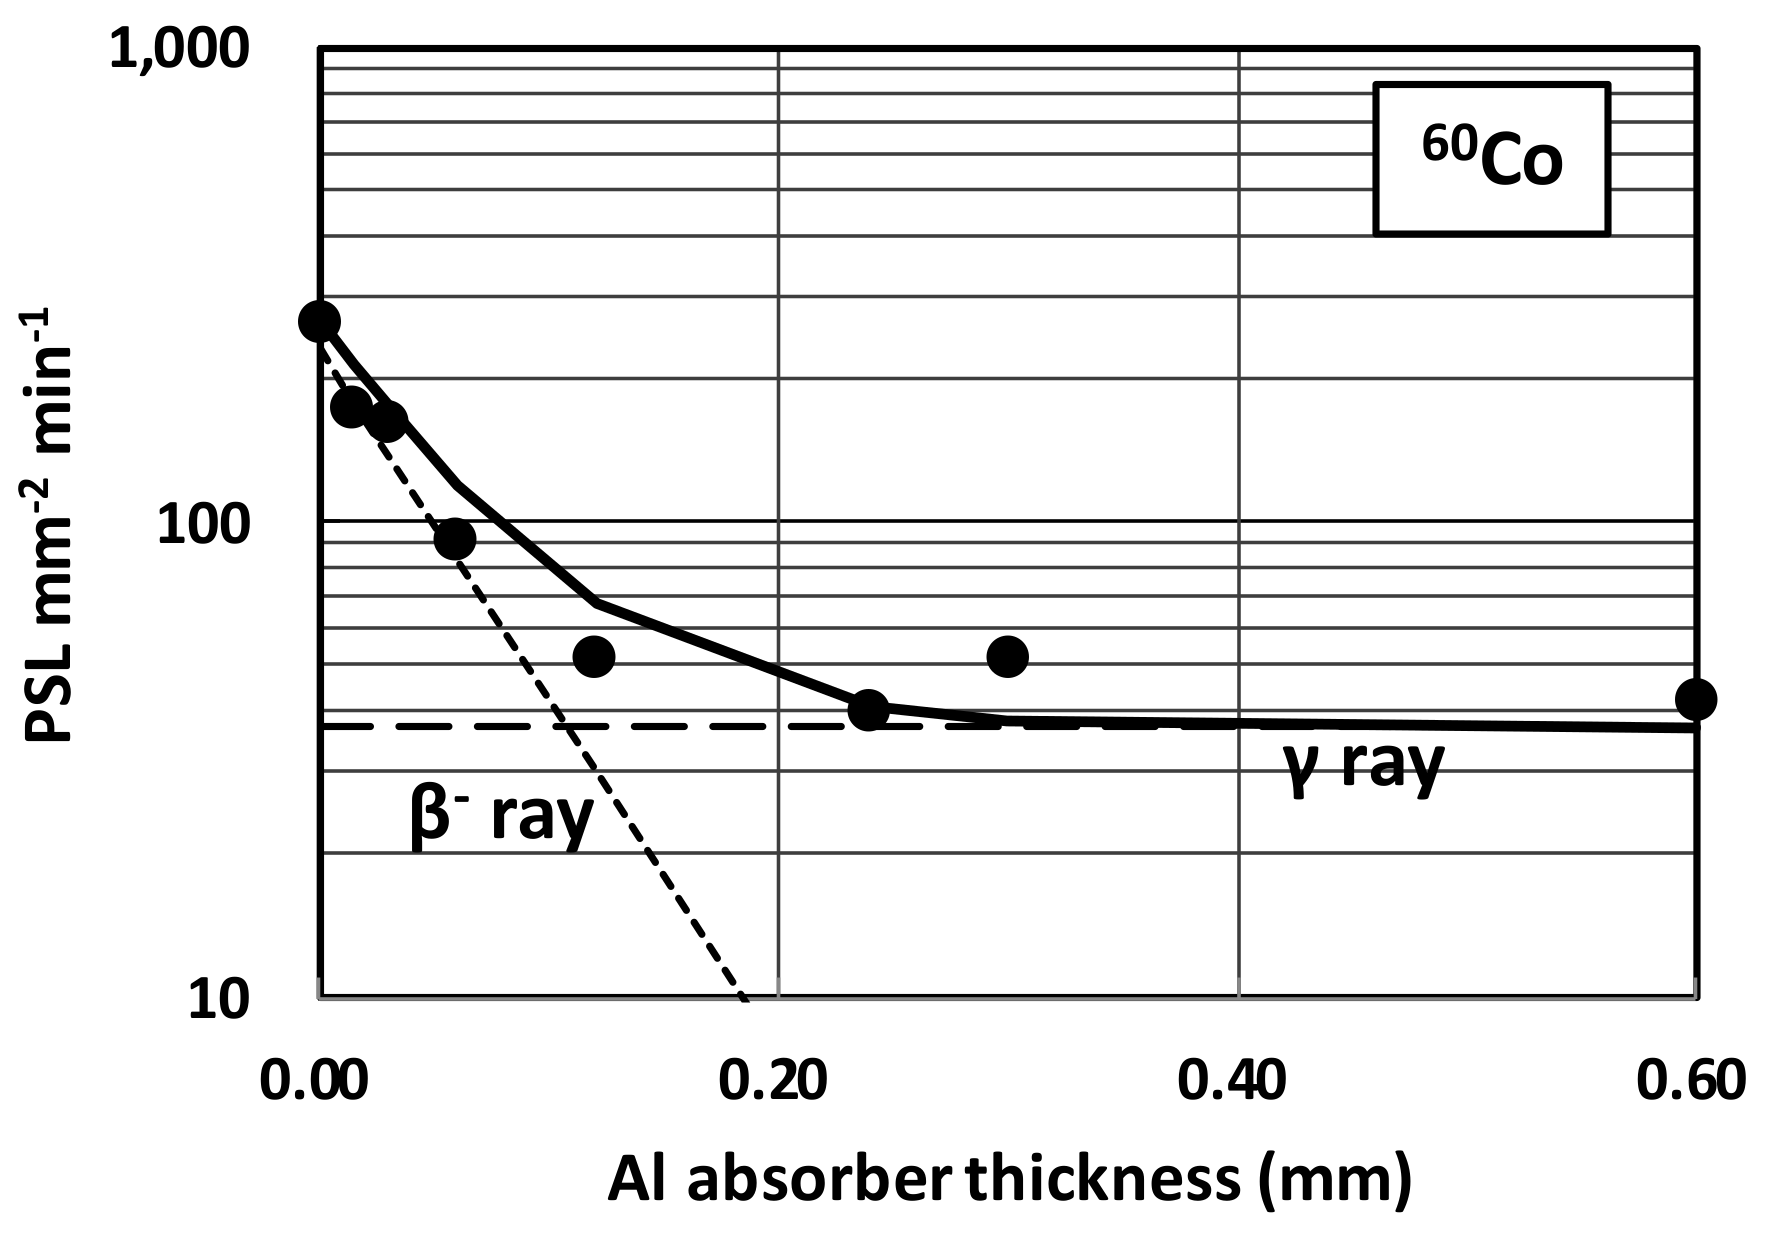
60Co emits β-rays with a maximum energy 0.318 MeV (99.9%) and two γ-rays with energies of 1.173 (100%) and 1.333 MeV (100%). The time-normalized PSL intensity, as a function of Al absorber thickness, is shown in Figure 8. The attenuation curve shows a rapid decrease up to an Al absorber thickness of 0.2 mm, and then becomes almost constant. The first rapid decrease arises from β-rays, and the constant part arises from γ-rays. The ratio of the IP sensitivity to β-rays against that of γ-rays was estimated from the ratio of the count rate with no absorber to that with an absorber: Nβ/Nγ = 300/40 = 7.5. Thus, the sensitivity to β-rays was about 7.5 times higher than that to γ-rays for 60Co.
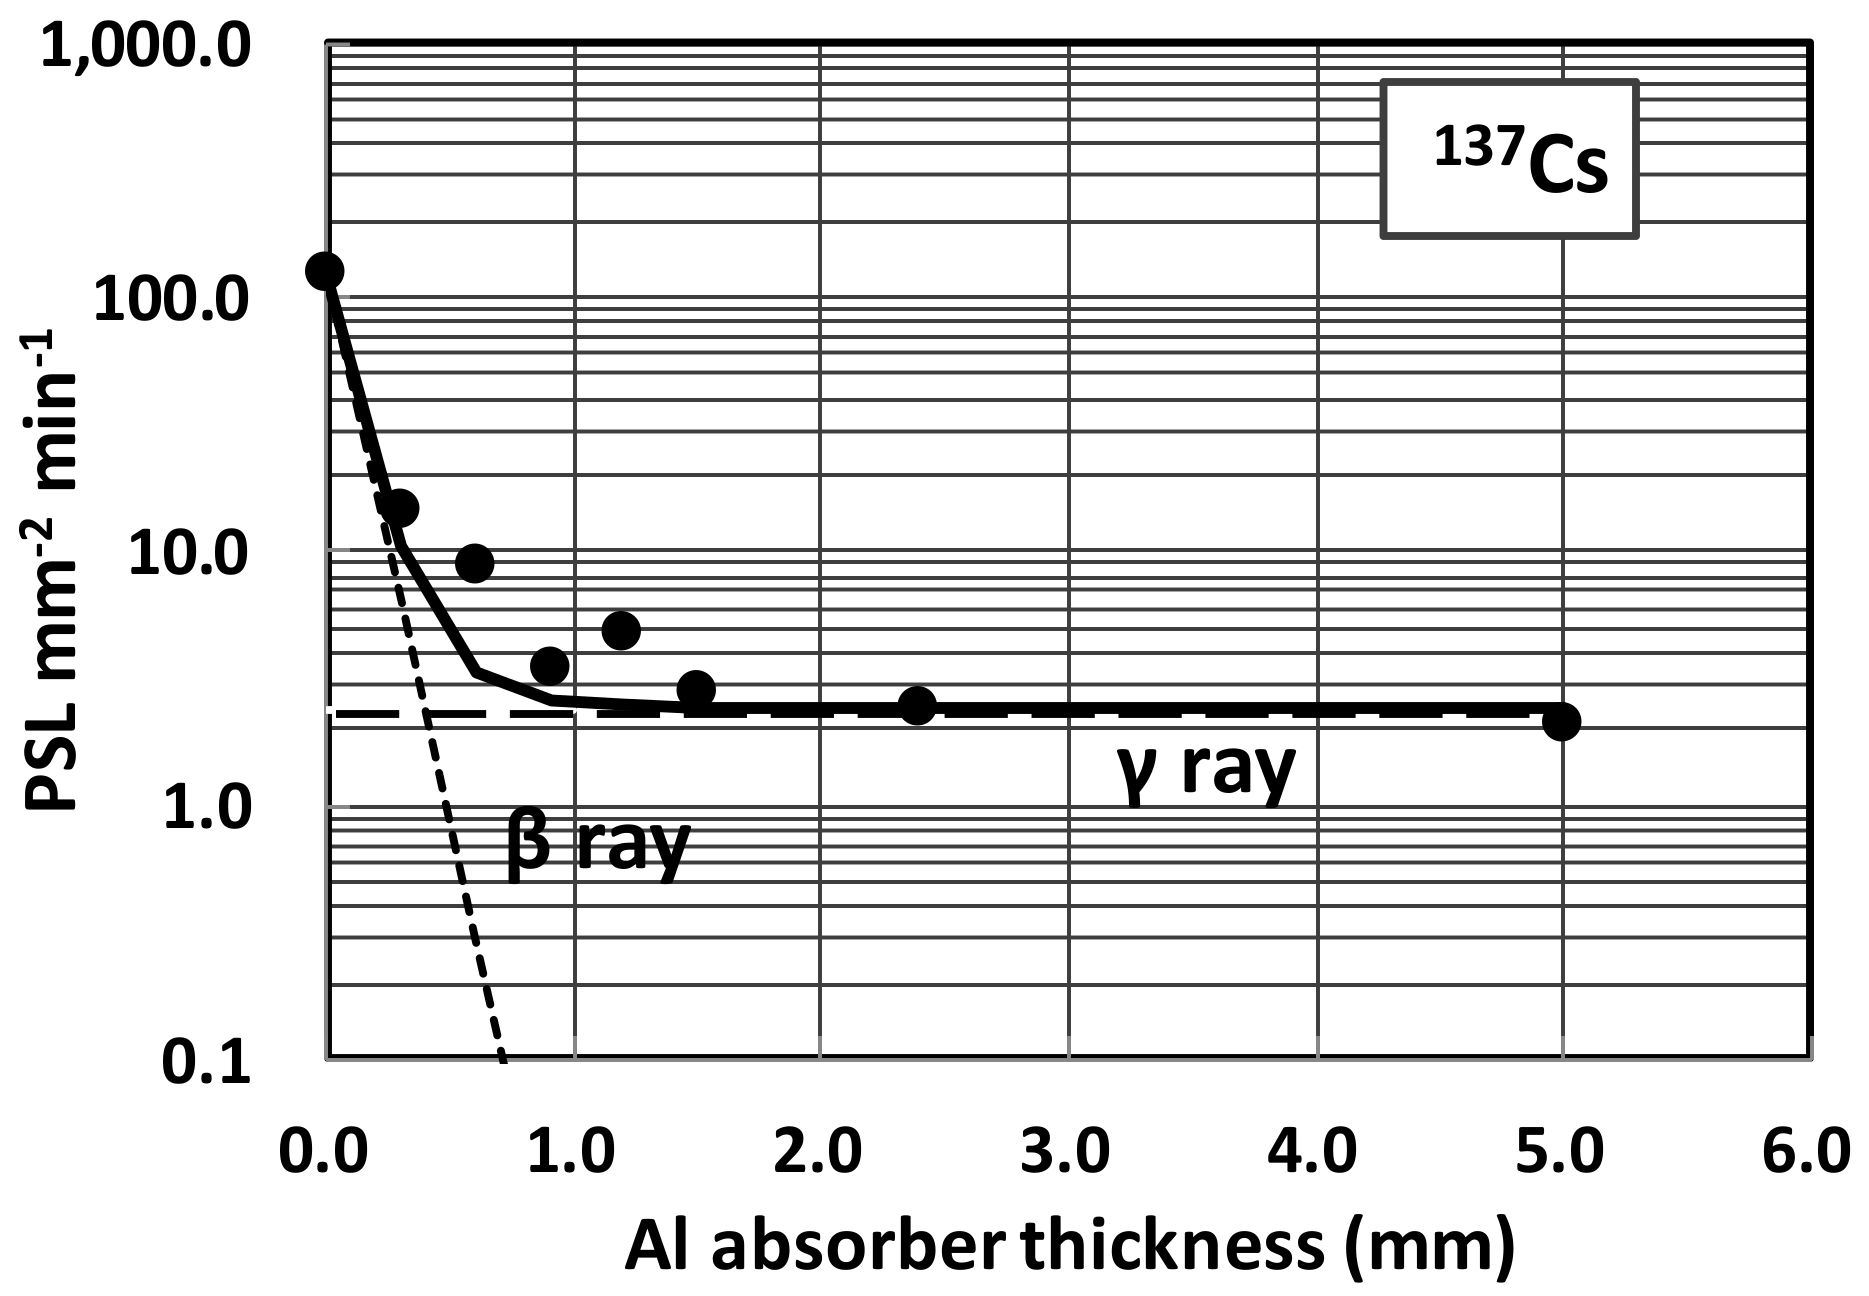
137Cs emits β-rays with maximum energies of 0.514 (94.4%) and 1.176 MeV (5.6%) and a γ-ray at 0.662 MeV (85.1%). The time-normalized PSL count rate, as a function of Al absorber thickness, is shown in Figure 9. The attenuation curve is composed of β- and γ-rays. The ratio of the IP sensitivity to β-rays to that of γ-rays was estimated as Nβ/Nγ = 130/2.4 = 54. The sensitivity of β-rays was, thus, about 54 times higher than that of γ-rays for 137Cs. This ratio was higher than that for 60Co, mainly because the average energy of the 137Cs β-rays was higher than that for 60Co.
40K emits β-rays with a maximum energy of 1.312 MeV (89.3%) and γ-rays with an energy of 1.461 MeV (10.7%). The time-normalized PSL intensity, as a function of Al absorber thickness, is shown in Figure 10. The attenuation curve is composed of β-rays up to about 1 mm, and γ-rays. The ratio of IP sensitivity to β-rays to that of γ rays was estimated as Nβ/Nγ = 1.3/0.01 = 130. The sensitivity to β-rays was about 130 times higher than that of γ-rays for 40K, mainly because the average energy of the 40K β-rays was about four times higher than that of 60Co.
As a result, the sensitivity of the imaging plate to α- or β-rays was higher than that for γ-rays. This fact indicates that most images of samples containing various radionuclides, such as environmental samples, arise from α- or β-rays emitted from radionuclides at the sample surface, but not from the whole sample.

4. Applications to Autoradiography of Environmental Samples

After the FDNPP accident, we performed continuous radioactive monitoring during 2011–2016 in Minami-Soma City, located about 10–40 km to the north of the reactors. The purpose for this was to clarify the radiocesium contamination level and temporal variation of the contamination in river water and sediment [16], ground water [17], and fruit and vegetables produced in the city. The radiocesium concentration in samples was determined by γ-ray spectrometry with a Ge detector, after which autoradiography was applied to show the distribution of radiocesium in the samples. Three environmental samples—sediment, fir tree, and mushroom—were utilized to show the distribution of radionuclides in the samples and their migration.

4.1. Sediments

Soil samples of sediments from an irrigation channel were taken on 30 November 2011 in the Haramachi district of Minami-Soma city, which is about 26 km north of the FDNPP site. 137Cs was concentrated in irrigation channels, compared with land surface contamination. About 2 kg of sediment was sampled, dried, and spread out in a 20 × 20 cm polystyrene container. The sample surface was covered with thin Al foil, and the soil surface was covered with an IP of 20 × 40 cm in size. The IP was exposed to the soil sample for one day in the low-background shielding box. The sediment was composed of mud, dried grasses, and pebbles, as shown in Figure 11a. In the radioactive image (Figure 11b), small hot particles in the mud and dried grasses were visible. The surfaces of the pebbles were less contaminated. After imaging, the sediments were filtered, and the mud, grass, and pebbles were separated. The radioactive cesium concentration was measured with a Ge detector, and the 137Cs and 134Cs concentrations in the mud were found to be 16,233 ± 1150 and 12,784 ± 904 Bq/kg, respectively. The radioactive image indicated that 137Cs was not attached to the surface of stones but was attached to the dried grasses in high concentration. 137Cs was also highly concentrated in mud. The concentration distribution was not uniform, and the mud contained small hot particles.

4.2. Momi Fir

Momi fir (scientific name: Abies firma) is a common coniferous species distributed throughout low- to moderate-altitude forests in Japan. Fukushima forests were contaminated with radioactive material by the FDNPP accident. Momi fir samples were collected in the Fukushima forest, around 45 km north-northwest of the FDNPP site, to clarify the contamination level and to study the relocation of radioactive cesium in trees [18]. The samples analyzed in the present work were collected in 2013. A large sample of 35 × 35 cm in size was put on the IP, covered with Al foil, and placed in the low-background shielding box. Samples were exposed for three days in the shielding box. A photograph is shown in Figure 12a, and a radioactive image is shown in Figure 12b.
After imaging, leaves were taken from a two-year-old branch (2011), a one-year-old branch (2012), and a new shoot (2013), and packed into separate plastic containers. γ-ray measurements were then performed with a Ge detector. The radioactivities of 137Cs and 134Cs were 82,000 ± 5700 and 36,000 ± 2500 Bq/kg for the new shoot leaves, 26,000 ± 820 and 10,000 ± 700 Bq/kg for the one-year-old branch leaves, and 20,000 ± 1400 and 6000 ± 420 Bq/kg for the two-year-old branch leaves, respectively. The contamination occurred at the surface of the two-year-old branch (Figure 12b). The radioactive image indicated that most of the radioactive 137Cs and 134 Cs moved from the one-year-old branch to the new shoot. Finally, a high concentration of 137Cs and 134 Cs was observed in the new shoot. Momi fir trees grow new branches every year, and our results demonstrated that radioactive cesium was deposited on the leaves in 2011—just after the reactor accident—and the radioactive cesium moved into the new branches in 2012 and 2013. As the fir sample was 40 × 40 cm, the large shielding box was useful for imaging.

4.3. Mushroom

Mushrooms grow rapidly, over about 10 days, and their roots grow in the shallow soil surface. Therefore, they collect radiocesium (137Cs and 134Cs) from the surface soil. The mushrooms (called Inohanadake) were sampled on 2 October 2014 from the forest in the Fukano area in Minami-Soma city, about 35 km north of the FDNPP site. The mushroom was put on a 20 × 40 cm IP covered with Al foil and exposed in the low-background shielding box over two days. Flat and cross-sectional views are shown in Figure 13a. The radioactive imaging demonstrated that the radiocesium was not uniformly distributed, but it was highly concentrated on the surface of the mushroom (see Figure 13b). After imaging, 37.6 g of mushroom was placed in a plastic container, and γ-ray measurements were taken. The 137Cs and 134Cs radioactivities were 5238 ± 375 and 1742 ± 128 Bq/kg, respectively. The imaging clarified the locations of high radioactive cesium contamination.

5. Conclusions

A low-background shielding box was constructed for radioactive imaging with a large IP (i.e., of up to 35 × 40 cm). IPs are highly sensitive to charged particles, such as α- and β-rays, and a shielding box is, therefore, necessary to reduce natural radiation during the long exposures required. In addition, Al foil was used to cover the samples instead of Saran wrap, in order to reduce the background radiation due to charging of the thin film.
The α-, β-, and γ-ray sensitivities of the IP were investigated using various radioisotopes and Al foil absorbers. Absorption curves were constructed for each radioisotope and were interpreted by calculating the α- and β-ray attenuation coefficients for each radionuclide. The sensitivity of the IP was high for α- and β-rays, but low for γ-rays.
Radioactive imaging of environmental samples of sediment, Momi fir trees, and mushrooms contaminated by the FDNPP accident was performed using the shielding box. The 137Cs and 134Cs radionuclides were determined by γ-ray spectrometry with a Ge detector and imaging revealed the distribution and migration of 137Cs and 134Cs in the samples.

Author Contributions

K.S. and Y.O. planned the design of the shielding box. K.S. performed the sensitivity measurements of IPs. Environmental sampling was performed by K.S. and Y.O. The manuscript was written by K.S. with support from Y.O.

Funding

This research received no external funding.

Acknowledgments

The authors gratefully acknowledge Yushi Sakurai in Minami-Soma City for his help with sampling. This work was supported by the Leader Education Program for the Renaissance from Radiation Disaster funded by the Ministry of Education, Culture, Science, and Technology.

Conflicts of Interest

The authors declare no conflicts of interest.

References

  1. Amemiya, Y.; Matsushita, T.; Nakagawa, A.; Satow, Y.; Miyahara, J.; Chikawa, J. Design and performance of an imaging plate system for X-ray diffraction study. Nucl. Instrum. Meth. Phys. Res. 1988, 266, 645–653. [Google Scholar] [CrossRef]
  2. Takahashi, K.; Kohda, K.; Miyahara, J.; Kanemitsu, Y.; Amitami, A.; Shionoya, A. Mechanism of photostimulated luminescence in BaFX:Eu2+ (X=Cl, Br) phosphors. J. Lumin. 1984, 31, 266–268. [Google Scholar] [CrossRef]
  3. Iwabuchi, Y.; Mori, N.; Takahashi, K.; Matsuda, T.; Shionoya, S. Mechanism of photostimulated luminescence process in BaFBr.Eu2+ phosphors. Jpn. J. Appl. Phys. 1994, 33, 178–185. [Google Scholar] [CrossRef]
  4. Miyahara, J. Autoradiography and radiography-Imaging plate and its applications. Radioisotopes 1988, 47, 143–154. (In Japanese) [Google Scholar] [CrossRef]
  5. Sonoda, M.; Takano, M.; Miyahara, J.; Kato, H. Computed radiography utilizing scanning laser stimulated luminescence. Radiology 1983, 148, 833–838. [Google Scholar] [CrossRef] [PubMed]
  6. Simpson, S.J.; La Niece, S. New light on old swords from Iran. Br. Mus. Technol. Res. Bull. 2010, 4, 95–101. [Google Scholar]
  7. Shizuma, K.; Kajimoto, T.; Endo, S.; Matsugi, K.; Arimatsu, Y.; Nojima, H. Non-destructive analysis of ancient bimetal swords from western Asia by γ-ray radiography and X-ray fluorescence. Nucl. Instrum. Meth. Phys. Res. 2017, 407, 244–255. [Google Scholar] [CrossRef]
  8. Sugiura, Y.; Shibata, M.; Ogata, Y.; Ozawa, H.; Kanasashi, K.; Takenaka, C. Evaluation of radiocesium concentrations in new leaves of wild plants two years after the Fukushima Dai-ichi Nuclear Power Plant accident. J. Environ. Radioact. 2016, 160, 8–24. [Google Scholar] [CrossRef] [PubMed]
  9. Nakanishi, T.M. An overview of our research. In Agricultural Implications of the Fukushima Nuclear Accident; Nakanishi, T.M., Tanoi, L., Eds.; Springer Open: Tokyo, Japan, 2016; pp. 1–9. ISBN 978-4-431-55826-2. [Google Scholar] [CrossRef]
  10. Sugita, R.; Hirose, A.; Kobayashi, N.K.; Tanoi, K.; Nakanishi, T.M. Imaging techniques for radiocesium in soil and plants. In Agricultural Implications of the Fukushima Nuclear Accident; Nakanishi, T.M., Tanoi, L., Eds.; Springer Open: Tokyo, Japan, 2016; pp. 247–263. ISBN 978-4-431-55826-2. [Google Scholar] [CrossRef]
  11. Hirose, A.; Kobayashi, N.I.; Tanoi, K.; Nakanishi, T.M. A microautoradiographic methods for fresh-frozen sections to reveal the distribution of radionuclides at the cellular level in plants. Plant Cell Physiol. 2014, 55, 1194–1202. [Google Scholar] [CrossRef] [PubMed]
  12. Tsoulfanidis, N. Measurement and Detection of Radiation (Japanese translation by Eiji Sakai); Gendai Kogakusha: Tokyo, Japan, 1986; ISBN 4-87472-128-1. [Google Scholar]
  13. Brodzinski, R.L.; Brown, D.P.; Evance, J.C., Jr.; Hensley, W.K.; Reeves, J.H.; Wogman, N.A. An ultra background germanium gamma-ray spectrometer. Nucl. Instrum. Meth. Phys. Res. 1985, 239, 207–213. [Google Scholar] [CrossRef]
  14. Shizuma, K.; Fukami, K.; Iwatani, K.; Hasai, H. Low-background shielding of Ge detectors for the measurement of residual 152Eu radioactivity induced by neutrons from the Hiroshima atomic bomb. Nucl. Instrum. Meth. Phys. Res. 1992, 66, 459–464. [Google Scholar] [CrossRef]
  15. IAEA. Decay of the Transactinium Nuclides; Technical Report Series No.261; IAEA: Vienna, Austria, 1986. [Google Scholar]
  16. Shizuma, K.; Nursal, W.I.; Sakurai, Y. Long-term monitoring of radiocesium concentration in sediments and river water along five rivers in Minami-Soma City during 2012–2016 following the Fukushima Dai-ichi Nuclear Power Plant accident. Appl. Sci. 2018, 8, 1319. [Google Scholar] [CrossRef]
  17. Shizuma, K.; Fujikawa, Y.; Kurihara, M.; Sakurai, Y. Identification and temporal decrease of 137Cs and 134Cs in ground water in Minami-Soma City following the accident at the Fukushima Dai-ichi Nuclear Power Plant. Environ. Pollut. 2017, 234, 1–8. [Google Scholar] [CrossRef] [PubMed]
  18. Oba, Y. Radiocesium Contamination in Japanese fir after Fukushima Daiichi Nuclear Power Plant Accident. Ph.D. Thesis, Graduate School of Integrated Arts and Sciences, Hiroshima University, Hiroshima, Japan, 2017. [Google Scholar]
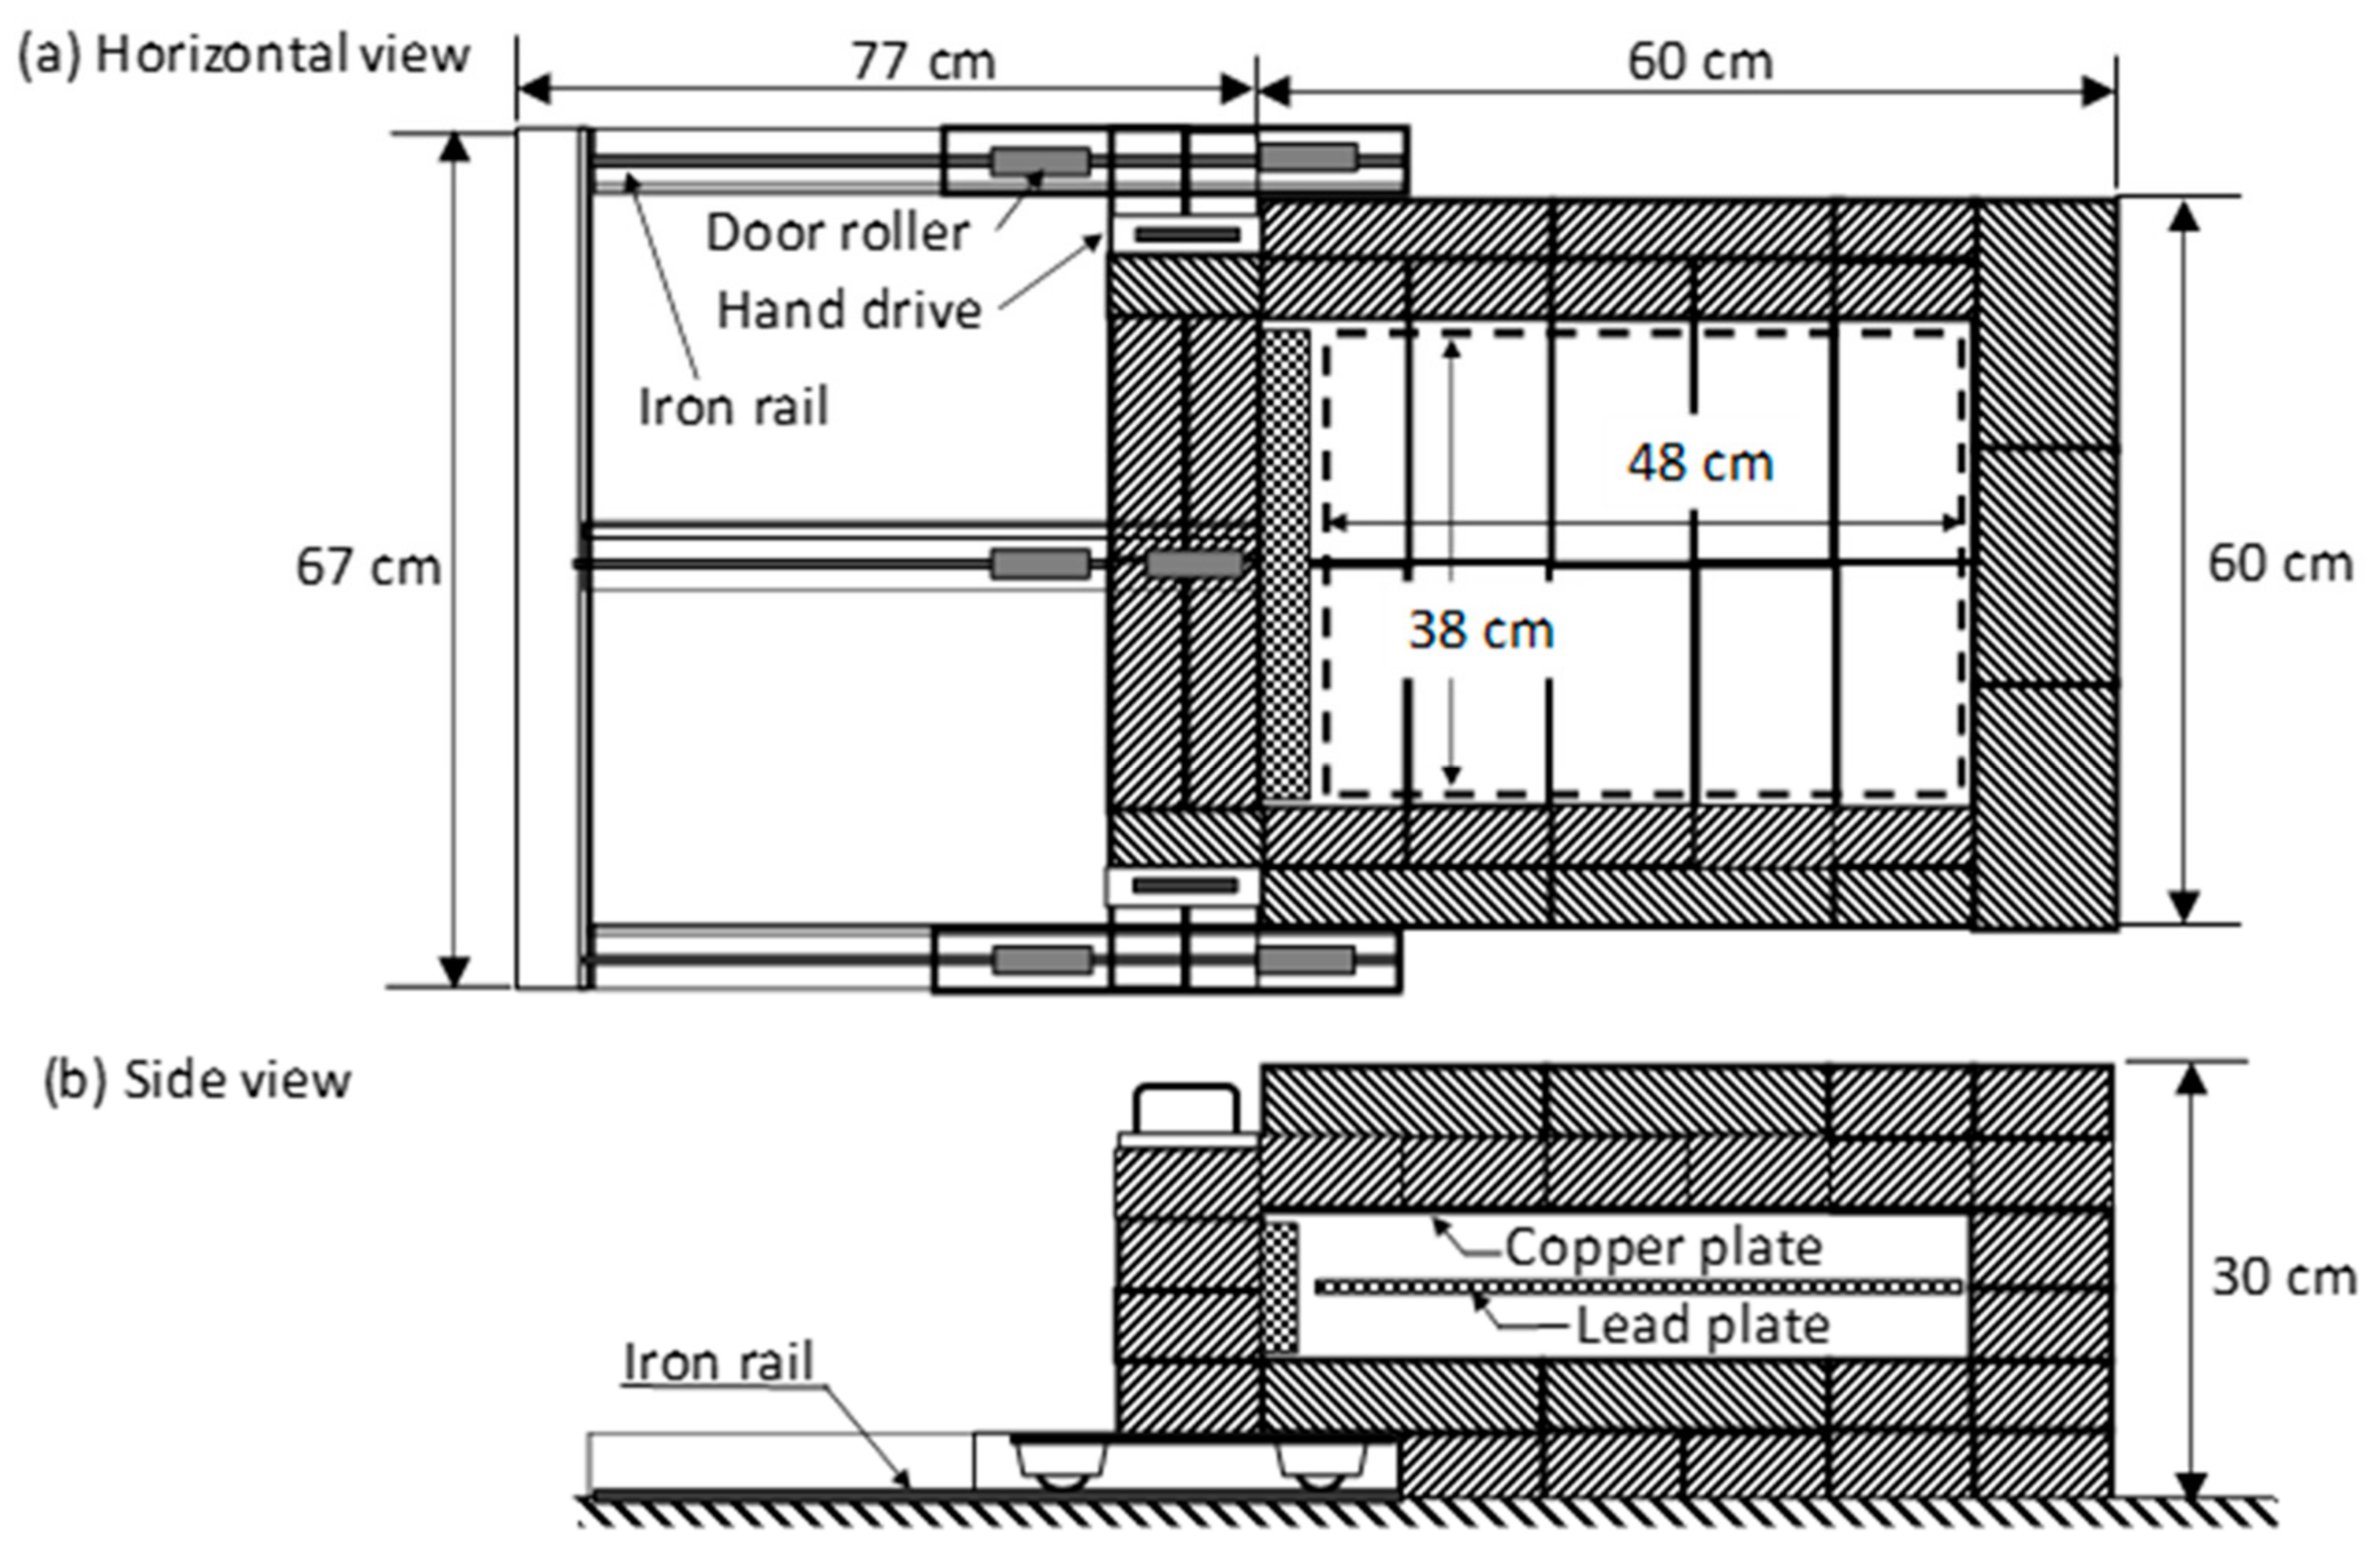
Figure 1. Shielding box for imaging plate: (a) horizontal view and (b) side view.
Applsci 09 05209 g001
Figure 2. Photograph of shielding box.
Applsci 09 05209 g002
Figure 3. Background counting rate as a function of exposure time. Solis lines are smooth polynomials to guide the eye.
Applsci 09 05209 g003
Figure 4. Peak counting rate of 214Pb 352-keV γ-rays against elapsed time measured for Saran wrap unrolled in the 60Co irradiation room (curve A) and in a normal experimental room (curve B) and Al foil unrolled in the 60Co irradiation room (curve C).
Applsci 09 05209 g004
Figure 5. Time-normalized photostimulated luminescence (PSL) counting rate as a function of Al absorber thickness for 241Am.
Applsci 09 05209 g005
Figure 6. Time normalized PSL counting rate as a function of Al absorber thickness for 147Pm.
Applsci 09 05209 g006
Figure 7. Time-normalized PSL counting rate as a function of Al absorber thickness for 90Sr–90Y.
Applsci 09 05209 g007
Figure 8. Time-normalized PSL counting rate as a function of Al absorber thickness for 60Co.
Applsci 09 05209 g008
Figure 9. Time-normalized PSL counting rate as a function of Al absorber thickness for 137Cs.
Applsci 09 05209 g009
Figure 10. Time-normalized PSL counting rate as a function of Al-absorber thickness for KBr.
Applsci 09 05209 g010
Figure 11. Photograph of sediments in irrigation channel in Minami-Soma city, Fukushima, sampled on 30 November 2011 after the Fukushima Daiichi Nuclear Power Plant (FDNPP) accident. (a) The sediment is composed of pebbles, dried-up grasses, and mud. (b) Radioactive imaging of sediments. Highly contaminated hot particles are observed in mud, and dried-up grasses are also contaminated. The small pebbles are less contaminated.
Applsci 09 05209 g011
Figure 12. (a) Photograph of a Momi fir sample from a forest in Fukushima in 2013. The branch was composed of a new shoot (2013), a one-year-old shoot (2012), and a two-year-old shoot (2011). (b) Radioactive imaging of the Momi fir. It is clearly observed that radioactivities are transported from the 2011 shoot to the 2013 shoot.
Applsci 09 05209 g012
Figure 13. (a) Photograph of a mushroom (Inohanadake) sampled at Minami-Soma city, Fukushima, in 2014. Flat and cross-sectional views are shown. (b) Radioactive imaging of the sample. It is clearly observed that radiocesium is highly accumulated at the surface of the mushroom.
Applsci 09 05209 g013
Table 1. Radiation sources and radioactive characteristics used in this work.
NuclideHalflifeRadioctivity(Bq)RadiationEnergy (MeV)Emission Probability a (%)
241Am432.2 y370 kα5.44313.1
α5.48685.2
γ0.02632.4
γ0.059535.7
147Pm2.62 yβ0.224 b100
90Sr28.74 y20 kβ0.546 b100
(90Y)64.1 h β2.2280 b100
137Cs30.04 y370 kβ0.514 b94.6
β1.17 b5.4
γ0.66285
60Co5.271 y370 kβ0.318 b99.92
γ1.17399.99
γ1.33399.98
40K1.277 × 109 yβ1.312 b89.3
γ1.46110.7
a Decay data were taken from IAEA Technical Repoprt Series No.261 [15]. b Beta ray maximum energy.
Table 2. Comparison of background counting rate of IPs for different shielding boxes.
Applsci 09 05209 i001
Table 3. β-ray maximum energy and β-ray attenuation coefficients in Al.
NuclideEβ (MeV)μm (m2 kg−1)μAl (cm−1)
147Pm0.2249.35 252
60Co0.3186.30 170
137Cs0.5143.65 98.5
40K1.3121.25 33.6
90Sr0.5463.38 91.2
90Y2.280.66 17.9