Article

On-Line Tendency Control of Dissolved Oxygen Concentration during Aerobic Fed-Batch Fermentations

1
Key Laboratory of Advanced Process Control for Light Industry (Ministry of Education), Jiangnan University, Wuxi 214122, China
2
Faculty of Automation, Huaiyin Institute of Technology, Huaian 223003, China
*
Author to whom correspondence should be addressed.
Appl. Sci. 2019, 9(23), 5232; https://doi.org/10.3390/app9235232
Submission received: 31 October 2019 / Revised: 28 November 2019 / Accepted: 29 November 2019 / Published: 1 December 2019
(This article belongs to the Section Applied Biosciences and Bioengineering)

Abstract

:
In this paper, an on-line control strategy that aims to guarantee the maintenance of a minimum dissolved oxygen (DO) concentration during aerobic fed-batch fermentations is proposed. It is a difficult task to maintain the DO concentration, especially during fed-batch fermentation, due to strongly nonlinear, variable conditions and probe dynamics. The algorithm uses information contained in the slope of the profile of the DO, as this evolves in a timely way to adapt to process variations. Moving window technology was used to track the DO tendency variation. This method was tested in Corynebacterium glutamicum and Pichia pastoris fermentations. The performance of tendency control was compared with that of manual control. The experimental results clearly show that the on-line tendency control of DO is effective and can also reduce the frequency of activity of the controller as well as the manpower burden.

1. Introduction

Biotechnologies have been extensively utilized in the production of agricultural products, fine chemicals, pharmaceutical products, food processing products, and several other chemical compounds over the last few years. A considerable number of these production processes are aerobic in nature, in which oxygen is necessary for microorganismal growth, maintenance, and product synthesis [1,2,3].
During fed-batch mode, which is the most popular mode for the operation of fermentation processes, the substrate is gradually fed into the bioreactor. Although fed-batch mode is commonly preferred because it is superior at avoiding overfeeding or underfeeding of the substrate, which can inhibit microbial growth and product formation, fed-batch bioprocesses are very difficult to control due to the lack of precise models describing cellular growth, product formation, the nonlinear behaviour of the fermentation process, and the slow process response, as well as the lack of reliable on-line sensors for the quantification of key process variables [2,4].
Microbial population dynamics in bioreactors depend on both nutrients availability and changes in the growth environment. In aerobic fermentation processes, the dissolved oxygen (DO) concentration is one of the most important operating parameters. The measurement and accurate control of the DO concentration is conducive to the calculation of the volumetric oxygen transfer coefficient (KLa), and it is also very important for the understanding of fermentation processes [5,6]. As oxygen deficiency will lead to either cessation of aerobic growth or a decrease in the efficiency of metabolism, as well as the production of undesirable by-products, maintaining a constant DO concentration in the growth medium is required for aerobic fermentation. In addition, the DO concentration must increase as the consumption of oxygen increases to maintain the desired level of biomass concentration and the specific growth rate [7]. Unfortunately, due to its low solubility in water, oxygen is the most limiting substrate for bacteria during fermentation and, as a result, it must be provided continuously [1,8]. Therefore, it is a difficult task to control the DO concentration, especially during fed-batch fermentation, due to strongly nonlinear, variable conditions and probe dynamics [5,9].
There are three methods that are generally used to control the DO concentration during a fermentation process. One of the most frequently employed methods is the manipulation of the agitation speed to improve mass transfer. The second method involves adjustment of the aeration rate, and the third method is based on altering the partial pressure of oxygen in the gas phase [8,10,11]. Nevertheless, increasing the oxygen partial pressure of the inlet gas is often unfeasible, as it requires either the addition of pure oxygen, which is expensive compared to using pure air, or increase of the total pressure, which increases strain on the fermentor [7]. In the last decade, a number of methods of DO control have been developed for use in fermentation processes and reported in the literature. Ertunc et al. developed a self-tuning generalized minimum variance algorithm, the performance of which was compared to that of conventional PID (Proportion Integration Differentiation) control during a fermentation process that utilized Saccharomyces cerevisiae NRRL Y-567 [5]. Johnsson et al. proposed a modified mid-ranging strategy in an industrial bioprocess that was used to control the DO level by manipulating the aeration rate and agitator speed [7]. In a study by Jin et al., a combinational induction strategy utilizing low induction temperature and high dissolved oxygen concentration was employed for porcine interferon-α production using recombinant Pichia pastoris; the aeration and agitation rates were modified by manual adjustment [12].
In fed-batch fermentation processes, it is difficult to maintain the dissolved oxygen concentration precisely at a given set point because various factors, such as air composition and the substrate feed rate, influence its real value; both PID and manual control have been previously used to control the level of DO, but the range in which the DO concentration can be maintained is fairly wide. In addition, the poor performance of PID control can be attributed to the large variations in DO that occur during fed-batch fermentation. This difficulty can be dealt with by maintaining the oxygen concentration at a high enough set point that oxygen limitation does not occur in the presence of these large variations. Generally, the objective is not to allow the DO level to drop below a critical limit where the quality of the fermentation product is affected. As any deviation from the desired set point for DO could lead to a decrease in the product quality, which provides a strong incentive to automate the maintenance of DO levels [13,14]. In addition, the inherent characteristics of a large time delay and the resulting stochastic disturbances in the fed-batch process will cause the controller to have high activity and levels of DO to oscillate abruptly near the set point, which will reduce the life of the control equipment as a result of oscillations in DO. The aim of this study is to propose a simple oxygen control approach that uses automated supervision of operation instead of manual operation to limit the risk of oxygen limitation during the fermentation process. This approach is demonstrated using cultures of Corynebacterium glutamicum and recombinant Pichia pastoris, but can easily be adapted for use with other fermentation processes.

2. Materials and Methods

2.1. Corynebacterium Glutamicum Fermentation

2.1.1. Fermentation Conditions

C. glutamicum S9114 was used. The protocols used, including the seed microorganisms and media, were as described in a previous study [15].
The composition of the media and the fermentation conditions were identical to those previously described [15,16,17]. C. glutamicum S9114 was cultured for glutamate production at 32 °C in a 5 L fermentor (BIOTECH-5BG, Baoxing Biotech Equipment Co., Shanghai, China). The substrate concentration was maintained at or above a suitable level (15 g/L) by feeding 50% (w/w) glucose (initial volume of 3.4 L) throughout the fermentation period. The pH was maintained at 7.1 ± 0.1 by automatic addition of ammonia in water (25%, w/w), which also provided the nitrogen source for glutamate synthesis. The DO was maintained at various levels via manual or automatic control of the agitation speed based on specific requirements. The fermentor pressure was maintained at 0.07 MPa with an aeration rate of 1.60 vvm.

2.1.2. Analytical Methods

The concentrations of glutamate and cells were measured as previously described [17]. The O2 and CO2 concentrations in the exhaust gas were measured with a gas analyser (LKM2000A, Lokas Co., Korea); DO was continuously monitored by a sterilizable polarographic electrode (Mettler-Toledo), the DO electrode was calibrated by a zero-point fixed technology; the CO2 evolution rate (CER) and O2 uptake rate (OUR) were calculated accordingly.

2.2. Pichia pastoris Fermentation

2.2.1. Microorganism and Fermentation Conditions

The expression plasmid pPICZ-αIFN was constructed by the ligation of the pINF-α gene into pPICZα (Invitrogen, Carlsbad, CA, USA) downstream of the promoter (AOX1). pPICZ-αIFN was linearly integrated into the chromosomal DNA of the host P. pastoris KM71 (Muts his-, PAOXII, Invitrogen, Carlsbad, CA, USA) prior to transformation. P. pastoris KM71 was obtained from the Animal Husbandry and Veterinary Research Institute, Shanghai Academy of Agricultural Science, China and was used for pIFN-α gene expression.
The seed medium contained peptone (20 g/L), glucose (20 g/L), yeast extract (10 g/L), and PTM1 (10 mL/L). The batch medium used in the jar fermentor (pH 6.0) contained MgSO4 (1 g/L), glycerol (20 g/L), K2SO4 (1 g/L), CaSO4 (0.1 g/L), H3PO4 (2%, v/v), (NH4)2SO4 (5 g/L), and PTM1 (10 mL/L). The feeding medium (pH 6.0) contained (NH4)2SO4 (0.5 g/L), glycerol (500 g/L), MgSO4 (0.03 g/L), KH2PO4 (0.5 g/L), and PTM1 (10 mL/L). The methanol induction medium (pH 5.5) contained (NH4)2SO4 (0.5 g/L), methanol (500 g/L), MgSO4 (0.03 g/L), KH2PO4 (0.5 g/L), and PTM1 (10 mL/L) [18,19].

2.2.2. Analytical Methods

The fed-batch cultivation was conducted in a 10 L fermentor (GUJS-10, Zhenjiang East Biotech Equipment Co., Zhenjiang, China) equipped with on-line DO/pH measurement instrumentation. The DO concentration was maintained above 10% by a manual step-wise increase in agitation. The cell cultivation and pIFN-α induction methods were conducted as described in a previous study [18].

2.3. DO Control Model

2.3.1. DO Tendency Control Model

The model used in this method is described by the equation
Y t = a + b t + ε t
where Y t is the DO, b is the slope, which indicates the present tendency variation of DO over the time of fermentation ( t ), a is the intercept, t is the time, where the initial time is defined as minute 1, and ε t represents the random errors [20].
After determining the average per minute values, the coefficients are calculated using least squares regression. Therefore, the estimates of the slope and intercept are described by:
b ^ = ( Y Y ¯ ) ( t t ¯ ) ( t t ¯ ) 2
a ^ = Y ¯ b ^ t ¯
where Y ¯ and t ¯ are the arithmetical means of Y i and t i , respectively.

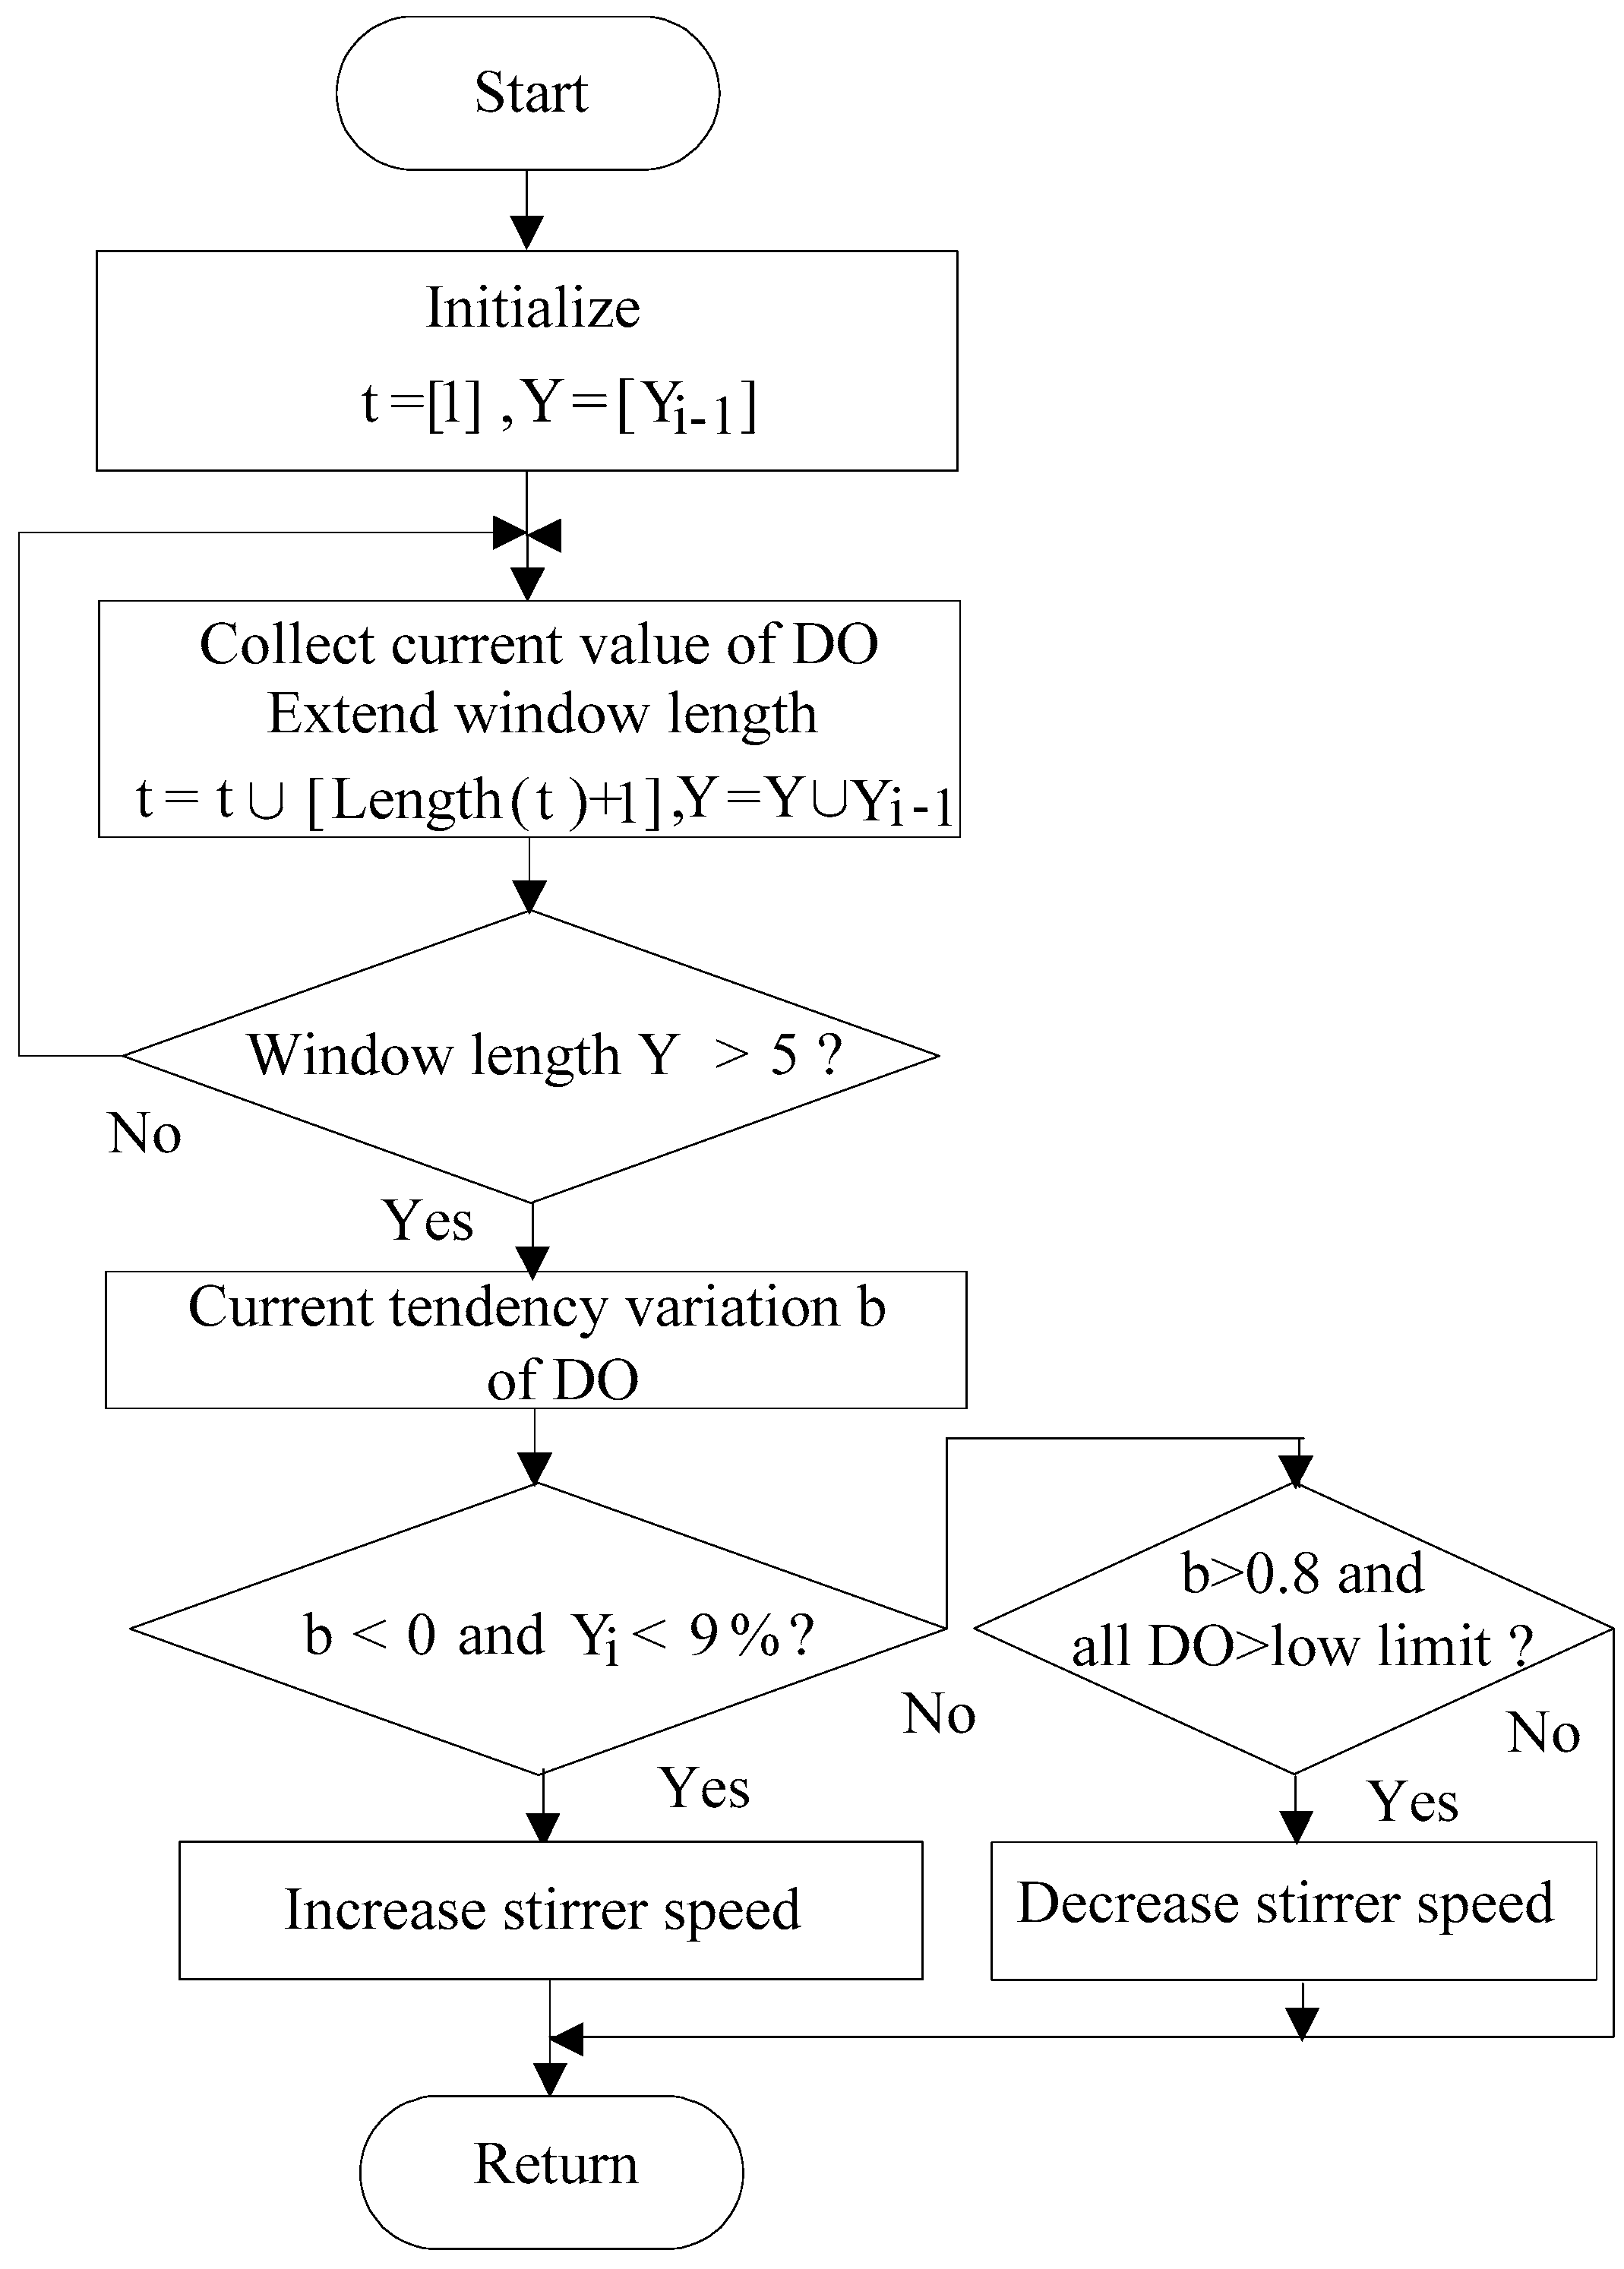
2.3.2. DO Control Algorithm

During the initial growth phase, as the oxygen demand increased due to the gradual increase in biomass concentration, the DO rapidly decreased. The following parameters were assumed: DO tendency variation is b, the DO set point is DOset, the DO measured value is DOmeasured, and the dead zone width of the actuator is Wdead-zone, also known as dead band, the region of insensitivity of a actuator. If b < 0 and DOset − DOmeasured > Wdead-zone, the DO concentration was monitored with a DO probe and maintained at a set point by increasing the airflow rate and, subsequently, the stirrer speed. The DO control and fermentation data recording interval for DO-Stat (‘traditional’ or improved) was set to 1 min. Once the substrate was depleted, the DO level began to rise; if b > 0 and DOset − DOmeasured < −Wdead-zone, substrate was fed to the fermentor via a peristaltic pump controlled using a DO-Stat (‘traditional’ or improved) method. The DO level decreased once again as recoverable cell metabolism, and biosynthesis of the fermentation product increased after the substrate was supplied. Figure 1 illustrates the algorithm used as part of the DO tendency control strategy [21].
As the fermentation process continued, the characteristics of the biochemical dynamics changed significantly over time; moving window (MW) technology was used to track the variation tendency of the DO. It was necessary to add the newest data and discard the old data as the DO level changed; in fact, the selection of the window length was one of the most challenging aspects of DO control. Sufficient information could be included to determine the actual trend in the change of DO levels by setting an appropriate window size; a suitable window length ensured that the sampling data reflected the process dynamics. If the window size was too large, the automated control of DO lagged. If window size is too small, the DO variation trend was disturbed by noise in the data caused by the fermentation process. Subsequently, the data window was updated by inserting the current data point and dropping the oldest value, which enabled the DO control algorithm to adapt to variations in the fermentation process [22,23,24]. For different fermentation processes, the window size was set to different values, which were determined by trial-and-error.
Because of stochastic disturbances occurring during the fermentation process, the DO values obtained for each time point were unreliable because they were outside the desired range. In addition, this caused the controller to have high activity, which may damage the control equipment. At the same time, the DO level fluctuated dramatically around the set point. This challenge could be overcome by utilizing the measurement of DO within a moving window over time; the stirrer speed was intermittently adjusted in accordance with the DO variation tendency that was determined based on the current data window, rather than every data point [25].
Figure 2 shows the control structure used for DO during Corynebacterium glutamicum fermentation. The window size was set to 5 min, with five data points. The DO was maintained at or above 10% of air-saturation; its low limit was set to 9%.
The control structure used for DO during Pichia pastoris fermentation is shown in Figure 3. As it utilizes a longer DO control cycle, the window size was set to 30 min, with 30 data points. The DO was maintained at or above 10%.

3. Results and Discussion

Tendency control strategies for DO were tested during fermentation with C. glutamicum and P. pastoris. These experiments demonstrated the effectiveness of the tendency control method during real fermentation processes. During C. glutamicum fermentation, the DO was maintained at or above 10%, and the low limit was set at 9%; during the second fermentation, the DO was maintained at or above 10%.

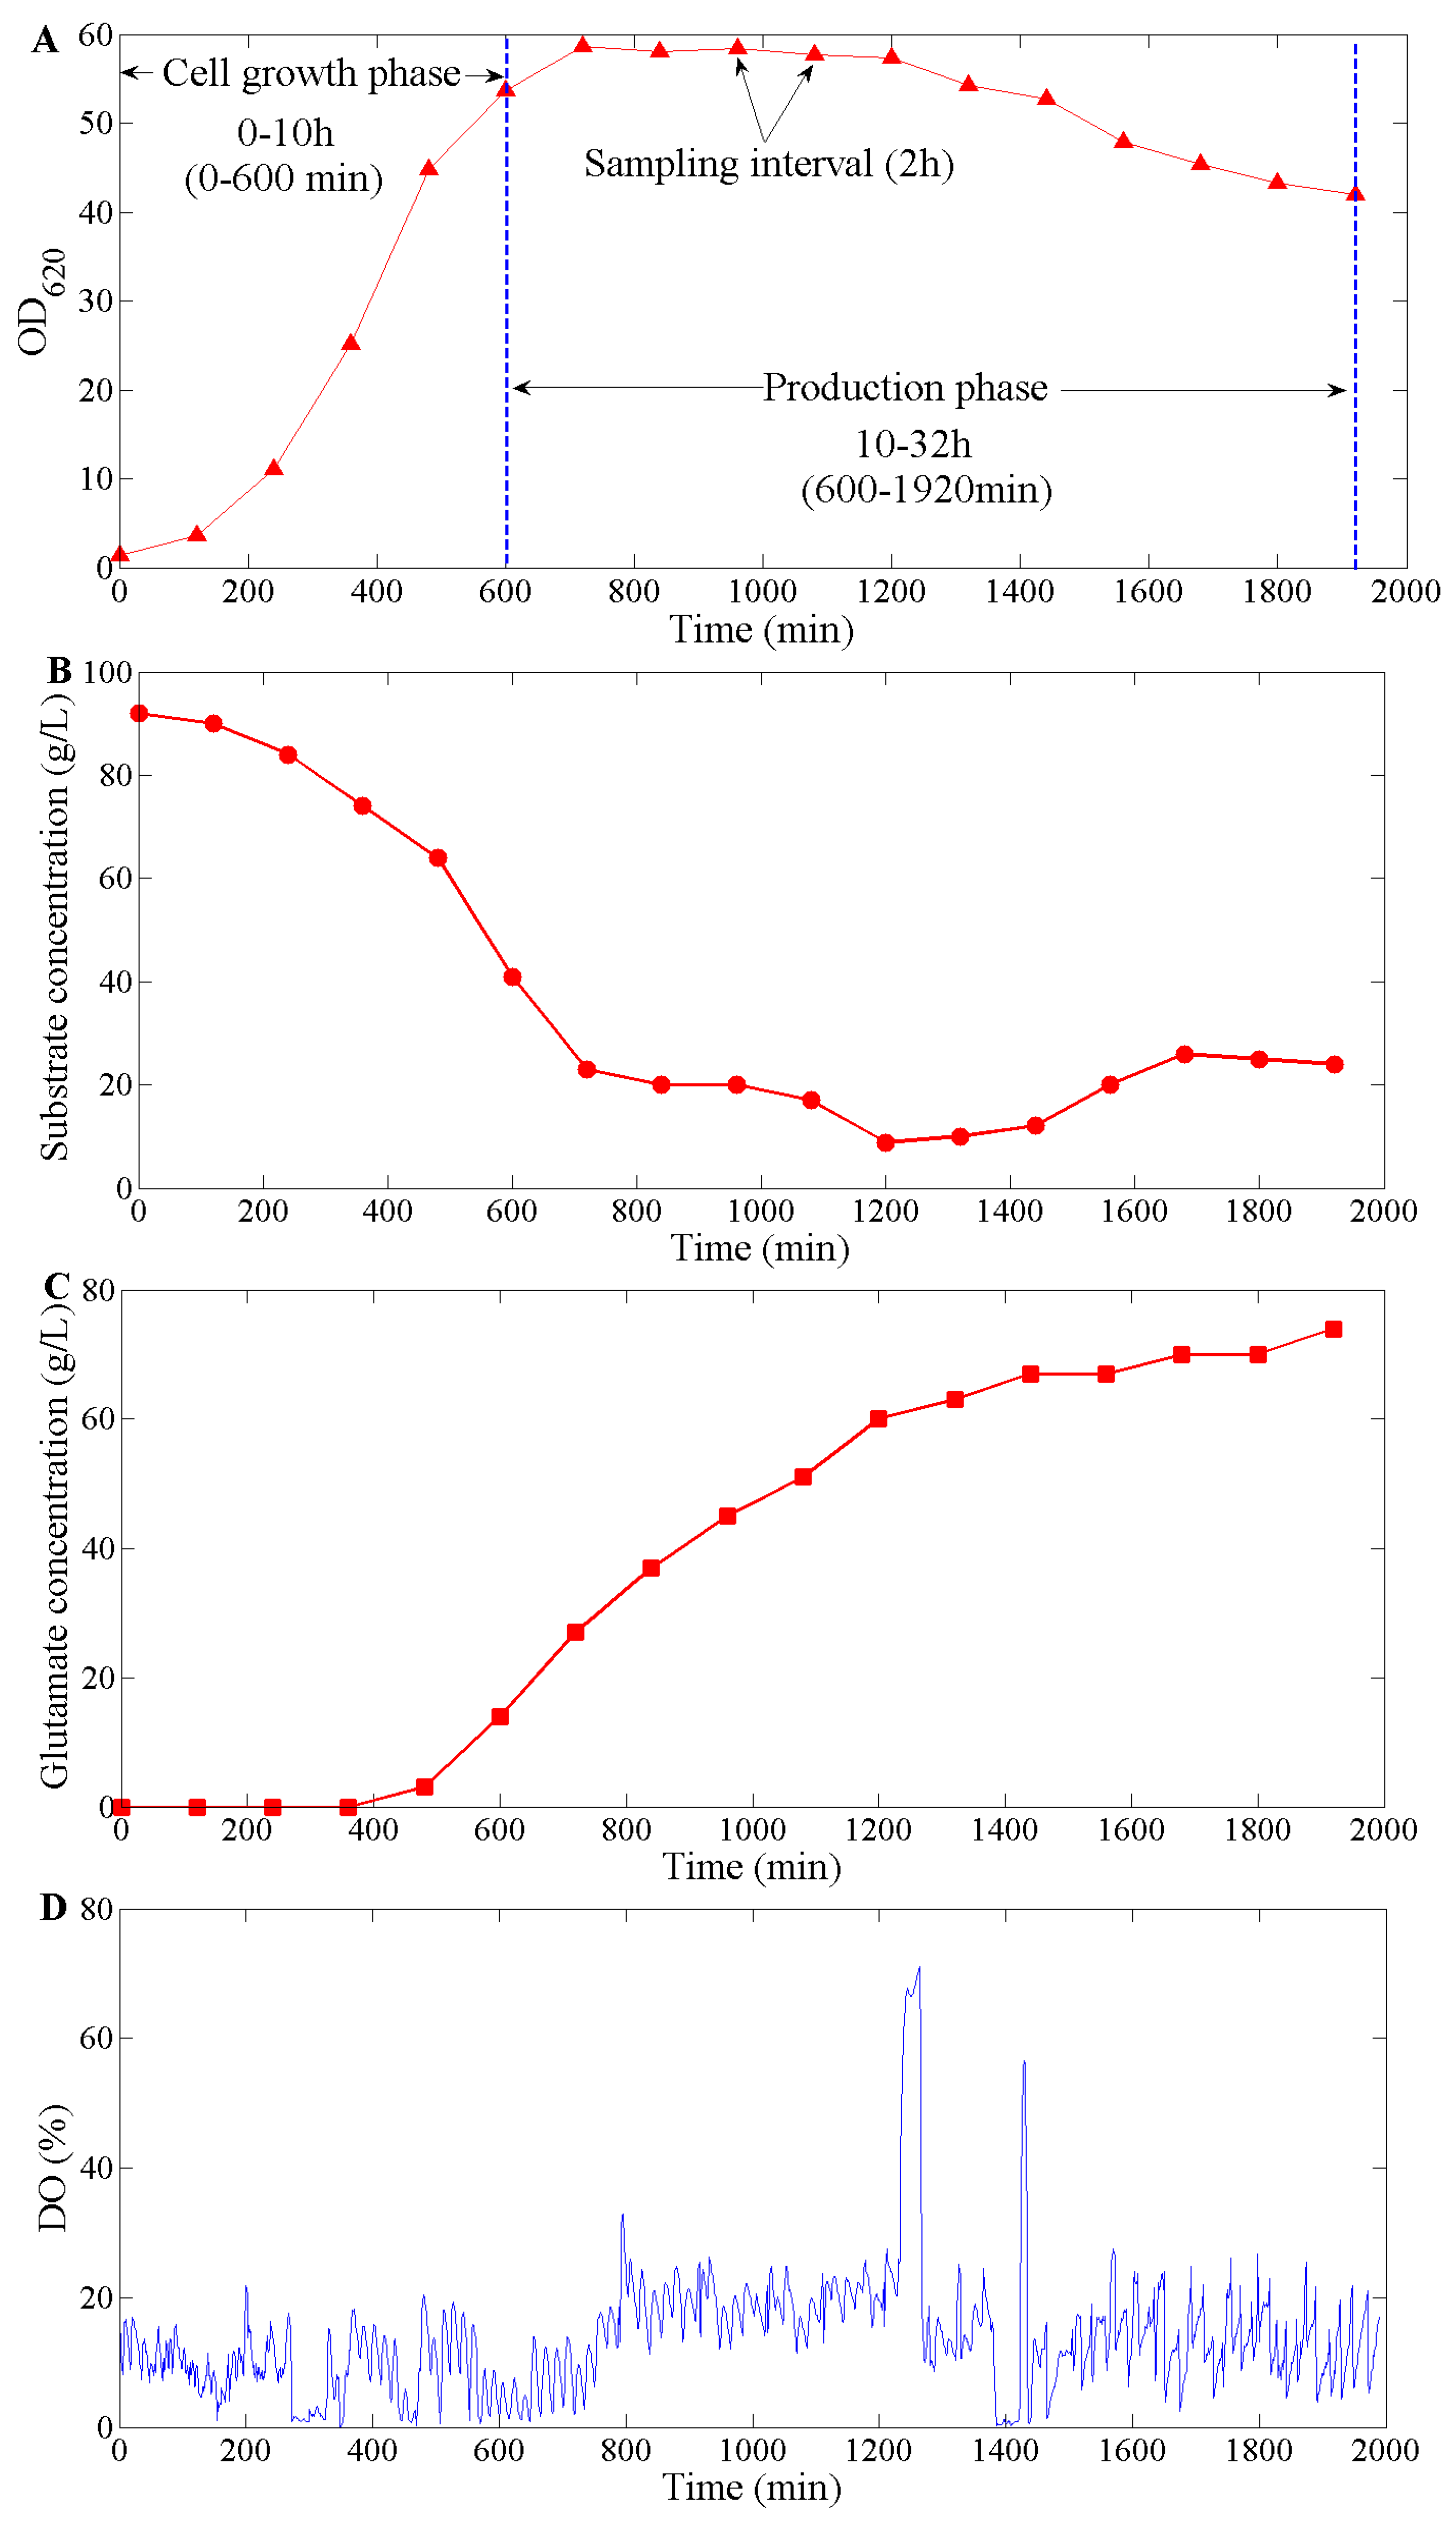
3.1. Performance during C. glutamicum Fermentation

The time profile of cell/glutamate concentrations, substrate concentration, and stirrer speed, as well as DO are depicted in Figure 4.
Glutamate production is a typical non-growth associated fermentation process. During growth phase (0–10 h), cells grows exponentially and glutamate production does not occur. In production phase (10–32/34 h), glutamate extensively accumulates and cell growth ceases [17].
As can be seen from Figure 4, DO concentration started decreasing after about 2–3 h of fermentation and reached close to zero during the cell growth phase. The fall of DO in fermentation broths was due to the high demand for substrate utilization during the exponential phase of the organism, and the subsequent increase was due to lower demand. The gradual increase in the stirrer speed to a maximum (up to around 900 rpm) at about 400 min reflected this characteristic. Additionally, the agitation speed was chosen to render a proper mixing while avoiding excessive shear forces that may have caused cell rupture [26]. After crossing the maximum, the stirrer speed gradually decreased to about 550 rpm at 32 h, in the latter part of the fermentation process. Furthermore, as Figure 4D shows, two DO values were very high, this is because the substrate was depleted and the DO concentration began to rise sharply. DO in the broth was the result of a balance of its consumption rate in the cells and the rate of oxygen transfer from the gas to the liquid phase.

3.1.1. DO Tendency Control in Cell Growth Phase

The tendency control method was applied to maintenance of DO levels in the cell growth phase during C. glutamicum fed-batch fermentation. The results are shown in Figure 5 and Table 1.
For the purposes of comparison, the results of the DO manual control experiments, which were carried out with step-wise manual increase or decrease of agitation, are also depicted in these figures. As shown in Figure 5B, the stirrer speed was gradually increased from 255 rpm at 1 min to 284 rpm at 45 min. During the growth phase, large amounts of oxygen were often required for substrate utilization. As seen in Figure 5A, the range of DO concentrations was fairly large. The actuator was frequently under action during manual control of DO; in contrast, the actuator was much less active when the tendency control method was used. From 0 to 45 min, the actuator acted only three times. Furthermore, a negative DO tendency variation was a precondition for the initialization of tendency control. Although the actual values for DO were 8.2% at 5 min, 8.9% at 17 min, and 8.6% at 34 min, all of which were less than the DO low limit of 9%, and the average value was greater than 10%. In addition, due to negligence, the manual controller failed to increase the stirrer speed at 34 min in a timely fashion, which caused a decrease in DO to 7.3% at 35 min; however, during the DO tendency control experiments there were no such issues.

3.1.2. DO Tendency Control in Production Phase

The tendency control method was applied to maintenance of DO levels in production phase during C. glutamicum fed-batch fermentation, the results are shown in Figure 6 and Table 2.
As shown in Figure 6B, the stirrer speed was gradually decreased from 646 rpm at 1565 min to 625 rpm at 1609 min. As shown in Figure 4E, after crossing the maximum, the stirrer speed gradually decreased in the latter part of the fermentation process. This case may be due to decrease of oxygen requirements in the production phase. As seen in Figure 6, the range of DO concentrations was fairly large. The actuator was frequently under action during manual control of DO; in contrast, the actuator was much less active when the tendency control method was used. From 1565 to 1609 min, the actuator acted only 2 times. Furthermore, b > 0.8 and all DO > low limit were preconditions for the initialization of tendency control. Although the tendency variation values for DO were b4 = 0.98, b5 = 0.71, b6 = 0.39, b7 = 1.25, and b8 = 3.04 respectively, all of which were bigger than 0, the actuator acted only at 1570 and 1603 min. The tendency control algorithm also works well in the production phase of glutamate fermentation.

3.2. Performance during P. pastoris Fermentation

The time profile of cell concentrations and DO, as well as stirrer speed were depicted in Figure 7. Heterologous protein production by fed-batch culture with P. pastoris is mainly divided into two phases: a growth phase to accumulate large amount of cells with glycerol as the carbon source, and an induction phase by feeding methanol for heterologous protein expression [12,27].
As P. pastoris is a slow-growing species, it requires a longer fermentation period during experimental set up. It has a comparatively longer DO time control period; therefore, the window size was set to 30 min. The results are shown in Figure 8 and Table 3.
For the purpose of comparison, the results of the DO manual control experiments, which were carried out by step-wise manual increase or decrease in agitation, are also shown in these figures. Figure 8A depicts the pattern of changes in DO using DO-Stat (‘traditional’ or improved) during a 300 min period in the glycerol fed-batch phase.
DO-Stat control relies on the presence of continuous oscillations in DO levels to function; when glycerol levels are depleted, the cells are forced to use nitrogen sources for the maintenance of metabolic and respiratory activities, which causes the DO level to begin to rise. The sharp increase in the DO level functions as a feedback indicator and leads to subsequent glycerol feeding; after the glycerol is supplied, cells will prioritize the use of glycerol, which will lead to the rapid decrease of DO levels. If the same actions are performed repeatedly, then DO will oscillate continuously. The DO-Stat (‘traditional’ or improved) glycerol feeding strategies are initialized with the aid of control programmes.
As indicated in Figure 8B, the stirrer speed was increased from 600 rpm at 1220 min to approximately 800 rpm at 1509 min. As shown in Figure 8A, the range in the DO level was greater (10–95%). The actuator was also frequently under action during manual control of DO; in contrast, the actuator was much less active when the tendency control method was used. From 1220 to 1509 min, the actuator only acted two times. Although the actual values of DO were 9.9% at 1341 min and 9.8% at 1469 min, both of which were below the DO low limit of 10%, the average DO value was greater than 10%. Moreover, at 1469 min, the manual control failed to detect when the DO level fell below 10%, which produced a time delay of 6 min; during the DO tendency control experiments, all processes were initialized in a timely fashion. More importantly, the stirrer speed remained at an almost constant level after experiencing a sharp peak at approximately 1341–1348 min. For the aforementioned reasons, the automatic control of DO is necessary to conduct a fermentation process efficiently, and can lead to improved process reliability as well as reduced manpower input.

4. Conclusions

In this work, we have proposed a new algorithm for use in controlling DO during fermentation. Since the activity of microorganisms is easily affected by fluctuations in environmental conditions, automatic control is essential to conduct a fermentation process efficiently. This approach is demonstrated using cultures of C. glutamicum and recombinant P. pastoris, but can easily be adapted for use with other fermentation processes. The experimental results clearly show that it can maintain the DO level above a predetermined value and can also reduce the frequency of activity of the controller as well as the manpower burden.

Author Contributions

R.Z. and F.P. conceived the work. R.Z. performed the experiments. R.Z. and F.P. analysed and/or interpreted the results. R.Z. wrote the manuscript. All authors read and approved the final manuscript.

Funding

This research was funded by the National Natural Science Foundation of China, grant number 61273131.

Acknowledgments

The authors thank Yanpo Li for improving this manuscript.

Conflicts of Interest

The authors declare no conflict of interest.

References

  1. Mendes, C.E.; Badino, A.C. Oxygen transfer in different pneumatic bioreactors containing viscous Newtonian fluids. Chem. Eng. Res. Des. 2015, 94, 456–465. [Google Scholar] [CrossRef]
  2. Nuñez, S.; Garelli, F.; Battista, H.D. Decentralized control with minimum dissolved oxygen guaranties in aerobic Fed-Batch cultivations. Ind. Eng. Chem. Res. 2013, 52, 18014–18021. [Google Scholar] [CrossRef]
  3. Giefer, L.A.; Lütjen, M.; Rohde, A.K.; Freitag, M. Determination of the Optimal State of Dough Fermentation in Bread Production by Using Optical Sensors and Deep Learning. Appl. Sci. 2019, 9, 4266. [Google Scholar] [CrossRef]
  4. Lee, J.; Lee, S.Y.; Park, S.; Middelberg, A.P.J. Control of fed-batch fermentations. Biotechnol. Adv. 1999, 17, 29–48. [Google Scholar] [CrossRef]
  5. Ertunc, S.; Akay, B.; Boyacioglu, H.; Hapoglu, H. Self-tuning control of dissolved oxygen concentration in a batch bioreactor. Food Bioprod. Process. 2009, 87, 46–55. [Google Scholar] [CrossRef]
  6. Mazzoleni, S.; Landi, C.; Cartenì, F.; de Alteriis, E.; Giannino, F.; Paciello, L.; Parascandola, P. A novel process-based model of microbial growth: Self-inhibition in Saccharomyces cerevisiae aerobic fed-batch cultures. Microb. Cell Fact. 2015, 14, 109. [Google Scholar] [CrossRef]
  7. Johnsson, O.; Sahlin, D.; Linde, J.; Lidén, G.; Hägglund, T. A mid-ranging control strategy for non-stationary processes and its application to dissolved oxygen control in a bioprocess. Control Eng. Pract. 2015, 42, 89–94. [Google Scholar] [CrossRef]
  8. Rocha-Valadez, J.A.; Albiter, V.; Caro, M.A.; Serrano-Carreón, L.; Galindo, E. A fermentation system designed to independently evaluate mixing and/or oxygen tension effects in microbial processes: Development, application and performance. Bioproc. Biosyst. Eng. 2007, 30, 115–122. [Google Scholar] [CrossRef]
  9. Wang, X.F.; Chen, J.D.; Liu, C.B.; Pan, F. Hybrid modeling of penicillin fermentation process based on least square support vector machine. Chem. Eng. Res. Des. 2010, 88, 415–420. [Google Scholar] [CrossRef]
  10. Kazemi, M.A.; Bamdad, H.; Papari, S.; Yaghmaei, S. Modeling and control of dissolved oxygen concentration in the fermentation of Glucose to Gluconic Acid. Period. Polytech.-Chem. 2013, 57, 63–70. [Google Scholar] [CrossRef]
  11. Ha, S.; Kim, H.M.; Chun, H.H.; Hwang, I.M.; Lee, J.-H.; Kim, J.-C.; Kim, I.S.; Park, H.W. Effect of Oxygen Supply on Surfactin Production and Sporulation in Submerged Culture of Bacillus subtilis Y9. Appl. Sci. 2018, 8, 1660. [Google Scholar] [CrossRef]
  12. Jin, H.; Liu, G.Q.; Ye, X.F.; Duan, Z.Y.; Li, Z.; Shi, Z.P. Enhanced porcine interferon-α production by recombinant Pichia pastoris with a combinational control strategy of low induction temperature and high dissolved oxygen concentration. Biochem. Eng. J. 2010, 52, 91–98. [Google Scholar] [CrossRef]
  13. Bodizs, L.; Titica, M.; Faria, N.; Srinivasan, B.; Dochain, D.; Bonvin, D. Oxygen control for an industrial pilot-scale fed-batch filamentous fungal fermentation. J. Process Control 2007, 17, 595–606. [Google Scholar] [CrossRef]
  14. Kuprijanov, A.; Gnoth, S.; Simutis, R.; Lübbert, A. Advanced control of dissolved oxygen concentration in fed batch cultures during recombinant protein production. Appl. Microbiol. Biotechnol. 2009, 82, 221–229. [Google Scholar] [CrossRef]
  15. Zhang, C.Y.; Shi, Z.P.; Gao, P.; Duan, Z.Y.; Mao, Z.G. On-line prediction of products concentrations in glutamate fermentation using metabolic network model and linear programming. Biochem. Eng. J. 2005, 25, 99–108. [Google Scholar] [CrossRef]
  16. Xiao, J.; Shi, Z.P.; Gao, P.; Feng, H.J.; Duan, Z.Y.; Mao, Z.G. On-line optimization of glutamate production based on balanced metabolic control by RQ. Bioproc. Biosyst. Eng. 2006, 29, 109–117. [Google Scholar] [CrossRef]
  17. Cao, Y.; Mpofu, E.; Shi, Z.P. A novel metabolic model incorporating directed signal flow diagram with enzymatic activities data for evaluating glutamate yield in glutamate fermentation. Biochem. Eng. J. 2013, 77, 136–146. [Google Scholar] [CrossRef]
  18. Ding, J.; Gao, M.J.; Hou, G.L.; Liang, K.X.; Yu, R.S.; Li, Z.; Shi, Z.P. Stabilizing porcine interferon-α production by Pichia pastoris with an ethanol on-line measurement based DO-Stat glycerol feeding strategy. J. Chem. Technol. Biotechnol. 2015, 89, 1948–1953. [Google Scholar] [CrossRef]
  19. Gao, M.J.; Zheng, Z.Y.; Wu, J.R.; Dong, S.J.; Li, Z.; Jin, H.; Zhan, X.B.; Lin, C.C. Improvement of specific growth rate of Pichia pastoris for effective porcine interferon-α production with an on-line model-based glycerol feeding strategy. Appl. Microbiol. Biotechnol. 2012, 93, 1437–1445. [Google Scholar] [CrossRef]
  20. Hess, A.; Lyer, H.; Malm, W. Linear trend analysis: A comparison of methods. Atmos. Environ. 2001, 35, 5211–5222. [Google Scholar] [CrossRef]
  21. Hu, Z.C.; Zheng, Y.G.; Shen, Y.C. Dissolved-oxygen-stat fed-batch fermentation of 1, 3-dihydroxyacetone from glycerol by Gluconobacter oxydans ZJB09112. Biotechnol. Bioproc. Eng. 2010, 15, 651–656. [Google Scholar] [CrossRef]
  22. Gomes, J.; Menawat, A.S. Precise control of dissolved oxygen in bioreactors-a model-based geometric algorithm. Chem. Eng. Sci. 2000, 55, 67–78. [Google Scholar] [CrossRef]
  23. Yuan, X.F.; Ge, Z.Q.; Song, Z.H. Spatio-temporal adaptive soft sensor for nonlinear time-varying and variable drifting processes based on moving window LWPLS and time difference model. Asia-Pac. J. Chem. Eng. 2016, 11, 209–219. [Google Scholar] [CrossRef]
  24. Zheng, R.J.; Pan, F. Multi-phase support vector regression soft sensor for online product quality prediction in glutamate fermentation process. Am. J. Biochem. Biotechnol. 2017, 13, 90–98. [Google Scholar] [CrossRef]
  25. Li, Y.P.; Chen, J.D.; Pan, F. Online monitoring of fermentation processes based on trend analysis. J. Jiangnan Univ. 2013, 12, 379–383. [Google Scholar]
  26. Amicarelli, A.; di Sciascio, F.; Toibero, J.M.; Alvarez, H. Including dissolved oxygen dynamics into the Bt δ-endotoxins production process model and its application to process control. Braz. J. Chem. Eng. 2010, 27, 41–62. [Google Scholar] [CrossRef]
  27. Ding, J.; Zhang, C.L.; Gao, M.J.; Hou, G.L.; Liang, K.X.; Li, C.H.; Ni, J.P.; Li, Z.; Shi, Z.P. Enhanced porcine circovirus Cap protein production by Pichia pastoris with a fuzzy logic DO control based methanol/sorbitol co-feeding induction strategy. J. Biotechnol. 2014, 177, 35–44. [Google Scholar] [CrossRef]
Figure 1. The algorithm used for dissolved oxygen (DO) tendency control.
Applsci 09 05232 g001
Figure 2. DO control structure for Corynebacterium glutamicum fermentation.
Applsci 09 05232 g002
Figure 3. DO control structure for Pichia pastoris fermentation.
Applsci 09 05232 g003
Figure 4. The time-course changes in C. glutamicum fermentation. (A) Changes in OD620 (cell concentration) with time, (B) changes in substrate concentration (glucose concentration) with time, (C) changes in glutamate concentration with time, (D) changes in DO concentration with time, and (E) changes in stirrer speed with time.
Applsci 09 05232 g004aApplsci 09 05232 g004b
Figure 5. Performance in cell growth phase during C. glutamicum fermentation. (A) DO control using the tendency control strategy and (B) comparison of the adjustment of stirrer speed.
Applsci 09 05232 g005aApplsci 09 05232 g005b
Figure 6. Performance in production phase during C. glutamicum fermentation. (A) DO control using the tendency control strategy and (B) comparison of the adjustment of stirrer speed.
Applsci 09 05232 g006aApplsci 09 05232 g006b
Figure 7. The time-course changes in P. pastoris fermentation. (A) Changes in OD600 (cell concentration) with time, (B) changes in DO concentration with time, and (C) changes in stirrer speed with time.
Applsci 09 05232 g007aApplsci 09 05232 g007b
Figure 8. Performance during P. pastoris fermentation. (A) DO control using the tendency control strategy and (B) comparison of the adjustment of stirrer speed.
Applsci 09 05232 g008
Table 1. Action times of actuator for different methods.
Different MethodsFrom 0 to 45 min
Manual control27 times
Tendency control3 times
Table 2. Action times of actuator for different methods.
Different MethodsFrom 1565 to 1609 min
Manual control27 times
Tendency control2 times
Table 3. Action times of actuator for different methods.
Different MethodsFrom 1220 to 1509 min
Manual control99 times
Tendency control2 times

