Abstract
Fatigue assessments of bridges depend on vehicle interactions, occurring when several vehicles travel simultaneously on the bridge or when two individual stress histories, caused by vehicles traveling in different times, generate a more damaging combined stress history. When interactions are significant, stress histories cannot be directly determined using conventional fatigue load models provided in Codes, unless suitable theoretical models for vehicle interactions are available. In the paper, original approaches are proposed to study different aspects of the problem. Concerning interactions due to simultaneity, the novelty is to consider the bridge a service system. Since the process of vehicle arrivals is a Markov process, vehicle interactions can be studied in the framework of the queuing theory. In this way, in the appropriate context, interacting vehicles are equivalent to queued requests (vehicles) in the service system. The method considers two subcases, to be tackled in the given sequence, so that the solution is noticeably simplified. The first subcase refers to vehicles traveling simultaneously in one lane; the second subcase to vehicle and vehicle convoys traveling simultaneously on two or more lanes. In the first subcase the problem is solved considering each lane as a single channel system with a waiting queue, where the number of vehicles in the queue and the waiting time, depending on the number of vehicles in the queue, are limited. A modified vehicle flow on each bridge lane is thus obtained, composed by vehicles and vehicle convoys separately traveling the lane, which is, if relevant, the input for the second subcase. In the second subcase the multilane bridge is modeled as a multichannel system without the waiting queue. When the number of requests exceeds the number of channels, , the surplus is lost and cannot reenter the system. The results regarding simultaneity are much more relevant than it appears at the first sight: Two relevant examples demonstrated that they can be fruitfully used to implement optimized Monte Carlo algorithms for artificial traffic generation, as well for adaptation of traffic measurements, when flows are modified. Finally, a “non-interacting traffic flow” is obtained, whose elements (vehicle, vehicle convoy, cluster of vehicles) travel individually on the bridge. The global stress history results thus a mere random assembly of the stress histories induced by each element of the non-interacting traffic flow. These stress histories can only combine, as simultaneity interactions are excluded for them. Combination of stress histories is a complex issue, especially when, as in the Eurocodes, fatigue load models are composed by a set of standardized lorries. In fact, questions concerning: Conditions for the combination; stress history which can combine; expected number of occurrences of combined stress histories and of the remaining individual ones; are still open. Really, they can be tackled resorting to sophisticated and time-consuming simulations based on Monte Carlo methods, but elementary solutions have not been proposed so far. The original method proposed here, whose practical application is illustrated referring to an important case study, allows to solve the problem providing simple recursive formulae. Finally, two relevant examples illustrate, with specific reference to the Eurocodes, some important implications of the study.
1. Introduction
The study of vehicles’ interactions is a key topic in fatigue assessment of road and railway bridges.
Strictly speaking, two different types of vehicles’ interactions can be identified, depending on two vehicles or more traveling simultaneously on the bridges or not. However, as fatigue assessment is not influenced by cars and light vehicles, for road bridges only lorries need to be considered in practice.
Interactions due to simultaneity originate from vehicles traveling at the same time on the bridge, on the same lane and/or on different lanes or tracks, causing a stress history, i.e., the stress-time diagram that cannot be obtained by the trivial assembly in sequence of the stress histories produced individually by each vehicle. In fact, in this case the stress history depends also on the relative positions of the vehicles instant by instant. Moreover, vehicles’ simultaneity is a relevant problem not only for fatigue assessment, but also for the study of traffic loadings, as well as for more general traffic problems (see, for example [1,2,3,4,5,6,7,8,9]).
Another relevant kind of interactions occurs when the union of two individual, and non-simultaneous, stress histories induces a fatigue damage bigger than the sum of fatigue damages induced by the individual stress histories [10,11]. This ensues as a typical consequence of the application of most common cycle counting methods, such as, for instance, the range pair method; the level crossing method; the range mean method; the reservoir method; and the rainflow method, described in detail in [12,13,14,15,16,17,18]. The phenomenon is particularly emblematic for bridges [19,20], where stress cycles are typically identified by means of the reservoir or the rainflow method.
The study is extremely topical as conventional fatigue load models provided in modern bridge codes, such as EN1991-2 [21] (2003), disregard or include only partially effects of interactions. For example, in EN1991-2 (note 2 of Section 4.6.1(2), items c and e) is explicitly stated that the use of road bridges’ fatigue load models no. 2 and no. 4, which are illustrated hereafter, is allowed only when “the simultaneous presence of several lorries on the bridge can be neglected. If that is not the case, they should be used only if they are supplemented by additional data.”
Obviously, the development of appropriate theoretical models taking into account vehicle interactions and stress history combinations could improve fatigue assessment procedures, extending considerably the field of application of such notional fatigue load models, also providing a means for future improvements of bridge codes. At the same time, these theoretical models may well simplify the generation of artificial traffic samples, better addressing advanced Monte Carlo sampling techniques, such as the stratified sampling or the Latin hypercube sampling [22].
Actually, several different theoretical and numerical approaches have been proposed by different authors to take into account this kind of interaction problems, but they cannot be generalized, since they are specifically addressed to assess some particularly relevant bridge (see, for example [8,9,23,24]).
Starting from the aforementioned considerations, an original procedure has been developed to analytically solve the problem.
The basic idea of the proposed method is that the problem can be considerably simplified identifying and solving in sequence three different cases, each one corresponding to one step of the proposed procedure.
In the first two steps, the simultaneity is tackled in the framework of the queuing theory.
The queuing theory, initially developed by Erlang [25,26,27,28], is the subject of many papers and books [29,30,31], and it is commonly used to approach a wide range of engineering (see, for example [32,33,34]) or social problems [35]. Most recently, it has been also applied to model the effects of breakdown of large network systems [36,37,38,39,40,41], also in view of optimal planning of maintenance interventions.
In the present study, innovative approaches and solutions are proposed to tackle interactions due to simultaneity.
The innovative study stems from the classical queuing theory, hypothesizing that the stochastic process of vehicle arrivals is a Markov process and modeling the bridge as a service system. In addition, the problem has been radically simplified solving in succession two exhaustive subcases:
- Subcase 1 refers to vehicles simultaneously traveling in one lane. This subcase evidently mainly pertains to road bridges, but it could be relevant also for bridges hosting light railway or tramway lanes. In this circumstance, once assigned the vehicle flow in a given time interval, the outcome of the proposed procedure is an adapted vehicle flow on the lane, composed by single vehicles and by vehicle convoys, if any, running individually on the considered lane.
- Subcase 2 refers to simultaneity on different lanes, and it can be extremely relevant also for railway bridges. Starting from the adapted vehicle flows on each lane resulting from subcase 1, the outcome of the method is a suitably modified flow, “non-interacting traffic flow”, composed by single vehicles; convoys; clusters of vehicles and convoys, separately traveling the bridge.
Since the so modified traffic flow is composed by elements which cannot be simultaneously on the bridge, the global stress history can be seen as a random assembly of the individual stress histories induced by each element of the non-interacting traffic flow itself.
These stress histories are not influenced by simultaneity, but can combine, as said before.
Combination of stress histories is a complex issue, especially when, as in the Eurocodes, fatigue load models are composed by a set of standardized lorries. In fact, to apply the model it is not sufficient to consider the individual stress histories, but it is necessary to consider properly also the combined stress histories. With this aim, it is necessary to answer the following questions:
- What are the conditions for the combination?
- In which order stress histories combine each other?
- What is the expected number of occurrences of each combined stress history?
- What is the expected remaining number of occurrences of each individual stress history?
Which were not previously solved, at least in a practicable form.
In reality, these complicated aspects could be in any case faced resorting to sophisticated and time-consuming simulations based on Monte Carlo methods, but undeniably elementary and clear solutions could be extremely helpful.
The innovative methodology proposed in the paper is a powerful tool to deal with the problem, also fixing the conditions that govern the combination.
The main outcomes of the method are recursive formulae allowing to evaluate the expected number of occurrences of the combined stress histories, as well as the expected residual number of occurrences of each individual stress history.
Moreover, the illustration of the practical application of the method in a relevant case study, concerning the evaluation of the stress spectrum at the bottom flange of an orthotropic steel deck, underlines the usefulness and the necessity of such a tool.
Finally, the proposed methodologies have been implemented referring to two important examples regarding influence of the reference length and of the traffic flow on simultaneity effects.
In the first example, the discussion focuses on simultaneity effects on one lane, while in the second example it focuses on simultaneity effect on several lanes. In the second example, it is also discussed some improvement of the values of the damage equivalent factors for multilane traffic effect provided in Eurocodes.
2. Modeling of Vehicles Interactions Due to Simultaneity
As already remarked, the probability that several vehicles are traveling the bridge at the same time can be determined examining two subcases in succession: Firstly subcase 1, vehicles on one lane, and subsequently subcase 2, vehicles or vehicle convoys on two or more lanes.
Referring to a traffic flow consisting of a set of types of (standardized) vehicles, these two subcases can be solved independently, suitably modifying the classical Erlang’s approach to the queuing theory.
Hereafter, let be the reference length of the relevant influence surface and the total flow of vehicles on the -th lane in a given time interval, for example one year.
is the portion of the bridge length which, if loaded, causes significant effects, or, in other words, where the ordinates of the influence surface are not negligible. Evidently, if is the total length of the bridge, it is .
Said the annual flow of the j-th vehicle on the s-th lane, the total annual flow results
Fundamental hypothesis of the theory is that the vehicle arrival is a Poisson’s process. This assumption, suggested by Adam [1] considering that the number of vehicles is very large and that their arrivals are independent of each other, is commonly adopted in modeling flowing traffic and it has been confirmed on experimental basis by several studies, already cited [2,3,4,5,6,7].
Under the additional hypothesis that the time needed to travel a given length is distributed according an exponential law, the process is memoryless; moreover, as known, the exponential distributions are the sole memoryless continuous distribution. In fact, starting from the state of the system at a given time , the evolution of the system for depends only on and not on the previous history of the states of the system itself, i.e., on which way the system reached the state . The stochastic process of vehicle arrivals is then a Markov process.
Said the average speed of the vehicles, the average time to travel the reference length of the influence line is given by , and the rate of the distribution, which may be regarded as the rate of availability of the lane, by . The exponential probability density function of the time that a vehicle takes to travel is:
2.1. Interactions between Vehicles Simultaneously Traveling on One Lane
The probability that exactly vehicles are traveling simultaneously one lane on the length can be calculated considering the bridge or the lane as a single channel system with a waiting queue, where the number of vehicles in the queue and the waiting time, depending on the number of vehicles in the queue, are limited. The probability is thus the probability that vehicles are queued.
Clearly, said the minimum distance between the first axles of two consecutive vehicles, the situation corresponding to exactly vehicles traveling simultaneously on one lane is that outlined in Figure 1, being the -th vehicle outside the length .

Figure 1.
Outline of the model with exactly vehicles traveling simultaneously on one lane.
For the aim of the study, the evaluation of the maximum number of simultaneously traveling vehicles, is particularly significant.
Since the distance between two consecutive lorries cannot obviously be nil, the waiting time for the -th vehicle in the queue depends on the maximum extent of the part of the reference length where the -th vehicle can be located, provided that all the preceding vehicles are on . With this premise, as illustrated in Figure 2, is given by:
where is the time interval between the arrivals of two consecutive vehicles, and, therefore, the waiting times result is:

Figure 2.
Modeling the maximum number of vehicles traveling simultaneously on one lane.
To solve the problem, it can be hypothesized that the waiting times are distributed again according to exponential probability density functions whose rates are :
The realizable states of the system are:
- the system is free: No vehicle on the lane;
- the system is busy: One vehicle is traveling on the lane;
- ……..:
- the system is busy with requests queued: i.e., i vehicles on the lane;
- ……..:
- the system is busy with requests queued: i.e., w vehicles on the lane.
If at a given time the system is in the state, in the infinitesimal time interval , it can remain in or it can pass in one adjacent state, or . Evidently, when the unique existing adjacent state is and when the unique existing adjacent state is .
Let be the arrival rate of the process, which is the average number of vehicles in the time unit. Following the classical approach, since the probability that during the system jumps directly to other states not adjacent to is infinitesimal of higher order, the variation of the probability in is simply the sum of the probability that the system is in the state at the time and no vehicle enters or leaves the lane during ; plus, if relevant, the probability that the system is in the state at the time and one vehicle arrives during ; plus, if relevant, the probability that the system is in the state at the time t and one vehicle leaves during . Explicitly written, the expressions of lead, after some trivial operations, to the following system of ordinary differential equations:
The probabilities are then the solutions of the system of Equation (5) under the constraint
for the initial conditions
Generally, parameters , and depend on , but in stationary conditions they assume constant values; moreover, since for derivatives , the probabilities are independent on , so that the system (6) plus constraint (7) reduces to the system of linear equations in the unknowns :
The solution of (9) can be obtained by repeated substitutions, with some cumbersome but elementary calculations. Starting from the first equation and going forward in increasing order of , it is possible to express each () as a function of ; thus . is deduced by the last equation of system (9) and from it the expression of each unknown :
From now on, an i-vehicles convoy will indicate a sequence of i vehicles traveling at the same time on the reference length . Obviously, an isolated vehicle is a particular convoy formed by one vehicle only.
Said that the probability that a convoy formed by i vehicles is traveling on the lane, conditional that the lane is occupied,
the expected annual flow of i-vehicles convoys on lane s results
where is the annual flow on the lane, expressed by Equation (2).
The total modified flow, , on the -th lane of the bridge results thus:
being the flow formed by isolated vehicles and convoys.
Further specializing Equation (12), the annual flow of a specific i-vehicles convoy on the lane, composed by i-vehicles belonging to the , ,…., categories of the standardized types of vehicles in the given order, results
In this way, finally, a modified vehicle flow on each bridge lane can be obtained, composed by vehicles and vehicle convoys, under the specific constraint that only one vehicle or one vehicle convoy can travel the lane. Consequently, for these modified flows only simultaneity on different lanes is relevant.
For practical applications, Equation (14) can be markedly simplified; in effect, only the case is relevant, since the effects caused by the simultaneous presence of more than two vehicles are insignificant. In this situation, Equation (10) becomes
and Equation (14) reduces to
Moreover, when the load model is composed by a single standardized vehicle only, Equation (16) can be further simplified as:
Obviously, even here the emphasis is on fatigue assessment and therefore on heavier vehicles, the proposed approach can be used in a much more general context. In reality, in terms of traffic composition, three different options can be envisaged for its practical applications:
- (a)
- As in the present paper, only lorries are taken into account, disregarding the car presence. This safe-sided assumption is widely adopted in studies referring to actions on bridges;
- (b)
- also cars are considered in the flow, in such a way that the probability that vehicles are traveling on the lane is more realistically evaluated, but cars are considered weightless, so that their effects are zero. Obviously also this option pertains to actions on bridges;
- (c)
- all vehicles, cars, and lorries are considered and treated in the same manner, as typical in transport-oriented studies.
Providing a sound “a priori” estimate of the probability that a given number of vehicles is simultaneously on the lane, the particular significance of the achieved results is particularly relevant, also in view of the optimization of Monte Carlo algorithms for generation of artificial traffic samples. In fact, a drastic reduction of the number of random trials of the Monte Carlo method needed to arrive to reliable results is undoubtedly predictable.
In the following Section 2.2, to corroborate this assertion, a practical implementation of the procedure is illustrated.
In any case, it must be underlined that the implementation of the method is not necessarily limited to the generation of the artificial traffic samples: In fact, alternative uses, such as for example the adaptation of real traffic measurements in consequence of modifications of the vehicle flows, can be easily envisaged. The same consideration applies to the method discussed in the subsequent Section 2.3.
2.2. An Optimized Monte Carlo Algorithm for Traffic Generation Considering Single Lane Simultaneity
As anticipated, the method illustrated in Section 2.1 can be efficiently applied to derive an optimized Monte Carlo algorithm for production of traffic samples, next described step by step.
In the implementation of the algorithm, the inter-vehicle distances are generated to suitably fit the theoretical probability that exactly vehicles are traveling simultaneously on the lane.
The algorithm is structured according to the following steps:
- Gather input data:Number of vehicle types or vehicle categories: ;annual flow of the -th vehicles on the -th lane: ;total annual flow on the -th lane (Equation (1)): ;arrival rate of vehicles , i.e., number of vehicles in the time unit:average vehicle speed: [m/s]—for example: ;reference length: [m];the minimum distance between two consecutive vehicles—for example: , which is the sum of the length of the vehicle plus some safety clearance.
- Evaluate:The rate of the distribution: ;the maximum number of vehicles on (Equation (3)): ;the waiting time rates (Equations (4) and (5)): .
- Compute:The probabilities: (Equation (10));the probabilities: (Equation (11));the expected annual flow: (Equation (12));the total modified annual flow: (Equation (13));the ratios:
- Fix and define the step function (Figure 3):
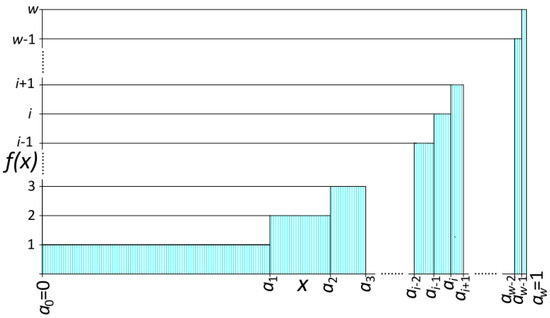 Figure 3. Step function (Equation (20)).
 - Assign a suitable probability distribution function (pdf) describing the position of the vehicle in a given interval: For example, referring to this aspect, adoption of an uniform pdf could be a simple and somewhat natural choice, but there are no restrictions.
- Start the generation.
- Extract a random number and evaluate the step function representing the number of vehicles simultaneously traveling the lane. Depending on the value of enter different subroutines:
- If = 1 then go to step 8;
- if = 2 than go to step 9;
- if > 2 than go to step 10.
- The case = 1 is rather obvious:
- Generate, if necessary, the vehicle typology
- then fix equal the distance between the rear axle of the actual vehicle and the first axle of the next vehicle, otherwise generate it imposing ;
- subsequently, go to step 11.
It must be remarked that in studying actions on bridges, the choice is the optimal one, as it is the minimum distance for which simultaneity does not occur, but in transportation problems it could not be the most appropriate.
- 9.
- The case is illustrated in Figure 4:
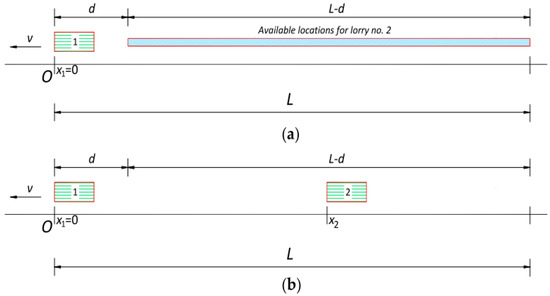 Figure 4. Generation of two simultaneous vehicles: (a) Available locations for second vehicle; (b) relative positions of generated vehicles.
- Generate, if necessary, the vehicle typologies of the two vehicles;
- consider that the first vehicle is at the end of the lane: in this situation (Figure 4a), the available positions for the second vehicle are those in the interval, ;
- generate the position of the second vehicle (Figure 4b);
- since no other vehicles need to be generated, store the data concerning this two-vehicle convoy and go to step 11.
- 10.
- Although they are treated in identical ways, for the sake of clarity, it seems opportune to consider first the case and then the most the general one .
- (a)
- The case is illustrated in Figure 5:
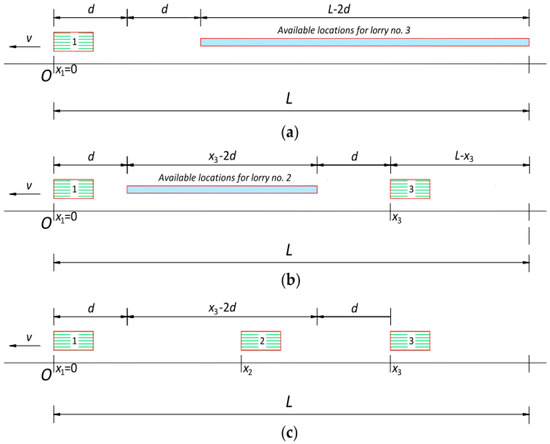 Figure 5. Generation of three simultaneous vehicles: (a) Available locations for third vehicle; (b) available locations for second vehicle; (c) relative positions of generated vehicles.
- Generate, if necessary, the vehicle typologies of the three vehicles;
- consider that the first vehicle is at the end of the lane:
In this situation (Figure 5a), the optimal implementation of the procedure calls for the generation of the third vehicle first; in fact, as other two vehicles are traveling the lane, the positions of the third vehicle belongs to the interval , being the minimum length required to hold two vehicles;- generate the position of the third vehicle;
- since no other vehicles need to be generated, store the data concerning this three-vehicle convoy and go to step 11.
- (b)
- The general case is illustrated in Figure 6:
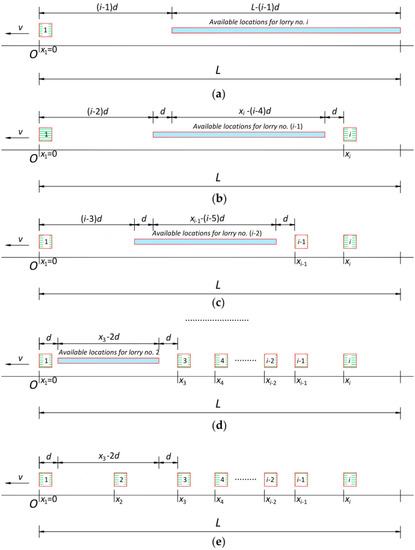 Figure 6. Generation of three simultaneous vehicles: (a) Available locations for -th vehicle; (b) Available locations for -th vehicle; (c) Available locations for -th vehicle; (d) Available locations for second vehicle; (e) Relative positions of generated vehicles.
- Generate, if necessary, the vehicle typologies of the vehicles;
- consider that the first vehicle is at the end of the lane:
On the basis of the previous discussion about case , the optimal implementation of the procedure calls for the generation of vehicles in descending order, starting from the -th (Figure 6a). Evidently, because other vehicles are traveling the lane and the minimum length required to hold vehicles is , the position of the -th vehicle belongs to the interval ;- generate the position of the -th vehicle;
- repeat the procedure for the -th vehicle, etc. until the third and the second vehicle are generated (Figure 6d,e);
- when all the vehicles have been generated, store the data concerning this -vehicles convoy and go to step 11.
- 11.
- Check the total number of generated vehicles: If the number matches that required for the traffic sample end the procedure, or else go back to step 7.
Finally, an artificial traffic sample is obtained, fully complying with the theoretical probability that several vehicles are simultaneously traveling the lane, as well as with the traffic composition.
Obviously, these traffic samples can be suitably used as input data when simultaneity on two or more lanes is investigated, as discussed next.
Of course, although the present study is mainly devoted to traffic loads on bridges, the field of application of the procedure is much wider. In fact, as the procedure allows to deal with traffic composed only by lorries, as well as by lorry and cars, it is suitable also for typical transportation problems.
2.3. Interactions between Vehicles and Convoys Simultaneously Traveling on Two or More Lanes
As already remarked, if simultaneity on one lane is considered through the afore mentioned modified traffic flows, only interactions between vehicles and convoys simultaneously traveling two or more lanes need to be taken into account.
The problem can be reduced again to an Erlang’s problem, modeling the multilane bridge as a multichannel system without the waiting queue. When all channels are busy, or in other words the number of requests exceeds the number of channels , the surplus, discharged by the system, is lost and cannot enter a second time the system (see Figure 7).
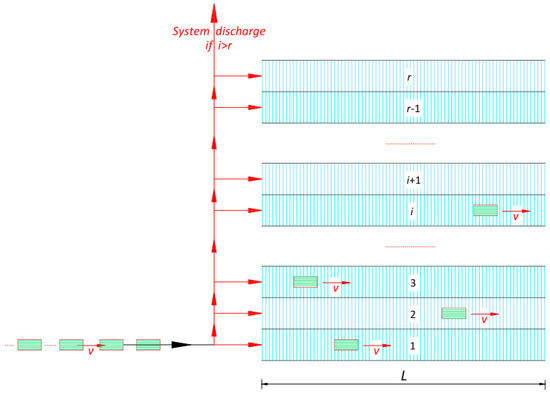
Figure 7.
Outline of the model with vehicles traveling simultaneously lanes.
Obviously, the availability rate considered here can differ from that evaluated in the previous sections.
The channels of the system reproduce the bridge lanes, so that the probability that vehicles are simultaneously on lanes, , corresponds to the probability that channels of the system are busy.
A classical procedure, very similar to that depicted in Section 2.1, leads trivially to the solution of a classical Erlang type problem.
Recalling that the total modified flow, , on the -th lane of the bridge is expressed by Equation (13), the total modified flow on the bridge lanes results
Let be the arrival rate of , i.e., the average number of occurrences of elements (vehicles and convoys) of the total modified flow in the time unit.
The possible states of the system, , are:
- the system is free: No vehicle on the bridge;
- one channel is busy: One vehicle is traveling the bridge;
- ……..:
- channels are busy: vehicles are on different lanes;
- ……..:
- all r channels of the system are busy: vehicles are on the available lanes.
Recalling what was remarked in Section 2.1, the probability Pr,i(t) that i lanes are occupied at time t comes from the solutions of the system of ordinary differential equations
under the constraint
for the initial conditions
Once again, in stationary conditions, and are constant; since for derivatives , the probabilities are independent on and the system of Equations (22) and (23) reduces to the system of linear equations
whose solution, obtained by successive substitution in ascending order, is
The probability that lanes are occupied, conditional that the bridge is occupied, is thus
from which, the expected total annual flow of individual, non-interacting, vehicles or vehicle convoys on different lanes arbitrarily chosen, one convoy per lane, results in:
In view of the fact that simultaneity on the lane cannot occur, being preliminarily taken into account, if relevant, according Section 2.1; one and only one vehicle or vehicle convoy is traveling each lane, the number of interacting vehicles on one lane, when simultaneity involves lanes, trivially results:
Recalling that the number of -combinations in a set of distinct elements, , is the binomial coefficient and that the number of -combinations not containing a given element equals the number of -combinations in a set of distinct elements; the number of combinations involving simultaneity on lanes over lanes, in which a given lane is included is given by:
Consequently, from (29) the quota of interacting vehicles or vehicle convoys pertaining to a specific lane can be derived as:
stressing that the indices specify the number of lanes to which simultaneity refers to, and that implies that no other vehicles are traveling other lanes.
Finally, the modified annual flow on each lane can be derived as:
as well as the total modified annual flow involved in the lane simultaneity, , and the total modified annual flow, :
If the different lanes, are precisely specified, the expected total annual flow on them becomes, instead,
where the sum in the denominator of the left hand member of (34) is extended to all the permutations of distinct elements belonging to the set of the first natural numbers.
Obviously, the number of interacting vehicles on each lane is
In case , Equation (35) coincides with Equation (29).
Moreover, Equations (29) and (35) can be easily modified, as in Section 2.1, to specially consider vehicles belonging to given categories.
Moreover, in the present case, the most relevant real situation refers to two lane traffics. In this case, the probability and are given by
and the expected total number of interacting vehicles by
When different vehicles categories are taken into account on the two lanes, for instance type on lane 1 and type on lane 2, the number of interactions turns to
Arguments similar to those already discussed at the end of Section 2.1 confirm that, also in this case, an appropriate application of the outcomes of the study could sensibly improve the efficiency of Monte Carlo algorithms, minimizing the required number of random trials.
Aiming to summarize the main steps of the procedure, a representative implementation is illustrated in Section 2.4.
2.4. An Optimized Monte Carlo Algorithm for Traffic Generation Considering Multi-Lane Simultaneity
As just anticipated, taking full advantage of the results obtained in Section 2.3, an enhanced Monte Carlo algorithm can be implemented duly considering vehicles traveling simultaneously on two or more lanes.
The algorithm is structured according to the following steps:
- Gather input data:Number of lanes taken into account: ;modified annual flow on each lane (Equation (13)) and its composition in terms of isolated vehicles and convoys, as for example resulting from the algorithm described before in Section 2.2;total annual flow on the lanes (Equation (21)): ;arrival rate of vehicles , i.e., number of vehicles in the time unit:average vehicle speed: [m/s]—for example: ;reference length: [m];
- Evaluate:The rate of the distribution: ;
- Compute:The probabilities: (Equation (26));the probabilities: (Equation (27));the expected annual flows on each lane involved in simultaneity in lanes over :(Equation (31));the annual flows on each lane: (Equation (32))the total modified annual flow involved in simultaneity in lanes: (Equation (34));the total modified annual flow: (Equation (34));the ratios:
- Compute:The binomial coefficients and associate an integer to each set of lanes in combination, :in such a way that each combination of lanes can be univocally identified by means of ;the ratios:
- Fix and define the step function :in such a way the number of lanes in combination, , and the lanes involved in the combination are univocally associated to a given value of , so that they can be determined as the result of a single trial.
Equation (41) has been written considering equiprobable combinations of lanes, but it can be trivially modified to consider combinations which are most likely to occur.
A possible graphical representation of function (44) is given in Figure 8, referring to the case of four lanes (.
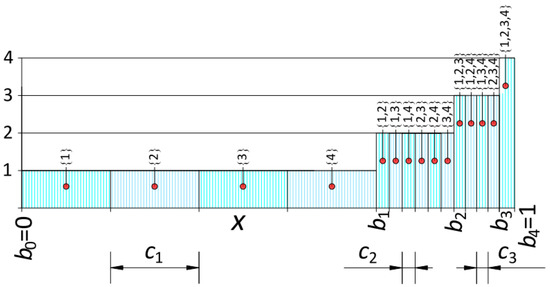
Figure 8.
Graphical representation of step function for identification of lanes in combination ().
- 6.
- Start the generation.
It must be remarked that only one vehicle or vehicle convoy must be generated per occupied lane, because simultaneity on single lanes has been previously considered;
- 7.
- Extract a random number and evaluate the step function , to identify the number of lanes and the lanes involved in the combination itself: . Depending on the value of enter different subroutines:
- If go to step 8;
- if > 1 than go to step 9.
- 8.
- Since simultaneity does not occur and is the unique occupied lane:Generate the vehicle or the vehicle convoy on the lane;
- go to step 10.
- 9.
- When , is the set of lanes involved in the combination (see Figure 9):
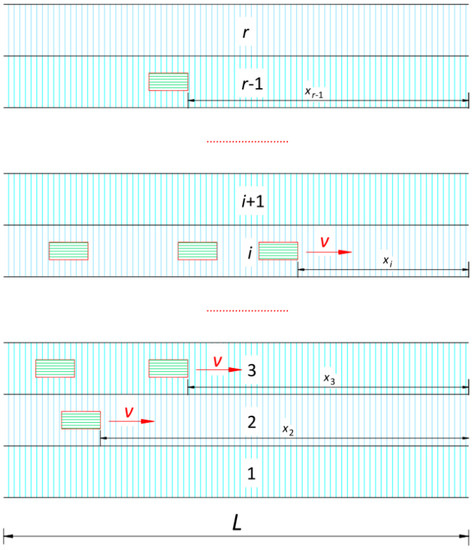 Figure 9. Outline of an example of multilane traffic generation.
- Generate the vehicle or the vehicle convoy on each occupied lane;
- generate the position of the vehicle convoy on each lane and then adjust the values is such a way that the relative positions of vehicles are preserved and that the forward vehicle enter the bridge first
- 10.
- Check the total number of generated vehicles and vehicle convoys: If the number matches that required for the traffic sample end the procedure, or else go back to step 6.
At the end of the procedure an artificial traffic sample is thus obtained duly accounting for the theoretical probability that single vehicles and single vehicle convoys are simultaneously traveling on two or more lanes.
2.5. Flows of Non-Interacting Vehicles
Using the proposed approaches, the probability that several vehicles travel the bridge together on the same lane (subcase 1) or on different lanes (subcase 2) can be evaluated and then the vehicle flows is suitably modified. Moreover, despite their effects it depends also on the shape of the influence surface; the number of vehicles traveling simultaneously on the bridge only depends on the reference length .
The outcome of discussion of subcase 1 (Section 2.1), which is relevant only for road bridges and which takes into account simultaneity on one lane, is a modified flow on each relevant lane formed by isolated -vehicle convoys, also including single vehicles traveling alone.
The outcome of discussion of subcase 2 (Section 2.4), dealing with the multilane case, is a further modified flow, whose elements are isolated vehicle convoys on one lane and groups of vehicle convoys on different lanes, one per lane. This modified flow is extremely specialized, as its elements cannot simultaneously travel the bridge, so that it can be shortly identified as “non-interacting vehicle flow”.
It must be stressed that the procedures described before to account vehicles’ simultaneity are much more general than it might appear at first sight. In fact, they could be easily extended to take into account variations of the vehicle arrival rates during the day or during the year, differentiating two or more cases, for instance concerning daylight and night flows. Once fixed the arrival rates and the total flows of vehicles pertaining to each of them, different cases can be solved separately, using Equation (12) or Equation (14) for one lane (subcase 1) and Equation (25) or Equation (28) for several lanes (subcase 2), being the total number of interacting vehicles simply the sum of the number of interacting vehicles deduced from the solution of each considered case.
3. Modeling of Interactions between Non-Simultaneous Vehicles
Recalling that distinct elements of non-interacting vehicle flow separately travel the bridge, the total stress history caused by the flow itself can be seen as a random assembly of the individual stress histories caused by each element. On the contrary, the total stress spectrum, i.e., the number of cycles and the associated stress variations, cannot be determined, in general, as a pure and simple sum of the individual stress spectra derived from the individual stress histories.
When the maximum stress, , and minimum stress, , of the stress history are caused by distinct individual stress histories [11], the two stress histories interact generating a combined stress spectrum, whose effects, in terms of fatigue, are more relevant than the sum of those produced by the two individual stress histories. As already remarked in Section 1, several cycle counting methods identify this behavior, including, inter alia, rainflow method and reservoir method, currently adopted in fatigue assessment of bridges.
In current practice, this topic is particularly relevant when the fatigue assessments are based on artificial samples of traffic, generated from a number of conventional vehicles’ geometries, as in Eurocode EN1991-2 [21], where fatigue load models are given in terms of sets of standardized lorries and standardized train.
The issue is investigated in the following. Let:
- , , individual element typologies of the non-interacting vehicle flow, be characterized by a number of annual occurrences , , , respectively;
- , or simply , the individual stress history produced by ;
- and , respectively, the maximum and the minimum values of .
Since two elements and of the non-interacting vehicle flow cannot travel the bridge at the same time, they cause individual stress histories at different times, so that phase shift effects are excluded.
However, when one of the following conditions is satisfied,
the two stress histories interact, as illustrated in Figure 10, originating the combined stress history , or .

Figure 10.
Combination of individual stress histories.
In this case, the maximum stress range, , pertains to and the overall stress spectrum comes from the analysis of ; if not, the maximum stress range still pertains to a single stress history and the overall stress spectrum is simply the sum of individual stress spectra (see Figure 11).

Figure 11.
Non-interacting individual stress histories.
If the non-interacting vehicle flow is composed only by element typologies and causing stress histories satisfying conditions (46), the expected number of annual occurrences of the combined stress history trivially results, as the entry of on the bridge is independent on the entry of ,
where and are the annual occurrences of and , respectively.
The remaining expected number of occurrences of and B then are given by
Truly, actual assessment conditions can be not so simple. In fact, as in reality the element typologies to be considered are often more than two, it can happen that a given element typology can interact with several element typologies, therefore participating in various combinations. Aiming to solve this crucial issue, a general procedure is proposed here to identify combinations of individual stress histories.
As mentioned before, in the most general case the total stress history is formed by a random union of the individual stress histories caused by the elements of the non-interacting vehicle flow.
Without loss of generality, it is useful to comment on the example of total stress history illustrated in Figure 12, where , , , indicate the individual stress histories caused by the corresponding element typologies. Looking at the example in Figure 12, it results that the extremes of the individual stress histories are ordered as follows: ; ; consequently, according to conditions (46):
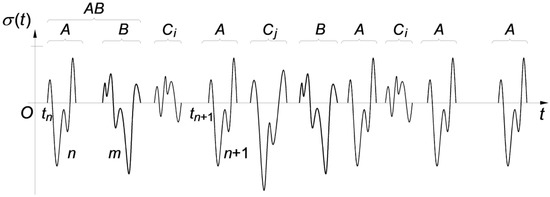
Figure 12.
Example of combination of individual stress histories.
- can interact with ;
- can interact with and ;
- can interact with ;
- cannot interact.
Consider the potential combination of the occurrence no. of and the subsequent occurrence no. of , assuming that rainflow method or reservoir method is adopted. Owing that can also interact with and that , combines with only if the combination with cannot take place. In fact, it can be remarked that:
- Combination concerns, in turns, only two element typologies;
- the occurrence no. n of combines with the occurrence no. of only if the latter takes place in the time interval elapsing between the two consecutive occurrences and of and if any satisfying the condition does not occur in ;
- the combination is independent on the number of occurrences of any , different from and , satisfying both conditions and ;
- a given occurrence of can combine only once: In case it can participate to alternative combinations, the less favorable, i.e., the one characterized by the maximum stress range, will occur;
- the occurrence no. of will not combine at all, if all the stress histories occurring during the time interval elapsing from occurrences no. and no. of , , satisfy the conditions and .
Bearing in mind these observations and taking into account that combinations are governed by the extremes of the stress histories, an original procedure can be setup which, starting from a given non-interacting vehicle flow, allows to determine the number of occurrences of each combined stress history and the remaining number of occurrences of each individual stress history.
For the sake of clarity, consider that the non-interacting vehicle flow is formed by h typologies of elements and indicate with the i-th element typology. Said and the extremes of the h individual stress histories , it is possible to sort them in two different ways, taking the minima in increasing order and the maxima in decreasing order. In this way, two new sets of h stress histories are obtained: ordered according to the minima; ordered according to the maxima, obviously satisfying the expressions:
From expressions (49) and (50) it clearly follows that:
- When coincides with , cannot combine with any other;
- otherwise, can combine with and with the other stress histories satisfying the inequality , 1, that means that takes part to combinations, which are in principle the most aggressive ones;
- reiterating the procedure, it results that combines with other stress histories as long as ; and, more generally, that combines with other stress histories as long as ;
So that all possible combinations (or ) are identified, indeed, and sorted according to the maximum stress ranges in decreasing order.
The number of occurrences of the combined stress histories and the residual number of occurrences of each individual stress history can be now derived by recursive formulae.
Let be the number of occurrences of , , in the assigned non-interacting vehicle flow and be the combination giving the maximum stress range. Since the combined stress history is absolutely equivalent to , in the following the first element of the combination is conventionally the one with the lower minimum, i.e., .
According to what was previously remarked, the combination is not influenced by any occurrence of as, certainly, and . Recalling Equations (47) and (48), the expected number of occurrences of the combined stress history results in:
while the expected residual number of occurrences of after the first combination, , and the expected residual number of occurrences of after the first combination, , becomes
It must be highlighted that the occurrences of and the occurrences of spent in the combination do not take part in other combinations and that cannot further combine with . Therefore, the number of occurrences associated to in the event of a second combination is , and the resulting residual and so on; analogously for .
Finally, if the combined stress history is the result of the -th combination of the stress history and of the -th combination of the stress history , the number of its occurrences is
where and are the occurrences of the individual stress histories and remaining from the previous combinations, and not yet combined, while the remaining occurrences of the individual stress histories, available for subsequent combinations, if any, are given by
The expected residual number of individual stress histories still remaining after all combinations can be equivalently evaluated as
where the summation obviously includes all the occurrences of the combined stress histories , , in which enters.
In conclusion, the total stress history is simply the union of combined stress histories and individual stress histories, provided that all possible combinations are considered. Taking into account that these stress histories cannot interact, the overall stress spectrum is simply the summation of the stress spectra associated with repetitions of combined stress spectra and individual stress spectra.
To better illustrate the procedure, it is applied to a significant case study—Evaluation of Stress Spectrum in a Stiffener to Stiffener Joint of an Orthotropic Steel Deck.
Case Study—Evaluation of Stress Spectrum in a Stiffener to Stiffener Joint of an Orthotropic Steel Deck
The model previously proposed has been applied to a relevant case study: The evaluation, according to Eurocodes, of the stress spectrum in a stiffener to stiffener joint which is one the most fatigue sensitive details in orthotropic steel deck bridges (see, for example [42]).
In short, the steel orthotropic deck is composed by a deck plate 14 mm thick and by trapezoidal longitudinal stiffener, 8 mm thick, and 300 mm height, spaced 600 mm (Figure 13), supported by transverse beams, 620 mm height, spaced 3500 mm.
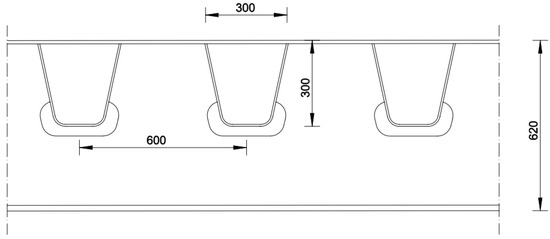
Figure 13.
Cross section of the orthotropic steel deck.
To evaluate the stress histories, the fatigue load model 4 (LM4) of EN1991-2 [21] has been adopted, considering medium distance traffic composition.
LM4, which is a set of five standardized lorries with “equivalent” axle loads, is described in detail in Section 4.1. It is important to remind that axles of standardized lorries are characterized by different tires, so that three different axle typologies are distinguished, indicated with A, B, and C.
On the orthotropic steel deck bridge a main road traffic with low flow rate has been hypothesized. According to EN1991-2 the traffic flow is lorries per year, so that, considering a 100 years design life, the total traffic volume results lorries.
Generally, the most unfavorable situation for the stiffener is when the wheel is centered on its axis, but the stress history in the stiffener itself is also sensitive to variation of the lorry position. For that reason, in some cases, the varying position can be more demanding than that centered on the stiffener, as it will be shown below.
According to EN1991-2, the transverse position of the lorry itself has been considered varying in a band of around 0.5 m, centered on the assumed theoretical position, as indicated in Figure 14, in which are also indicated as the percentage of vehicles running in each subinterval.
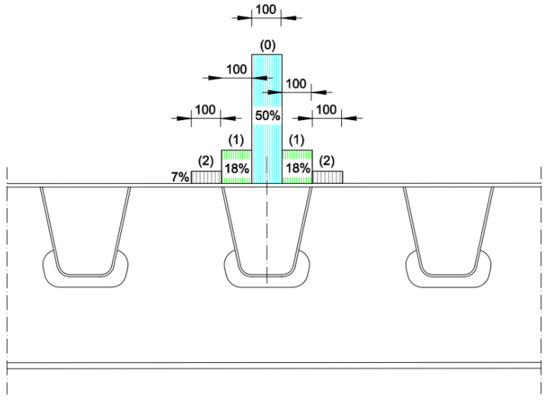
Figure 14.
Band of variation of the transverse position of the vehicles.
Referring to Figure 14, (0) means that the wheel axis is centered on the stiffener, (1) means that the wheel axis is 100 mm distant from the axis of the stiffener, (2) that the wheel axis is 200 mm distant from the axis of the stiffener. On this basis, in the present case study, the lorry and its position are identified by means of the lorry number in LM4 followed by the position; for example, lorry 3 (1) indicates the lorry no. 3, located in position (1), 100 mm distant from the stiffener axis.
The total flows of the vehicles, evaluated according the above mentioned assumptions, are reported in Figure 15.

Figure 15.
Total traffic flows of lorry silhouettes of fatigue load model 4 (LM4) in various positions.
The individual stress history induced by the standardized vehicles of the fatigue load model have been determined considering suitable influence surfaces, which have derived, point by point, by means of a very refined finite element model, reproducing seven spans of the deck, including the transverse beams.
Aiming to allow an easier calculation of the load effects, the influence surfaces have been drawn considering, instead of concentrated loads, unit loads distributed on the appropriate wheel surface, including the effects of the dispersal through the pavement and the deck; reporting the ordinates of the influence surfaces at the center of the loaded area.
Evidently, since these influence surface depend on the dimensions of the loaded area, they are not strictly influence surfaces. For that reason, for each relevant transverse position, three different “influence surfaces” must be derived, one for each axle type.
As an example, the influence lines of the normal stress at the bottom flange of the stiffener at midspan are reported in Figure 16. The curves refer to a 100 kN wheel load in the position (0), i.e., centered on the stiffener axis.
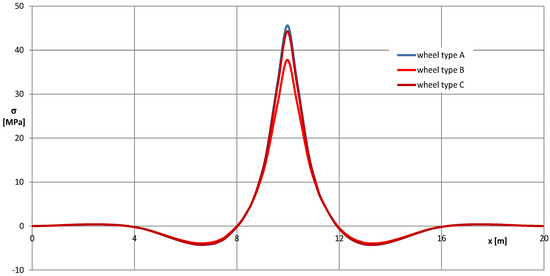
Figure 16.
“Influence lines” of normal stress at the bottom flange of the stiffener at midspan, for a 100 kN wheel load centered on the stiffener axis—position (0).
The absolute maxima and the absolute minima of the individual stress histories are summarized in Figure 17a, while in Figure 17b,c the stress histories are sorted, following expressions (50) and (49), according the maxima in decreasing sequence, and the minima in increasing sequence, respectively.
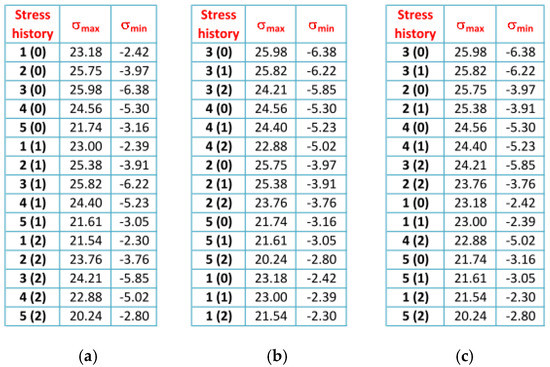
Figure 17.
Absolute maxima and absolute minima of individual stress histories: (a) Sorted according to the sequence of vehicle types and positions; (b) sorted according to the minima in increasing order; (c) sorted according to the maxima in decreasing order.
Investigation of Figure 17, clearly indicates that individual stress histories 3 (0) and 3 (1) do not combine at all, and that, for example the most unfavorable combination is between stress histories 3 (1) (Figure 18a) and 2 (0) (Figure 18b), which originate in the combined stress history 3 (1) and 2 (0), shown in Figure 19. In the above diagrams, represents the position of the first axle of the lorry.

Figure 18.
Individual stress histories: (a) Stress history 3 (1); (b) stress history 2 (0).
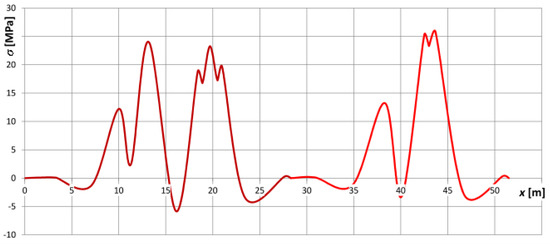
Figure 19.
Combined stress history 3 (1) and 2 (0).
Finally, the effective number of occurrences of each combined and individual stress history, determined by means of Equations (53) and (54), is reported in Figure 20. Evidently, the figure numbers on the diagonal refer to individual stress histories.
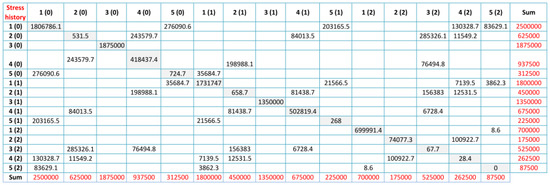
Figure 20.
Number of occurrences of individual and combined stress histories.
As already mentioned, the global stress spectrum is thus the elementary summation of the appropriate number of individual and combined stress spectra.
The global stress spectrum concerning the examined case study is reported in Figure 21, in terms of exceedances of a given stress range .
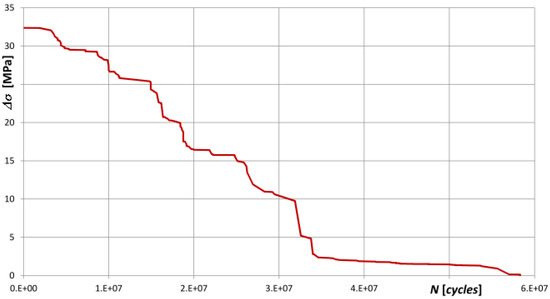
Figure 21.
Global stress spectrum in terms of number of exceedances.
The case study just described exemplifies the advantages of the proposed procedure.
Really, even in a recurring situation, the combination of stress histories can be an issue: Moreover, rather unexpectedly, the results are less favorable if the randomness of the position of the vehicles is duly taken into account, so calling for it.
4. Two Relevant Applications
In order to illustrate the practical implications of the outcomes of the study, two relevant applications for road bridges are considered in the following.
They concern the evaluation of the minimum value of the reference length L beyond which vehicle simultaneity becomes significant, in case of vehicles running on the same lane or in two different lanes, respectively. The case studies are developed referring in particular to Eurocode EN1991-2 [21], even if their validity is much more general.
The results are very important for real applications, as they delimit clearly the field where the EN1991-2 fatigue load models can be directly applied, i.e., disregarding simultaneity.
In the examples, according to EN1991-2, five different lorry flows have been considered: ; ; ; and vehicles per lane per year, spread over 280 working days.
To cover the most significant practical situations, in the first example, concerning simultaneity on one lane, reference lengths have been considered ranging in the interval 50–200 m; while, in the second example, concerning simultaneity on different lanes, have been considered ranging in the interval 10–200 m.
An average lorry speed has been hypothesized, assuming a minimum distance between the first axles of two consecutive lorries, corresponding to a net clearance between consecutive vehicles of 10–15 m. The time interval between two consecutive lorries is then .
4.1. Fatigue Load Models for Road Bridges in EN1991-2
As already mentioned, fatigue load models given in structural codes generally disregard vehicles’ interactions. Aiming to substantiate the examples, fatigue load models for road bridges given in EN1991-2 [21] are summarized here.
EN1991-2 provides five load models for fatigue verifications of road bridges.
Fatigue load model no. 1 (LM1) and fatigue load model no. 2 (LM2) are intended to assess whether fatigue life is unlimited or not. These fatigue load models can be used only when a constant amplitude fatigue limit exists for the examined detail.
Fatigue load model no. 3 (LM3) and fatigue load model no. 4 (LM4) are specifically devoted to damage calculations.
It must be stressed that if unlimited fatigue life is assessed, fatigue damage is nil and therefore damage calculation using LM3 and LM4 is not only unnecessary, but even irrational.
LM1, which can be used without restrictions also accounting very roughly for simultaneity, is extremely simple but very safe-sided, so that its use is limited to very quick preliminary checks. It directly derives from the main load model used for static verifications, where values of vertical loads are simply reduced to frequent ones, multiplying the characteristic tandem axle loads by 0.7 and the characteristic weight density of the uniformly distributed loads by 0.3.
The LM3 is a simplified model, constituted by a four-axle symmetrical equivalent fatigue vehicle. The four axles, weighing 120 kN each, are spaced 1.2, 6.0, and 1.2 m, respectively (Figure 22). If simultaneity effects are not relevant, LM3 is accurate enough for steel details and reference lengths , while for it generally results unsafe-sided.
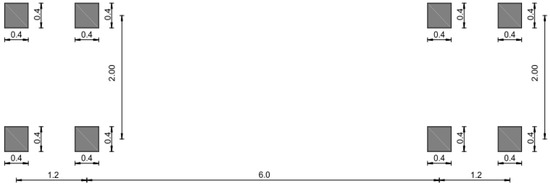
Figure 22.
Fatigue load model 3 (LM3) of EN1991-2 (adapted from [21]).
LM2 (Figure 23) and LM4 (Figure 24) are fatigue load models formed by a set of five standardized vehicles, representative of the most common European lorries, characterized by “frequent” (LM2) or “damage equivalent” (LM4) values of axle loads.

Figure 23.
Fatigue load model 2 (LM2) of EN1991-2—Set of frequent lorries (adapted from [21]).
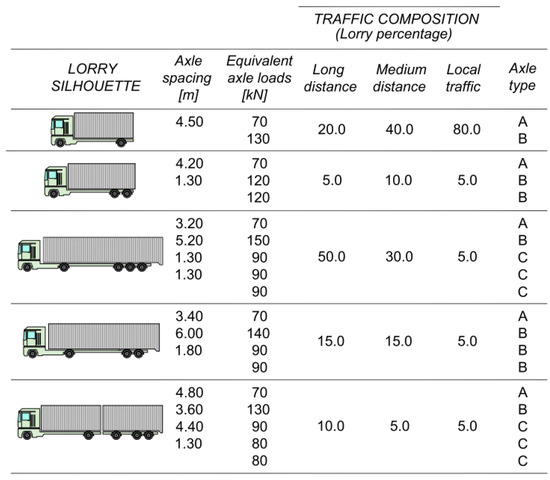
Figure 24.
Fatigue load model 4 (LM4) of EN1991-2—Set of equivalent lorries (adapted from [21]).
As anticipated, the axle typologies of the standardized vehicles are diversified as a function of the dimensions of contact surface of the wheels. Three different axle types, summarized in Figure 25, are considered: A; B; C; depending on the lorry and on the axle position. In Figure 23 and Figure 24, the axle types are indicated in the last column.
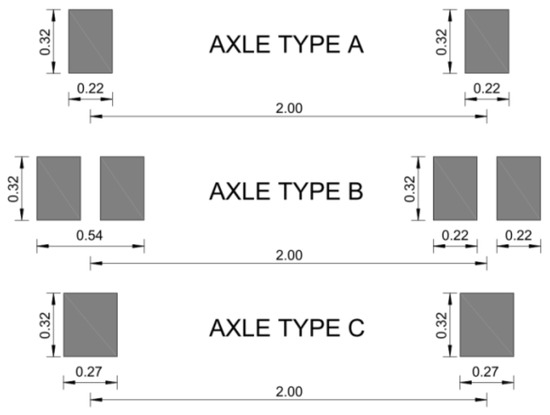
Figure 25.
Axle types (adapted from [21]).
In LM4 three different reference traffics are considered: Long distance; medium distance; local traffic, depending on the relevance of the concerned route and on the road category.
Since the actual strategies governing the optimal management of the commercial lorry fleets favor the use of long and heavy vehicles on long distance traffic, increasingly devoting lighter and quicker vehicles to medium distance and local traffic, the traffic mix becomes more severe as soon as local traffic or medium or long distance traffic is considered, as indicated in Figure 24.
Finally, fatigue load model no. 5 (LM5), which is the most general one, consists of a representative real traffic sample. LM5 can be directly derived from traffic registrations, obtained using suitable weighing in motion (WIM) devices. Clearly, since the fatigue damages induced by cars or light vehicles are insignificant, LM5 can contain only lorries.
As already remarked, LM2, LM4, and even more LM5 allow very precise and refined fatigue assessments, but, when the effects produced by several vehicles traveling simultaneously the bridge cannot be disregarded, they should be duly supplemented to take into account interactions.
4.2. Influence of the Reference Length L and of the Traffic Flow N on Simultaneity Effects on One Lane
To study simultaneity effects on one lane, the probabilities and that two or three vehicles are traveling the lane at the same time have been derived applying Equation (11), depending on the reference length and on the annual traffic flow .
The curves and are parameterized with respect to the annual traffic flow in Figure 26.
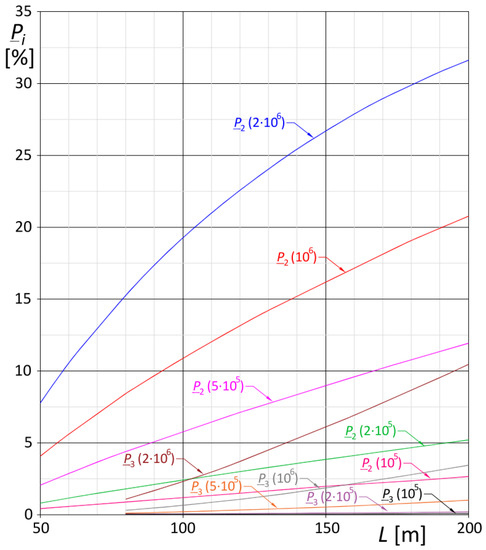
Figure 26.
Probability ( and curves parameterized with respect to the annual traffic flow (.
Setting 5% the reference value of the probability above which effects of interaction can become relevant, investigation of curves in Figure 26 shows that:
- The value of above which effects of interactions between two vehicles become significant is about 60 m when the annual flow is ; increasing up to approximately 90 m for ; and up to 170 m for ; so that
- the probability that two vehicles are simultaneously on the same lane is important only when ;
- as anticipated in Section 2.1, the probability that three vehicles are traveling the lane at the same time can be generally disregarded: In fact, is just relevant when and the traffic flow is high, ; on the contrary, is always negligible when ; while, when , it attains values around only when ;
- curves are slightly concave upward when ; are nearly linear when ; are concave downward when ; while the downward concavity of curves tends to increase as the traffic flow increases, so stressing once again that interactions involving more than two vehicles are relevant only for high values of and .
In addition, it must be considered that the real impact of these results in terms of stress history is usually less evident, since it depends not only on , but also on the shape of the influence line: For instance, in a two span box girder continuous beam, the relevance of simultaneity effects decreases passing from hog bending moments at the intermediate supports, to sag bending moments in the span, despite the number of interacting vehicles can be the same.
4.3. Influence of the Reference Length L and of the Traffic Flow N on Simultaneity Effects on Several Lanes
Under the above-mentioned assumptions, the second example refers to the case of vehicles traveling simultaneously on two distinct lanes, discussed in Section 2.3.
Of course, the less favorable situation occurs when the traffic flows on the two lanes are nearly identical: , so that the total flow is .
Conditional at least that one vehicle is on the bridge, the probability that two lorries are traveling at the same time on the two lanes is given in Equation (37), from which the curves illustrated in Figure 27 are obtained, in the present case study.
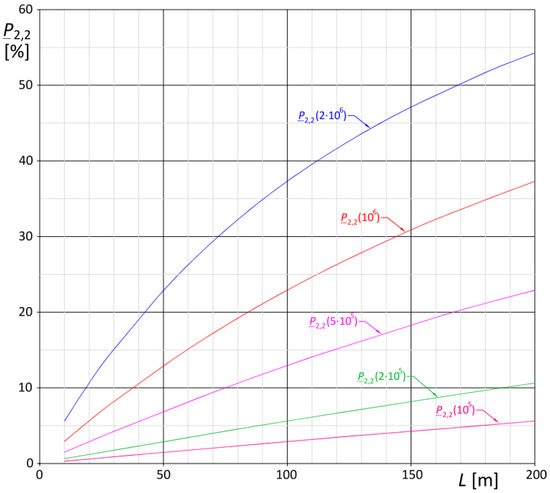
Figure 27.
curves parameterized with respect to .
Examination of Figure 27 demonstrates that interactions due to simultaneity can be significant even if is small, especially for high lorry flows, as they can be disregarded only for annual lorry flows .
These results can be further extended in view of future improvements of the so-called damage equivalence factor method or λ-coefficient method in Eurocodes [15,43]. In fact, it can be also applied to refine the expression of the damage equivalence factor, denoted as in EN1993-1-9 [15], accounting for the multilane effects, in such a way to include also simultaneity.
Recalling that the above-mentioned damage equivalence factor is defined by
where is the equivalent stress range due to lorry traffic on the first lane, which is conventionally the less favorable, and is the total equivalent stress range due to traffic on both lanes, including simultaneity effects, if significant.
In case simultaneity effects are negligible, the resulting fatigue damage can be trivially obtained summing up the fatigue damages caused by the vehicles traveling on each lane, so that results
where m is the slope of the curve, is the maximum ordinate of the influence surface pertaining to the first lane, is the maximum ordinate of the influence surface pertaining to the second lane and and are the lorry flows. Equation (57) is the one given in Eurocode [17], but, suitably implementing the previous results, it is possible to obtain a more general expression of , including effects of simultaneity.
In the example, the traffic has been assumed composed only by the five-axle articulated lorry of LM4 (3rd vehicle in Figure 24), which represents the 50% of the flow in long-distance traffic and the non-interacting vehicle flow has been derived accordingly. Furthermore, considering that about 80% of fatigue damage produced by fatigue load model 4 (LM4) for long distance traffic is to be ascribed to this typology of vehicle, this assumption appears fully justified.
For the sake of the study, the bending moment histories at midspan of simply supported beams spanning from 2 to 200 m have been considered, adopting the rainflow cycle counting method to derive the stress spectra.
The fatigue damage has been thus evaluated adopting the Palmgren–Miner rule [44,45] and considering single slope curves with , as usual for structural steel details subject to high number of stress cycles. Finally, the corresponding values of have been calculated by means of Equation (56), comparing the fatigue damage caused by the two-lane traffic with the fatigue damage caused by the first-lane traffic.
The values of the damage equivalence factor therefore obtained can be fit by the following, generally safe-sided, expression
where the reference length is expressed in m, the lorry speed is expressed in m/s and and are the annual flows. Equation (41) is quasi-linear, except in case .
The worst case for interactions is when the two lanes carry nearly equal traffic flows, , and the influence surface is cylindrical, . In this case, Equation (58) leads to the curves illustrated in Figure 28, parameterized with respect to the annual flow on each lane.
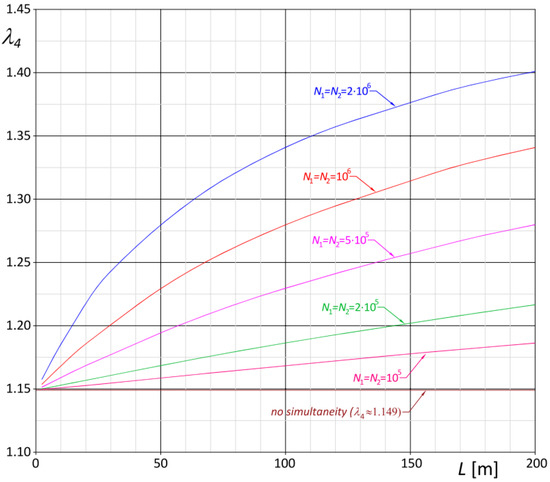
Figure 28.
Damage equivalence factor curves parameterized with respect to for a two-lane case (.
To stress the significance of the diagram, in Figure 28 it has been also drawn the given by (57), which is the brown horizontal line which is independent on the annual flow.
The diagram clearly demonstrates the relevance of interaction, as soon as the reference length L and traffic flow increase, also underlining that Equation (57) can be markedly unsafe-sided, therefore justifying further studies in this specific field.
5. Conclusions
A general procedure is presented, taking into account all kinds of vehicle interactions, which are significant for fatigue assessments of road and railway bridges.
Interactions are caused by vehicles and groups of vehicles traveling simultaneously one or several lanes of the bridge, as well by individual stress histories occurring in distinct times which can combine each other, depending on the cycle counting method adopted.
Considering the bridge as a service system, interactions due to simultaneity have been approached considering two relevant subcases, in succession:
- Subcase 1, which considers vehicles simultaneously traveling on one lane;
- Subcase 2, which consider simultaneity on different lanes.
Fundamental hypotheses of the theory are that the vehicle arrival is a Poisson’s process and that the time needed to travel a given length is distributed according to an exponential law. The memoryless stochastic process of vehicle arrivals is then a Markov process.
The two problems have been solved, adopting an original and innovative approach in this particular field, suitably modifying the classical queuing theory derived by Erlang for telephonic traffic.
Regarding subcase 1, the probability that exactly vehicles are traveling simultaneously on one lane has been derived considering the bridge as a single channel system with a waiting queue. In the system, the number of vehicles in the queue and the waiting time, depending on the number of vehicles in the queue, are limited, so vehicles traveling simultaneously correspond to the queued vehicles.
Once assigned the vehicle flow in a given time interval, the proposed procedure provides for each lane an adapted vehicle flow, composed by single vehicles and by vehicle convoys, if any, running individually on the considered lane.
Concerning subcase 2, the multilane bridge has been modeled as a multichannel system without the waiting queue: When the number of requests exceeds the number of channels , the surplus, discharged by the system, is lost and cannot enter a second time the system.
Providing sound “a priori” estimates of the probability that a given number of vehicles and vehicle convoys is traveling simultaneously on the bridge, the achieved result becomes much more relevant than it could appear at first sight. In fact, as demonstrated by the detailed examples of implementation of the proposed procedure developed in Section 2.2 and Section 2.4, the novelty is that the method is extremely effective in view of optimization of Monte Carlo algorithms, since it leads to drastic reductions of the number of random trials needed to achieve reliable results. Moreover, the implementation of Monte Carlo method is not limited to the generation of artificial traffic samples, as it can be fruitfully applied also to adapt traffic measurements in consequence of variations of the traffic flow.
Moreover, the proposed approaches, which have been developed having in mind traffic loads and fatigue verifications in bridges, are not limited to study the heaviest railway or road traffic composition. In fact, as stressed in the paper, the method is much more general and flexible and can be also applied to transport-oriented studies.
The general expressions derived in both subcases are particularly simple and easy to use, as confirmed by the relevant examples, allowing also to derive supplementary information needed to use conventional fatigue models, which commonly do not include simultaneity effects.
The outcome of the proposed methodology is a non-interacting vehicle flow, composed by vehicles, convoys of vehicles, and groups of vehicles traveling separately—i.e., not simultaneously—the bridge. The components of this flow can be properly represented through a set of reference vehicles or vehicle convoys, each one associated to a “precise” number of expected occurrences.
In this way, the global stress history can be substantially interpreted as a random assembly of the individual stress histories produced by the components of the non-interacting vehicle flow.
Bearing in mind that two separate non-simultaneous stress histories can interact generating a generally more damaging combined stress history, also this kind of interaction, not linked with simultaneity, is relevant.
Dealing with a combination of stress histories it is not trivial, especially when, as in the Eurocodes, fatigue load models are composed by a set of standardized lorries. Really, they can be tackled resorting to sophisticated and time-consuming simulations based on Monte Carlo methods, but elementary solutions have not been proposed so far.
Moreover in this case, a novel approach has been successfully proposed, whose practical application is illustrated referring to an important case study. Looking at the main features of the individual stress histories, conditions for combinations have been definitively established, and simple recursive formulae have been derived to evaluate the number of occurrences of each individual or combined stress history.
The final result is the overall stress spectrum, which is thus the mere summation of the individual, non-interacting, stress spectra pertaining to each combined stress history and to each individual stress history.
Discussion of the results obtained in relevant applications confirms the effectiveness of the proposed procedures, also encouraging further studies.
Funding
This research received no external funding.
Conflicts of Interest
The author declare no conflict of interest.
References
- Adams, W.F. Road traffic considered as a random series. J. Inst. Civ. Eng. 1930, 4, 121–130. [Google Scholar] [CrossRef]
- Comert, G.; Cetin, M. Queue length estimation from probe vehicle location and the impacts of sample size. Eur. J. Oper. Res. 2009, 197, 196–202. [Google Scholar] [CrossRef]
- Drew, D.R. Traffic Flow Theory and Control; McGraw-Hill Book Co.: New York, NY, USA, 1968. [Google Scholar]
- Gerlough, D.L. Use of Poisson Distribution in Highway Traffic; The Eno Foundation for Highway Traffic Control: Saugatuck, CT, USA, 1955. [Google Scholar]
- Rengaraiu, V.R.; Trinadha Rao, V. Vehicle arrivals characteristic at urban uncontrolled intersections. J. Transp. Eng. 1995, 121, 317–323. [Google Scholar] [CrossRef]
- Schuhl, A. The Probability Theory Applied to Distribution of Vehicles on Two Lane Highways. Poisson and Traffic; The Eno Foundation for Highway Traffic Control: Saugatuck, CT, USA, 1955. [Google Scholar]
- Trinadha Rao, V.; Rengaraiu, V.R. Modeling conflicts of heterogeneous traffic at urban uncontrolled intersections. J. Transp. Eng. 1998, 124, 23–34. [Google Scholar]
- Croce, P.; Salvatore, W. Stochastic model for multilane traffic effects on bridges. J. Bridge Eng. 2001, 6, 136–143. [Google Scholar] [CrossRef]
- O’Brien, E.J.; Enright, B. Modeling same-direction two-lane traffic for bridge loading. Struct. Saf. 2011, 33, 296–304. [Google Scholar] [CrossRef]
- Madajag, A.F. Metal Fatigue: Theory and Design; John Wiley & Sons: New York, NY, USA, 1968. [Google Scholar]
- BS5400. Steel Concrete and Composite Bridges—Part 10—Code of Practice for Fatigue; British Standards Institution (BSI): London, UK, 1980. [Google Scholar]
- Rychlik, I. A new definition of the rainflow cycle counting method. Int. J. Fatigue 1987, 9, 119–121. [Google Scholar] [CrossRef]
- Bruls, A.; Croce, P.; Sanpaolesi, L.; Sedlacek, G.; International Association for Bridge and Structural Engineering. ENV 1991—Part 3: Traffic Loads on Bridges. Calibration of Road Load Models for Road Bridges. In Proceedings of the IABSE Colloquium “Basis of Design and Actions on Structures. Background and Application of Eurocode 1”, Delft, The Netherlands, 27–29 March 1996; IABSE: Zurich, Switzerland, 1996; pp. 439–454. [Google Scholar]
- Croce, P. Background to Fatigue Load Models for Eurocode 1: Part 2 Traffic Loads. Prog. Struct. Eng. Mater. 2001, 1, 250–263. [Google Scholar] [CrossRef]
- Dowling, N.E. Fatigue failure predictions for complicated stress-strain histories. J. Mater. 1972, 2, 71–87. [Google Scholar]
- Dowling, S.D.; Socie, D.F. Simple rainflow counting algorithms. Int. J. Fatigue 1982, 7, 31–40. [Google Scholar] [CrossRef]
- EN1993-1-9. Eurocode 3: Design of Steel Structures—Part 1–9: Fatigue; CEN: Brussels, Belgium, 2005. [Google Scholar]
- Hong, N. A modified rainflow counting method. Int. J. Fatigue 1991, 13, 465–469. [Google Scholar] [CrossRef]
- ASM Handbook 19. Fatigue and Fracture; ASM International: Materials Park, OH, USA, 1996. [Google Scholar]
- Matsuishi, M.; Endo, T. Fatigue of Metals Subjected to Varying Stress; The Japan Society of Mechanical Engineering: Fukuoka, Japan, 1968. [Google Scholar]
- EN1991-2. Eurocode 1: Actions on Structures—Part 2: Traffic Loads on Bridges; CEN: Brussels, Belgium, 2003. [Google Scholar]
- McKay, M.D.; Beckman, R.J.; Conover, V.J. A comparison of three methods for selecting values of input variables in the analysis of output from a computer code. Technometrics 1979, 21, 239–245. [Google Scholar]
- Chen, Z.W.; Xu, J.L.; Xia, J.; Li, Q.; Wong, K.J. Fatigue analysis of long-span suspension bridges under multiple loading: Case study. Eng. Struct. 2011, 33, 3246–3256. [Google Scholar] [CrossRef]
- Guo, T.; Frangopol, D.M.; Chen, Y. Fatigue reliability assessment of steel bridge details integrating weigh-in-motion data and probabilistic finite element analysis. Compos. Struct. 2012, 112, 245–257. [Google Scholar] [CrossRef]
- Erlang, A.K. The theory of probabilities and telephone conversation. Nyt Tidsskr. Mat. 1909, 20, 33–39. [Google Scholar]
- Erlang, A.K. Solution of some problems in the theory of probabilities of significance in automatic telephone exchanges. Post Off. Electr. Eng. J. 1918, 10, 189–197. [Google Scholar]
- Brockmeyer, E.; Halstrøm, H.L.; Jensen, A. The Life and Works of A.K. Erlang; The Copenhagen Telephone Co.: Copenhagen, Denmark, 1948. [Google Scholar]
- Jacobsen, B. Probability Theory in Telephone Transmission Proceedings of the 1st International Congress on the Application of the Theory of Probability in Telephone Engineering and Administration, Copenhagen, Denmark, 20–23 June 1955; Jensen, A., Ed.; Teleteknik: Copenhaghen, Denmark, 1957; pp. 83–85. [Google Scholar]
- Ross, S.M. Stochastic Processes, 2nd ed.; John Wiley & Sons: New York, NY, USA, 1996. [Google Scholar]
- Ventsel, E.S. Probability Theory; MIR: Moscow, Russia, 1983. [Google Scholar]
- Kleinrock, L. Queueing Systems, Volume I: Theory; John Wiley & Sons: New York, NY, USA, 1975. [Google Scholar]
- Morse, P.M. Queues, Inventories and Maintenance: The Analysis of Operational Systems with Variable Demand and Supply; Dover Publications Inc.: New York, NY, USA, 1958. [Google Scholar]
- Govil, M.K.; Fu, M.C. Queueing theory in manufacturing: A survey. J. Manuf. Syst. 1999, 18, 214–240. [Google Scholar] [CrossRef]
- Hsu, L.H. Simultaneous determination of preventive maintenance and replacement policies in a queue-like production system with minimal repair. Reliab. Eng. Syst. Saf. 1999, 63, 161–167. [Google Scholar] [CrossRef]
- Lakshmi, C.; Sivakumar, A.I. Application of queueing theory in health care: A literature review. Oper. Res. Health Care 2013, 2, 25–39. [Google Scholar]
- Yechiali, U. Queues with system disasters and impatient customers when system is down. Queueing Syst. 2007, 56, 195–202. [Google Scholar] [CrossRef]
- Dai, M.D.M.; Schonfeld, P. Metamodels for estimating waterway delays through series of queues. Transpn. Res. B 1998, 32, 1–19. [Google Scholar] [CrossRef]
- Lin, C.; Madu, C.N.; Kuei, C.H. A closed queueing maintenance network for a flexible manufacturing system. Microelectron. Reliab. 1994, 34, 1733–1744. [Google Scholar] [CrossRef]
- Kielhauser, C.; Martani, C.; Adey, B.T. The development of intervention programs for inland waterway networks using genetic algorithms. Struct. Infrastruct. Eng. 2018, 14, 1–15. [Google Scholar] [CrossRef]
- Marsili, F.; Bödefeld, H.; Daduna, H.; Croce, P. Scheduling of waterways maintenance interventions applying queueing theory. In Proceedings of the 2018 IALCEE Conference, Ghent, Belgium, 28–31 October 2018; Caspeele, R., Taerwe, L., Frangopol, D.M., Eds.; CRC Press: Boca Raton, FL, USA, 2018. [Google Scholar]
- Marsili, F.; Bödefeld, H.; Daduna, H.; Croce, P. Assessing the risk of disregarding urgent maintenance interventions on waterways infrastructures. In Proceedings of the 13th International Conference on Applications of Statistics and Probability in Civil Engineering, ICASP 2019, Seoul, Korea, 26–30 May 2019. [Google Scholar]
- Croce, P.; Pellegrini, D. Fatigue behavior of stiffener to cross beam joints in orthotropic steel decks. Proc. Eng. 2015, 101, 101–108. [Google Scholar] [CrossRef]
- Croce, P. Improvement of damage equivalence λ-factors for railway steel bridges. In Proceedings of the 34th International Symposium on Bridge and Structural Engineering: Large Structures and Infrastructures for Environmentally Constrained and Urbanised Areas, Venice, Italy, 22–24 September 2010; IABSE: Zurich, Switzerland, 2010; pp. 334–335. [Google Scholar]
- Palmgren, A.G. Die Lebensdauer von Kugellagern. Z. Ver. Dtsch. Ing. 1924, 68, 339–341. (In German) [Google Scholar]
- Miner, M.A. Cumulative damage in fatigue. J. Appl. Mech. 1945, 12, 149–164. [Google Scholar]
© 2019 by the author. Licensee MDPI, Basel, Switzerland. This article is an open access article distributed under the terms and conditions of the Creative Commons Attribution (CC BY) license (http://creativecommons.org/licenses/by/4.0/).