1. Introduction
By nature, every organism, including humans, can detect each and every stimulus rapidly, including emotions, danger, etc. Perceiving emotions is a natural and environmental ability for humans. Emotions are usually categorized as happy, sad, or neutral, depending on how humans feel and the information they perceive from their surroundings through observation [
1]. Surrounding salience (also called saliency) depends upon the characteristics that make it stand out from its neighbours. A visually salient stimulus attracts attention. Saliency is the visual prominence of the scene. It typically arises from the contrast between an item and its surroundings.
Attention modelling is mainly based on saliency maps in the field of computer science [
2]. Saliency maps compute visually observable locations within the image based on the normal visual features that include brightness, colour, and motion [
3]. Currently, many saliency models are available in the literature and the results of these models represent dominant visual locations of an image or video frames based upon three of the most common features of an image including the colour, intensity level, and image orientation. The models are created by the hierarchal decomposition of these features, which in the end combines them to form a saliency map. According to the data of eye movements, visual saliency does have an impact on eye movement, but the presence of an emotional object in a video scene reliably reduced the effect of visual salience [
4]. However, initial eye fixation starts on highly emotional objects rather than neutral ones.
Understanding a scene and focusing on its most salient object is the most significant ability of the human visual system [
5]. Most of the salient regions are selected from a scene using visual attention, eliminating inadequate information and thus grabbing the useful information from the salient region [
6]. It has been found that the movements of the eye and shifting of the attention commences towards the highest salience region and then pauses so that the attention can shift towards the next highest salience region [
7]. Images or video frames with the highest salience guide eye movement and attention, and then inhibit it so that it can move to the next most salient location [
8]. Properties of the stimulus or the images played an important role while guiding eye movements, which leads to the emergence of the salient location [
9]. There is also a spatial information enhanced region contrast method and histogram-based contrast method which measures the saliency by assigning a pixel-wise saliency value which is based on the colour separation of an image pixel to produce a saliency map with a high resolution [
10].
Emotional content in the scene elicits a behavioural response in terms of attention capture [
11]. Research has shown that despite any large motions in the visual scene, eye movements are mostly localized to the centre of the screen [
12]. Therefore, the distance of the eye (fixations) from the centre is a good way to measure if the emotional content has evoked an eye fixation farther from the centre. In contrast, other metrics like the span or saccadic eye movement will not capture this behaviour.
In this study, evidence of emotional salience associated with visual saliency model is explored. A bottom-up saliency model Graph-Based Visual Saliency (GBVS) was used in the study to construct a fully connected graph representing dissimilarity between the salient regions [
13,
14]. According to the literature, the GBVS model more accurately predicts saliency maps than all other models, including the Itti-Koch model [
15]. It assigns a higher value to the centre of the frame of the videos [
16]. Every pixel or region in a video frame or an image represents a measured amount of human attention, thereby indicating visual salience. Predicting fixations in videos through bottom-up salience has been very successful [
17,
18].
2. Materials and Methods
The Antoine Coutrot Database is a publicly available eye-tracking database containing two databases, namely database 1 and database 2. For our experiment, a total of 48 videos from the eye-tracking database 1 were chosen. All the videos belonged to dynamic natural scenes. There were a total of 72 participants/subjects split into groups of 16, 17, and 18 participants per video and the participants were seated 57 cm away from the screen while watching the video. Each video has three dimensions: the first dimension has X and Y coordinates, the second dimension has frames, and the participants were the third dimension according to the database. Eye movement was recorded at 1000 Hz by using an eye link 1000. The eye movement in the eye-tracking database was recorded for the dominant eye with the tracking mode of the monocular pupil corneal reflection. The frame rate was 25 frames per second of every video and each video lasted for between 10 s and 24.8 s.
2.1. Survey
Videos were divided into three categories according to the emotions happy, neutral, and sad (
Figure 1). These videos were categorized according to the survey conducted involving 20 university students with ages in the range 25–30 years old. They were shown each video separately without sound and they had to mark happy, neutral, and sad emotions for each of the videos. The videos were shown in order starting from clip 1 to clip 48 in the same order for every student and they marked the emotions accordingly. However, the emotion of the first video or any video in the sequence did not affect the emotion of any other video as the videos were random and they were not categorized according to emotions. Each student was given a gap of 15 s between each video so that they would not get confused while marking the emotions and so the effect of the previous video would not become diminished. In the database, there were a total of 60 videos, out of which 48 were chosen as videos with two emotions such as both happy and neutral or sad and neutral, and were excluded. The survey took approximately 15–20 min for each subject.
2.2. Saliency Model
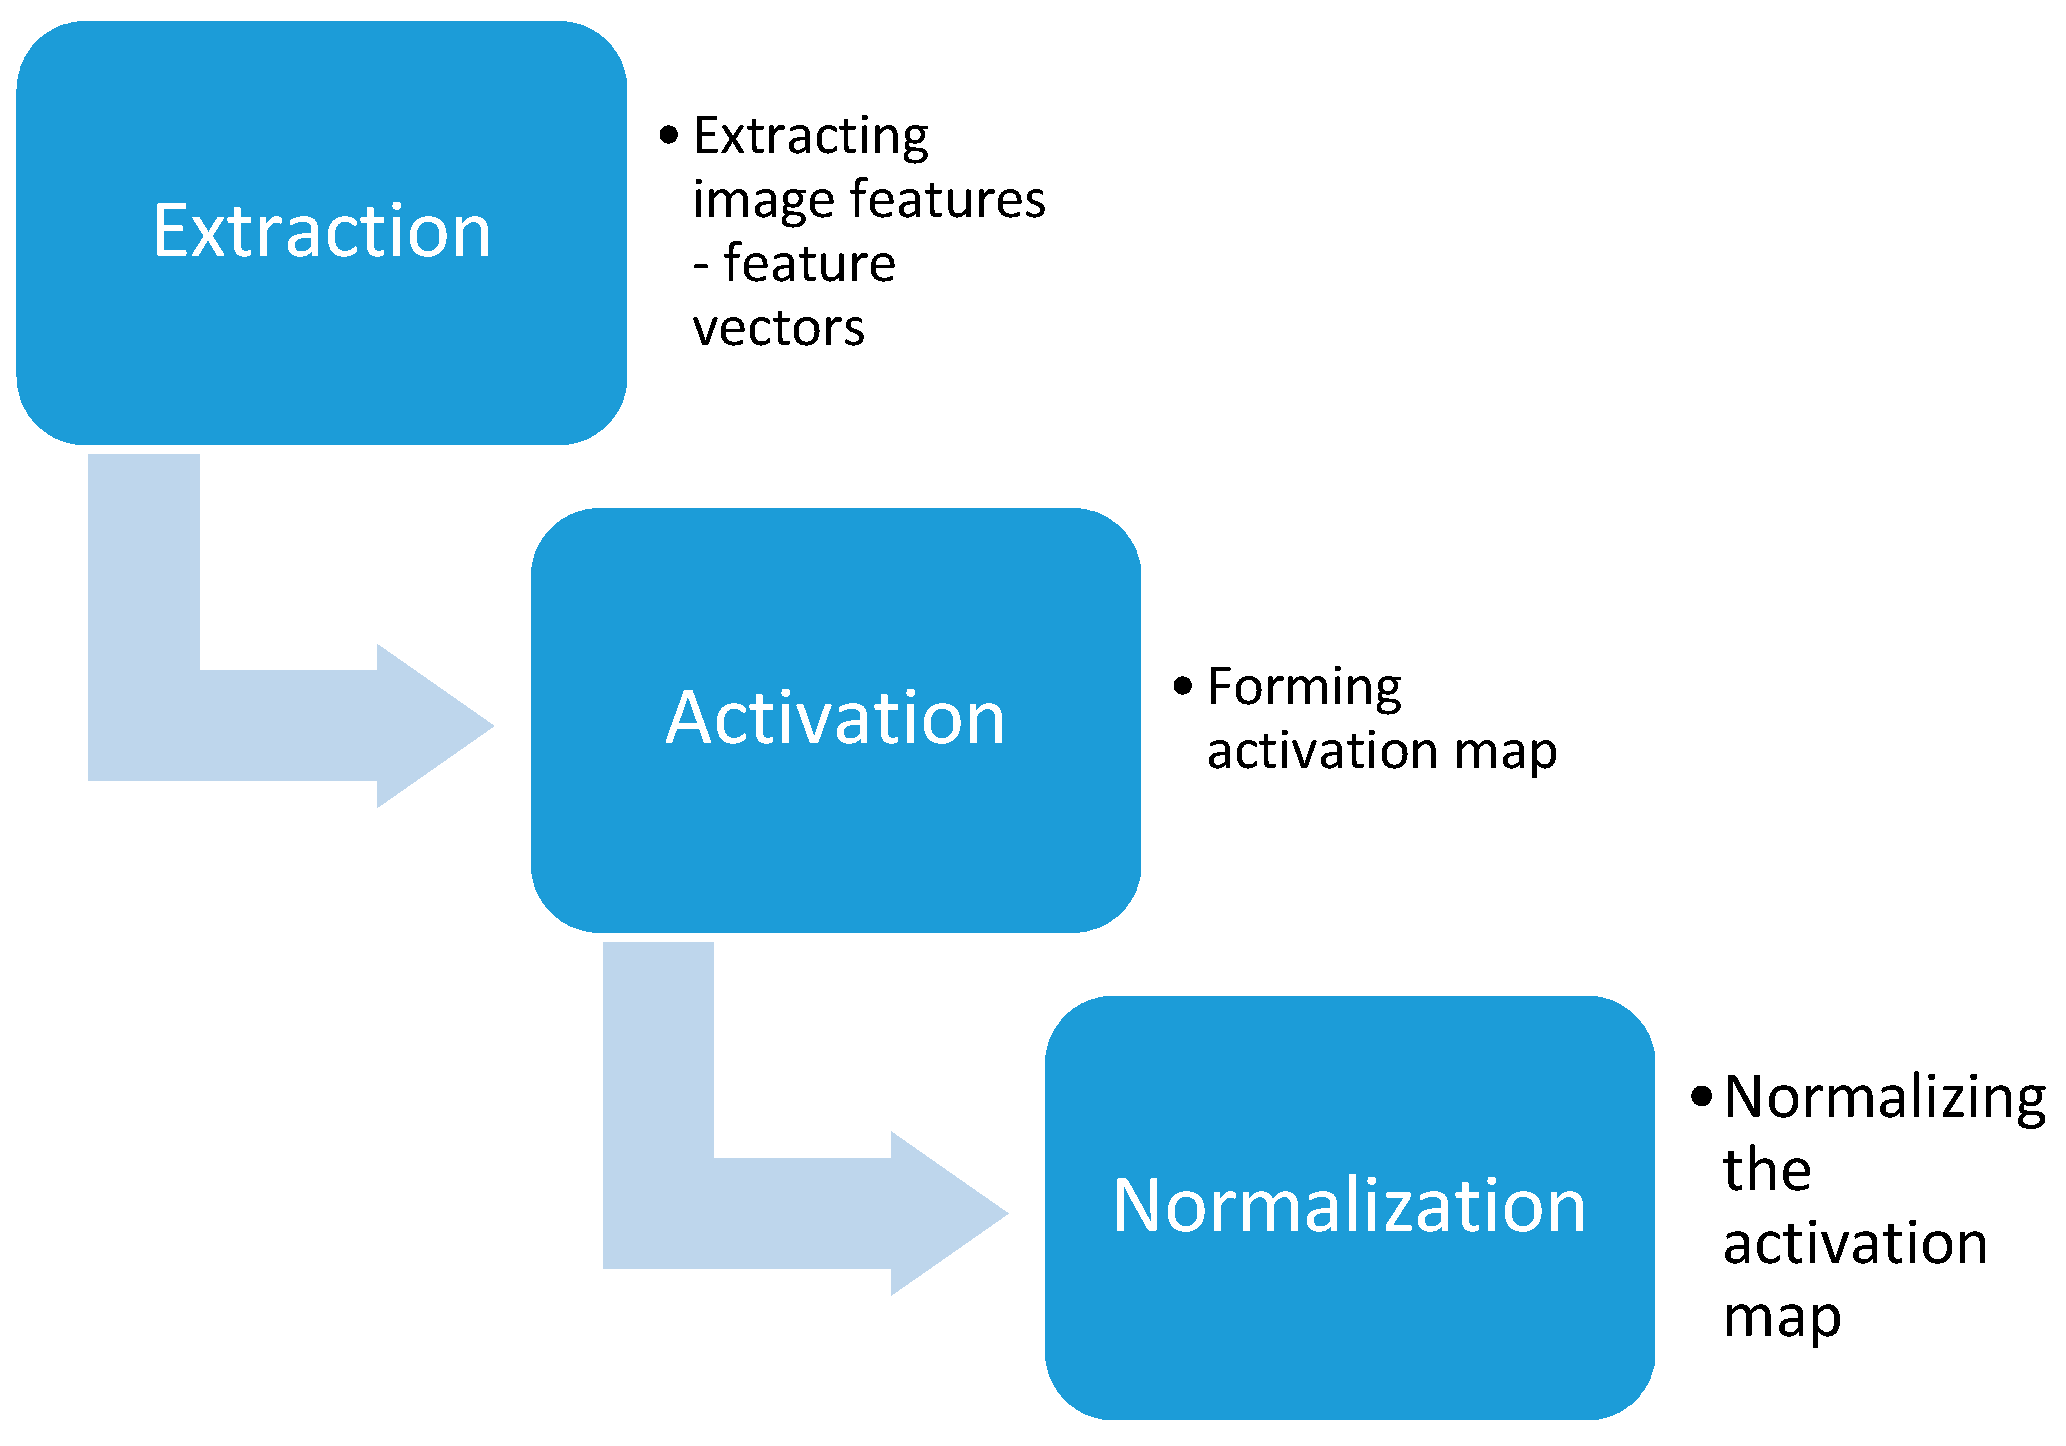
The GBVS model algorithm was applied in MATLAB on each frame of each video and generated different saliency maps. There were different numbers of frames for each video, mostly ranging from 400 to 900 frames for each video with different numbers of subjects. The GBVS algorithm works by extracting image feature vectors using linear filtering. This results in a unique feature map for each channel. These maps are then normalized and combined such that salient locations are highlighted in the final saliency map (see
Figure 2).
2.3. Fixation Distance
Fixation distance from the centre was calculated based on the fact that the majority of the objects in the image is usually directed towards the centre, for example, the people see the centre of the object while ignoring the background [
17] and this same happened here with these videos. Fixation distance calculation from the centre of the screen for different emotional content/videos was done by rounding off the X and Y coordinates of each video from the eye-tracking database 1. Then we subtracted the X coordinate from 360, which is half of the X screen resolution, and subtracted the Y coordinate from 288, which is half of the Y resolution. Then the squared figures of both X and Y coordinates were added followed by the square roots of the added values. In the end, the mean of the square roots of all the frames for every subject for each video was calculated. To categorically find the statistical probability, the standard error of all of the videos through Minitab was calculated and a bar graph was plotted.
2.4. Saliency Value
X and Y coordinates from the eye-tracking database were plotted on the GBVS Map images of each video for saliency/pixel value calculation. The mean and standard error of each video pixel value was calculated for each video separately.
Figure 3 shows some of the video frames categorically.
The GBVS model starts by working on a computing feature map for saliency detection. It usually creates three features depending on the intensity channel, colour channel, and local orientation map according to the input image. Initially, it creates its first feature map by taking the average over red, green and blue (RGB) channels of the image.
The process was repeated over several spatial scales using Gaussian pyramid computation. The image was repeatedly low pass filtered to create activation maps that represent different scales. Feature maps for other features (colour and orientation) were also computed in a similar manner. At the end all maps were combined to form one activation map, using the Markovian approach in Equation (2).
For calculation of final saliency maps through GBVS model, Markov chain image interpretation [
19,
20] is used for mapping various images and the resulting equilibrium distribution on the map is treated as a saliency value. For this, the first step includes the calculation of a features map graph consisting of vertexes and nodes connected by edges. The dissimilarity and proximity between two nodes give us the weight of the two nodes. A saliency map involving a GBVS algorithm is named M, while the dissimilarity between nodes
M(
i,j) and
M(
p,q) with the given two locations (
i,j) and (
p,q) is described by Equation (2)
The equilibrium distributions of these Markov chains are activation maps that are further normalized, forming the saliency map [
21,
22]. The saliency mean for different emotional videos/contents was calculated for all of the frames of the GBVS Map image, and their bar graphs were plotted using STATISTICA.
2.5. Statistics
One-way ANOVA and a least significant difference (LSD)test were carried out for the fixation distance from the centre of the screen and the mean saliency for different emotional content/videos for all frames of each video. For checking the statistical probability and significance results between different kinds of emotions, a planned comparison using a one-way ANOVA through Minitab was done for the GBVS Map image for each of the video frames. AN LSD test was calculated following the one-way ANOVA. The LSD test checks the significance level at p = 0.05. The LSD test was calculated pairwise between emotions that were happy and sad, happy and neutral, and sad and neutral.
3. Results
Analysis of the video content estimates the emotional impact on the viewer while they are watching the video [
21,
22,
23]. Image or video frames-based outliers are predicted during fixation distance calculations. Salient regions in an image or frame are merged for saliency detection through saliency prediction models [
23]. Fixation distance measures the distance of fixation points on the screen.
The X-axis of the fixation distance graphs plotted showed the different kinds of emotion, whereas the Y-axis showed the mean distance from the centre of the screen. The fixation distance measured from the centre of the screen for different emotional content or videos for all video frames shown in
Figure 4 is the measurement of the viewer attention towards the scene. This difference shows that the pattern of eye movement differs in line with emotions; it can be higher for sad emotional movies followed by neutral ones and then happy movies. Fixation distance of first 125 frames was also calculated, and the result in
Figure 5 showed a slight difference with the pattern of eye movement shifting slightly higher for happy emotions, followed by sad and then neutral. There seems to be a contrasting effect on the subjects watching happier and sad videos for the first 125 frames. However, neutral videos attract the same attention for all frames. However, these results could show that the subjects watching videos are more focused on watching the sad emotional videos fully, which could be due to the fact that by nature, humans perceive and recognize sad emotions more quickly as compared to happy emotions. Perceiving or feeling emotion is an important part of daily activities. These types of emotions usually provide a signal to our brain that conveys information about danger or pleasure in the surrounding environment. Measurement of the viewer attention towards the scene is justified by the fixation distance graphs (
Figure 4 and
Figure 5), as these graphs were made in line with the recorded eye movement from the subjects that were seated 57 cm away from the screen for all the videos according to the database. Another reason behind the result could be that the sad movies have more salient locations than the movies for the other emotions.
The GBVS model applied to the video frames generated different types of saliency maps to those of the GBVS map image, GBVS map overlaid image, Itti-Koch image, and Itti-Koch map overlaid image, as shown in
Figure 6.
These all maps were plotted with the default parameters. Each of the following images has its own quality and features. The GBVS model shows the Itti-Koch model normalization graphically. The GBVS maps have the ability to identify the most salient regions/location in an image, then the Itti-Koch model computes saliency maps representing the areas that are not sufficient for conveying the semantic meaning of the image [
23,
24]. So, for all the saliency maps shown in
Figure 6, GBVS map images for each of the video frames were chosen for saliency mean calculations and the generated graph also showed varying results as compared to a fixation distance graph.
Figure 7 shows the highest saliency mean for happy videos for all frames of the GBVS Map, followed by for neutral and sad videos. The result shows that happy videos have the most salient locations, which attracts more human attention. As with the previous result for the fixation distance of the first 125 frames, the saliency means for first 125 frames of the GBVS map images for all the videos shown in
Figure 8 shows the same result as the saliency means for all of the frames. Therefore, the selective frame for both the fixation distance and the saliency value calculation showed the greater emotional trigger of the happy videos overall, followed by the sad and then neutral videos. Having a greater saliency mean and mean fixation distance weightage for happy videos during the first 125 frames might be due to sudden bursts of happy emotion while watching, which then slowly reduce until the end of the video. But sadness appeared to gradually increase by contrast, which appears to align with human nature. Humans pay close attention to positive actions but this focus fades away if they view negative sad actions afterwards.
These high salience rates may include the subject’s cognitive abilities to perceive the salient objects with continuous frame changes. The one-way ANOVA box and whisker plot of the saliency mean shows an equal amount of dispersion for all emotions, according to the box in the plot shown are symmetric in
Figure 9. The whisker in the plot shows the same ranges for the three different kinds of emotion, as there were 16 videos in each emotion category.
A one-way ANOVA box and whisker plot showed a higher variability for happy emotions, and neutral and sad emotions showed less variability. According to this plot, there are larger maximum and minimum outliers for happy and sad videos emotions than for neutral ones. However, the minimum outlier for neutral emotions was reduced compared to happy emotions. As the distributions of the emotional videos are normal, the plot represents 95% of confidence intervals that are represented by the whisker of the plot, which is defined as ±1.96 times the variable standard deviation. On the other hand, the LSD test shown in
Table 1 with these frames shows significant differences between all of the pairs of emotions. Here, the LSD test shows the significant differences only between the sad and happy pair of emotions with a higher mean of 76.57 for the happy emotion. This shows that there is high saliency in the happy videos, and this GBVS model captures the emotional saliency for the happy emotion. However, there are point differences between these pair of emotions. The LSD test that was done showed a significant difference of 0.05 between happy and sad emotions, which is a significant difference. This shows that there is high emotional saliency in the GBVS saliency maps.
Figure 10 has a box and whisker plot for the first 125 frames which shows the same amount of dispersion as for all frames.
Table 2 shows no significant difference between the pair of emotions. It is easily understood that the emotion expressed depends on the full video. This LSD test is also showing the same mean between the pairs of emotion for the first 125 frames and this might be due to the fact that the emotional response takes time to develop and the viewer only provides a description afterwards. However, there is a major difference between individual means, especially between happy and sad emotions (between 71.50 and 59.19) and this difference is evidently shown in the box and whisker plot.
4. Discussion
The measurement of fixation distance shows the viewer’s concentration towards the centre of the scene. As reported in the literature, fixation duration is affected by two major factors: the viewer’s cognitive abilities to process the scene, and the amount of the time required by the oculomotor system so that it can signal the next eye movement [
23].
There is a major difference between the fixation distances from the centre of the screen as well as its X and Y coordinates values, and the saliency values through the GBVS model itself. Fixation distance is actually the subject viewing distance of the video and it may change as the position of the subject changes. But on the other hand, the saliency value is are fixed depending upon the video frame saliency map. It does not change because it is not dependent on the position or the distance of the subject and the screen, although these saliency values are dependent on the saliency maps. Visual saliency models including the GBVS assess the fixation of human observers on real-word images/frames. However how accurately a specific visual saliency model can determine the fixation is still a question that needs to be answered [
25]; these computational models provide the data of eye fixation according to spatial distribution which is then compared to the human fixation observed while watching videos, as in this paper. GBVS Map image saliency values were compared with the fixation distance values already provided in the database.
Viewers watching the movies may have previous exposure to the scenes, as all the videos are dynamic natural scenes. According to the literature, viewers are more influenced by sad emotions while watching videos containing sad features content and grab less information on peripheral details [
18]. Overall the experiment on the fixation distance calculation’s result showed that a subject or participant is generally more focused on the central theme of the movie which grabs their attention. This also accounts for the emotions of the students while watching videos and their assessment of the emotional category of the movie while taking the survey. Fixation distance plays a major role in this experiment as it deals with the fixed number of X and Y locations in the video frames. These locations change regularly and so do the video frames, which is also an important aspect of emotional responses. However, the subjects in fixation distance and students in the survey did not respond to peripheral details in scenes. The fixation distance seems to be longer with more varied eye movement patterns while watching a video scene than when viewing images or reading, which is due to fewer changes in the movement of the eye [
11].
Overall, people tend to watch more emotional videos than neutral ones. Since the graph of fixation distance shows the attention span dispersed around the centre of the screen, it shows that eventually, the emotional content does not depend on attention. Existing models account for more attention towards the happier scenes as compared to the neutral and sad scenes. The same rule goes for the current model in the experiment, as it is focusing on happy videos and somehow on the neutral ones too but is not capturing sad scenes. GBVS model assigns more weight to the image centre, recognizing these regions as more salient regions than the peripheral regions. This is because the model comprises of two components measuring the local dissimilarity within the image. In addition, the model produces a directed graph between local nodes because it has an intrinsic central tendency [
3]. GBVS Map images showed that happier videos are more emotionally salient, with the highest saliency location/regions grabbing more viewer attention and ultimately causing happy emotions. Significance in either in one-way ANOVA or just the bar graphs for all and 125 frames showed variability differences for sad videos. These can be due to several possible reasons, including the salient location, display quality, attention span, visual quality, etc.
The LSD test pairwise comparison for all the frames showed the same result as fixation distance graphs suggesting that most sad videos are less salient than happy and neutral ones. There was a significant difference of 0.04 in the LSD test between sad and happy videos. They are significantly different which means that the graph-based visual saliency map developed from GBVS algorithm/model does not capture the sad saliency, while the salient location of neutral videos lies between both happy and sad videos. The same happened with the LSD test pairwise comparisons for the first 125 frames, which did not show even a single significant difference between the pair of emotions, although even the mean differences between the emotions are itself very large, which supported the conclusion that this GBVS model does not account for sad emotions at all. Although the GBVS result does encounter happy emotions, the saliency map that was developed only targeted happier emotions.
5. Conclusions
Expressing emotion an important daily activity. To better understand the importance of emotion and its relationship with visual saliency, detailed experiments were performed involving even specific numbers of frames. Hence, in this paper, the results show that there is low saliency or salient features in sad movies, hence making these videos less emotionally salient. However, overall the visual content does not capture emotional salience. The Saliency Map we developed does not capture the sad emotion, giving less weight to the sad videos. The LSD test only showed a significant difference of 0.049 between happy and sad emotions, showing a significant difference of 0.05. Therefore, a model capable enough to capture both visual and emotional saliencies should be developed which can capture all three emotions simultaneously. Furthermore, the model developed should encounter all aspects of emotional saliency, including the intensity of emotions their relationship with the visual and auditory senses, and vice versa. These achievements will make a significant contribution to visual systems as well as in the fields of deep learning and neural networks.


