Article

Correlation Structures of PM2.5 Concentration Series in the Korean Peninsula

Department of Natural Science, Korea Naval Academy, Changwon 51704, Korea
*
Author to whom correspondence should be addressed.
Appl. Sci. 2019, 9(24), 5441; https://doi.org/10.3390/app9245441
Submission received: 17 November 2019 / Revised: 5 December 2019 / Accepted: 9 December 2019 / Published: 12 December 2019
(This article belongs to the Section Applied Physics General)

Abstract

:
In this paper, the authors investigate the idiosyncratic features of auto- and cross-correlation structures of PM2.5 (particulate matter of diameter less than 2.5 μ m ) mass concentrations using DFA (detrended fluctuation analysis) methodologies. Since air pollutant mass concentrations are greatly affected by geographical, topographical, and meteorological conditions, their correlation structures can have non-universal properties. To this end, the authors firstly examine the spatio-temporal statistics of PM2.5 daily average concentrations collected from 18 monitoring stations in Korea, and then select five sites from those stations with overall lower and higher concentration levels in order to make up two groups, namely, G1 and G2, respectively. Firstly, to compare characteristic behaviors of the auto-correlation structures of the two groups, we performed DFA and MFDFA (multifractal DFA) analyses on both and then confirmed that the G2 group shows a clear crossover behavior in DFA and MFDFA analyses, while G1 shows no crossover. This finding implies that there are possibly two different scale-dependent underlying dynamics in G2. Furthermore, in order to confirm that different underlying dynamics govern G1 and G2, the authors conducted DCCA (detrended cross-correlation analysis) analysis on the same and different groups. As a result, in the same group, coupling behavior became more prominent between two series as the scale increased, while, in the different group, decoupling behavior was observed. This result also implies that different dynamics govern G1 and G2. Lastly, we presented a stochastic model, namely, ARFIMA (auto-regressive fractionally integrated moving average) with periodic trends, to reproduce behaviors of correlation structures from real PM2.5 concentration time series. Although those models succeeded in reproducing crossover behaviors in the auto-correlation structure, they yielded no valid results in decoupling behavior among heterogeneous groups.

1. Introduction

Currently, most countries are facing severe air pollution problems incurred by rapid industrialization, high population density, traffic density, and so on. Air pollution levels are determined by the concentrations of the six pollutants, i.e., atmospheric fine particulate matters (PM2.5 of diameter less than 2.5 μ m ), atmospheric particulate matter (PM10 of diameter less than 10 μ m ), SO2, NO2, CO, and O3. In particular, PM2.5 is a critical pollutant linked to respiratory and cardiovascular diseases, as well as visibility degradation and climate change [1]. So far, there were many studies on the characteristics of PM2.5 using three approaches: finding sources of emission and characterizing seasonal distributions [2,3,4,5], analyzing various correlation structures inherent in PM2.5 time series [6,7,8,9], and developing theoretical models for prediction and control [10,11,12].
Most developing countries such as China and India are facing a severe air pollution problem. They feature a high concentration of PM2.5, which is a direct effect of industrialization and urbanization. The concentration exhibits a seasonal trend, which is presumably due to the meteorological conditions [13]. However, there is no clear causal relationship between the PM2.5 concentration and meteorological factors [7,14], as only the evidence of cross-correlation can be detected. Since various DFA (detrended fluctuation analysis) approaches were used for correlation structures, many researchers reported various characteristics of complex correlation structures inherent in air pollutants [6,7,8,9,15,16] after the advent of the method [17]. However, the effect of non-stationarities and trends on various scaling exponents was disregarded in the process of quantifying the degree of correlation. Since the seasonality is a noticeable phenomenon in air pollutant series, they may be misunderstood as spurious scaling indexes and crossover behavior if the authors do not consider these effects [18,19,20,21]. Thus, the first goal of this paper was to properly interpret the characteristics of scaling functions of DFA, MFDFA (multifractal detrended fluctuation analysis), and DCCA (detrended cross-correlation analysis), and to present genuine correlation scaling exponents. Furthermore, the authors performed simulation analyses using the ARFIMA (auto-regressive fractionally integrated moving average) process with periodic trends by varying the degree of amplitude in order to understand the effect of seasonal trends. Lastly, there were attempts to develop a theoretic model to exhibit some facets of characteristics of air pollutant time series which failed to catch all empirical facts. In fact, empirical studies are very important to understand air pollution systems. We can establish a reliable framework on the basis of firm empirical facts when taking measures against spreading air pollutants.
In this work, our aim was to discover heterogeneity in the dynamics underlying the PM2.5 accumulation process in the Korean peninsula. To this end, we firstly explored the statistics of all available PM2.5 datasets and generated two distinct groups with mass concentration levels. Then, we examined the auto- and cross-correlation structures of both groups using DFA-based methodologies. The Korean peninsula is located close to China, a country that is developing very rapidly. It is a well-known fact that the Korean peninsula is strongly affected by the inflow of air pollutants from China, although quantification of the effect remains controversial [22]. In fact, the events are intermittent in some respects, and they show seasonal trends in other respects, because, in the winter, coal-fuel combustion and heating increases, and, in the spring, dust occurs almost periodically. We firstly selected five PM2.5 time series from 18 available datasets and separated those series into two groups, namely, G1 with a mild concentration and G2 with a severe one. In terms of seasonal statistics and initial examination, G1 shows less seasonality while G2 shows more seasonality (see Figure 3). In order to quantitatively examine the impact of seasonal outliers attributable to China in terms of PM2.5 mass concentrations in the Korean peninsula, we applied the conventional DFA method to the series belonging to different groups, i.e., G1 and G2. In DFA analysis, a crossover behavior can be observed depending on the magnitude of outliers [19]. In our study, although the effect of China’s air pollutant influx is usually nationwide, each monitoring site has unique features in geographical, topographical, and meteorological conditions. Thus, idiosyncratic behaviors appear according to monitoring stations. Since the crossover in DFA analysis means that there are different dynamics working over different scales, we confirmed the heterogeneity in auto- and cross-correlation structures between G1 and G2 by checking the DFA analysis results. Also, periodic trends in a time series can lead to crossover behavior in the Hurst exponent based on the DFA analysis [18]. Thus, in order to reproduce the auto-correlation features produced from real PM2.5 time series, we present a stochastic model, namely, the ARFIMA process with periodic trends, and we succeed in qualitatively explaining the spatial variations on the crossover behavior of DFA exponents by adjusting the amplitude of a periodic trend. We also conducted DCCA analysis on both groups in order to confirm the heterogeneity in their dynamics, and we discovered that two series belonging to the same group showed increasing coupling or synchronization, while two series belonging to different groups showed decoupling behavior.
The organization of this paper is as follows: in Section 2, the authors give a close description of the dataset and present several seasonal and spatial statistics of PM2.5 mass concentrations. This section also provides a detailed description of the methodology applied to this study. Section 3 derives and interprets various analytical results using DFA, MFDFA, and DCCA methods. Finally, Section 4 gives the discussion and conclusion of this study.

2. Methods

2.1. Data

South Korea began opening limited air pollution data of 16 stations to the public in 2002, and later expanded to providing real-time concentrations of six air pollutants from a well-constructed nationwide monitoring network consisting of 344 stations via a website (http://www.airkorea.or.kr) in 2005. The dataset is composed of PM2.5 mass concentrations recorded hourly from about 344 monitoring stations located nationwide in Korea, from 1 January 2015 to 31 December 2017. Most datasets contain erroneous data points due to operational errors of measuring devices and abnormal values. Thus, the authors selected datasets with less than 10% of missing data points during the whole time span. Finally, they obtained daily average concentrations with a total of 1090 data points each at 18 stations, which were categorized into urban and roadside groups. In fact, all monitoring stations were grouped into four categories: urban, suburban, roadside, and country background. However, most datasets were removed upon processing the wrong data points contained in the original time series. In this study, we analyze the daily average mass concentration of PM2.5, defined as the daily average mass concentration instead of the logarithmic value, because the mass concentration is not stored and updated every hour.
As shown in Figure 1, we can observe a seasonal trend as reported in other studies, i.e., a high concentration in the winter and spring, and a low concentration in the summer and fall. This trend shows a similar behavior to meteorological factors such as temperature, relative humidity, wind speed, air pressure, and precipitation. While there seems to be a strong dependence of PM2.5 concentrations on meteorological factors, it is not clear whether there is a reliable causal relationship between them. No meteorological factor is determined to contribute to the concentration other than sharing a seasonal trend [7].
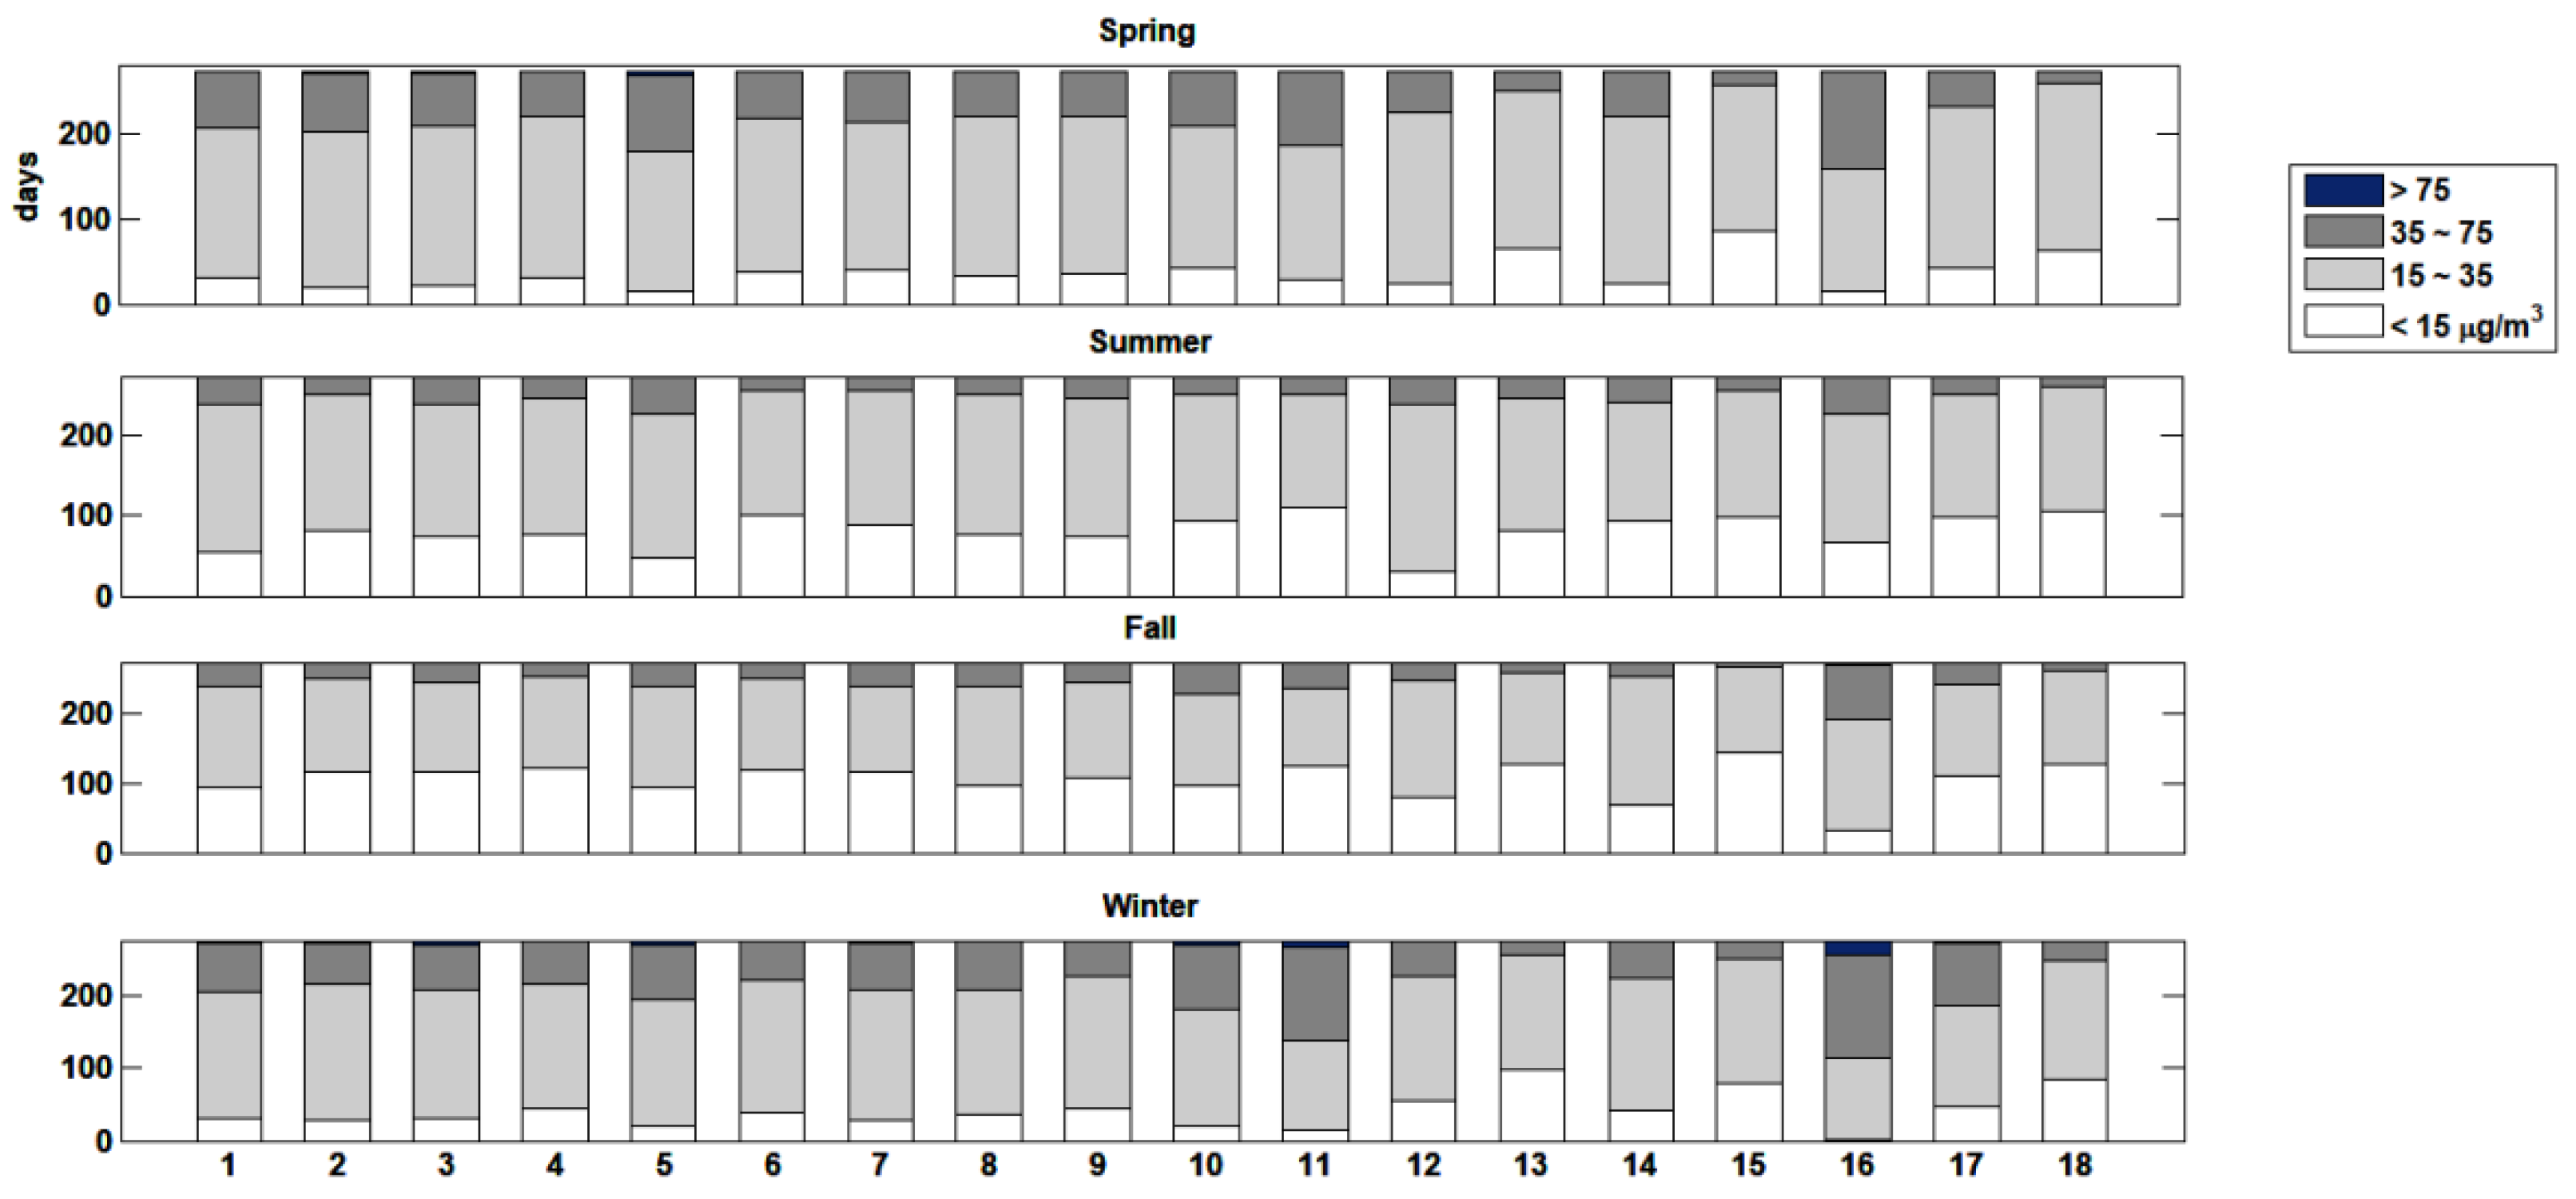
Figure 2 shows the spatial variations in PM2.5 concentrations. In particular, stations #15 and #18 show a low-level concentration, while stations #5, #11, and #16 show a high-level concentration. Station #16 is a roadside station, which is strongly affected by mobile vehicles. In order to examine the correlation structure of PM2.5 concentrations obtained from spatially separated monitoring stations, the authors applied the DFA and the MFDFA methods to two groups, namely, G1 (stations #15 and #18) and G2 (stations #5, #11, and #16), consisting of time series with different characteristic seasonal statistics, as shown in Figure 2, among five PM2.5 monitoring stations with representative statistics.
In Figure 3, a seasonal trend is even clearer in G2 while a less clear one can be seen in G1.

2.2. Detrended Fluctuation Analysis (DFA)

In order to investigate the correlation structures inherent in PM2.5 series, the authors applied three kinds of fluctuation analysis methods, i.e., DFA (detrended fluctuation analysis) [15], MFDFA (multifractal DFA) [23], and DCCA (detrended cross-correlation analysis) [24], which are briefly illustrated below. In the application of these fluctuation analyses, the authors took the detrending approach with overlapping sliding boxes, which is a widely used method to obtain better statistics when the data points are finite [25]. The authors firstly considered a noisy PM2.5 series, x ( i ) ( i = 1 ,   2 ,   ,   N max ). Then, the authors integrated the time series x ( i ) to construct the following profile:
X ( k ) = i = 1 k [ x ( i ) x ] ,
where
x = 1 N max i = 1 N max x ( i ) .
The integrated series was divided into N n ( = N max n + 1 ) overlapping boxes of equal size n , and the authors fit it using a polynomial function, X ˜ ν ( k ) , which was the local trend for the ν -th box. Herein, the authors used the first-order polynomial. To detrend the integrated time series X ( k ) , the authors subtracted the local trend and calculated the local detrended fluctuation function for the ν -th box such that
F n 2 ( ν ) = 1 n i = 1 n { X [ ( ν 1 ) n + i ] X ˜ ν ( i ) } 2 .
Then, by summing over all overlapping N n boxes of size n , the authors computed the detrended variance function as follows:
F D F A ( n ) = { 1 N n ν = 1 N n F n 2 ( ν ) } 1 / 2 .
The above computation provides a relationship between F D F A ( n ) and n , such as
F D F A ( n ) n α ,
for scale-invariant signals with power-law correlations. The scaling exponent α represents the degree of correlation in the signal. If α = 0.5 , there is no correlation, that is, the signal is uncorrelated. On the other hand, if α < 0.5 , the signal is negatively correlated. Lastly, if α > 0.5 , there is a positive correlation in the signal.

2.3. Multifractal Detrended Fluctuation Analysis (MFDFA)

MFDFA is an extension of the conventional DFA and consists of five steps. The first three steps are identical to the DFA procedure. Let us consider x ( i ) of length N max and construct the profile by integrating x ( i ) x , as shown in Equations (1) and (2). After dividing the integrated series into N n ( = N max n + 1 ) overlapping boxes of equal size n , the authors calculated the detrended fluctuation function F n 2 ( ν ) as done in Equation (3). Then, the authors averaged over all boxes to obtain the q -th order fluctuation function as follows:
F q ( n ) = { 1 N n ν = 1 N n [ F n 2 ( ν ) ] q / 2 } 1 / q ,
where the index variable q can take any real value in general. For q = 2 , the standard DFA was retrieved. Lastly, the authors examined the scaling behavior of the generalized q -dependent fluctuation functions by analyzing double-logarithmic plots of F q ( n ) versus n for each index value q . If the x ( i ) series featured a long-range power-law correlation, the authors could find a power-law relationship between them, such as
F q ( n ) n h ( q ) .
Here, the authors called the exponent h ( q ) a generalized Hurst exponent since h ( 2 ) was identical to the well-known Hurst exponent H [26]. For positive values of q , h ( q ) describes the scaling behavior of the boxes with large fluctuations because the boxes ν with large variance F n 2 ( ν ) contribute more to the average F q ( n ) . On the contrary, for negative values of q , h ( q ) describes the scaling behavior of the boxes with small fluctuations, since the boxes ν with small variance F n 2 ( ν ) dominate the average F q ( n ) .

2.4. Detrended Cross-Correlation Analysis (DCCA)

In order to quantify long-range cross correlations between two non-stationary time series, a modification of the covariance analysis, called DCCA, was proposed by Podobnik and Stanley [23]. The authors firstly considered two long-range cross-correlated time series x ( i ) and y ( i ) of equal length N max , from which the authors computed two integrated signals as follows:
X ( k ) = i = 1 k [ x ( i ) x ] , Y ( k ) = i = 1 k [ y ( i ) y ] .
The authors divided the integrated time series into N n ( = N max n + 1 ) overlapping boxes of equal size n and defined the local trends X ˜ ν ( k ) and Y ˜ ν ( k ) of a polynomial function for the ν -th box by using a linear least-squares fit. Next, by defining the detrended walk as the difference between the integrated series and the local trend, the authors calculated the covariance of the residuals in the ν -th box as follows:
F n , D C C A 2 ( ν ) = 1 n i = 1 n { X [ ( ν 1 ) n + i ] X ˜ ν ( i ) } { Y [ ( ν 1 ) n + i ] Y ˜ ν ( i ) } ,
and the detrended covariance function was obtained by averaging the above covariance functions as follows:
F D C C A ( n ) = { 1 N n ν = 1 N n F n , D C C A 2 ( ν ) } 1 / 2 .
In order to examine the behavior of the covariance function versus n , the authors considered two cases: one with no power-law cross-correlations in both time series, and the other with power-law cross-correlations in both series. For the former, the exponent of F D C C A ( n ) is not defined because it has complex values; thus, the authors defined a new measure to quantify the degree of cross-correlation in both time series with non-stationaries. The DCCA coefficient ρ D C C A ( α ,   α ,   N max ,   n ) , defined below, was introduced by Gebende [27].
ρ D C C A ( α ,   α ,   N max ,   n ) = F D C C A 2 ( n ) F D F A ( n ) F D F A ( n ) ,
which is dependent on the length of two time series, their respective DFA exponents ( α ,   α ) , and the box size n . Podobnik et al. presented the framework to determine the statistical significance of ρ D C C A ( α ,   α ,   N max ,   n ) via the computed critical point ρ c ( N max ,   n ) for the 95% confidence level by varying the data length N max and the box size n [28]. For the latter approach, the authors could find a power-law scaling between both time series, as shown below.
F D C C A ( n ) n λ .
In particular, for two persistent time series, the DCCA exponent λ was approximately equal to the average of both DFA exponents, i.e., λ ( α + α ) / 2 [24]. However, for a pair of persistent and anti-persistent series, the authors had no clear support for the previous relationship. According to the numerical analysis, the DCCA exponent λ tended to approximately 0.5. Lastly, the authors addressed the fact that there should be a common error term in both time series if the authors observed a power-law cross-correlation between them.

3. Results

3.1. Autocorrelation Structures

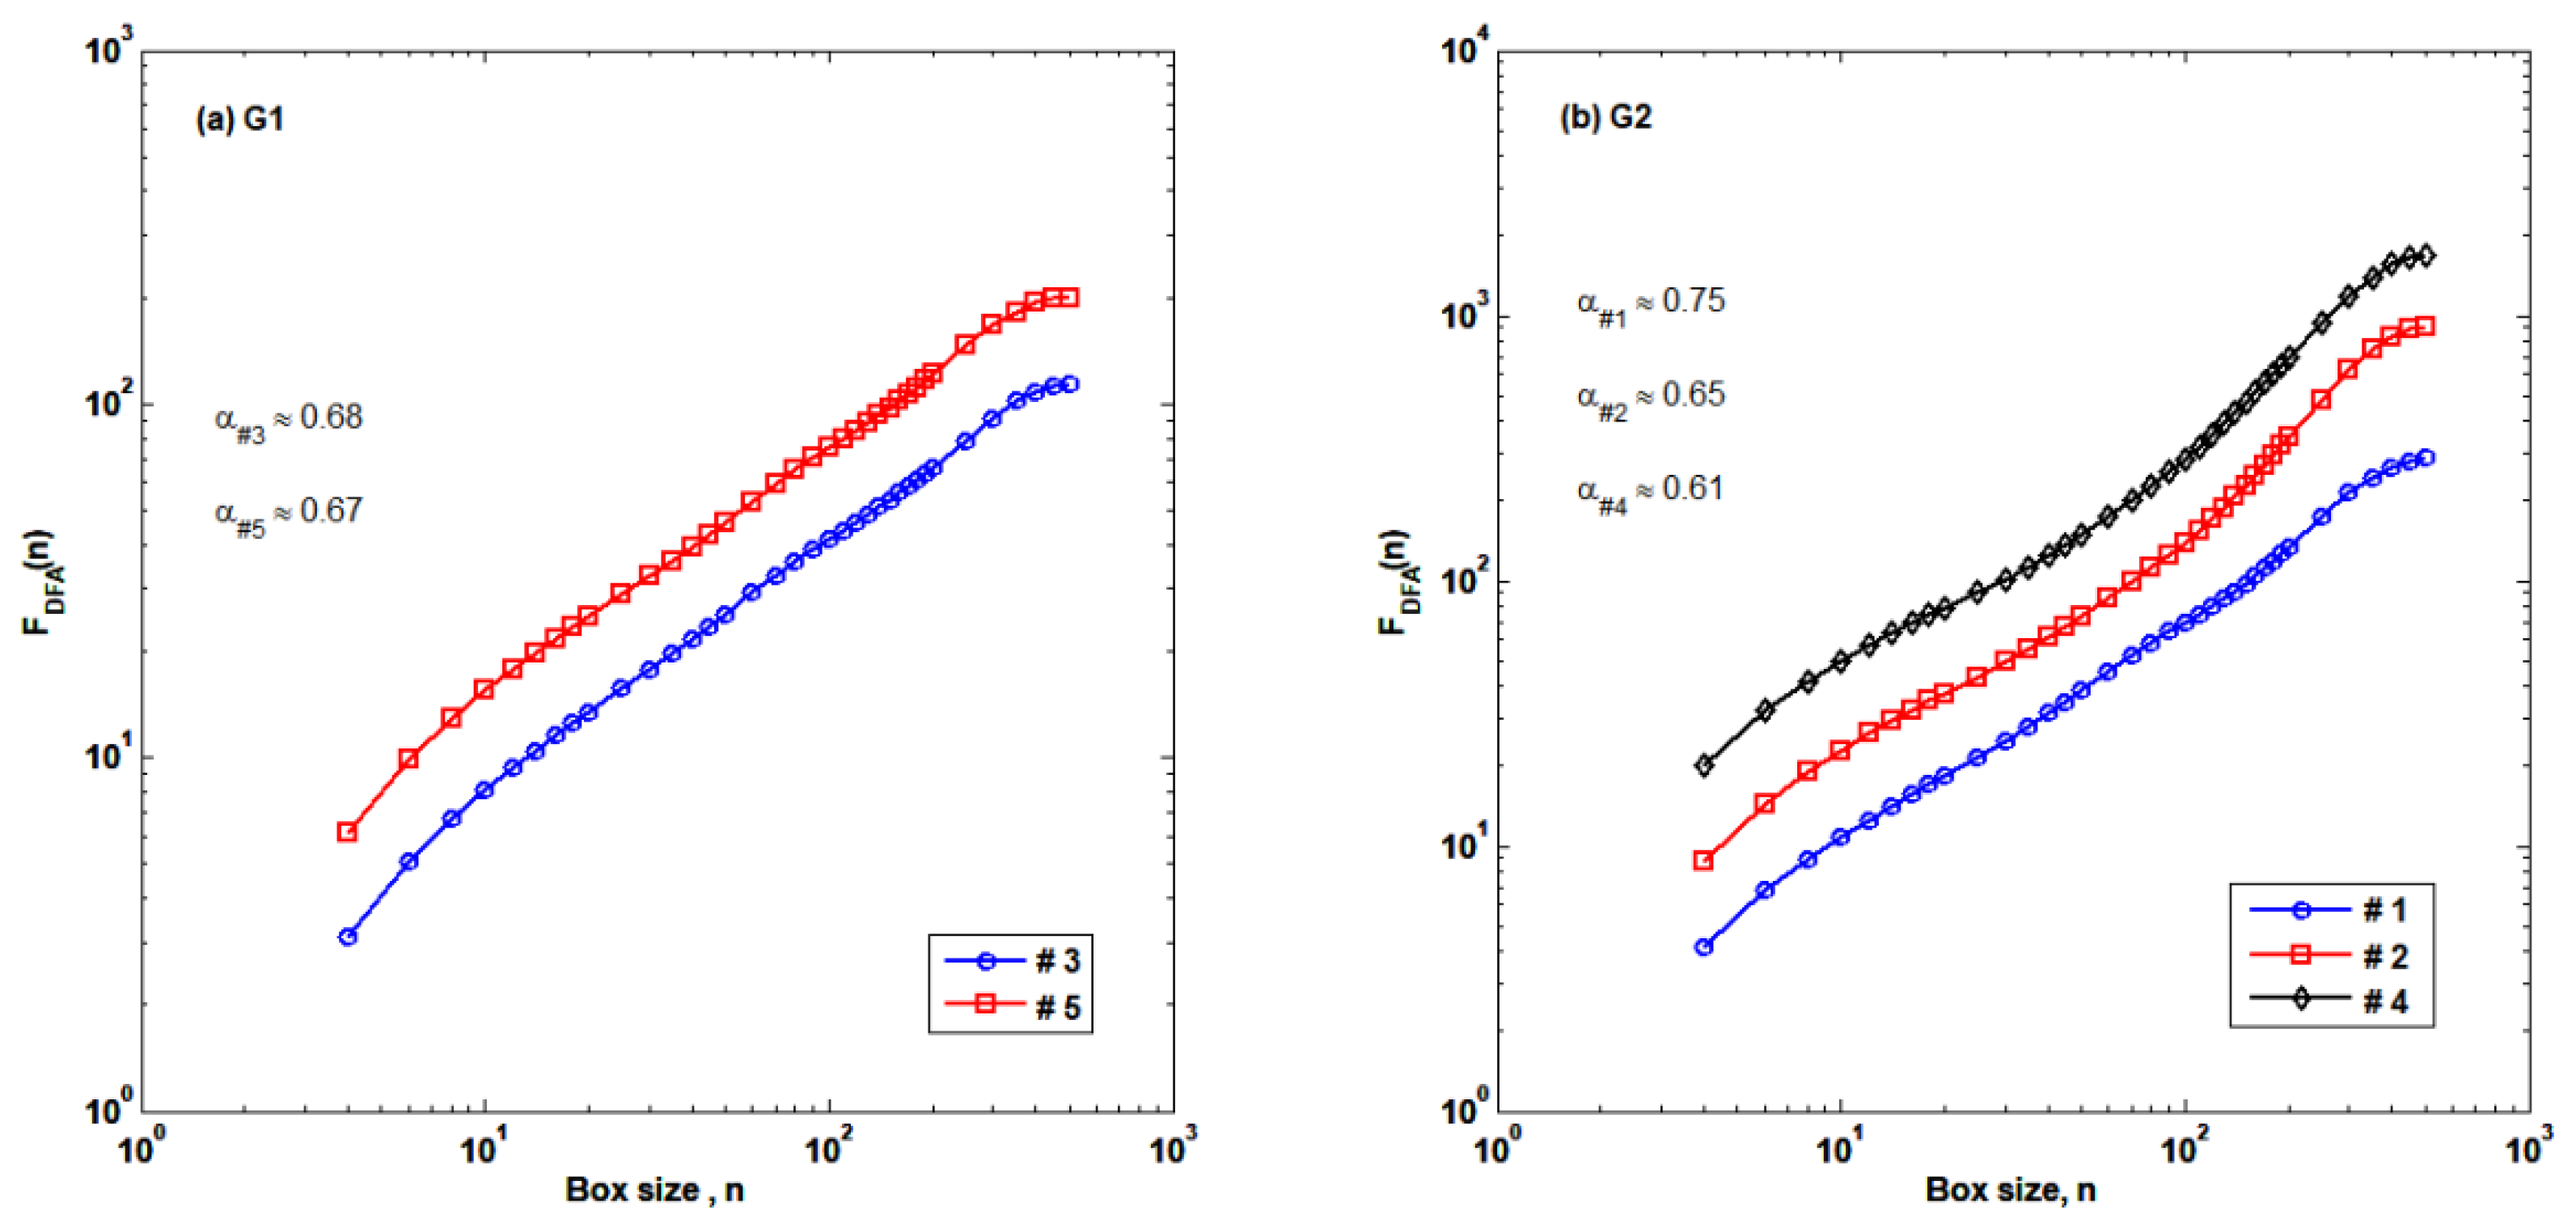
The DFA approach is a well-known method to quantify the degree of correlation properties in non-stationary time series, and it was successfully applied to various fields such as finance, meteorology, cardiac dynamics, and so on. However, there are some important problems in estimating the scaling index, such as changes in the index of scale, crossover, and scaling range. In this work, the authors firstly determined the scaling range using the surrogate dataset generated from the original series using two methods, i.e., shuffling and Fourier phase randomization, as shown in Figure 4 [29]. Herein, the authors set the scaling range to the scale interval [10, 200] days. Then, the authors estimated the correlation exponent by linearly fitting the double-logarithmic plots of the detrended fluctuation functions vs. box sizes using the least-squares method. The authors confirmed that the PM2.5 series showed a weak persistent behavior, as shown in Figure 5.
Furthermore, crossover behavior was observed in G2 although there were variations in the degree of crossover, while G1 showed little evidence of crossovers. Considering the seasonality inherent in air pollutant series, this crossover behavior was mainly due to the seasonal trend. In order to confirm this possibility, the authors examined the crossover behaviors arising from the artificially generated time series with periodic trends. To this end, the authors used a stationary linear ARFIMA process to generate a power-law auto-correlated time series as follows [30]:
y ( t ) = i = 1 a i ( ρ ) y ( t i ) + η ( t ) ,
where ρ (range of −0.5 and 0.5) is a free parameter, a i ( ρ ) represents weights defined by a i ( ρ ) = Γ ( i ρ ) / [ Γ ( ρ ) Γ ( 1 + i ) ] , Γ ( x ) denotes the gamma function, and η ( t ) denotes an independent identically distributed (i.i.d.) Gaussian variable. The parameter ρ is related to a Hurst exponent such as = 2 + ρ . Here, the authors added periodic trends to the ARFIMA process in two ways: one was exogenous and the other was endogenous, as shown below.
Exogenous trend:
y p ( t ) = y ( t ) + Asin ( 2 π t / T ) .
Endogenous trend:
y p ( t ) = i = 1 a i ( ρ ) y p ( t i ) + Asin ( 2 π t T ) + η ( t ) .
In the analysis, the authors set ρ = 0.2 in order to obtain a similar scaling exponent with that of the PM2.5 series. The data size was also same as the PM2.5 time series and the period T was set to 360 days.
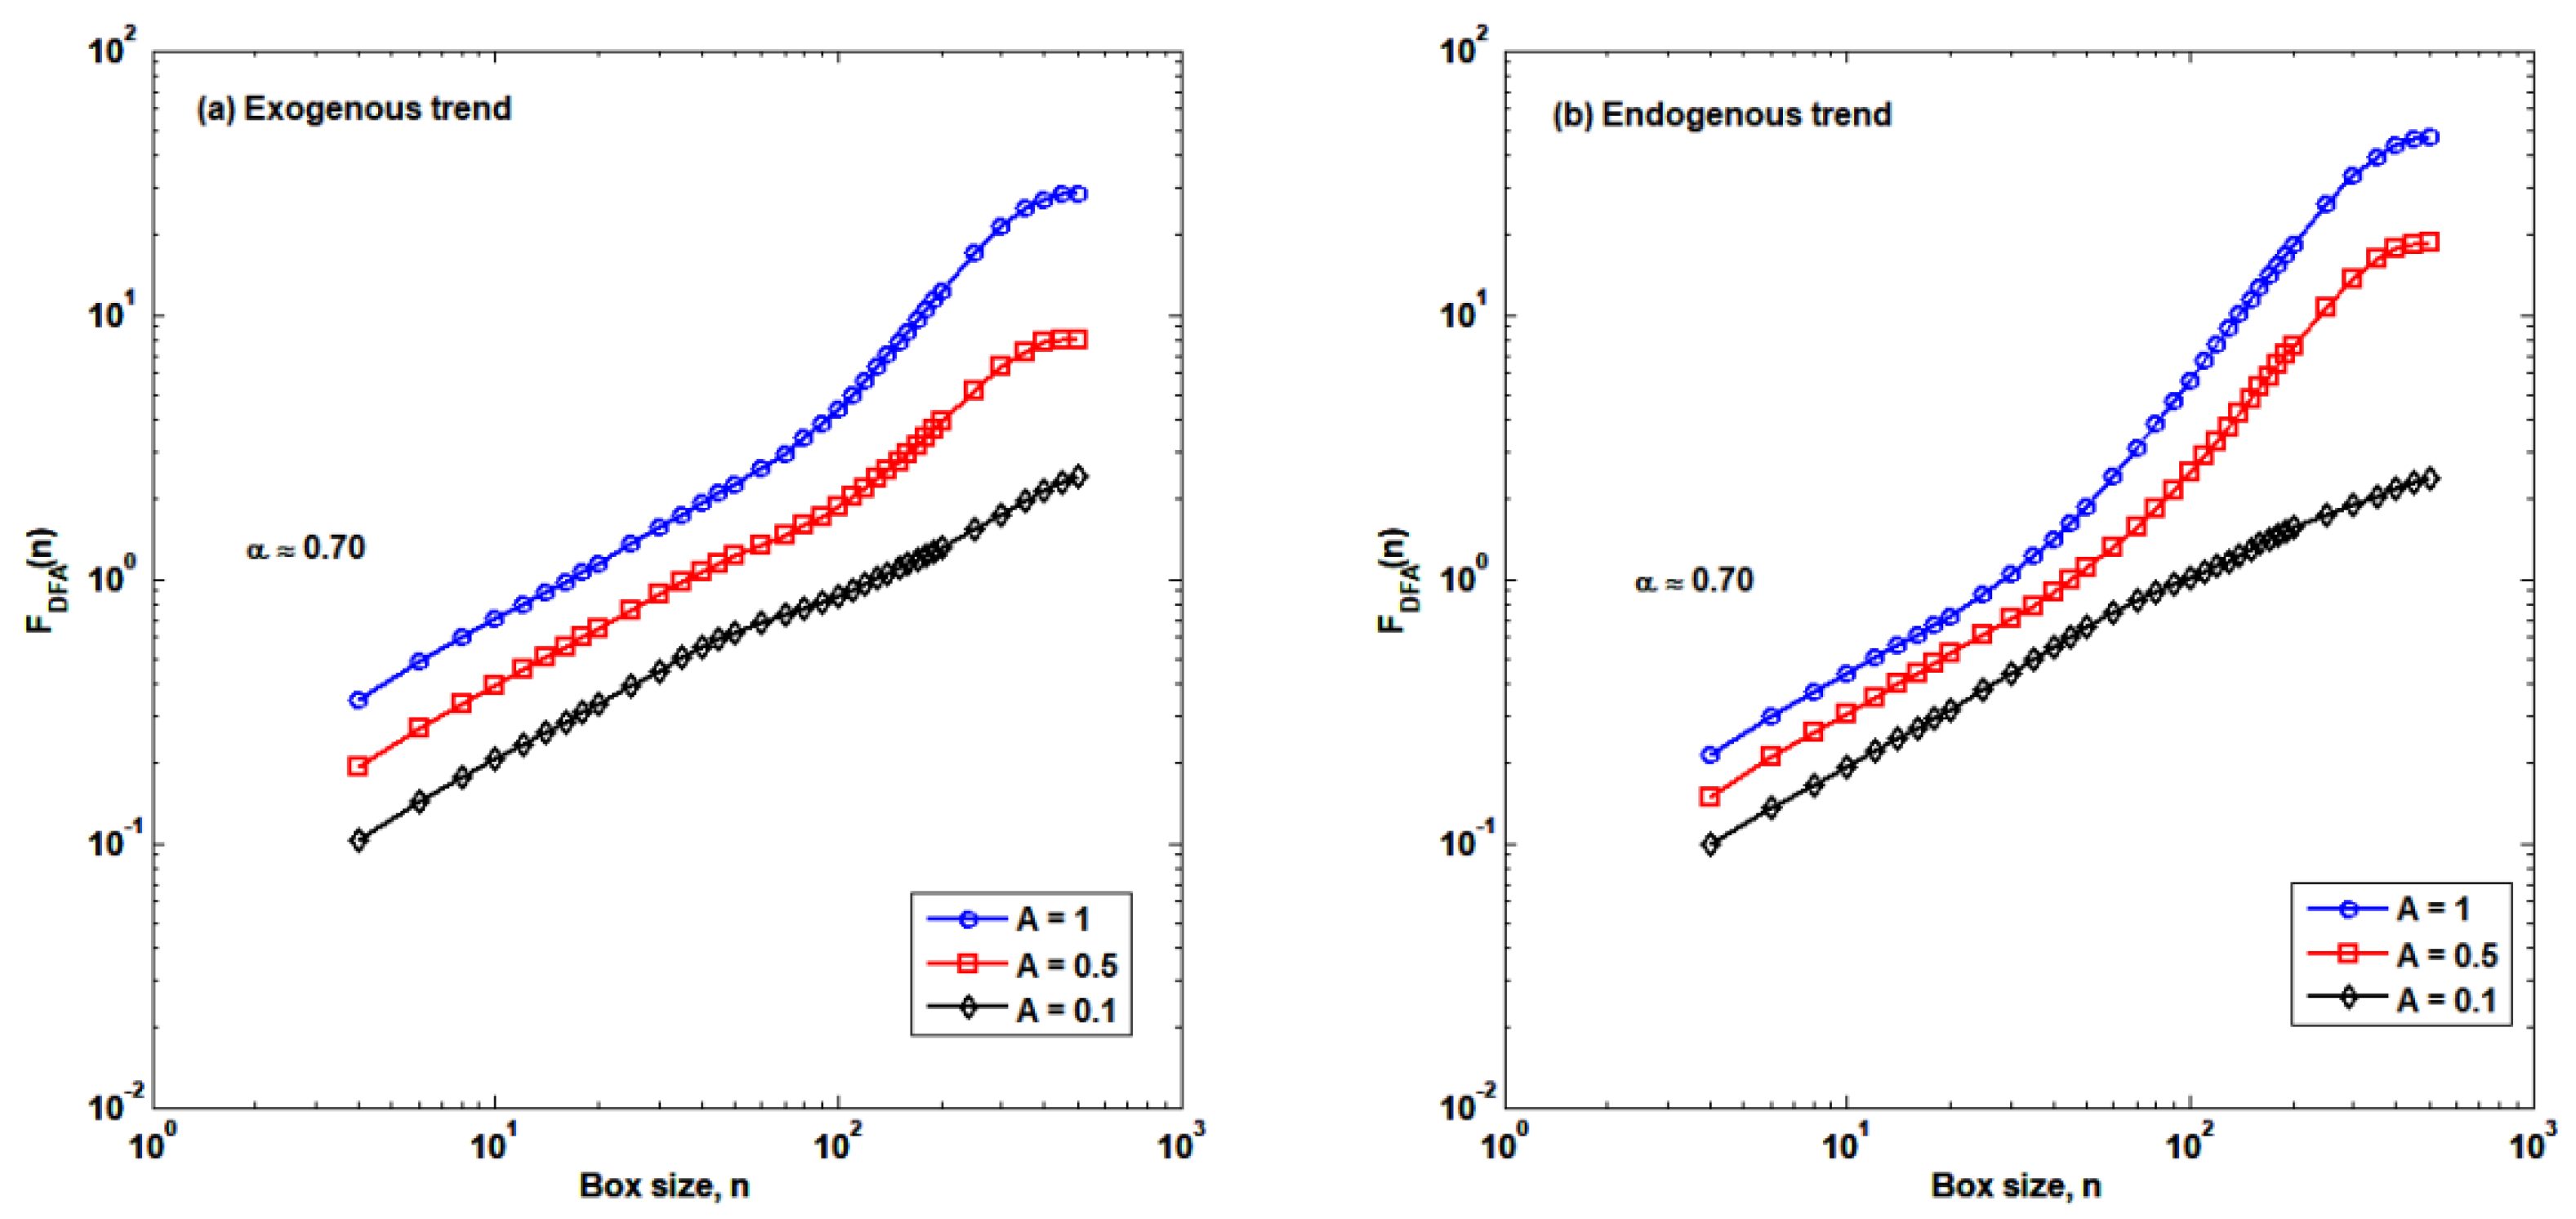
As shown in Figure 6, the authors confirmed that the crossover behavior in DFA analysis could be adjusted by the degree of periodic trends with different amplitudes. Furthermore, it is likely that a periodic trend with small amplitude existed, although no clear evidence existed in the DFA analysis. However, the authors could not determine which trend was more appropriate to describe the behavior observed in the PM2.5 series. Another interesting finding was a big difference observed in the crossover behavior of stations #4 and #5, although they were located in the same city. This may be a clue that, in some respects, endogenous factors overwhelm exogenous ones; station #4 was located by the roadside, while station #5 was in an urban area.
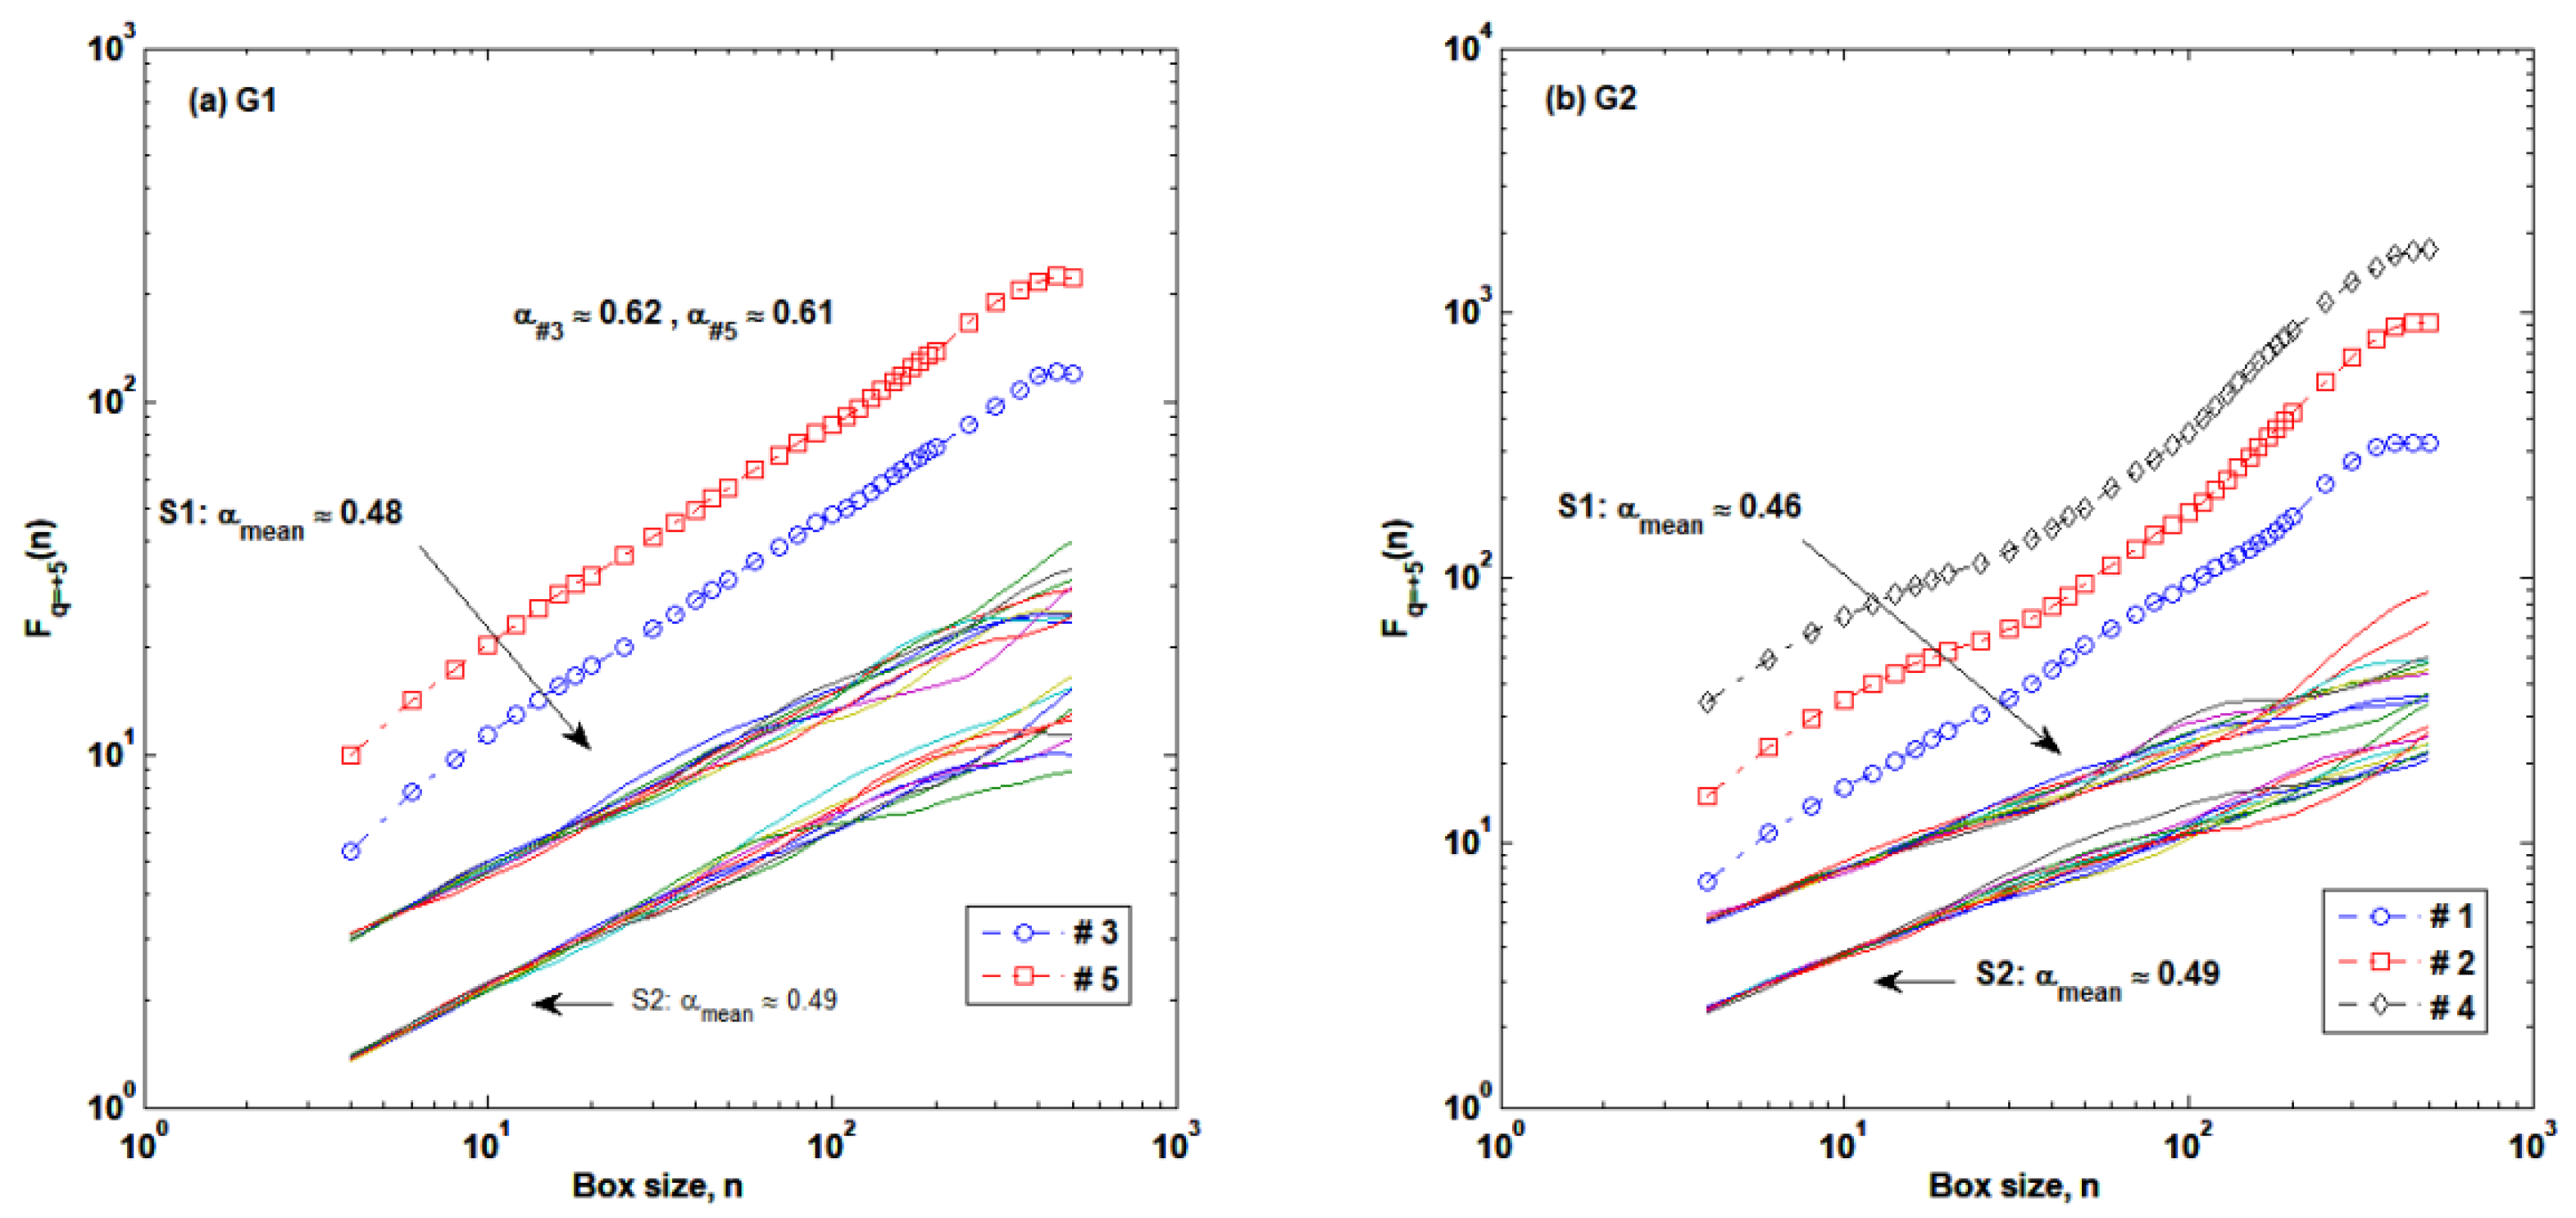
Next, the authors examined the correlation structures of different fluctuation levels using MFDFA analysis with different q-values, as shown in Figure 7 and Figure 8. For the low fluctuations represented by q = 5 , there was no clear scale range in G1, although a strong persistent tendency was seen in small scales, while G2 showed a strong persistent behavior over the whole scale range. For high fluctuations with q = + 5 , G1 and G2 showed a very similar behavior to the DFA cases.

3.2. Cross-Correlation Structures

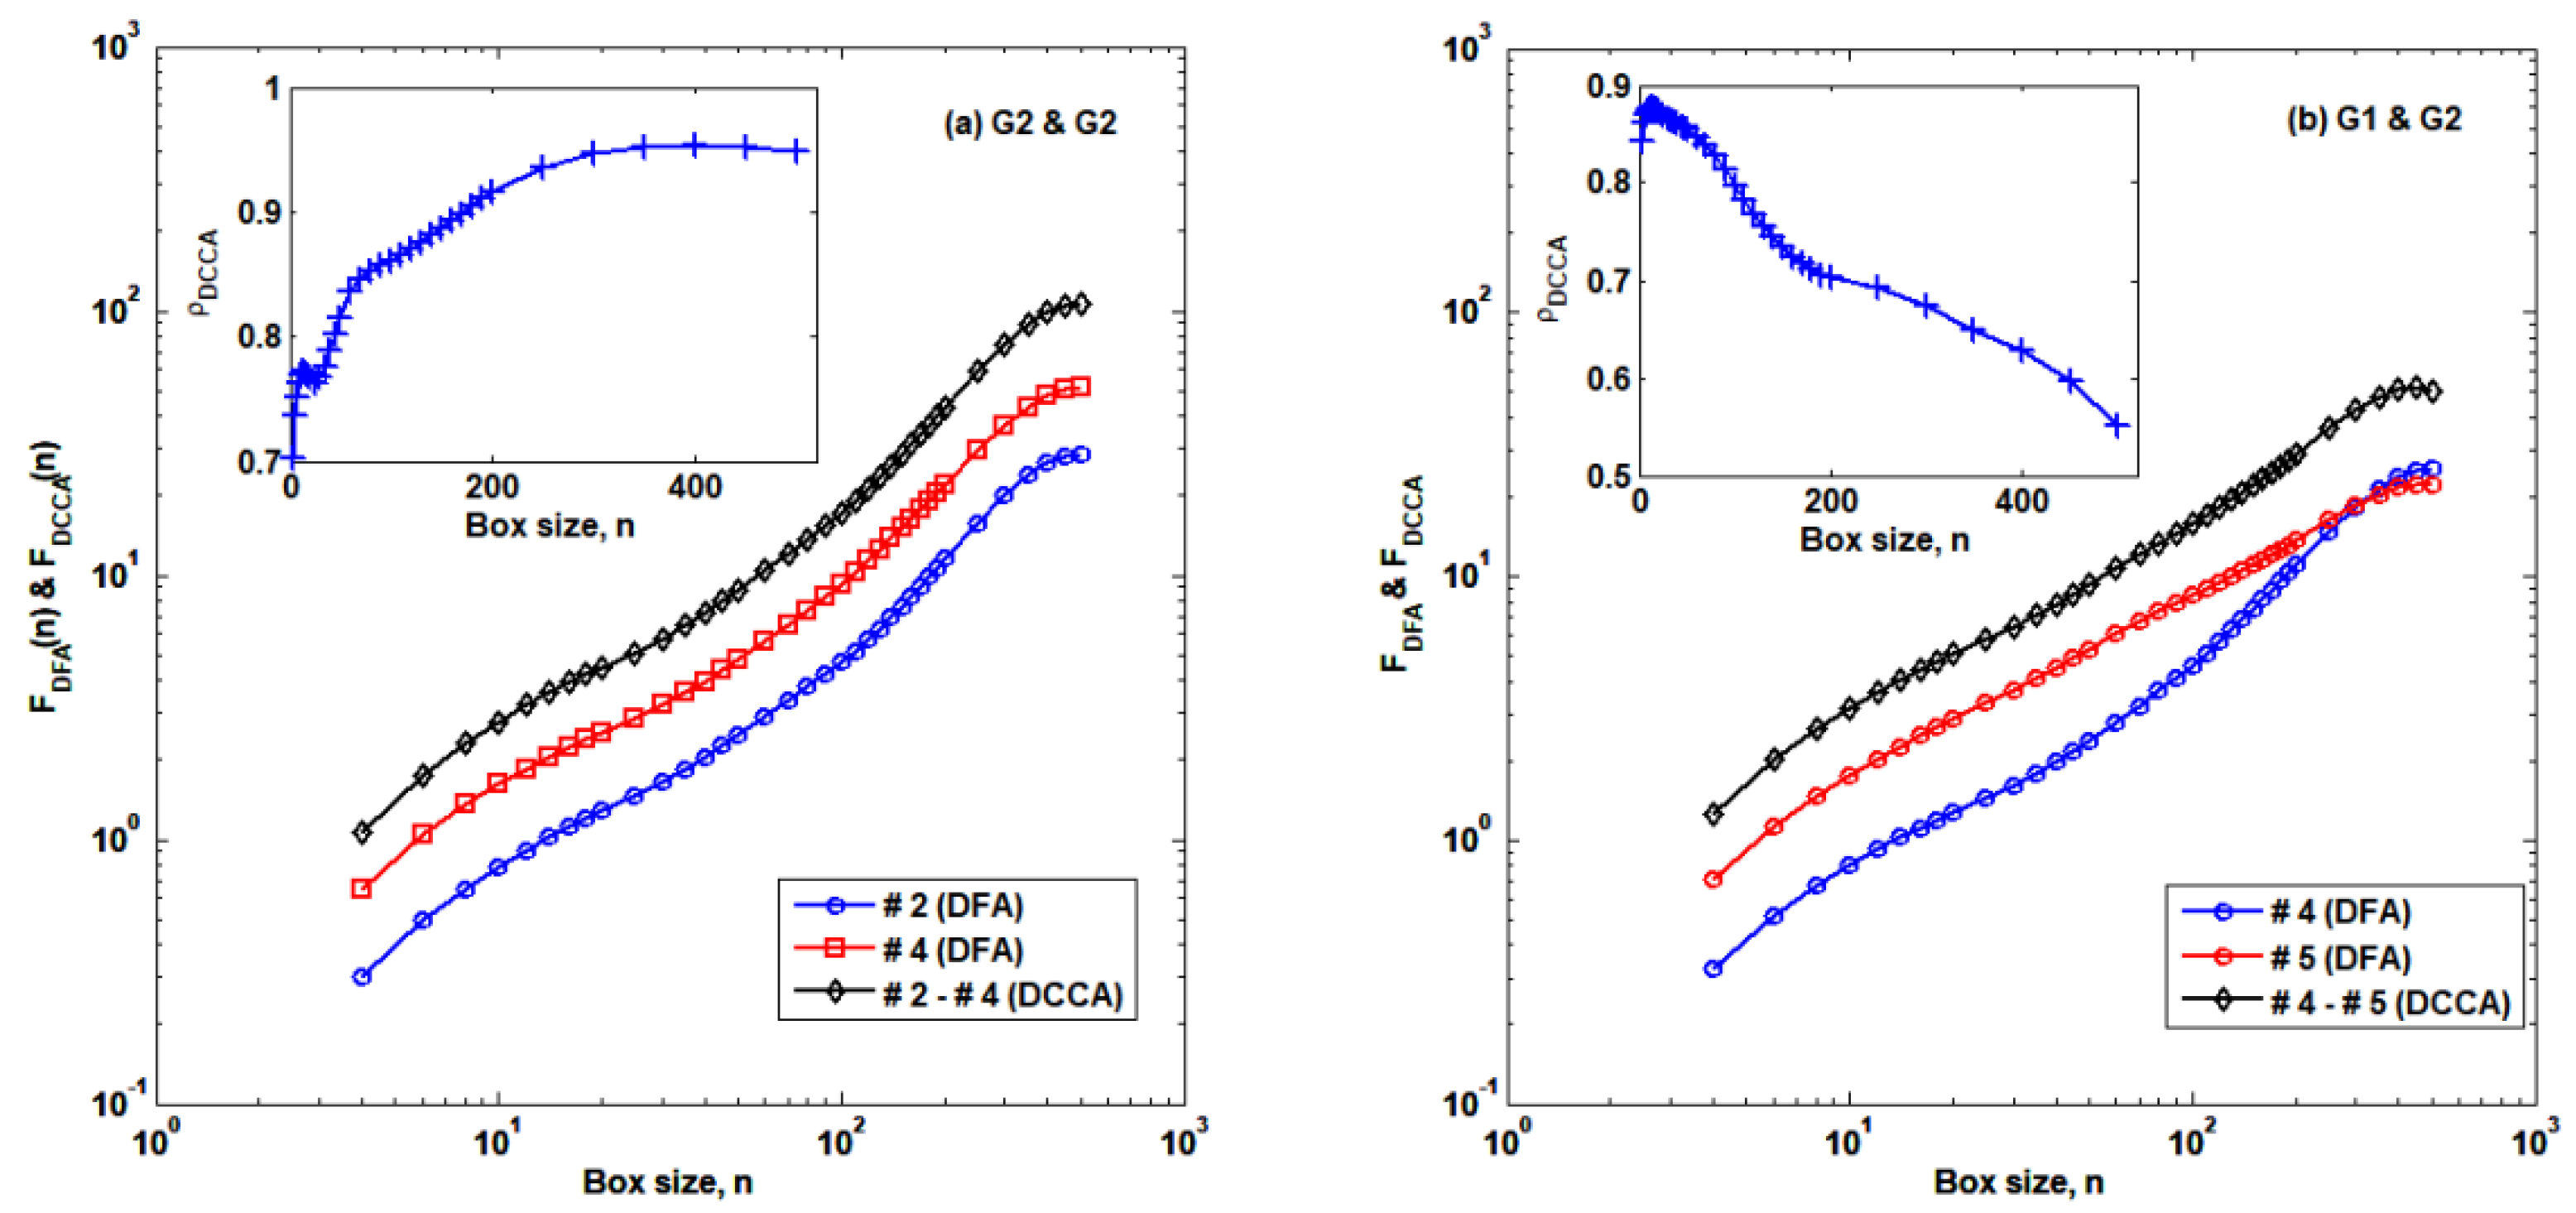
In order for a power-law correlation to exist between two time series, two conditions must be satisfied; one is a common error term in both series, and the other involves sharing the same periodic term overwhelming random errors. As shown in Figure 9, PM2.5 series showed a considerably robust behavior in power-law cross-correlation scaling although there were different behaviors in the DCCA coefficients, i.e., decoupling in different groups and coupling in the same groups. These results imply that all PM2.5 series in the Korean peninsula, which are small compared with China and India, have at least one common error term and share a similar seasonal trend.
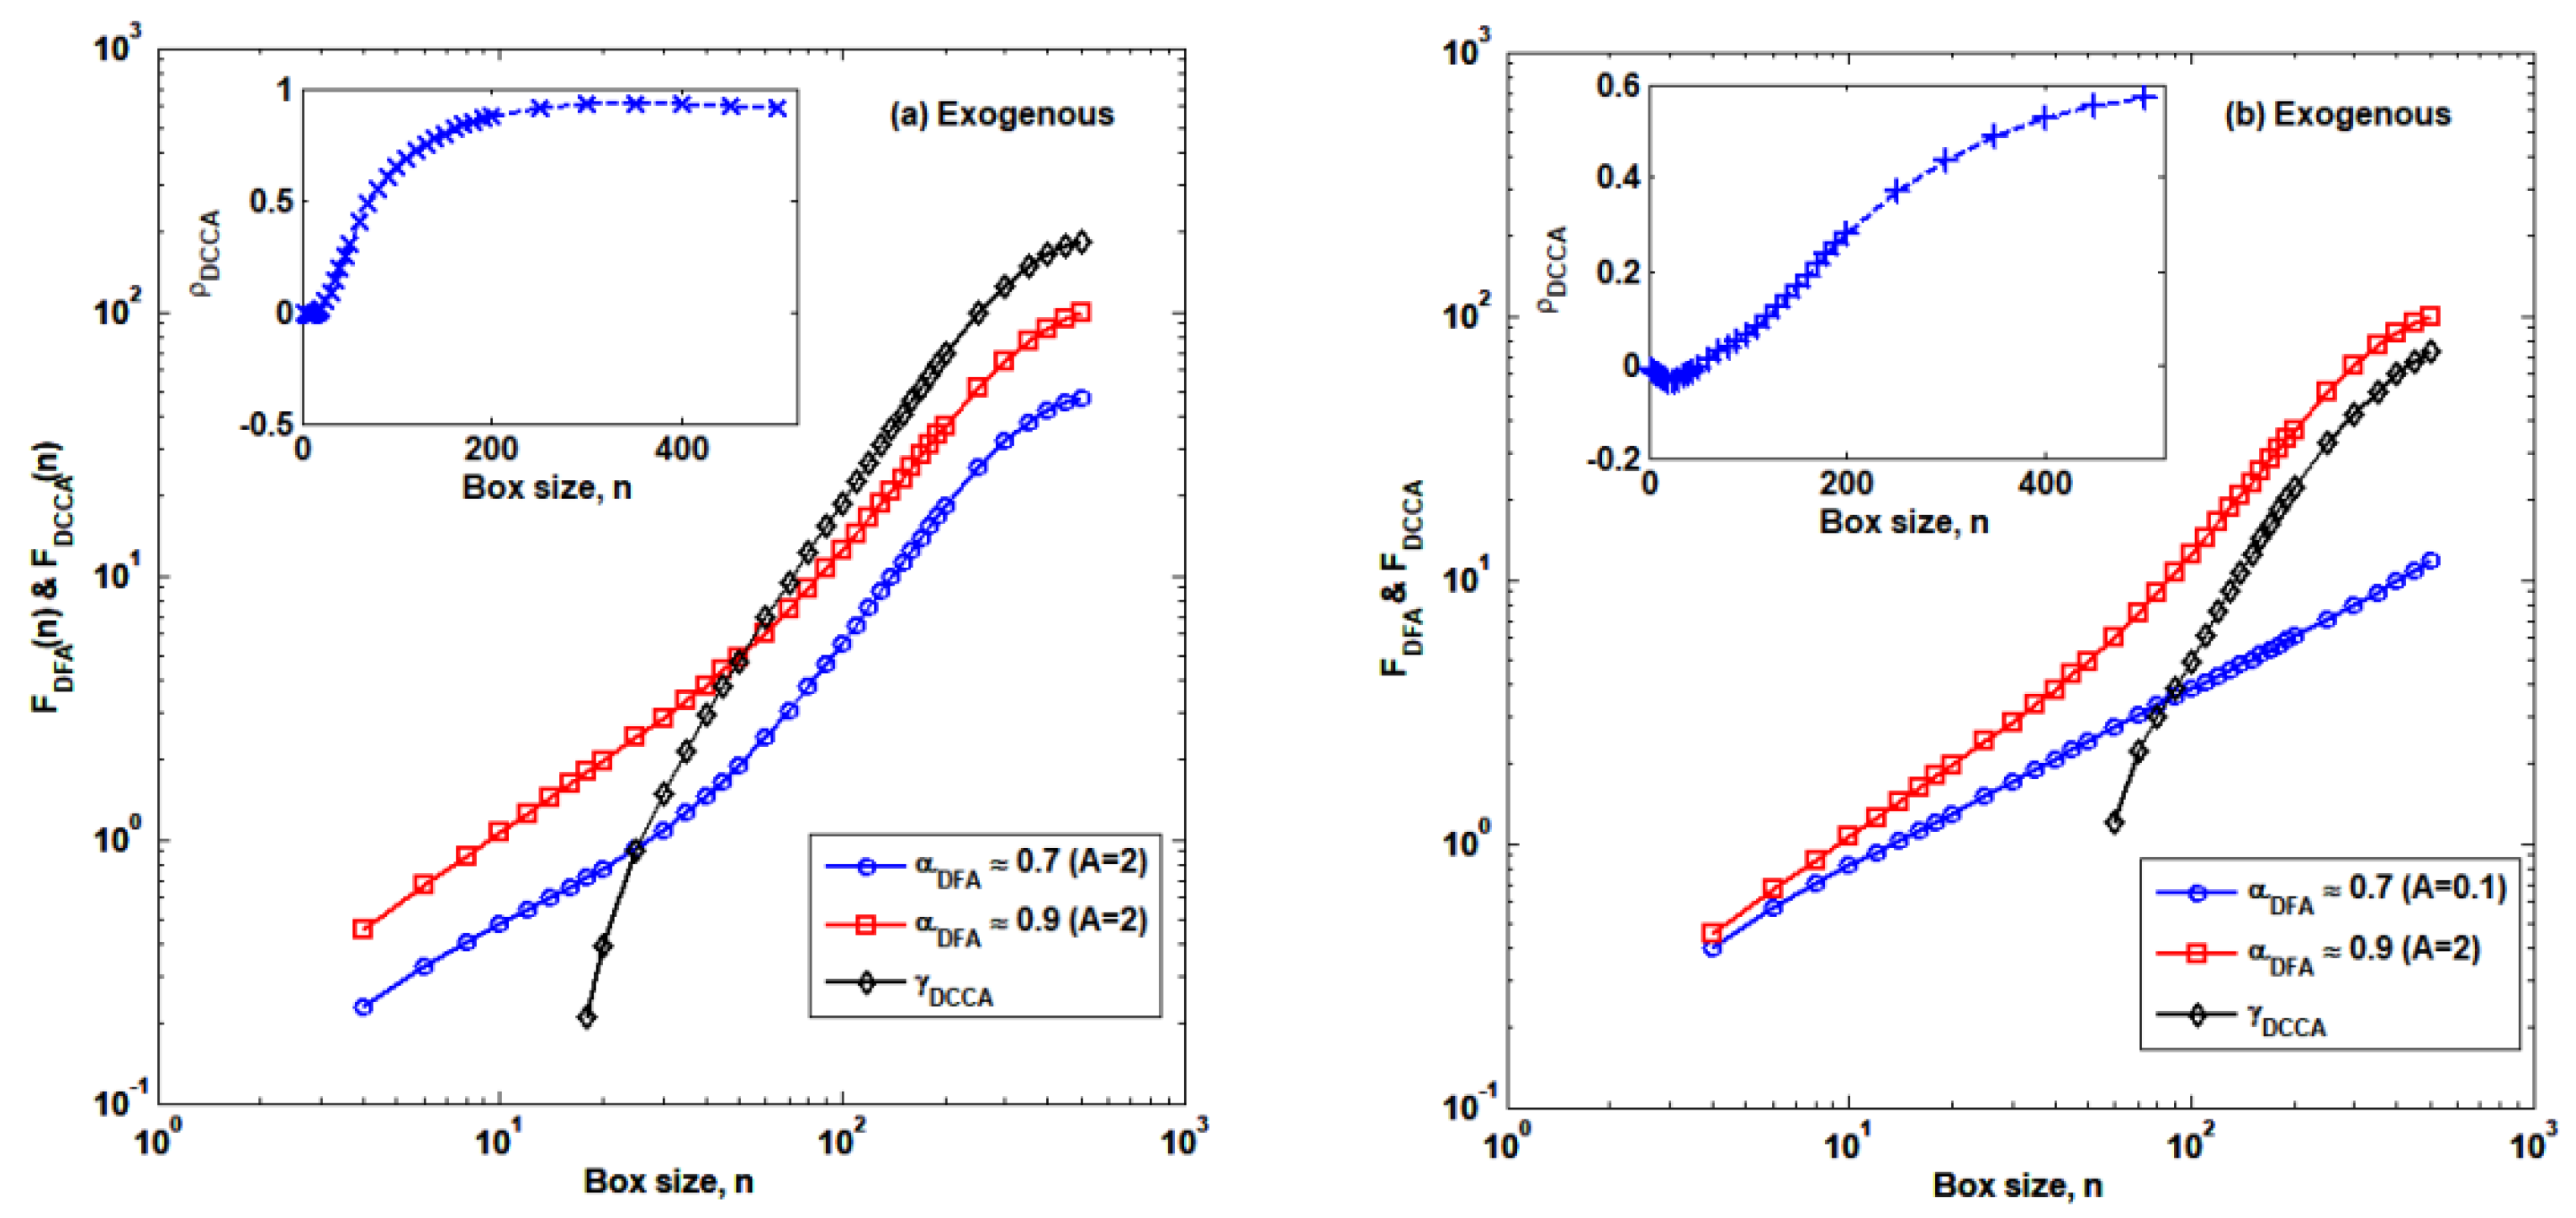
According to the simulation results based on the ARFIMA process with periodic trends, both time series of the same periodic trend with independent identically distributed (i.i.d.) Gaussian variables showed an incomplete behavior in DCCA scaling, i.e., with complex-valued covariance in small scales, as shown in Figure 10. Depending on the characteristics of a periodic trend, i.e., exogenous or endogenous, there are two distinguishable tendencies. When the amplitude of a trend function is large enough to overwhelm the randomness, the endogenous factor promotes coupling instead of the exogenous one. On the other hand, decoupling lasts longer in terms of DCCA coefficients in the endogenous case than the exogenous case, as shown in Figure 10b and Figure 11b. This may be due to the accumulation effect in the endogenous process because a trend is incorporated into the underlying dynamics. Also, an incomplete covariance appeared in cases where both time series had a common error term but periodic terms with different periods. Therefore, the authors concluded that the PM2.5 series shared more than one factor governing the dynamics, and that they were governed by a similar seasonal trend with variable amplitudes.

4. Discussion and Conclusions

In this work, we examined the descriptive statistics of PM2.5 concentrations at 18 sites in Korea, and we confirmed a well-known pronounced seasonal trend in most series. Then, we selected five notable sites with lower and higher mass concentrations and then generated two groups, G1 and G2, in order to conduct comparative analyses on both. To determine the heterogeneity in underlying dynamics depending on the concentration levels, we analyzed the auto- and cross-correlation structures of both groups, i.e., G1 and G2, consisting of stations #15 and #18 and stations #5, #11, and #16, respectively. They showed a different behavior in DFA (detrended fluctuation analysis); G1 showed no crossover, while G2 showed strong evidence of crossover. This finding implies that G2 has two governing dynamics depending on the scale, while G2 has one dynamic. In terms of the impact of trans-boundary transport from China, G1 has little influence while G2 has strong influence. Furthermore, to confirm the heterogeneity between groups, we conducted DCCA (detrended cross-correlation analysis) on two series belonging to the same groups and different groups. Our finding strongly supports the heterogeneity in both. In the same group, coupling or synchronization increased as the scale increased, while, in the different group, decoupling between both series developed over increasing scale. This can be a starting point to categorize the specific region into several groups based on DCCA behaviors. Lastly, in order to reproduce the auto-correlation properties produced from real PM2.5 time series, we presented the ARFIMA (auto-regressive fractionally integrated moving average) process. Although these models succeeded in reproducing crossover behaviors in the auto-correlation structure, they yielded no valid results in decoupling behavior among heterogeneous groups. Also, through the analysis of the ARFIMA process, we found slightly different behavior in the DCCA analysis when incorporating the trend term, whether exogenous or endogenous.
In summary, the PM2.5 accumulation process operates in a complicated way and shows different dynamical behavior depending on mass concentration. However, using simple DFA analysis, we could categorize all PM2.5 time series into two groups with and without crossovers. Then, we confirmed that DCCA analysis works as an effective tool for checking the heterogeneity of DCCA coefficient behavior over different scales.

Author Contributions

Conceptualization, G.L. and S.M.; methodology, G.L. and S.M.; modeling, G.L. and S.M.; validation, S.M.; writing—original draft preparation, G.L.; writing—review and editing, S.M.; funding acquisition, S.M.

Funding

This work was supported by the National Research Foundation of Korea (NRF) in a grant funded by the Korean government (MSIT) (No. 2017R1C1B5017491).

Conflicts of Interest

The authors declare no conflicts of interest.

References

  1. Intergovernmental Panel on Climate Change. Climate Change 2013: The Physical Science Basis; Stocker, T.F., Qin, D., Plattner, G.-K., Tignor, M.M.B., Allen, S.K., Boschung, J., Nauels, A., Xia, Y., Bex, V., et al., Eds.; Cambridge: New York, NY, USA, 2013; ISBN 978-1-10766-182-0.
  2. He, K.; Yang, F.; Ma, Y.; Zhang, Q.; Yao, X.; Chan, C.K.; Cadle, S.; Chan, T.; Mulawa, P. The characteristics of PM2.5 in Beijing, China. Atmos. Environ. 2001, 35, 4959–4970. [Google Scholar] [CrossRef]
  3. Yang, F.; Tan, J.; Zhao, Q.; Du, Z.; He, K.; Ma, Y.; Duan, F.; Chen, G.; Zhao, Q. Characteristics of PM2.5 speciation in representative megacities and across China. Atmos. Chem. Phys. 2011, 11, 5207–5219. [Google Scholar] [CrossRef] [Green Version]
  4. Liu, Z.; Gao, W.; Yu, Y.; Hu, B.; Xin, J.; Sun, Y.; Wang, L.; Wang, G.; Bi, X.; Zhang, G.; et al. Characteristics of PM2.5 mass concentrations and chemical species in urban and background areas of China: Emerging results from the CARE-China network. Atmos. Chem. Phys. 2018, 18, 8849–8871. [Google Scholar] [CrossRef] [Green Version]
  5. Li, X.; Li, S.; Xiong, Q.; Yang, X.; Qi, M.; Zhao, W.; Wang, X. Characteristics of PM2.5 chemical compositions and their effect on atmospheric visibility in urban Beijing, China during the heating season. Int. J. Environ. Res. Public Health 2018, 15, 1924. [Google Scholar] [CrossRef] [PubMed] [Green Version]
  6. Windsor, H.L.; Toumi, R. Scaling and persistence of UK pollution. Atmos. Environ. 2001, 35, 4545–4556. [Google Scholar] [CrossRef]
  7. Zhang, C.; Ni, Z.; Ni, L. Multifractal detrended cross-correlation analysis between PM2.5 and meteorological factors. Physica A 2015, 438, 114–123. [Google Scholar] [CrossRef]
  8. Zhang, C.; Ni, Z.; Ni, L.; Li, J.; Zhou, L. Asymmetric multifractal detrending moving average analysis in time series of PM2.5 concentration. Physica A 2016, 457, 322–330. [Google Scholar] [CrossRef]
  9. Zhang, C.; Ni, Z.; Ni, L. Asymmetric multiscale behavior in PM2.5 time series: Based on asymmetric MS-DFA. Physica A 2016, 461, 355–365. [Google Scholar] [CrossRef]
  10. Zhao, Y.; Hasan, Y.A. Machine learning algorithms for predicting roadside fine particulate matter concentration level in Hong Kong Central. Comput. Ecol. Softw. 2013, 3, 61–73. [Google Scholar]
  11. Chen, H.; Lu, X.; Chang, Y.; Xue, W. Heavy metal contamination in dust from kindergartens and elementary schools in Xi’an, China. Environ. Earth Sci. 2014, 71, 2701–2709. [Google Scholar] [CrossRef]
  12. Feng, X.; Li, Q.; Zhu, Y.; Hou, J.; Jin, L.; Wang, J. Artificial neural networks forecasting of PM2.5 pollution using air mass trajectory based geographic model and wavelet transformation. Atmos. Environ. 2015, 107, 118–128. [Google Scholar] [CrossRef]
  13. Zhao, X.; Zhang, X.; Xu, X.; Xu, J.; Meng, W.; Pu, W. Seasonal and diurnal variations of ambient PM2.5 concentration in urban and rural environments in Beijing. Atmos. Environ. 2009, 43, 2893–2900. [Google Scholar] [CrossRef]
  14. Tai, A.P.K.; Mickley, L.J.; Jacob, D.J. Correlations between fine particulate matter (PM2.5) and meteorological variables in the United States: Implications for the sensitivity of PM2.5 to climate change. Atmos. Environ. 2010, 44, 3976–3984. [Google Scholar] [CrossRef]
  15. Varotsos, C.; Ondov, J.; Efstathiou, M. Scaling properties of air pollution in Athens, Greece and Baltimore, Maryland. Atmos. Environ. 2005, 39, 4041–4047. [Google Scholar] [CrossRef]
  16. Meraz, M.; Rodriguez, E.; Femat, R.; Echeverria, J.C.; Alvarez-Ramirez, J. Statistical persistence of air pollutants (O3, SO2, NO2 and PM10) in Mexico City. Physica A 2015, 427, 202–217. [Google Scholar] [CrossRef]
  17. Peng, C.-K.; Buldyrev, S.V.; Havlin, S.; Simons, M.; Stanley, H.E.; Goldberger, A.L. Mosaic organization of DNA nucleotides. Phys. Rev. E 1994, 49, 1685. [Google Scholar] [CrossRef] [Green Version]
  18. Hu, K.; Ch.Ivanov, P.; Chen, Z.; Carpena, P.; Stanley, H.E. Effect of trends on detrended fluctuation analysis. Phys. Rev. E 2001, 64, 011114. [Google Scholar] [CrossRef] [Green Version]
  19. Chen, Z.; Ivanov, P.C.; Hu, K.; Stanley, H.E. Effect of nonstationarities on detrended fluctuation analysis. Phys. Rev. E 2002, 65, 041107. [Google Scholar] [CrossRef] [Green Version]
  20. Horvatic, D.; Stanley, H.E.; Podobnik, B. Detrended cross-correlation analysis for non-stationary time series with periodic trends. Europhys. Lett. 2011, 94, 18007. [Google Scholar] [CrossRef] [Green Version]
  21. Lim, G.; Min, S. Effect of Outliers and Non-consecutive Data Points on the Detrended Cross-Correlation Analysis. J. Korean Phys. Soc. 2018, 72, 545–550. [Google Scholar] [CrossRef]
  22. Zhang, Q.; Jiang, X.; Tong, D.; Davis, S.J.; Zhao, H.; Geng, G.; Feng, T.; Zheng, B.; Lu, Z.; Streets, D.G.; et al. Transboundary health impacts of transported global air pollution and international trade. Nature 2017, 543, 705–709. [Google Scholar] [CrossRef] [PubMed] [Green Version]
  23. Podobnik, B.; Stanley, H.E. Detrended cross-correlation analysis: A new method for analyzing two nonstationary time series. Phys. Rev. Lett. 2008, 100, 084102. [Google Scholar] [CrossRef] [PubMed] [Green Version]
  24. Kantelhardt, J.W.; Zschiegner, S.A.; Koscielny-Bunde, E.; Havlin, S.; Bunde, A.; Stanley, H.E. Multifractal detrended fluctuation analysis of nonstationary time series. Physica A 2002, 316, 87–114. [Google Scholar] [CrossRef] [Green Version]
  25. Buldyrev, S.V.; Goldberger, A.L.; Havlin, S.; Mantegna, R.N.; Matsa, M.E.; Peng, C.-K.; Simons, M.; Stanley, H.E. Long-range correlation properties of coding and noncoding DNA sequences: GenBank analysis. Phys. Rev. E 1995, 51, 5084. [Google Scholar] [CrossRef] [PubMed]
  26. Feder, J. Fractals; Plenum Press: New York, NY, USA, 1988. [Google Scholar]
  27. Zebende, G.F. DCCA cross-correlation coefficient: Quantifying level of cross-correlation. Physica A 2011, 390, 614–618. [Google Scholar] [CrossRef]
  28. Podobnik, B.; Jiang, Z.-Q.; Zhou, W.-X.; Stanley, H.E. Statistical tests for power-law cross-correlated processes. Phys. Rev. E 2011, 84, 066118. [Google Scholar] [CrossRef] [Green Version]
  29. Theiler, J.; Eubank, S.; Longtin, A.; Galdrikian, B.; Farmer, J.D. Testing for nonlinearity in time series: The method of surrogate data. Physica D 1992, 58, 77–94. [Google Scholar] [CrossRef] [Green Version]
  30. Podobnik, B.; Ivanov, P.C.; Biljakovic, K.; Horvatic, D.; Stanley, H.E.; Grosse, I. Fractionally integrated process with power-law correlations in variables and magnitudes. Phys. Rev. E 2005, 72, 026121. [Google Scholar] [CrossRef] [Green Version]
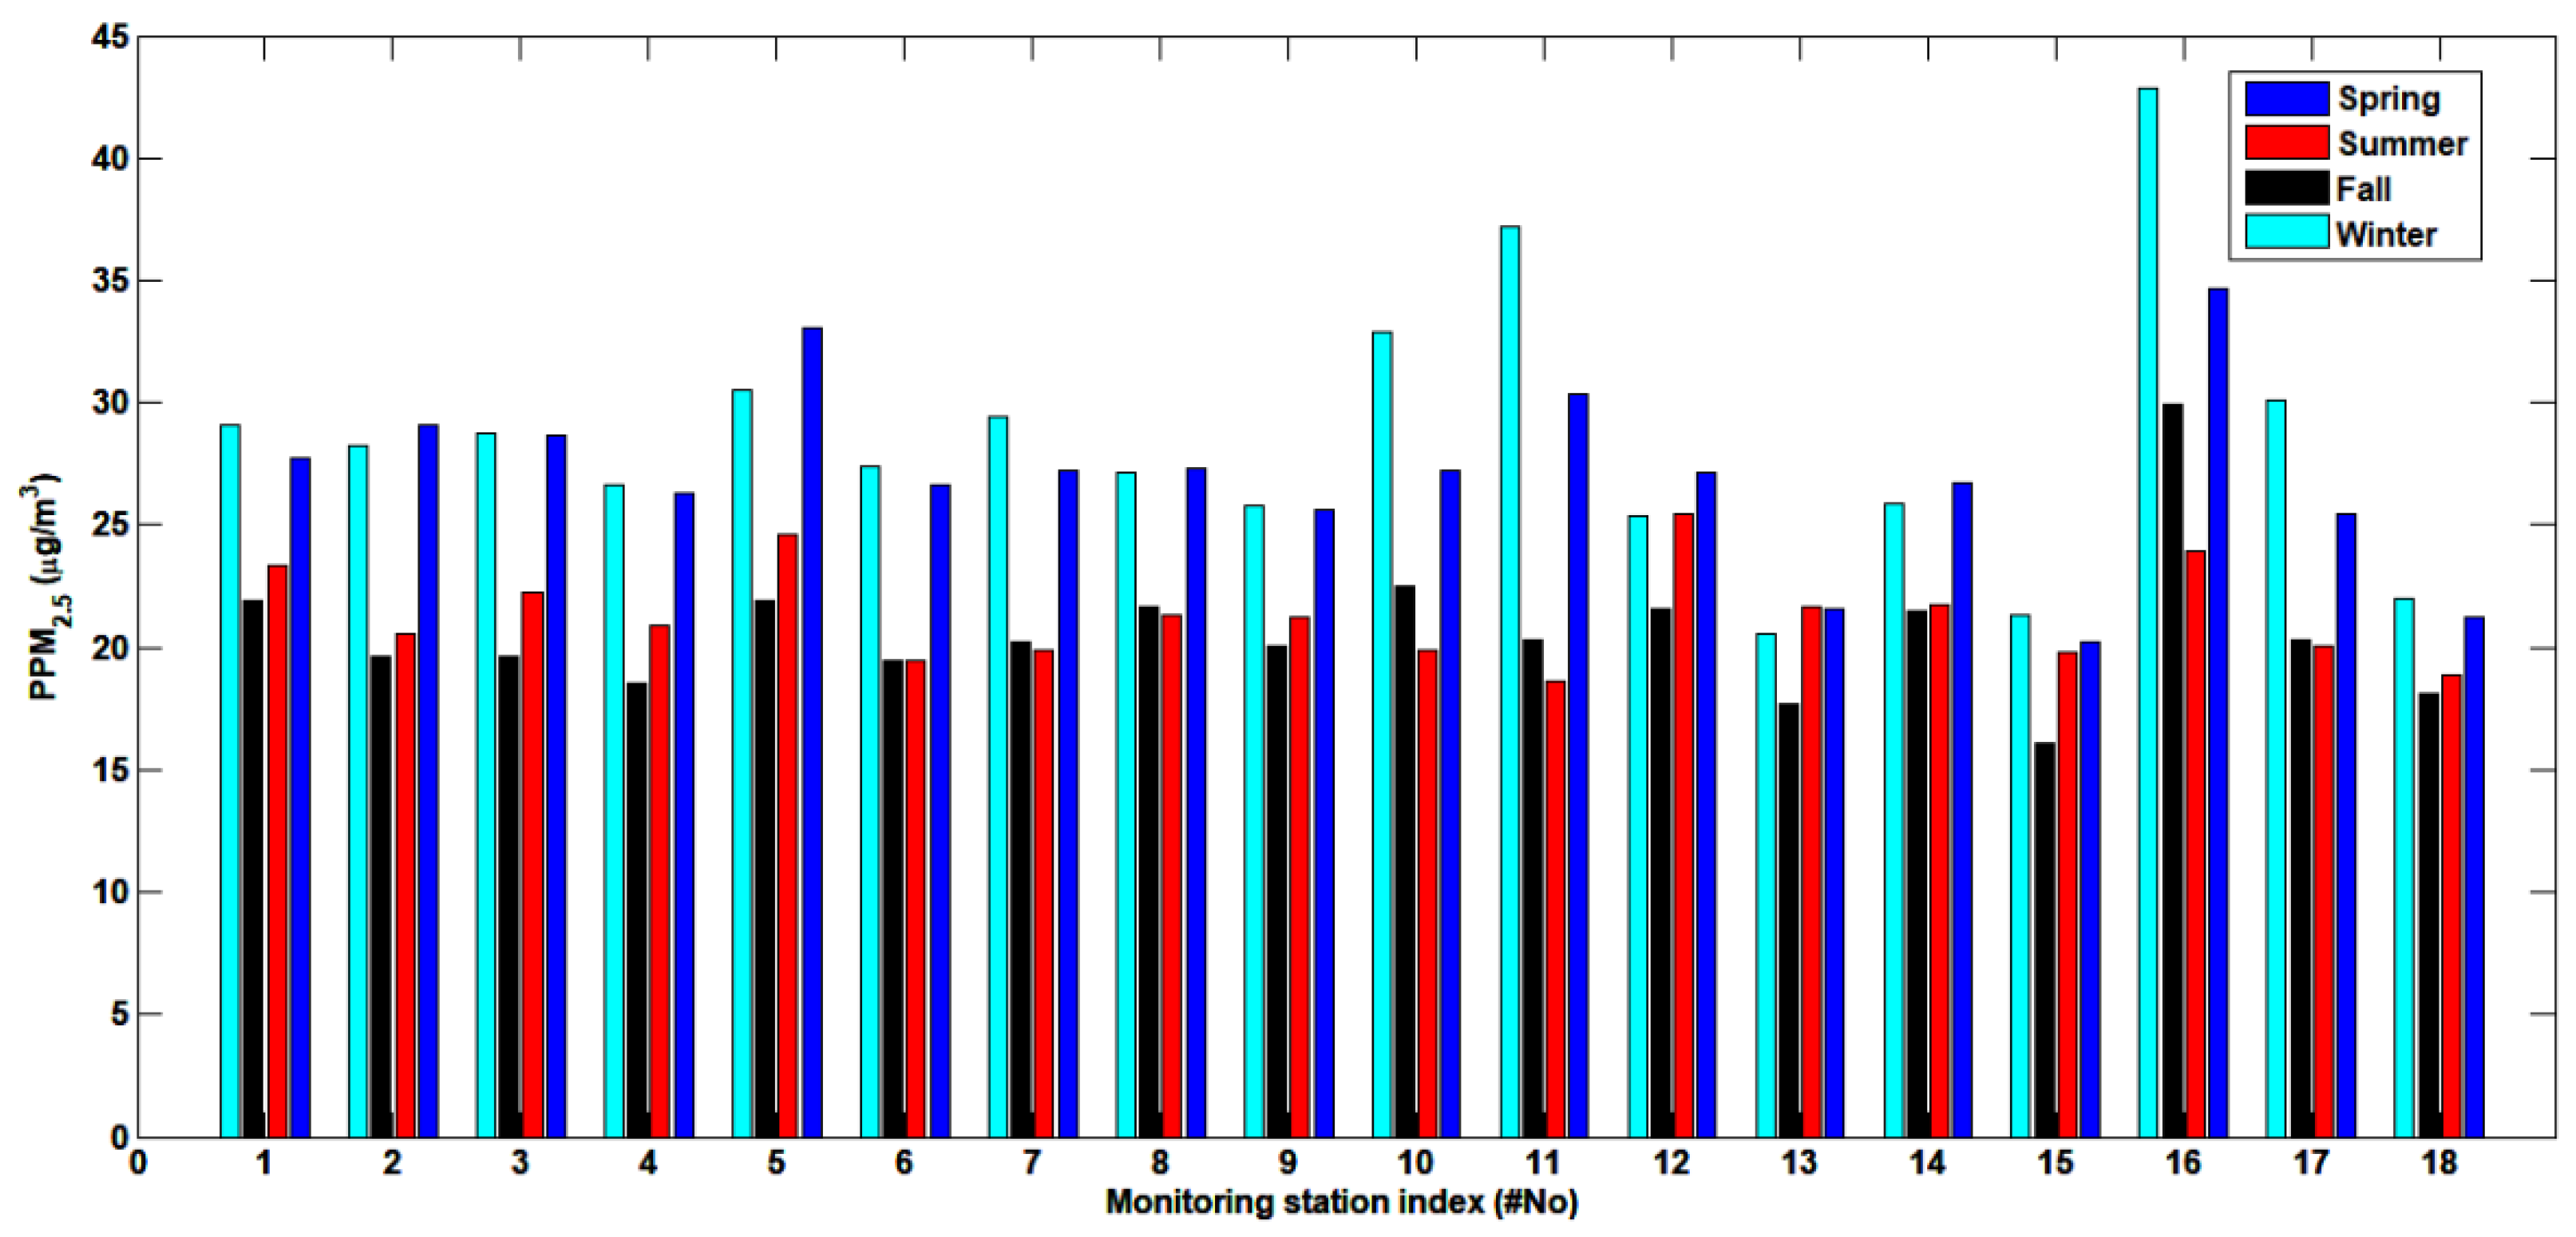
Figure 1. PM2.5 (particulate matter of diameter less than 2.5 μ m ) seasonal average concentrations are plotted for 18 monitoring stations across seasons for the period from 1 January 2015 to 31 December 2017. Stations #13, #15, and #18 show a relatively low level in concentration, while stations #5, #10, #11, and #16 show a high level in concentration.
Applsci 09 05441 g001
Figure 2. PM2.5 charts with different concentration levels for seasons. G2 (stations #5, #11, and #16) has days with a relatively severe concentration in the spring and winter, while G1 (stations #15 and #18) shows a mild status over all seasons.
Applsci 09 05441 g002
Figure 3. The seasonal trend is weak in G1 (stations #15 and #18), while G2 (stations #5, #11, and #16) shows a strong seasonality. There is a surprising difference in PM2.5 concentration between stations #16 and #18, although they are located in the same city. This is a clue that PM2.5 concentration could be strongly affected by an endogenous factor rather than an exogenous one.
Applsci 09 05441 g003
Figure 4. Detrended fluctuations vs. box size plotted for two groups of surrogate data, namely, S1 and S2. S1 represents the shuffled series of an original time series, and S2 represents the shuffled series of a Fourier-phase randomized series of an original series. They have almost the same kurtosis. The authors determined the scaling range to be in the interval of [10, 200] days, which was free from the finite size effect. All other series showed a similar behavior.
Applsci 09 05441 g004
Figure 5. Detrended fluctuation variance vs. box size. (a) G1 shows no evidence of crossover, meaning no periodic trend or one with less amplitude, while (b) G2 exhibits pronounced evidence of crossovers, meaning the existence of periodic trends with variable amplitudes.
Applsci 09 05441 g005
Figure 6. Detrended fluctuations vs. box size from ARFIMA (auto-regressive fractionally integrated moving average) processes. The authors added a sinusoidal periodic trend (amplitude = A , period T = 360) to the ARFIMA process (SD = 1, α = 0.7) both (a) exogenously and (b) endogenously. Although there is no noticeable difference in both, the crossover behavior seems to be controlled by the magnitude of the periodic trend, i.e., the amplitude.
Applsci 09 05441 g006
Figure 7. Multifractal fluctuation functions ( q = 5 ) vs. box size. In order to determine the scaling range, the authors added the plots of both groups of the surrogate dataset. (a) there is no sign of stable scaling range for stations #3 and #5. (b) for stations #2 and #4, a noticeable crossover appears in the large scale.
Applsci 09 05441 g007
Figure 8. Multifractal fluctuation functions ( q = + 5 ) vs. box size. As a reference, the authors added the plots of both groups of the surrogate dataset. For (a) G1 and (b) G2, the overall behavior is very similar to the detrended fluctuation analysis (DFA) functions. Also, the scaling exponents are not different from those of DFA.
Applsci 09 05441 g008
Figure 9. Detrended cross-correlation analysis (DCCA) fluctuation functions are plotted with respect to box size for a pair of time series from the same group and different groups. Different behaviors in the DCCA coefficients can be observed, as shown in insets: coupling in (a) and decoupling in (b). Stable cross-correlated power-law behaviors remain in both, stressing that at least one common factor governs their dynamics.
Applsci 09 05441 g009
Figure 10. (a) DCCA fluctuation functions plotted with respect to box size for a pair of time series generated from the ARFIMA process with independent identically distributed (i.i.d.) Gaussian variables and exogenous periodic trends of different amplitudes (A = 2 and A = 0.1). (b) the complex values in fluctuation covariance increase in size as the randomness increases due to a difference in amplitudes, and the correlation coefficient increases slowly.
Applsci 09 05441 g010
Figure 11. DCCA fluctuation functions vs. box sizes for a pair of time series generated from the ARFIMA process with i.i.d. Gaussian variables and endogenous periodic trends of different amplitudes (A = 2 and A = 0.1). There is no complex value in fluctuation covariance, and the behaviors of DCCA coefficients are considerably different, as shown in the inset. (a) The cross-correlation is overwhelmed by the periodic trend, which is also shown in the scaling exponent, while (b) the randomness overwhelms the trend and, furthermore, its effect is accumulated in comparison to an exogenous case.
Applsci 09 05441 g011