Since the proposed method consists of detection and segmentation steps, the results of each step are presented in separated sections. In the detection step, the methodology employed to select the most appropriate configuration for the MLP is presented. In addition, a comparison with eleven vessel enhancement methods is carried out by using the area under the ROC curve () as comparative metric. On the segmentation step, the selection process to define a specific method that complements the proposed detection step as an integral vessel extraction approach is introduced. Moreover, this section presents the comparative analysis of the proposed coronary arteries segmentation method with respect to twelve state-of-the-art blood vessel extraction methods in terms of six binary classification metrics.
The computational experiments were implemented on a computer with an Intel Core i7, 4 GB of RAM, and 3.50 GHz processor using the version 2016b of Matlab.
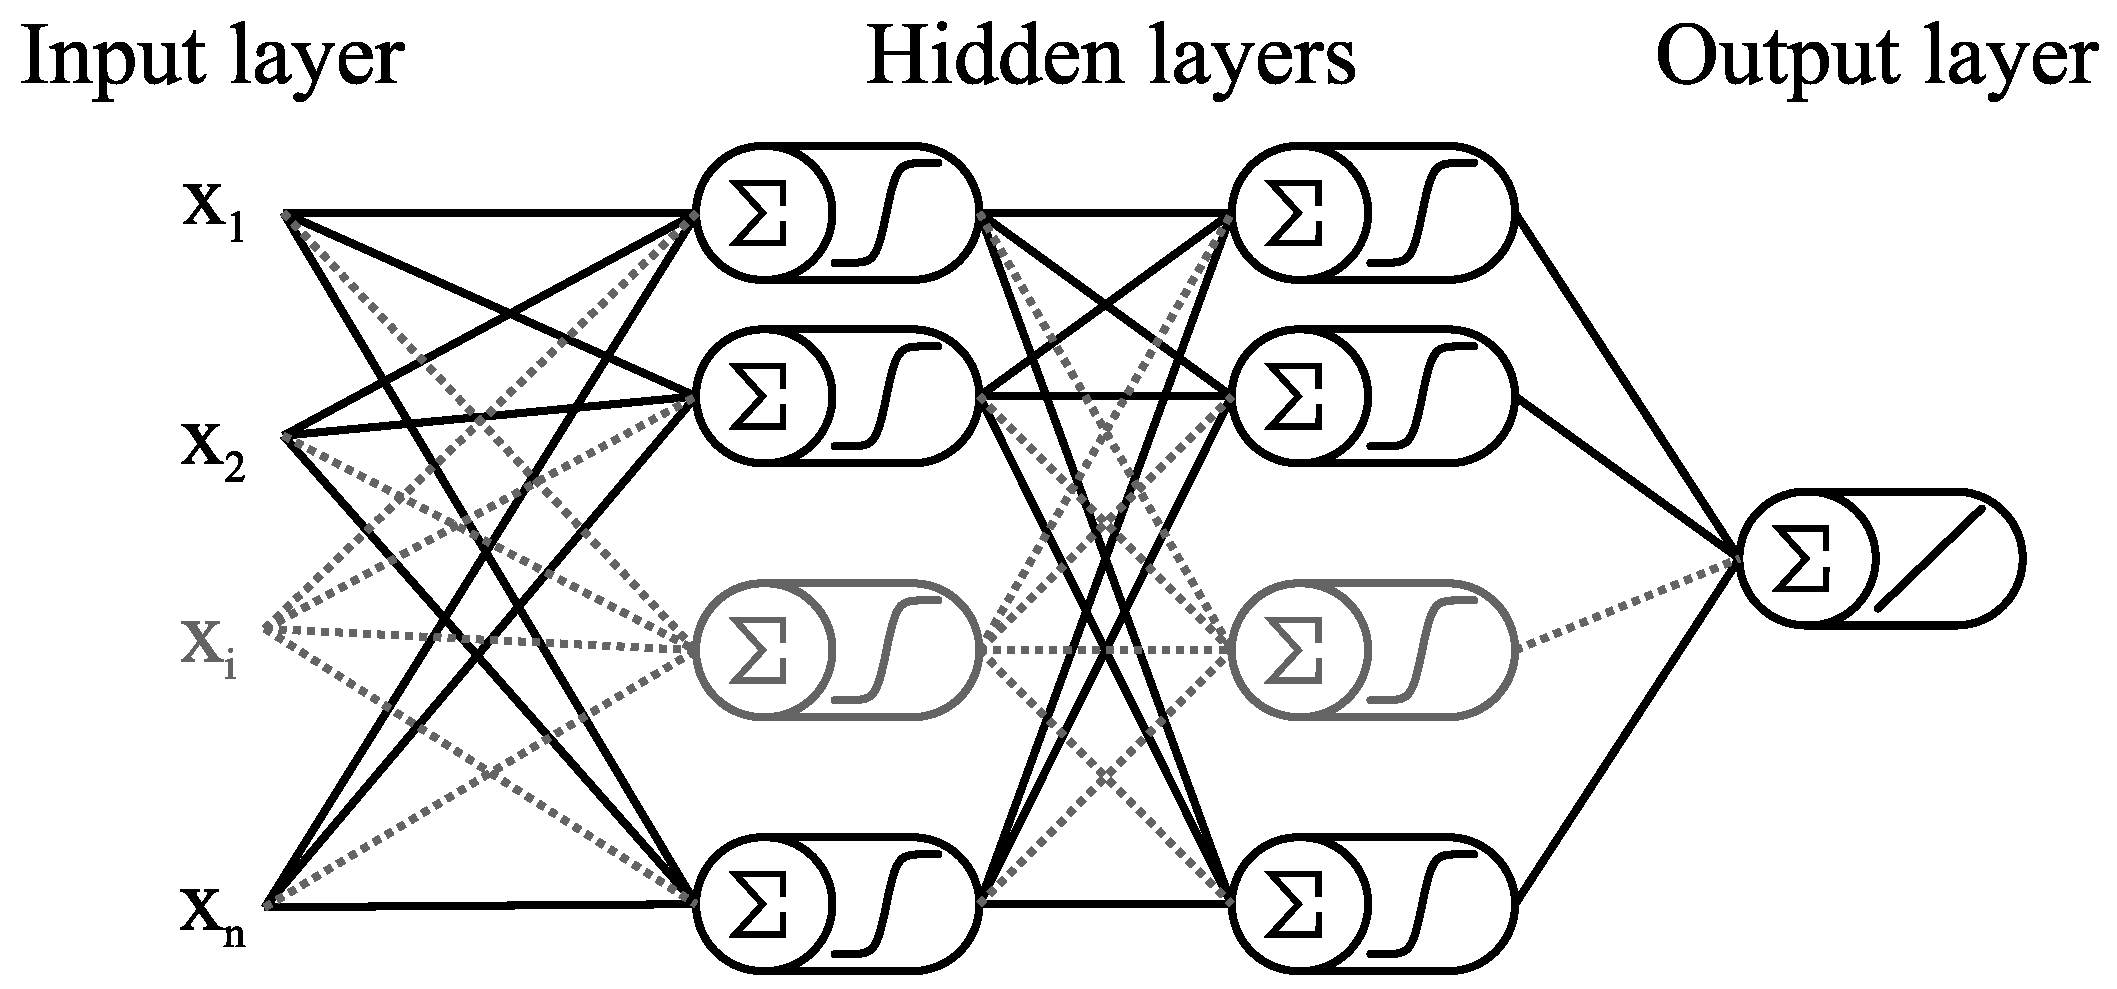
3.2. MLP Architecture Selection
In order to determine the optimal Multilayer perceptron architecture, the number of layers plays an essential role. In general, the input and output layers are directly related with the nature of the problem to be solved. The main challenge is given to establish the number of hidden layers along with the number of hidden neurons for each of them. To establish the number of hidden layers in the proposed Multilayer perceptron, the range of hidden layers was explored. MLP architectures with more than two hidden layers present low performance in terms of the area under ROC curve and high computational time using the present training set. Consequently, MLP architectures with one and two hidden layers were selected to be analyzed in detail. According to the statistical analysis presented below, the optimal performance of the MLP architecture can be obtained using two hidden layers; therefore, a Multilayer perceptron with a four layers architecture was proposed in the present paper. In addition, the number of hidden neurons for each hidden layer represents one of the main contributions of the present paper, since it has been determined by using a stochastic dominance approach, which is also discussed below.
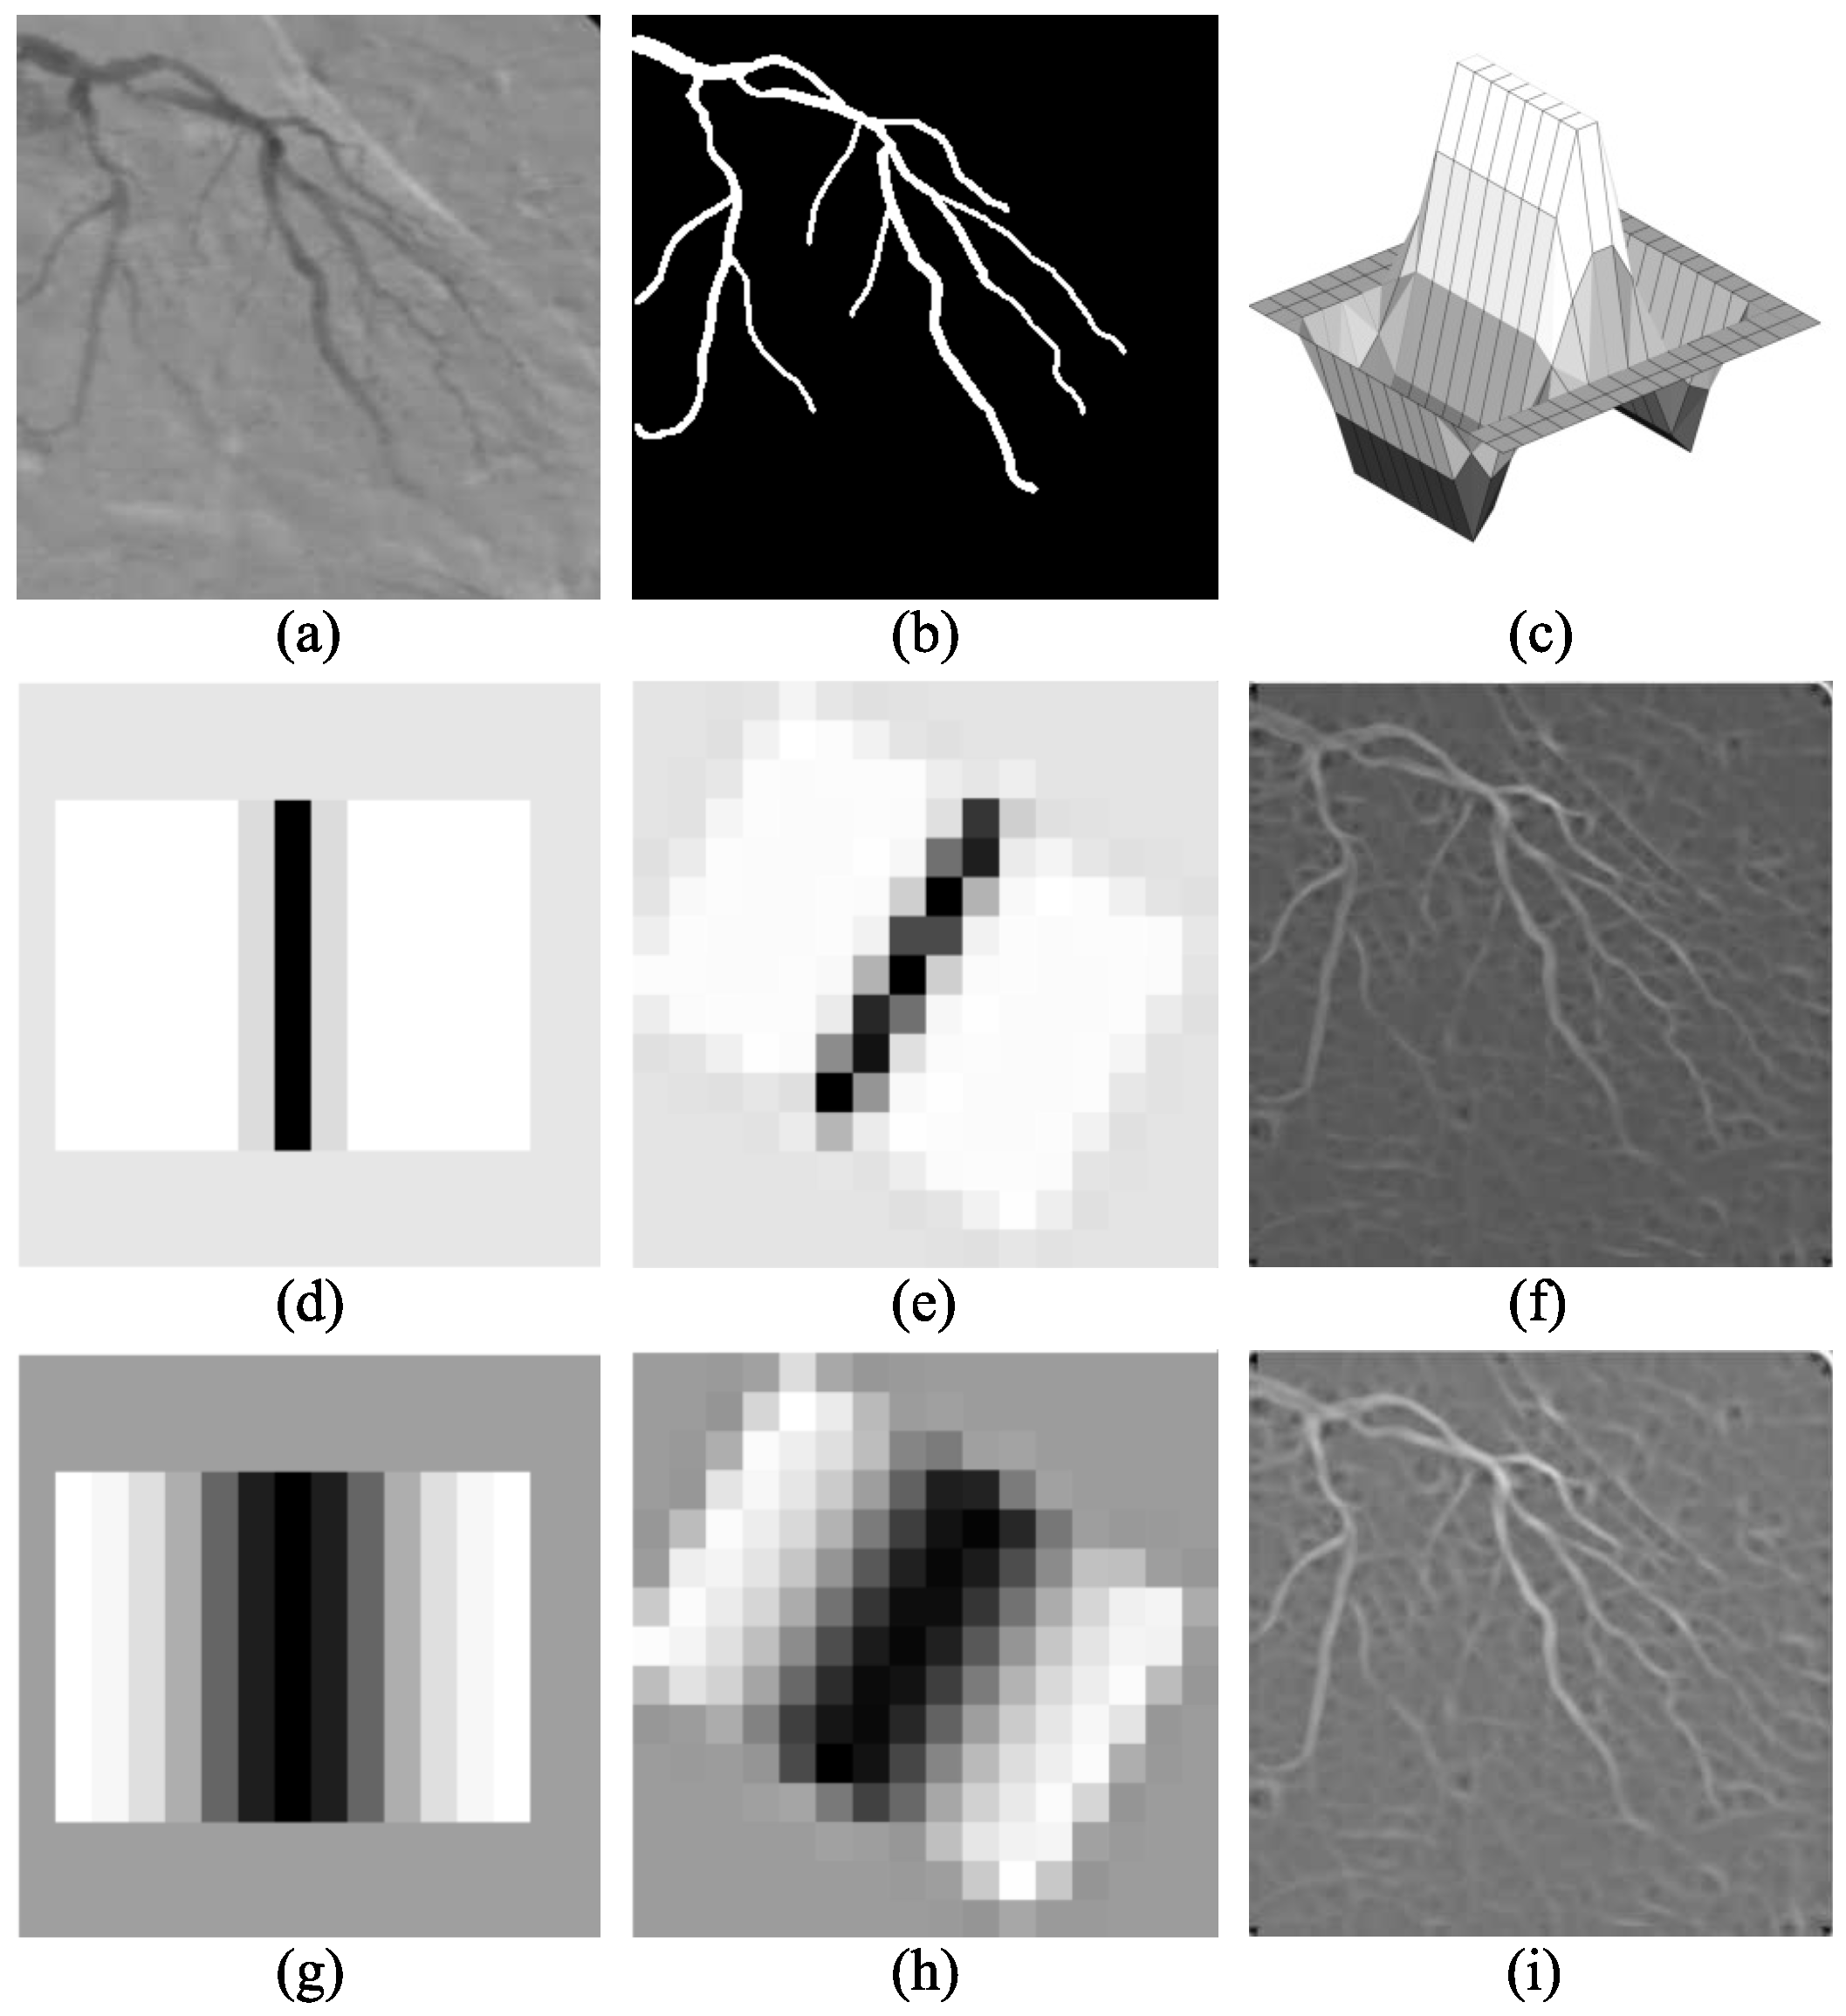
Since the Gaussian matched filter is governed by 4 parameters (
K,
L,
T,
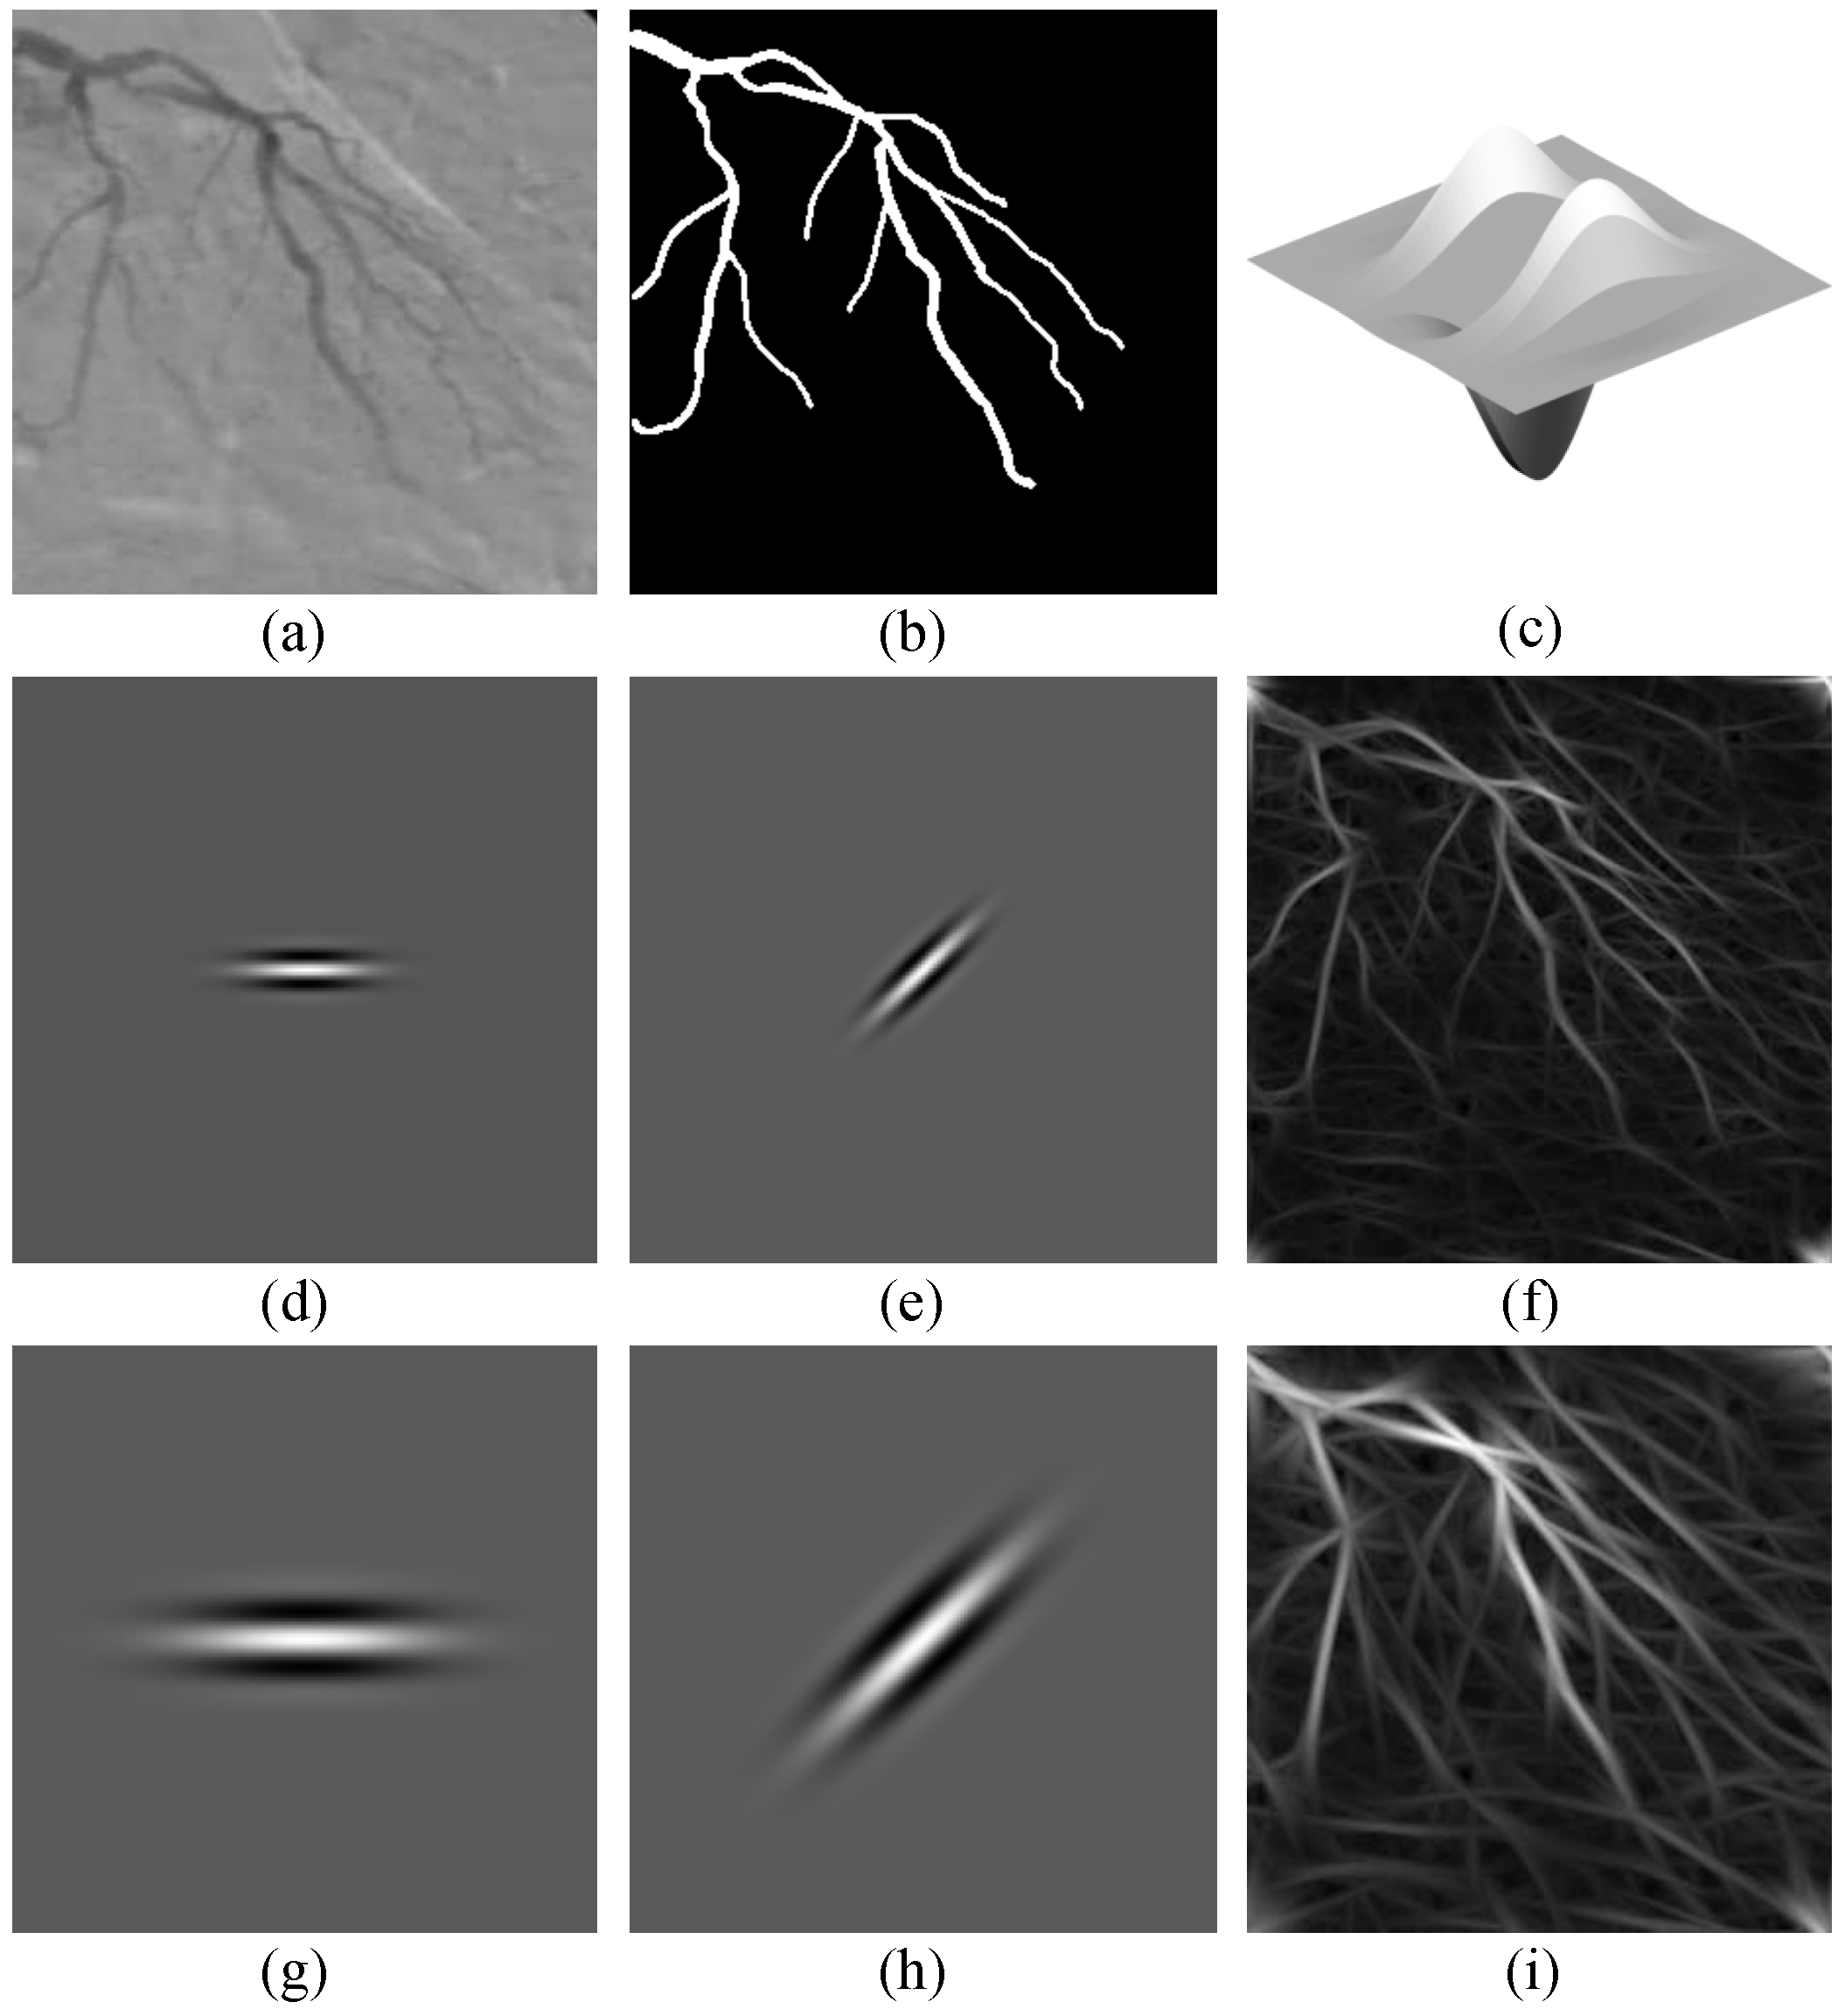
), and Gabor filters are governed by 3 parameters (
,
l,
), these seven parameters have to be determined previously to be used in the artificial neural network. The parameter that govern the directional filters is fixed as
for the GMF, and
for the Gabor filters, because the number of oriented filters is independent from the training set of images, and they are the most common values in literature. Moreover, to select the optimal set of values for the remaining 5 parameters (
T,
L, and
for Gaussian matched filter and
l, and
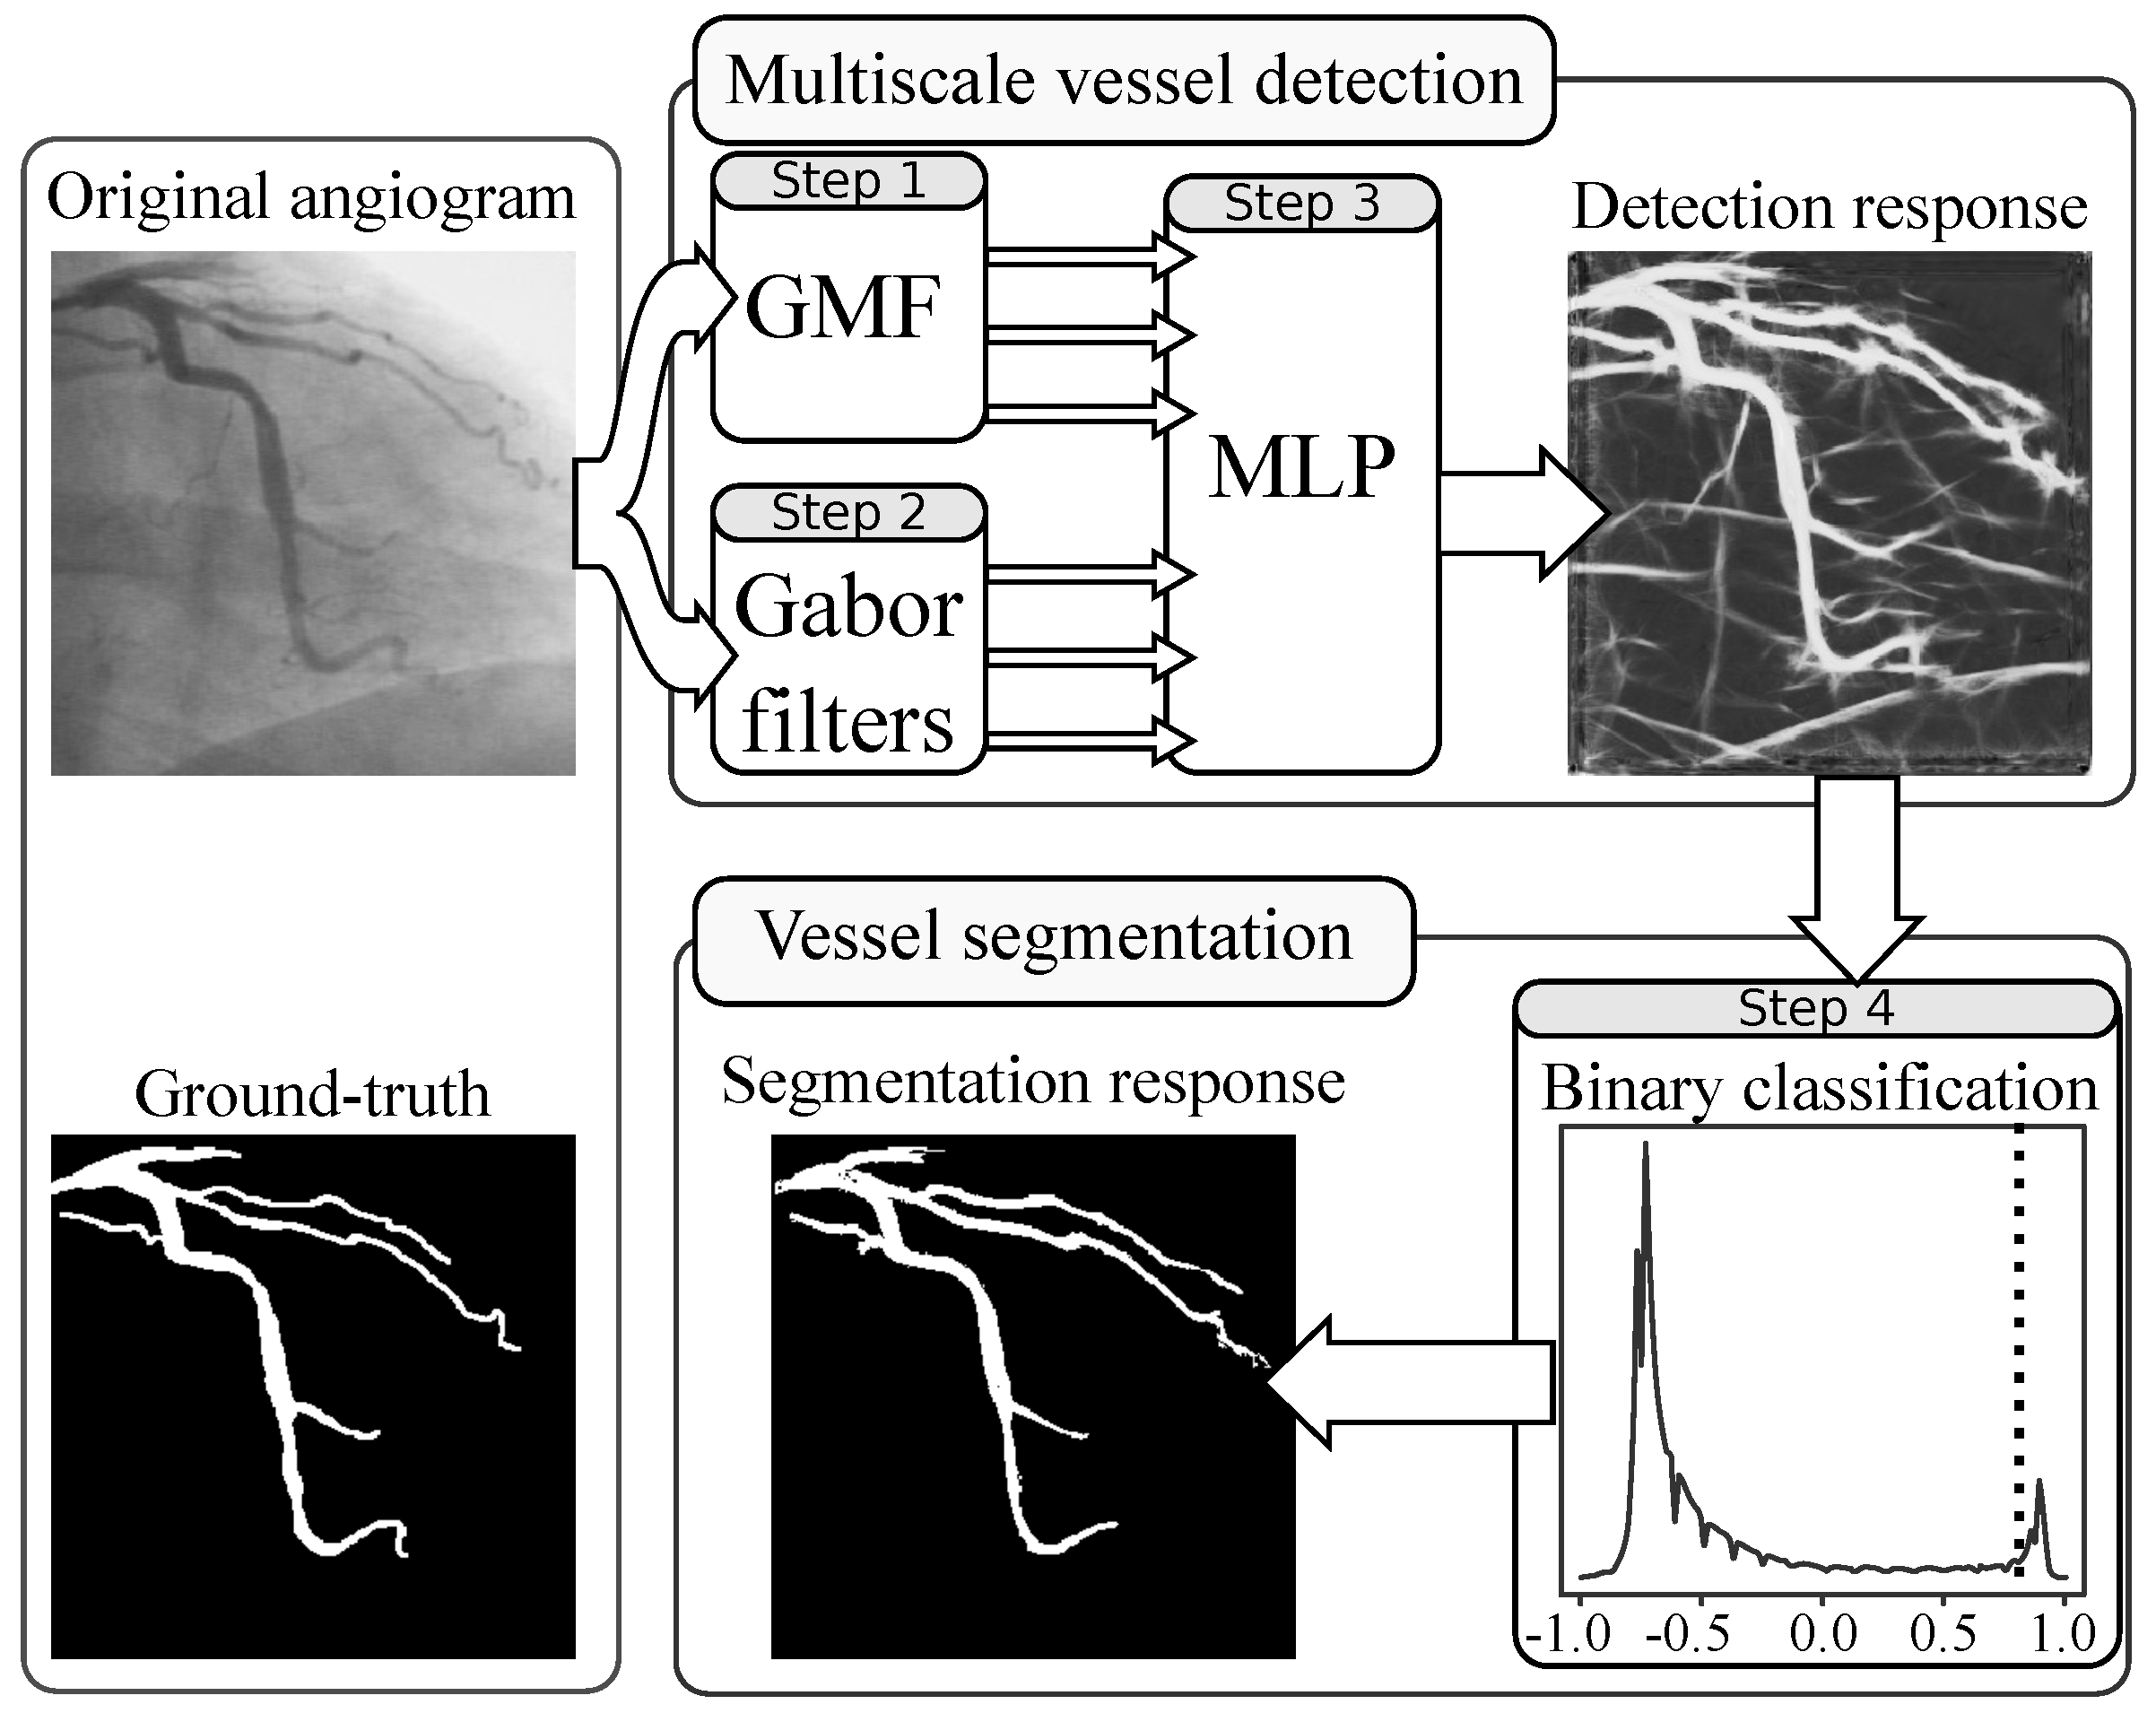
for Gabor filters), the training set of 100 X-ray images, and the area under the ROC curve were used to evaluate the filter responses (gray-scale images) for each parameter combination applying an exhaustive full-search procedure over the predefined search space (See
Section 2.4).
In this procedure, each possible combination of the Gaussian matched filter parameters are taken from the search space and used to perform a single-scale filtering for each image of the training set, which provides a detection response with the same dimension as the input image ( pixels). The detection responses obtained with each parameter combination are evaluated in terms of the area under the ROC curve with respect to the ground-truth images. The optimal parameter combination is the one that provides the highest value from the single-scale detection responses.
The optimal values of L and T for the single-scale Gaussian filtering are used later with each scale of when the multiscale analysis is performed in the spatial domain. Moreover, the same procedure was performed in order to determine the optimal l (elongation) parameter for the Gabor filters. In this case, the optimal elongation parameter found for the single-scale filtering is combined with each scale of during the multiscale analysis in the frequency domain.
After the exhaustive search, the most appropriate set of values for the parameters of the GMF are defined to be and pixels, and for the Gabor filters the elongation is defined to be . The multiscale analysis was performed in the range for Gaussian matched filters (11 scales) and using the range for Gabor filters (10 scales).
On the other hand, the selection of the MLP architecture requires a procedure based on a statistical hypothesis test. The main reason is the stochastic nature of the training process of an artificial neural network, which is introduced by the random initialization of the weights for each neuron, and the sampling process used to form the validation and training subsets. For the training stage of each possible architecture of the MLP, the back-propagation with the Levenberg-Marquardt optimization algorithm [
22] are employed for the weights fitting, using the training set of 100 angiograms. After the training stage, the generalization performance of the artificial neural network is evaluated using the test set of 30 angiograms, and the area under the ROC curve as metric. The ROC analysis is used since the final detection response of the proposed method is provided in an unbounded continuous scale, which can be considered as a multiple level classifier for the pixels of the coronary angiograms.
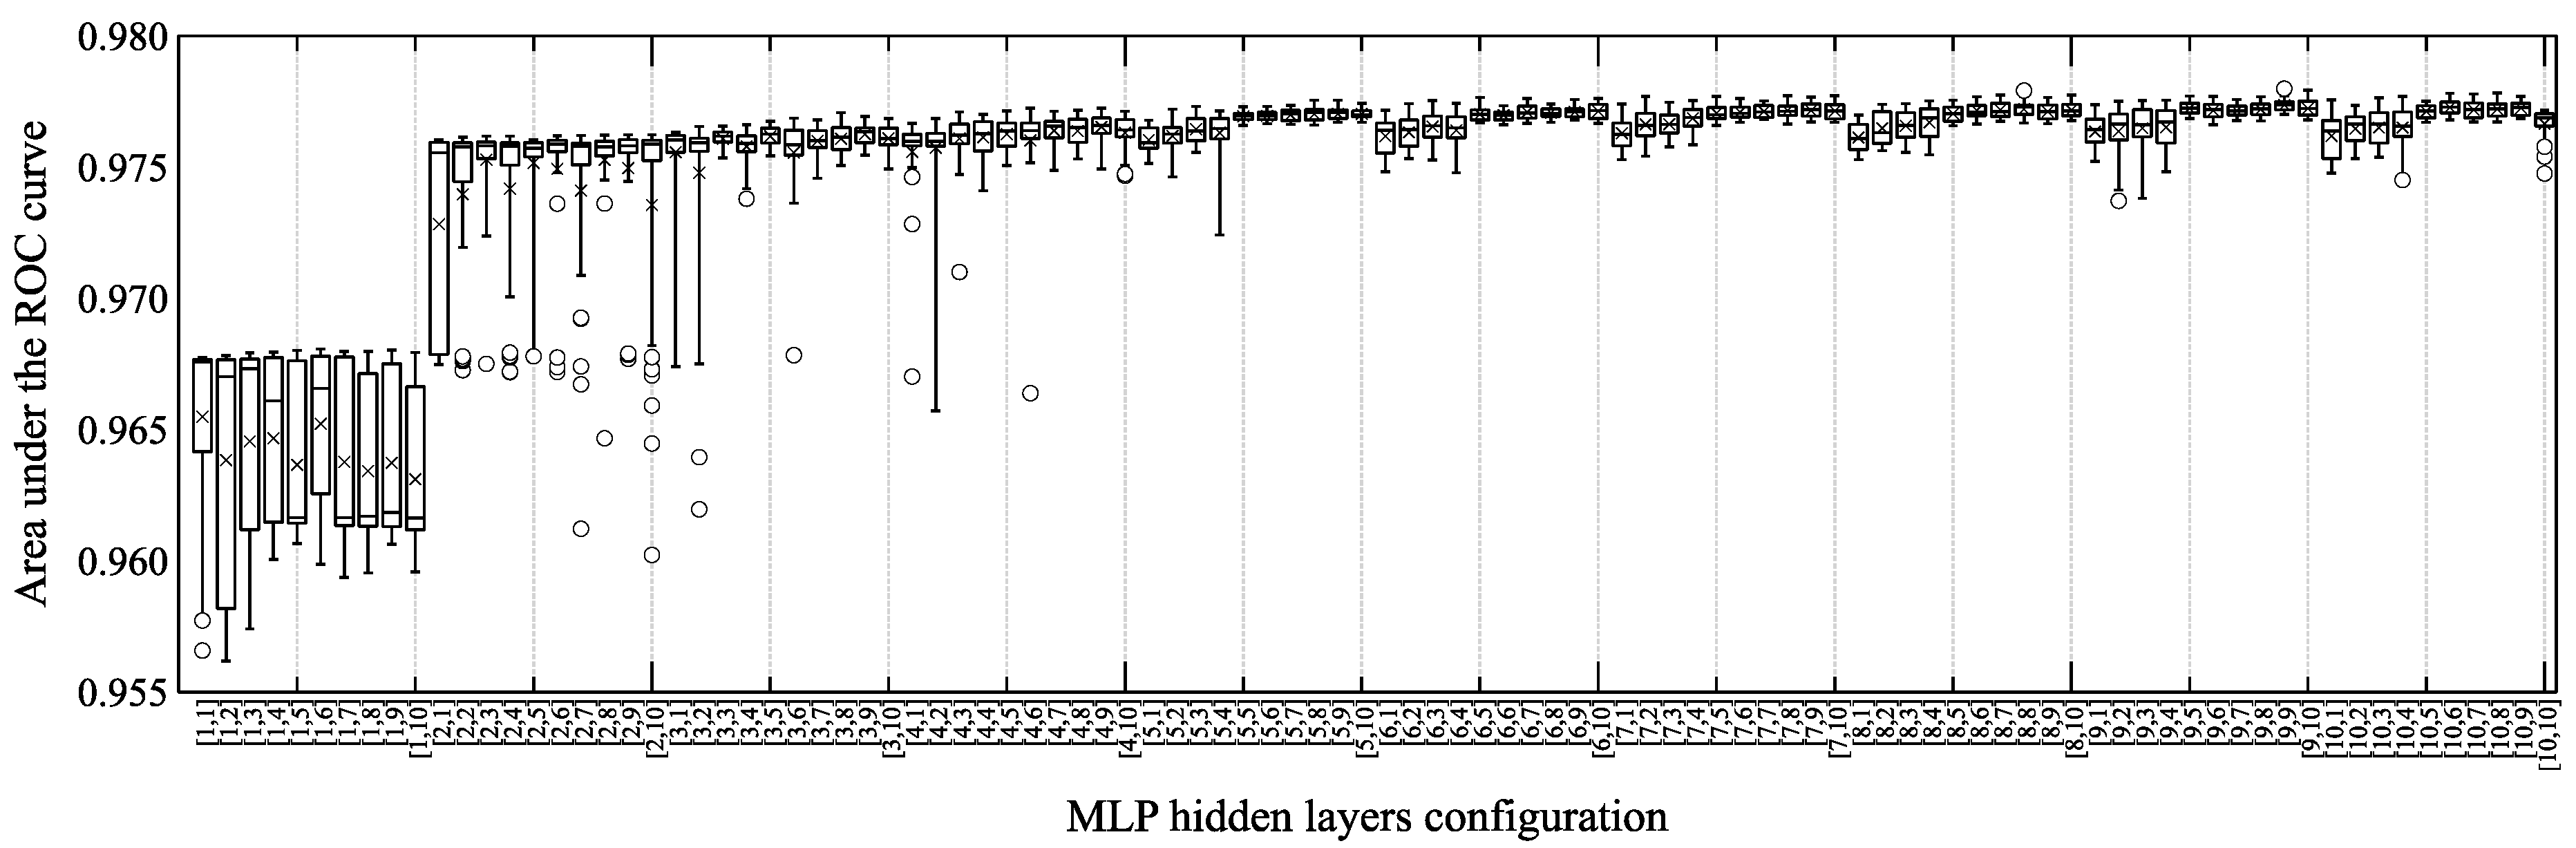
To illustrate the stochastic behavior of the generalization performance of the tested MLP architectures,
Figure 5 presents the distribution of the performance achieved using 30 trials by each artificial neural network configuration. In addition, the Shapiro-Wilk test is applied to determine whether the behavior of the generalization performance of each tested configuration follows a normal distribution. The results of the Shapiro-Wilk test are presented in
Table 1, where the analysis suggests that normality cannot be assumed for all MLP configurations with a significance level of
. Consequently, a non-parametric comparison approach is required to select the most appropriate MLP architecture.
In literature, the Wilcoxon–Mann-Whitney test is the most common non-parametric technique used to compare the performance of two methods applied to independent samples. This test is used to determine the most appropriate MLP configuration for coronary arteries detection in X-ray angiograms by pairwise comparison of all candidate architectures using the testing set of images. The hypothesis test determines whether the detection performance between two configurations are similarly distributed, by using a significance level of
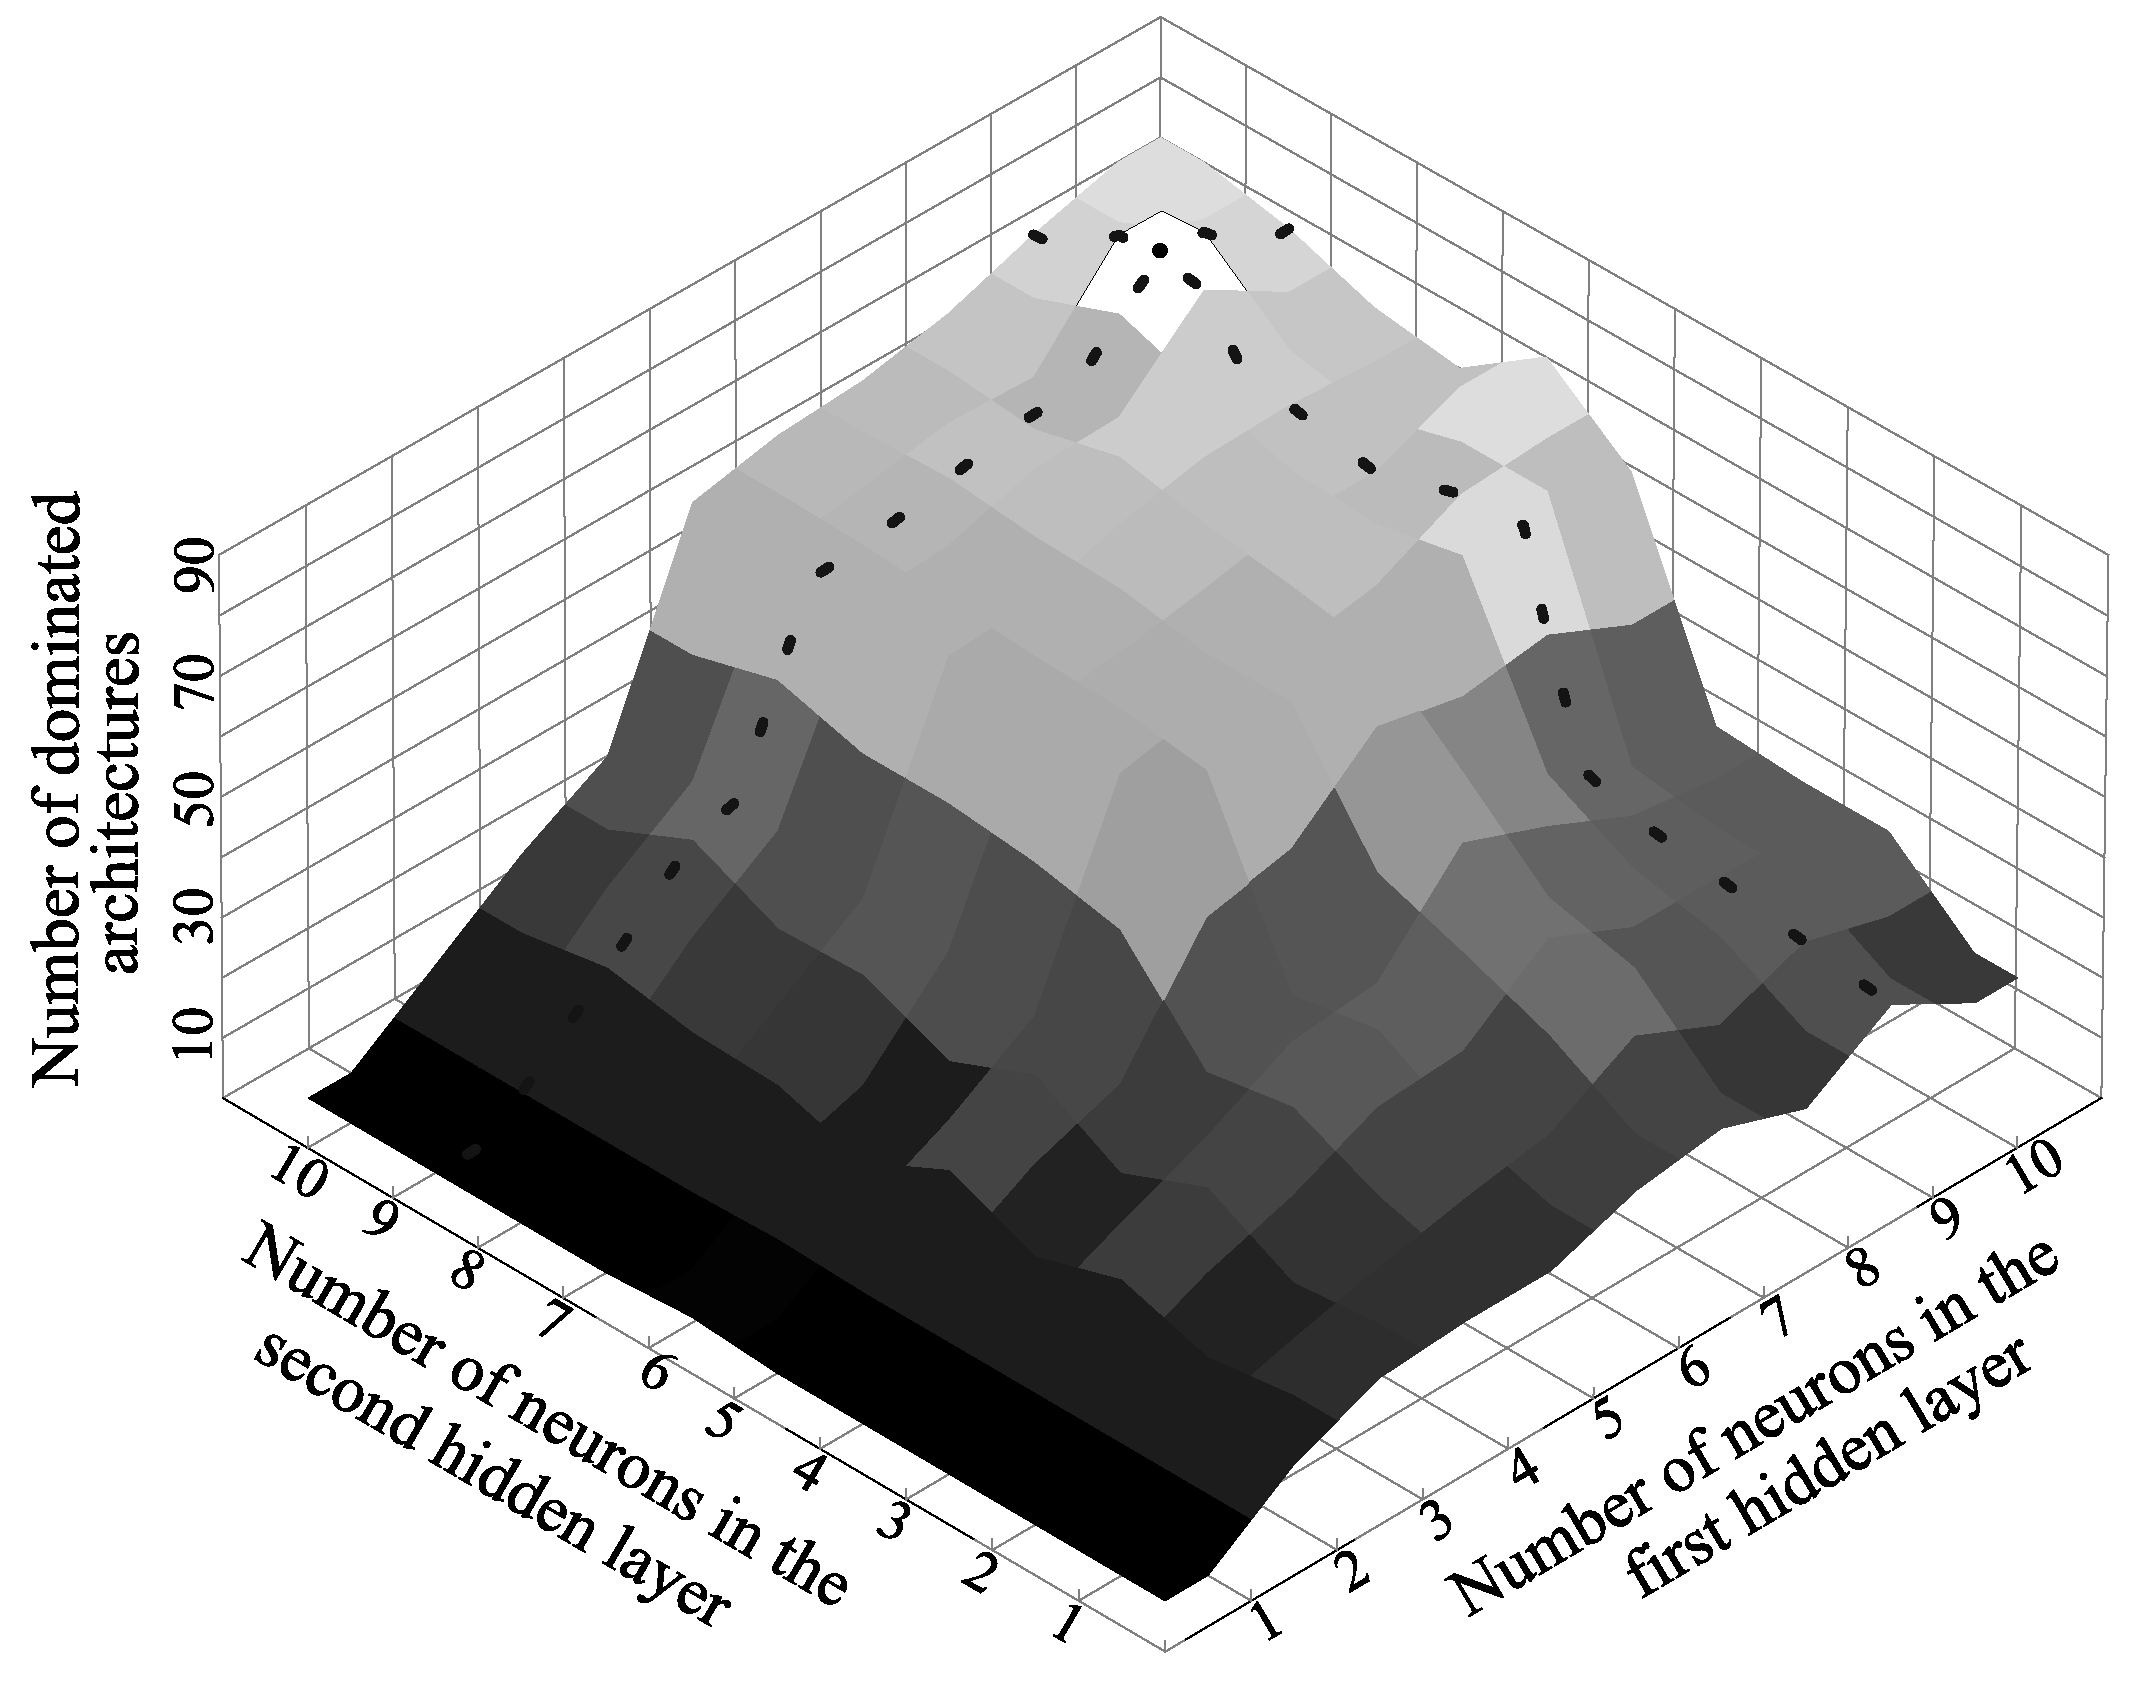
. On the other hand, when the hypothesis of similarly distributed detection performance is rejected, the sum of ranks is employed to determine whether the left or right hand configuration is stochastically dominant. For the best 10 MLP configurations,
Table 2 illustrates the hypothesis testing process by reporting the
p-value and the corresponding left and right hand sum of ranks, denoted respectively by − and +. The stochastic dominance comparison is summarized in
Figure 6, where a high detection performance can be observed for configurations with more than 4 neurons in each hidden layer. In this figure, the configuration
is highlighted with a dotted line, corresponding to the architecture that stochastically dominates most of the other configurations of the comparative analysis.
The stochastic dominance comparison results are ranked according to the number of other architectures stochastically dominated, in order to determine the most appropriate configuration to be used in the proposed method.
Table 3 shows the comparative results of the top 10 architectures from the 100 comparative architectures tested. According to comparative analysis, the configuration that stochastically dominates the most of other architectures is the
architecture, being superior to other 90 configurations. In addition, the
architecture obtains a detection performance stochastically similar to only other 9 configurations, and it is not stochastically dominated by any other configuration. Because the MLP
configuration presents the highest stochastic dominance results, it was selected as the most appropriate architecture to provide the final detection response of the proposed method.
3.3. Detection Results
To evaluate the performance of the detection step of the proposed method, the comparative analysis with respect blood vessel enhancement methods from the state of the art is reported in this section. The proposed method is compared with four artificial neural network based methods, and seven state-of-the-art methods for blood vessel enhancement, using the test set of 30 images. The detection performance of each blood vessel enhancement method is evaluated in terms of the area under the ROC curve.
The methods based on neural networks were trained using the training set of 100 images, and were selected from several candidates that were previously tested, and according to their relevant high blood vessel detection performance. The multiscale Gaussian matched filter [
17], which employs a multilayer perceptron network with 3 neurons in a first hidden layer, and 8 neurons in a second hidden layer. This method obtains a vessel detection performance of
, using a database of 100 angiograms, and the set of parameters
,
,
and
for the multiscale GMF. The multiscale Gabor filter [
16], that uses a multilayer perceptron with two hidden layers with 5 neurons each. This coronary artery detection method achieves a performance of
using a database of 80 angiograms, whereas the parameters for the multiscale Gabor filters are set as
,
and
. The following two methods are convolutional neural networks (CNN) that were originally proposed to perform object recognition in images; however, in this work those architectures are adapted to perform the detection of blood vessels in coronary angiograms. The architecture proposed by Lecun et al. [
23] which is applied to the multiscale responses of the Gaussian matched filters and Gabor filters, using the same parameters of the proposed method for both multiscale vessel enhancement methods. Finally, the architecture proposed by Simonyan and Zisserman [
24] is employed using
pixel sized patches from the original angiogram without additional processing.
The following seven blood vessel enhancement methods are the most referenced in literature. The method of Cruz et al. [
11] employs the single-scale GMF, where the filter parameters are selected with an algorithm inspired by natural evolution. Cinsdikici and Aydin [
7] proposed to use the single-scale GMF extending the number of orientations to
, keeping the other parameters in the original values proposed by Chaudhuri et al. [
6]. Nguyen et al. [
25] addressed the detection of blood vessels by using a line detector and varying its scale in a range of 1 to 15 pixels. The method of Al-Rawi and Karajeh [
10] is based on the single-scale GMF, where the parameters
T and
L that govern the filter are selected by a genetic algorithm from the evolutionary computation family, preserving the orientations in
. The mathematical morphology based method of Eiho and Qian [
1] applies the Top-hat operator with a disk-shaped structuring element at multiple scales over the original image. The single-scale Gabor filter proposed by Rangayyan et al. [
13] defines the parameters with a full-search, resulting on a filter with parameters
,
, and
orientations. The method of Frangi et al. [
3] is based on a vesselness measure computed from the Hessian matrix of the original angiogram using multiple scales in the range
in order to detect vessels of different diameters.
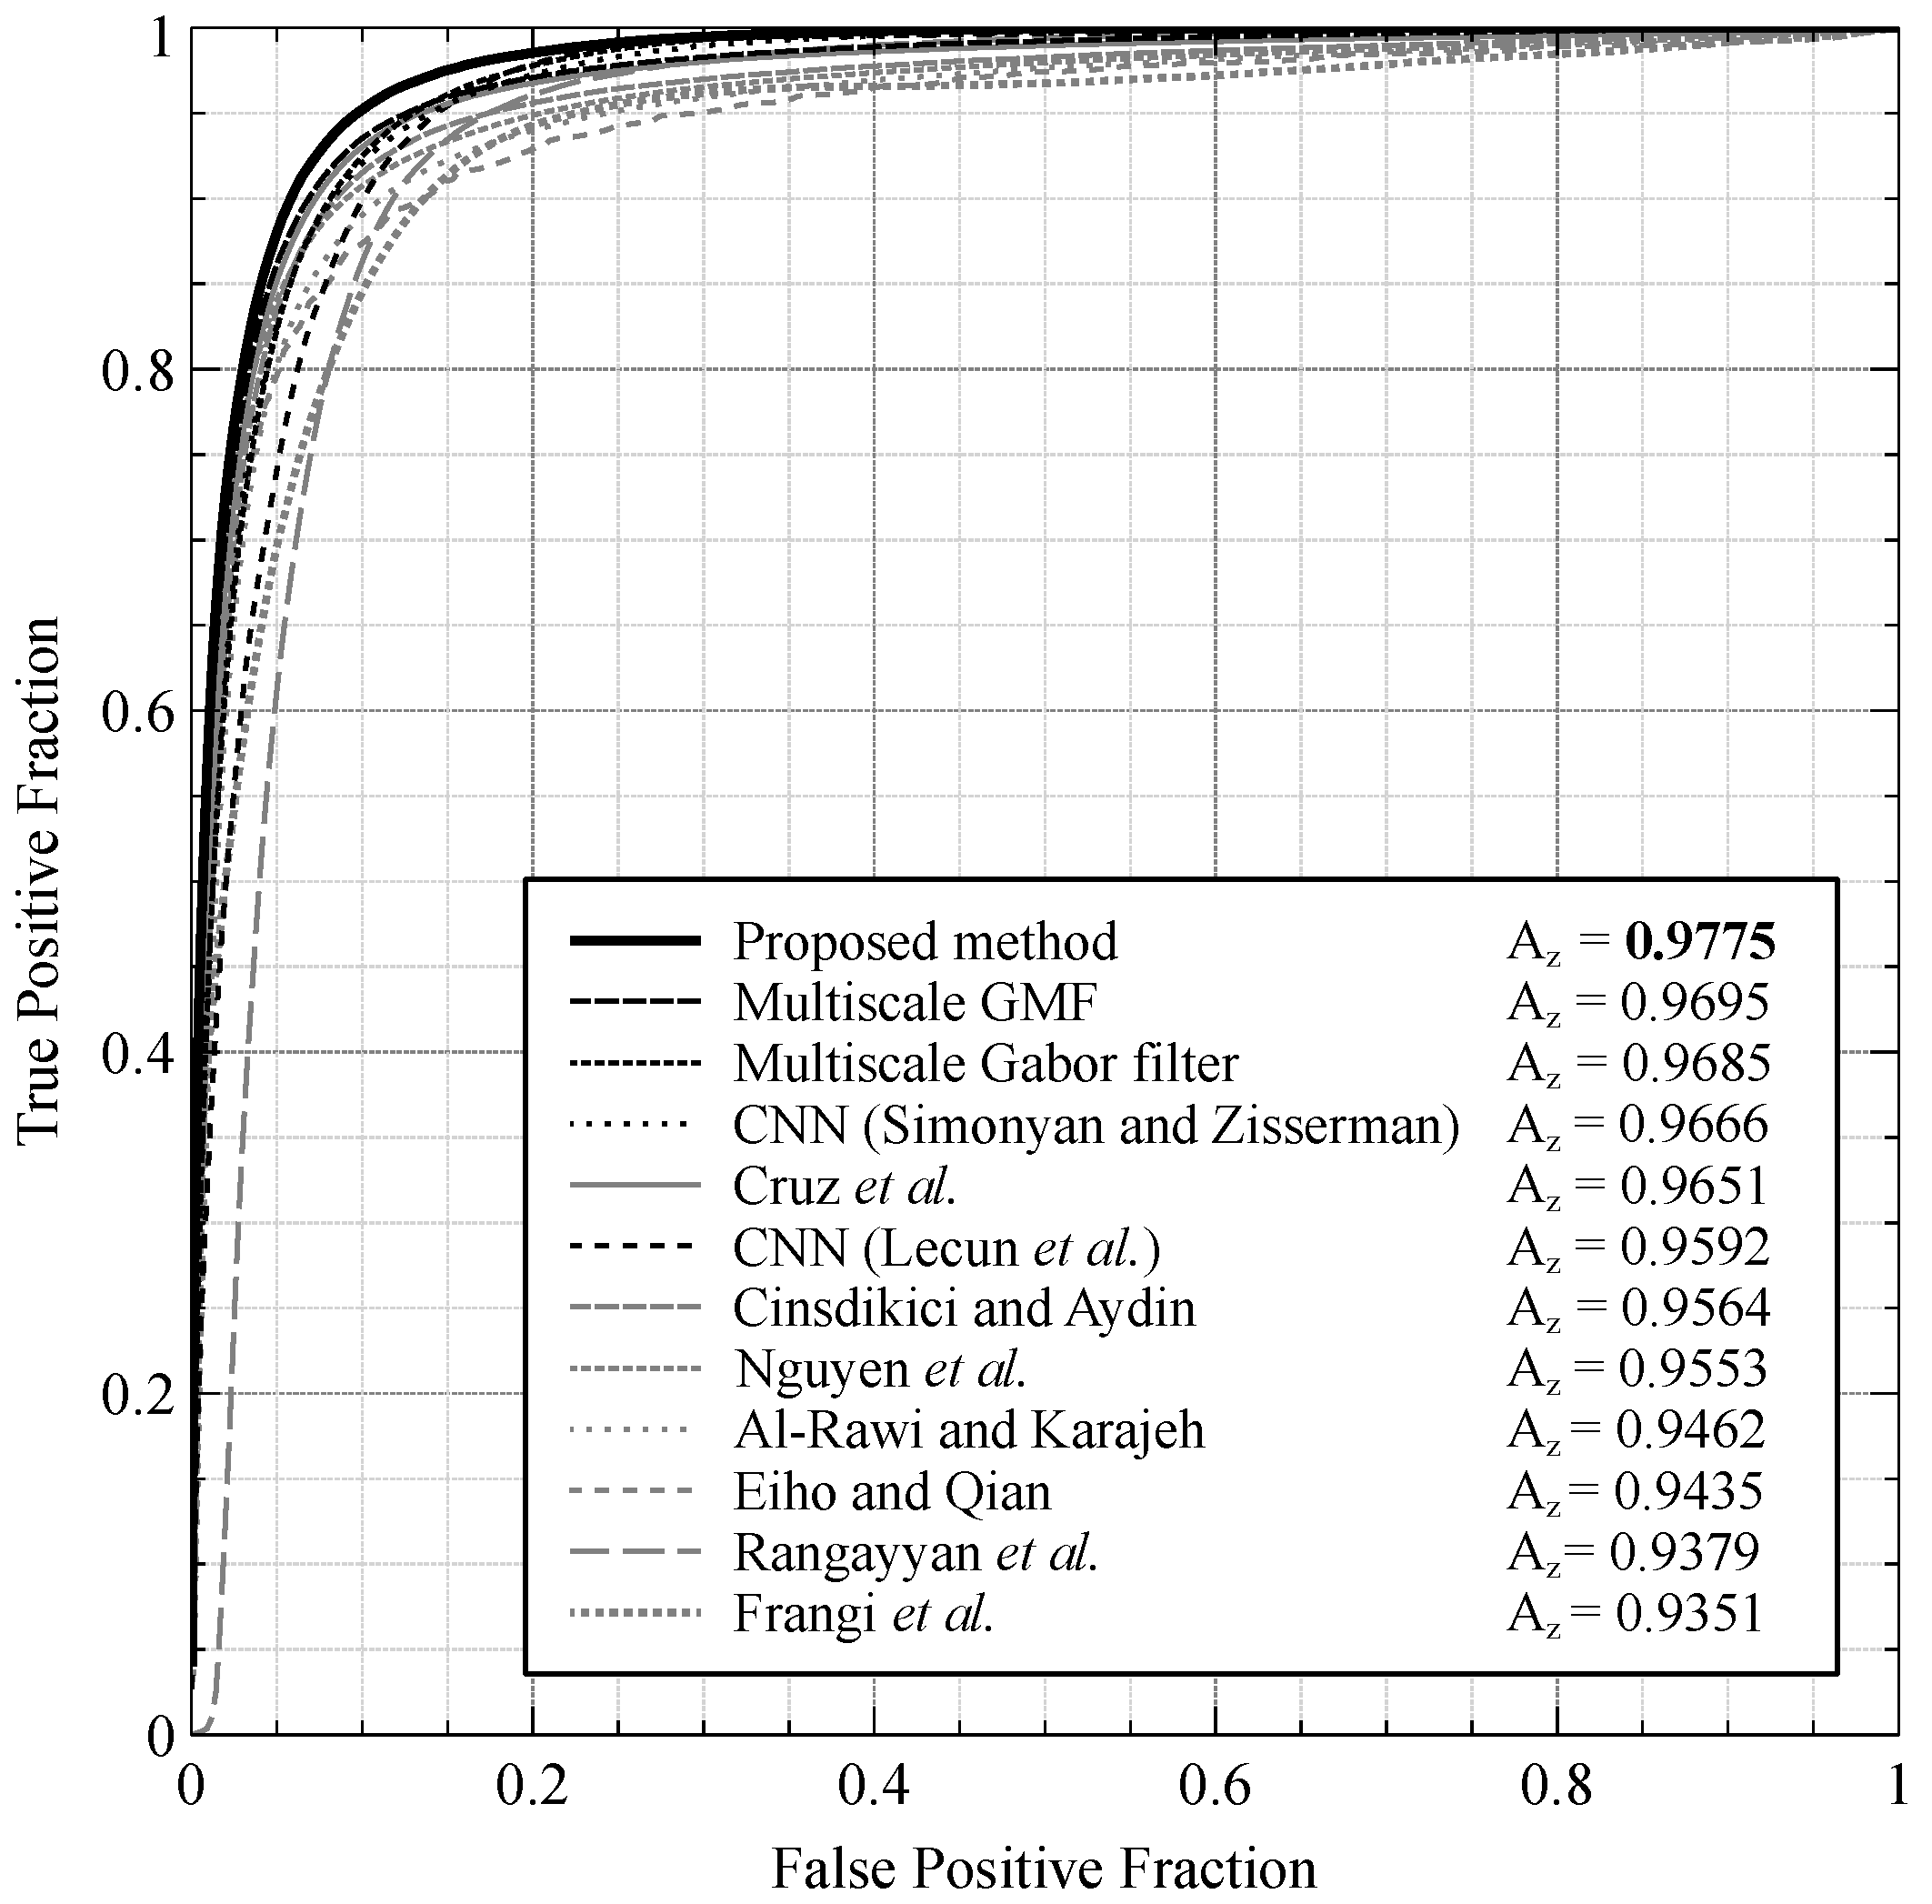
The comparative analysis between the proposed method, and the eleven blood vessel enhancement methods described above, is illustrated in
Figure 7 using the test set of 30 images of the present database. The comparative analysis reveals that the proposed method presents the highest vessel detection performance with
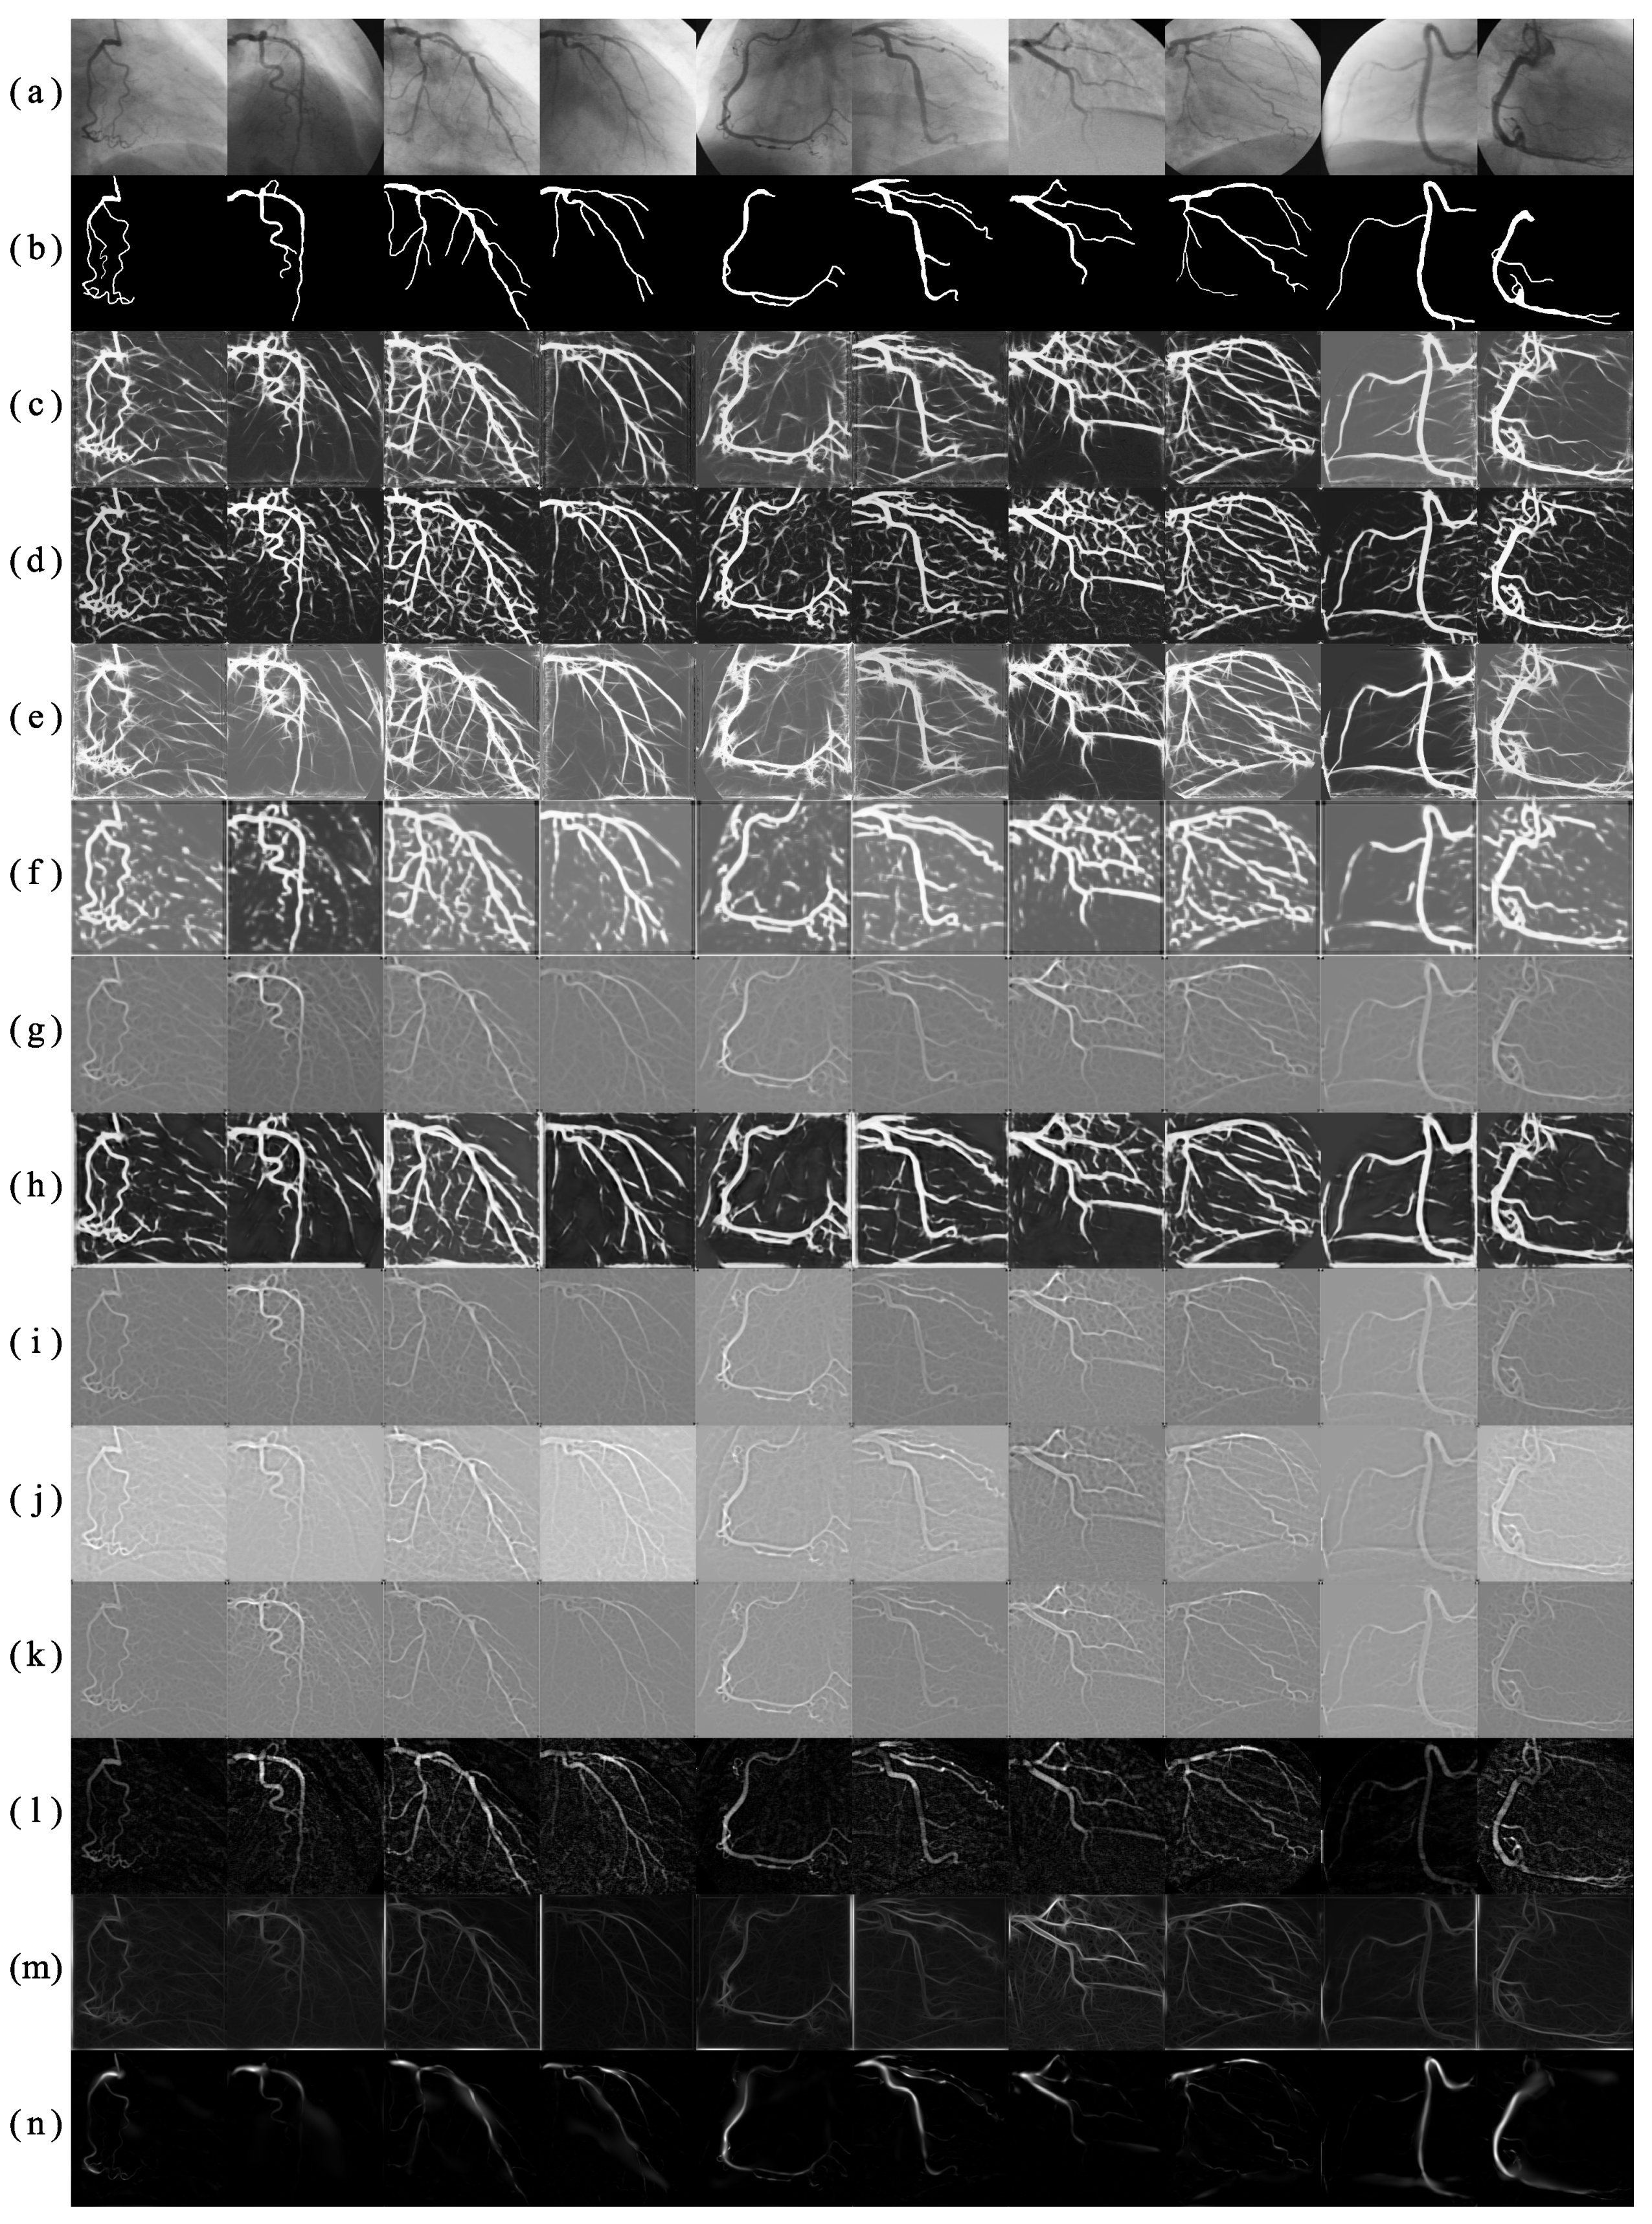
, compared with the eleven methods from the state of the art. To visualize the vessel detection results,
Figure 8 presents the responses obtained by applying the different methods over a subset of angiograms of the testing set.
3.4. Segmentation Results
This section presents the process to determine the most suitable binary classification technique to be used in the fourth step of the proposed method. Later, the evaluation of the segmentation performance of the proposed method is presented in a comparative analysis approach with other blood-vessel segmentation methods from the state of the art. For the evaluation of the blood vessels classification efficiency, the accuracy metric is employed.
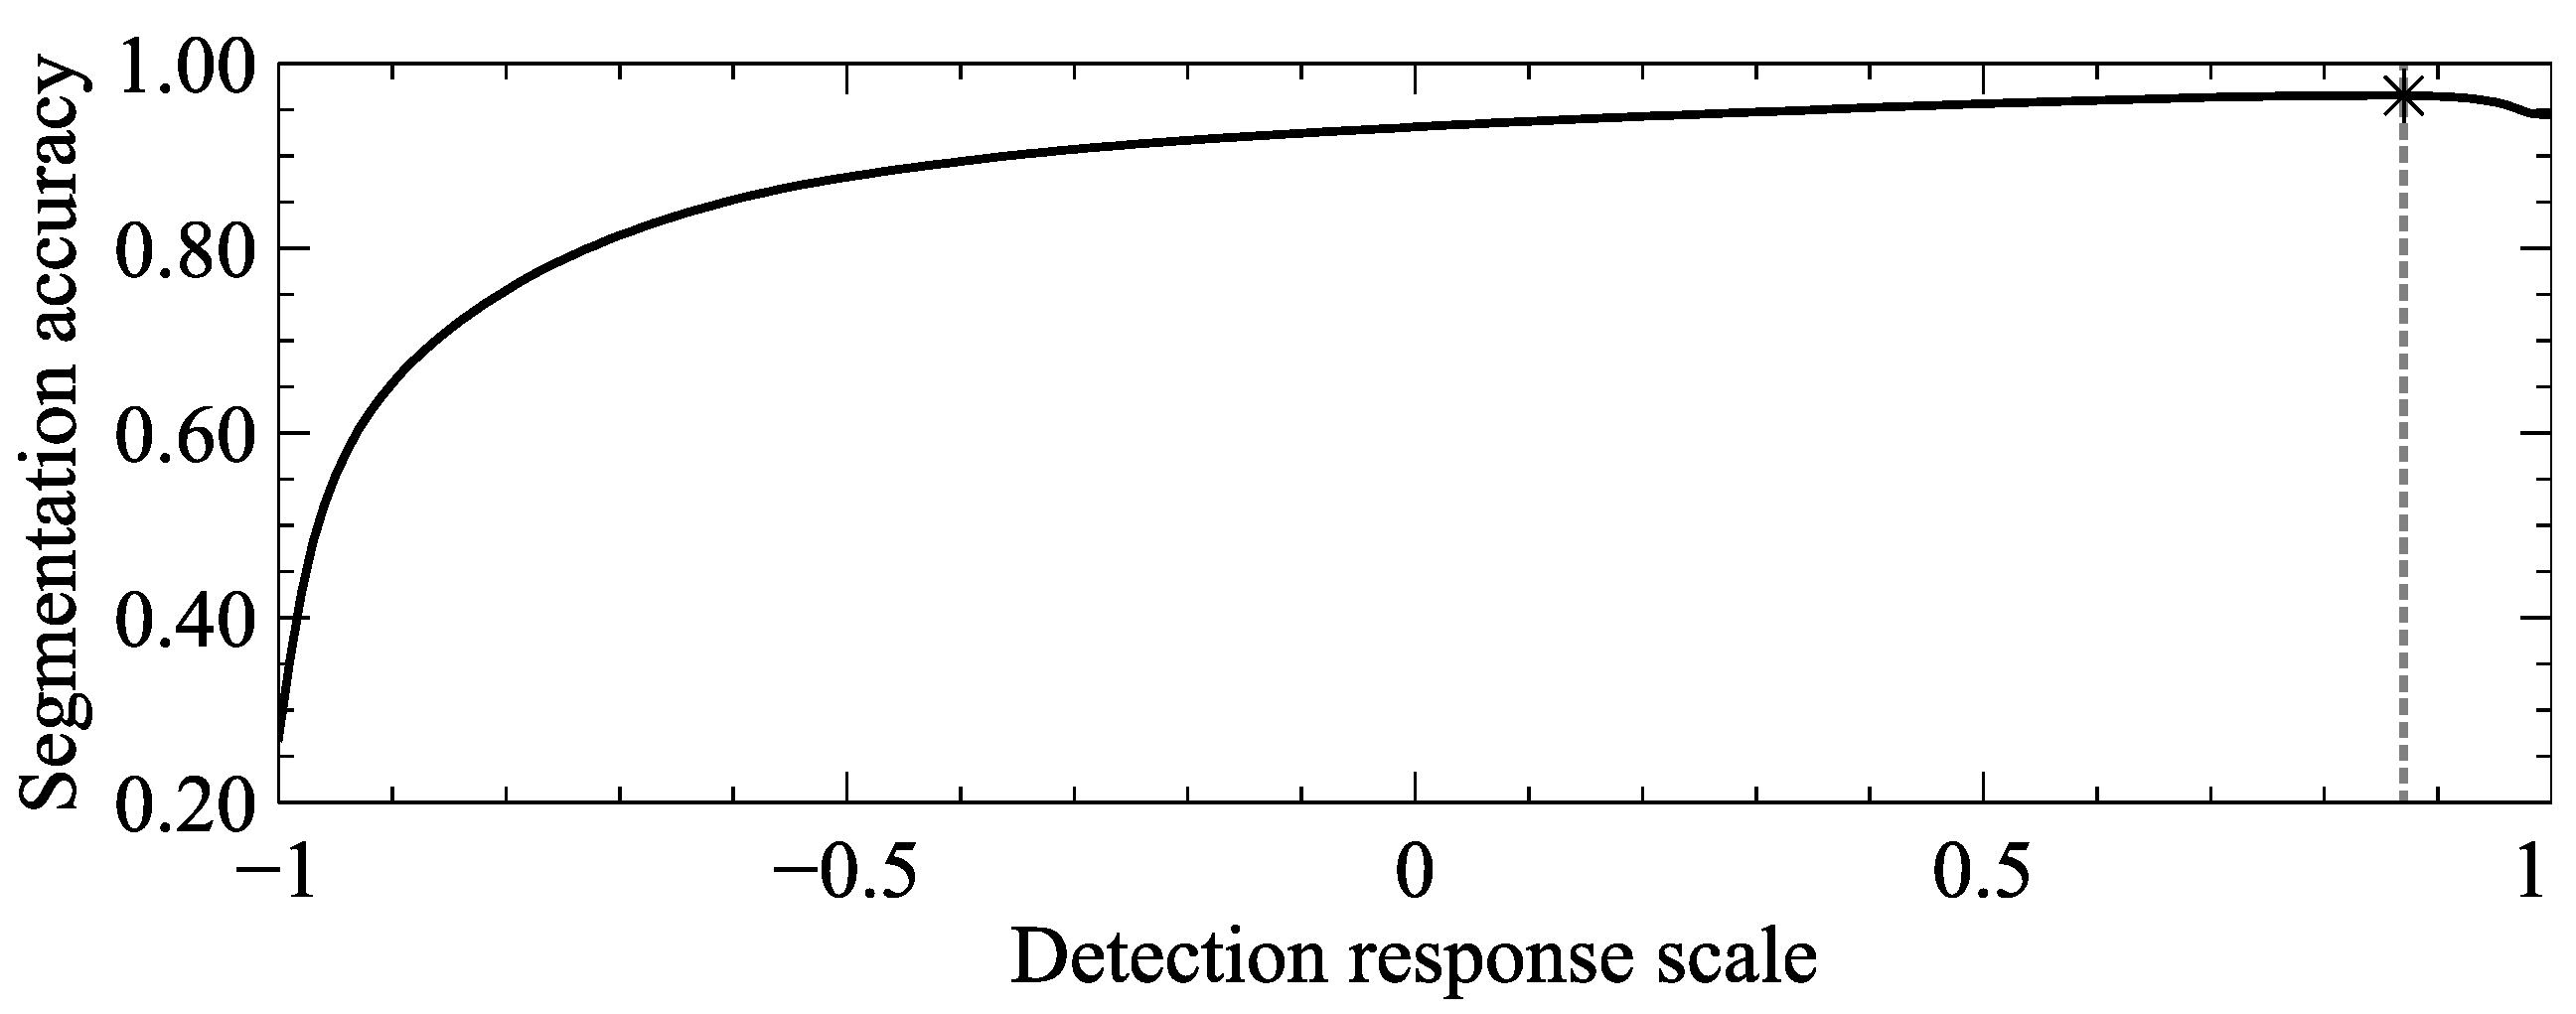
To select the most suitable technique for the segmentation step of the proposed method, fourteen binary classification tools are compared using the detection response of the multiscale analysis performed in the previous steps. Thirteen methods of the comparative set are automatic binary classification techniques frequently used in vessel-segmentation literature. The remaining method is a soft computing approach which selects the threshold value from the detection response scale that maximizes the accuracy metric. The soft computing procedure followed to define the most appropriate threshold value is illustrated in
Figure 9, where the best value found is
in the detection response scale using the training set of 100 images and a full search strategy.
In addition,
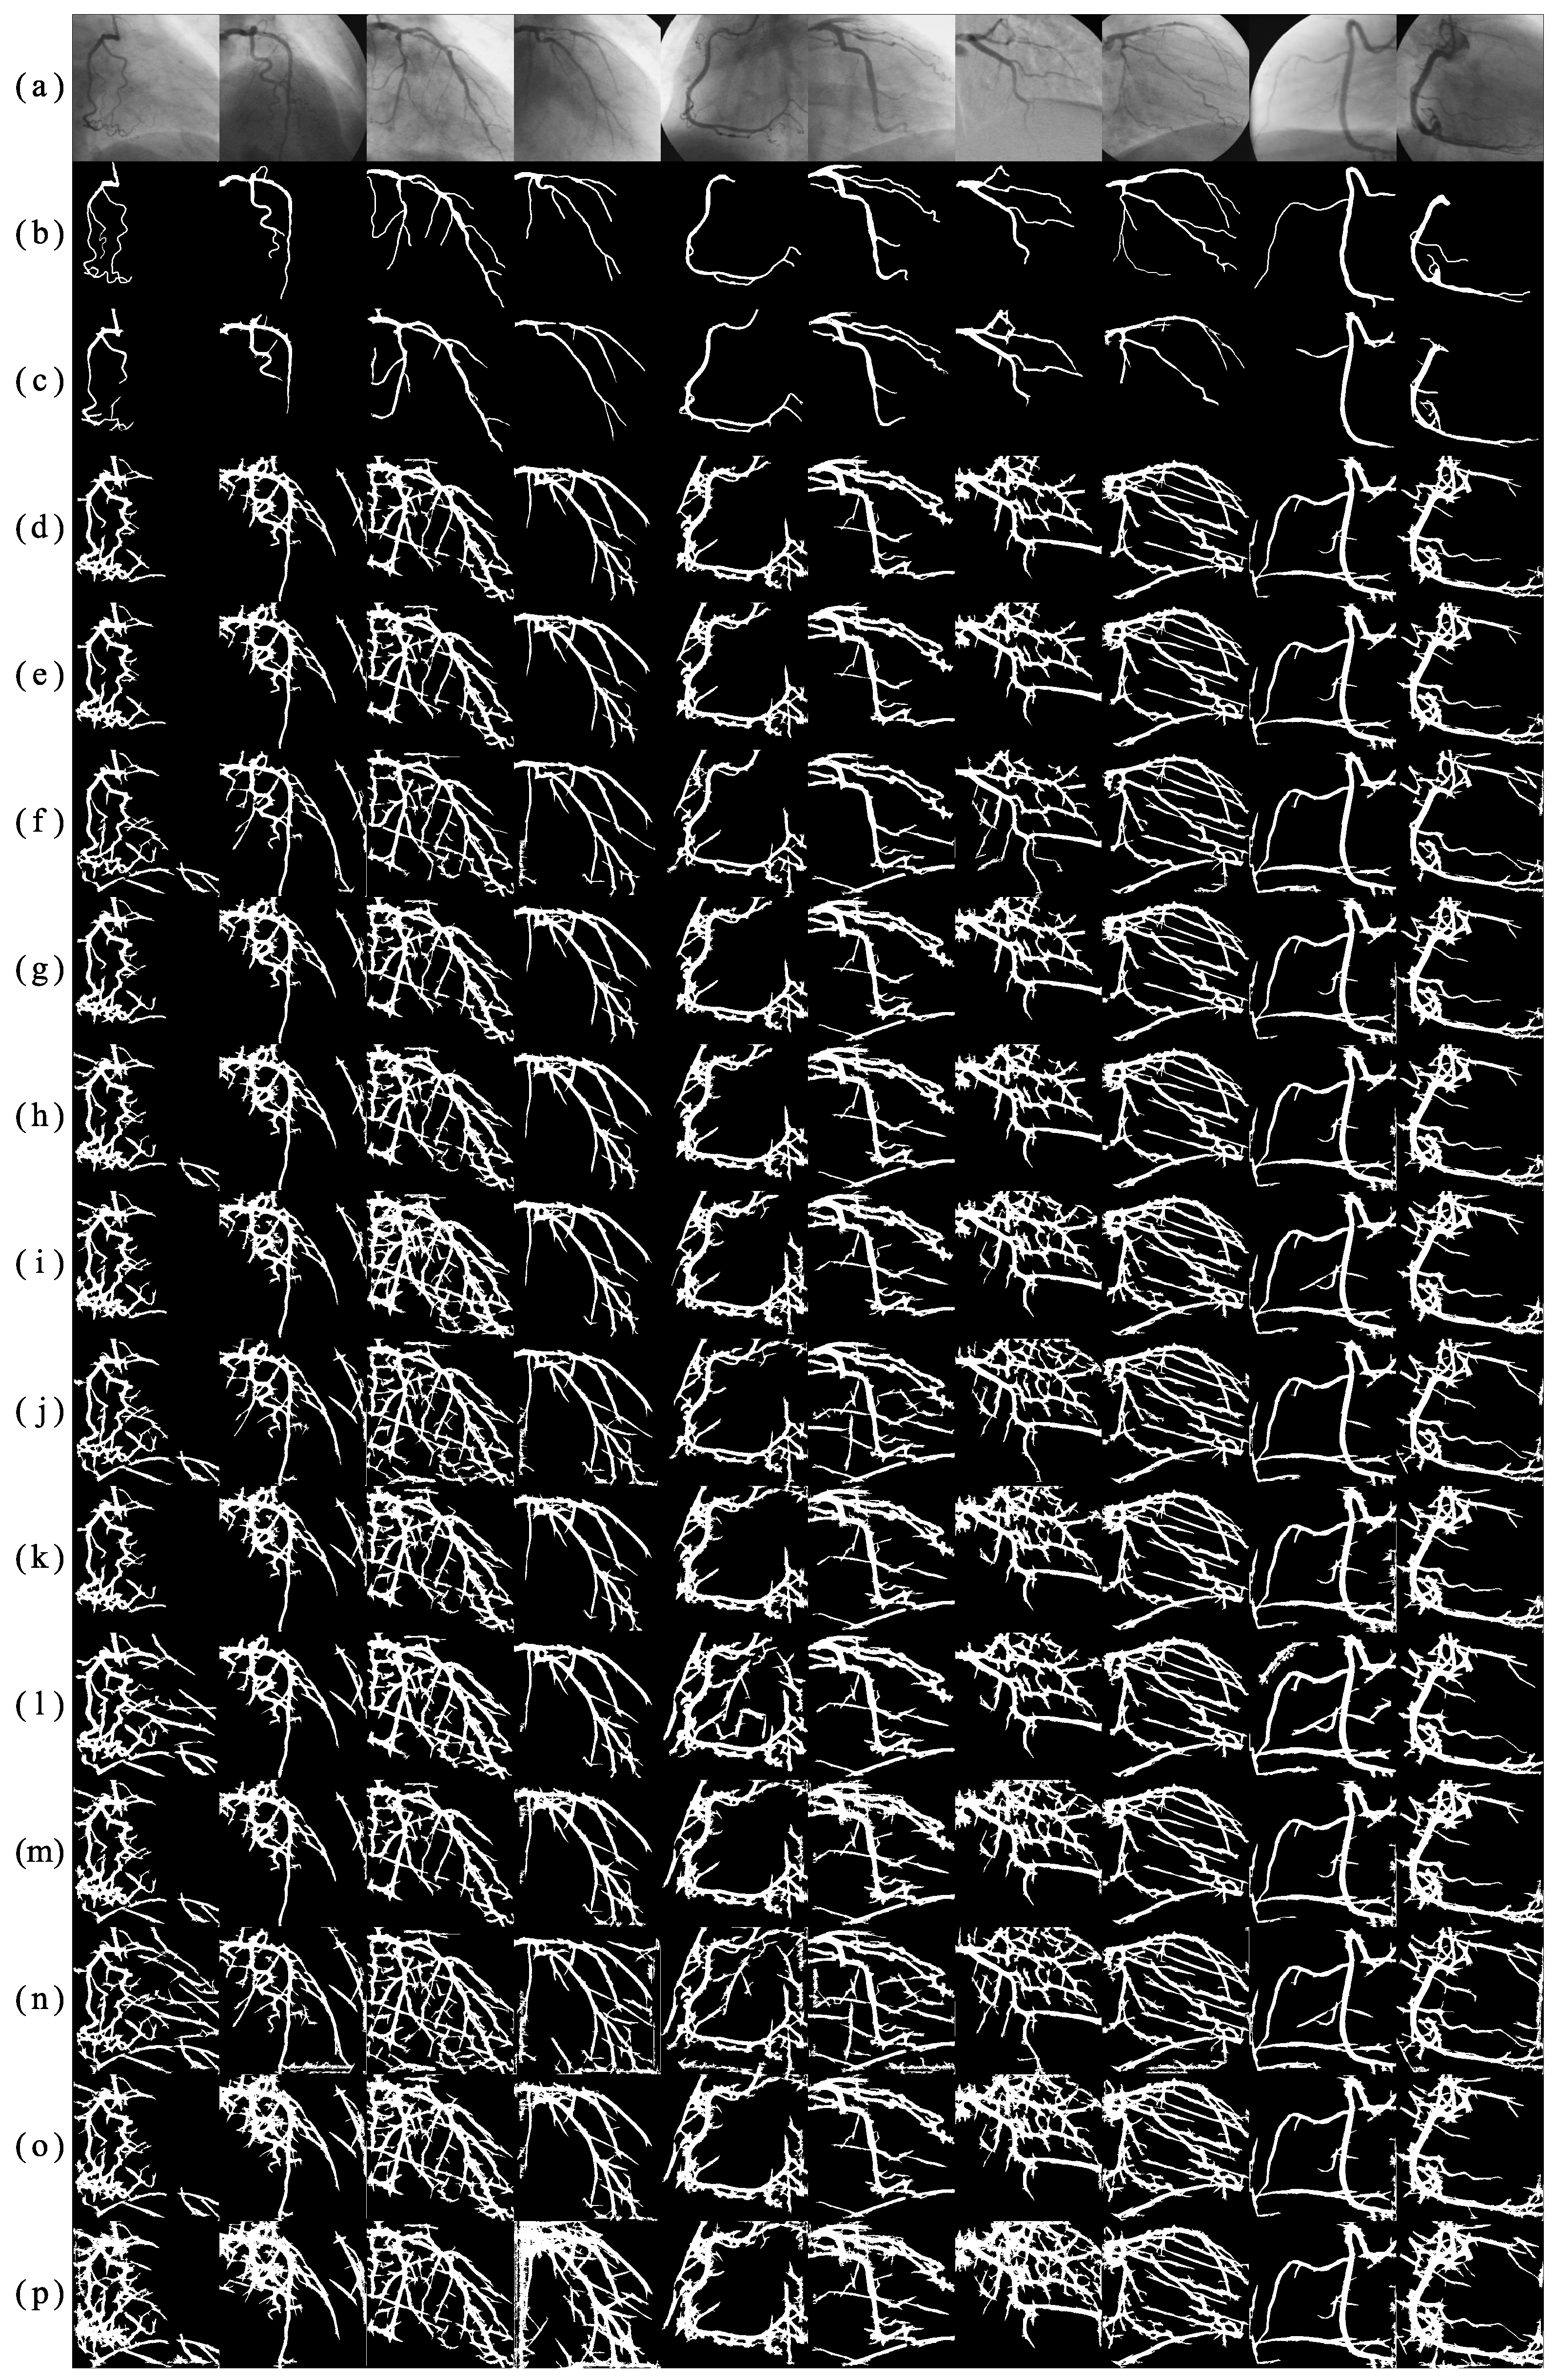
Table 4 presents the comparative analysis of the fourteen automatic binary classification tools in terms of six different binary evaluation metrics, using the test set of 30 angiograms. The analysis is performed by applying each of the compared segmentation tools to the multiscale response of the proposed method, which is illustrated in
Figure 10. After visual examination of
Figure 10, it can be noticed that the soft computing approach provides the lowest incorrect classification rate of background pixels as vessel features, reflected in its high specificity. On the other hand, most of the other classification tools have presented high sensitivity at the cost of a considerable high number of false positives that results in a low positive predictive value, whereas the fixed threshold performs the correct classification of vessel pixels with a significant rate of positive predictive value. Moreover, the Dice coefficient achieved by the fixed threshold is significantly higher than the obtained by the other binary classification methods, being the soft computing approach the one that provides the most similar vessel segmentation to the ground-truth. Because of its high overall segmentation performance presented in the comparative analysis, the best classification technique to segment the multiscale detection response is the binarization under a threshold value of
obtained with a soft computing procedure.
Moreover, in order to evaluate the results of the proposed method, twelve specialized vessel segmentation methods of the state of the art have been selected to perform a comparative analysis. From the set of comparative methods, the method introduced by Eiho and Qian [
1] uses the Top-hat operator for coronary arteries enhancement in angiograms, which combined with a background unification algorithm, extracts vessel features from coronary angiograms. Qian et al. [
2] used the background unification algorithm on the multiscale response of the Top-hat operator, applied at three different scales over the original angiogram. Chanwimaluang and Fan [
37] addressed the vessel segmentation from the single-scale GMF response. The binary segmentation is obtained by selecting the threshold value that maximizes the local entropy computed from the co-occurrence matrix. Kang et al. [
8] applies two different enhancement methods to the original image: the Top-hat operator, and the single-scale GMF. The segmentation result is obtained with a threshold level that maximizes the entropy of the gray-scale intensity of each detection response. The method proposed by Kang et al. [
38] introduces a segmentation procedure based on a similarity degree between pixels of the gray-scale detection response. The approach of Nguyen et al. [
25] segments vessel pixels from the multiline detector response by using a fixed threshold value of
. The value is selected as the binarization level that maximizes the classification accuracy using a training set of images. The method of Li et al. [
5] defines a vessel probability map from a coronary angiogram using a Hessian matrix based method. The vessel segmentation is performed by a region growing algorithm and a subsequent vessel detail repairing procedure. The inter-class variance maximization method of Otsu [
26] has been an efficient separation tool employed by the following methods. The method of Cervantes et al. [
15] employs the single-scale Gabor filter, which parameters are selected using a nature inspired algorithm for numerical optimization. The U-Net [
39] is a convolutional neural network that has been widely used for biomedical image segmentation tasks in recent years. For the comparative analysis, the U-Net [
39] was trained using the training set of 100 images, by taking patches of size
pixels from the zero-padded angiograms as inputs, and using the cross entropy function as loss metric. Finally, the method proposed by Cruz et al. [
17] introduced the multiscale GMF that improves the detection performance of its single-scale version.
The result of the comparative analysis of the twelve specialized vessel segmentation methods, and the proposed method, is presented in
Table 5. The test set of 30 angiograms is used to evaluate the segmentation methods in terms of binary classification accuracy. According to
Table 5, the proposed method obtains the highest segmentation performance with respect to the twelve methods from the state of the art by reaching a classification accuracy of
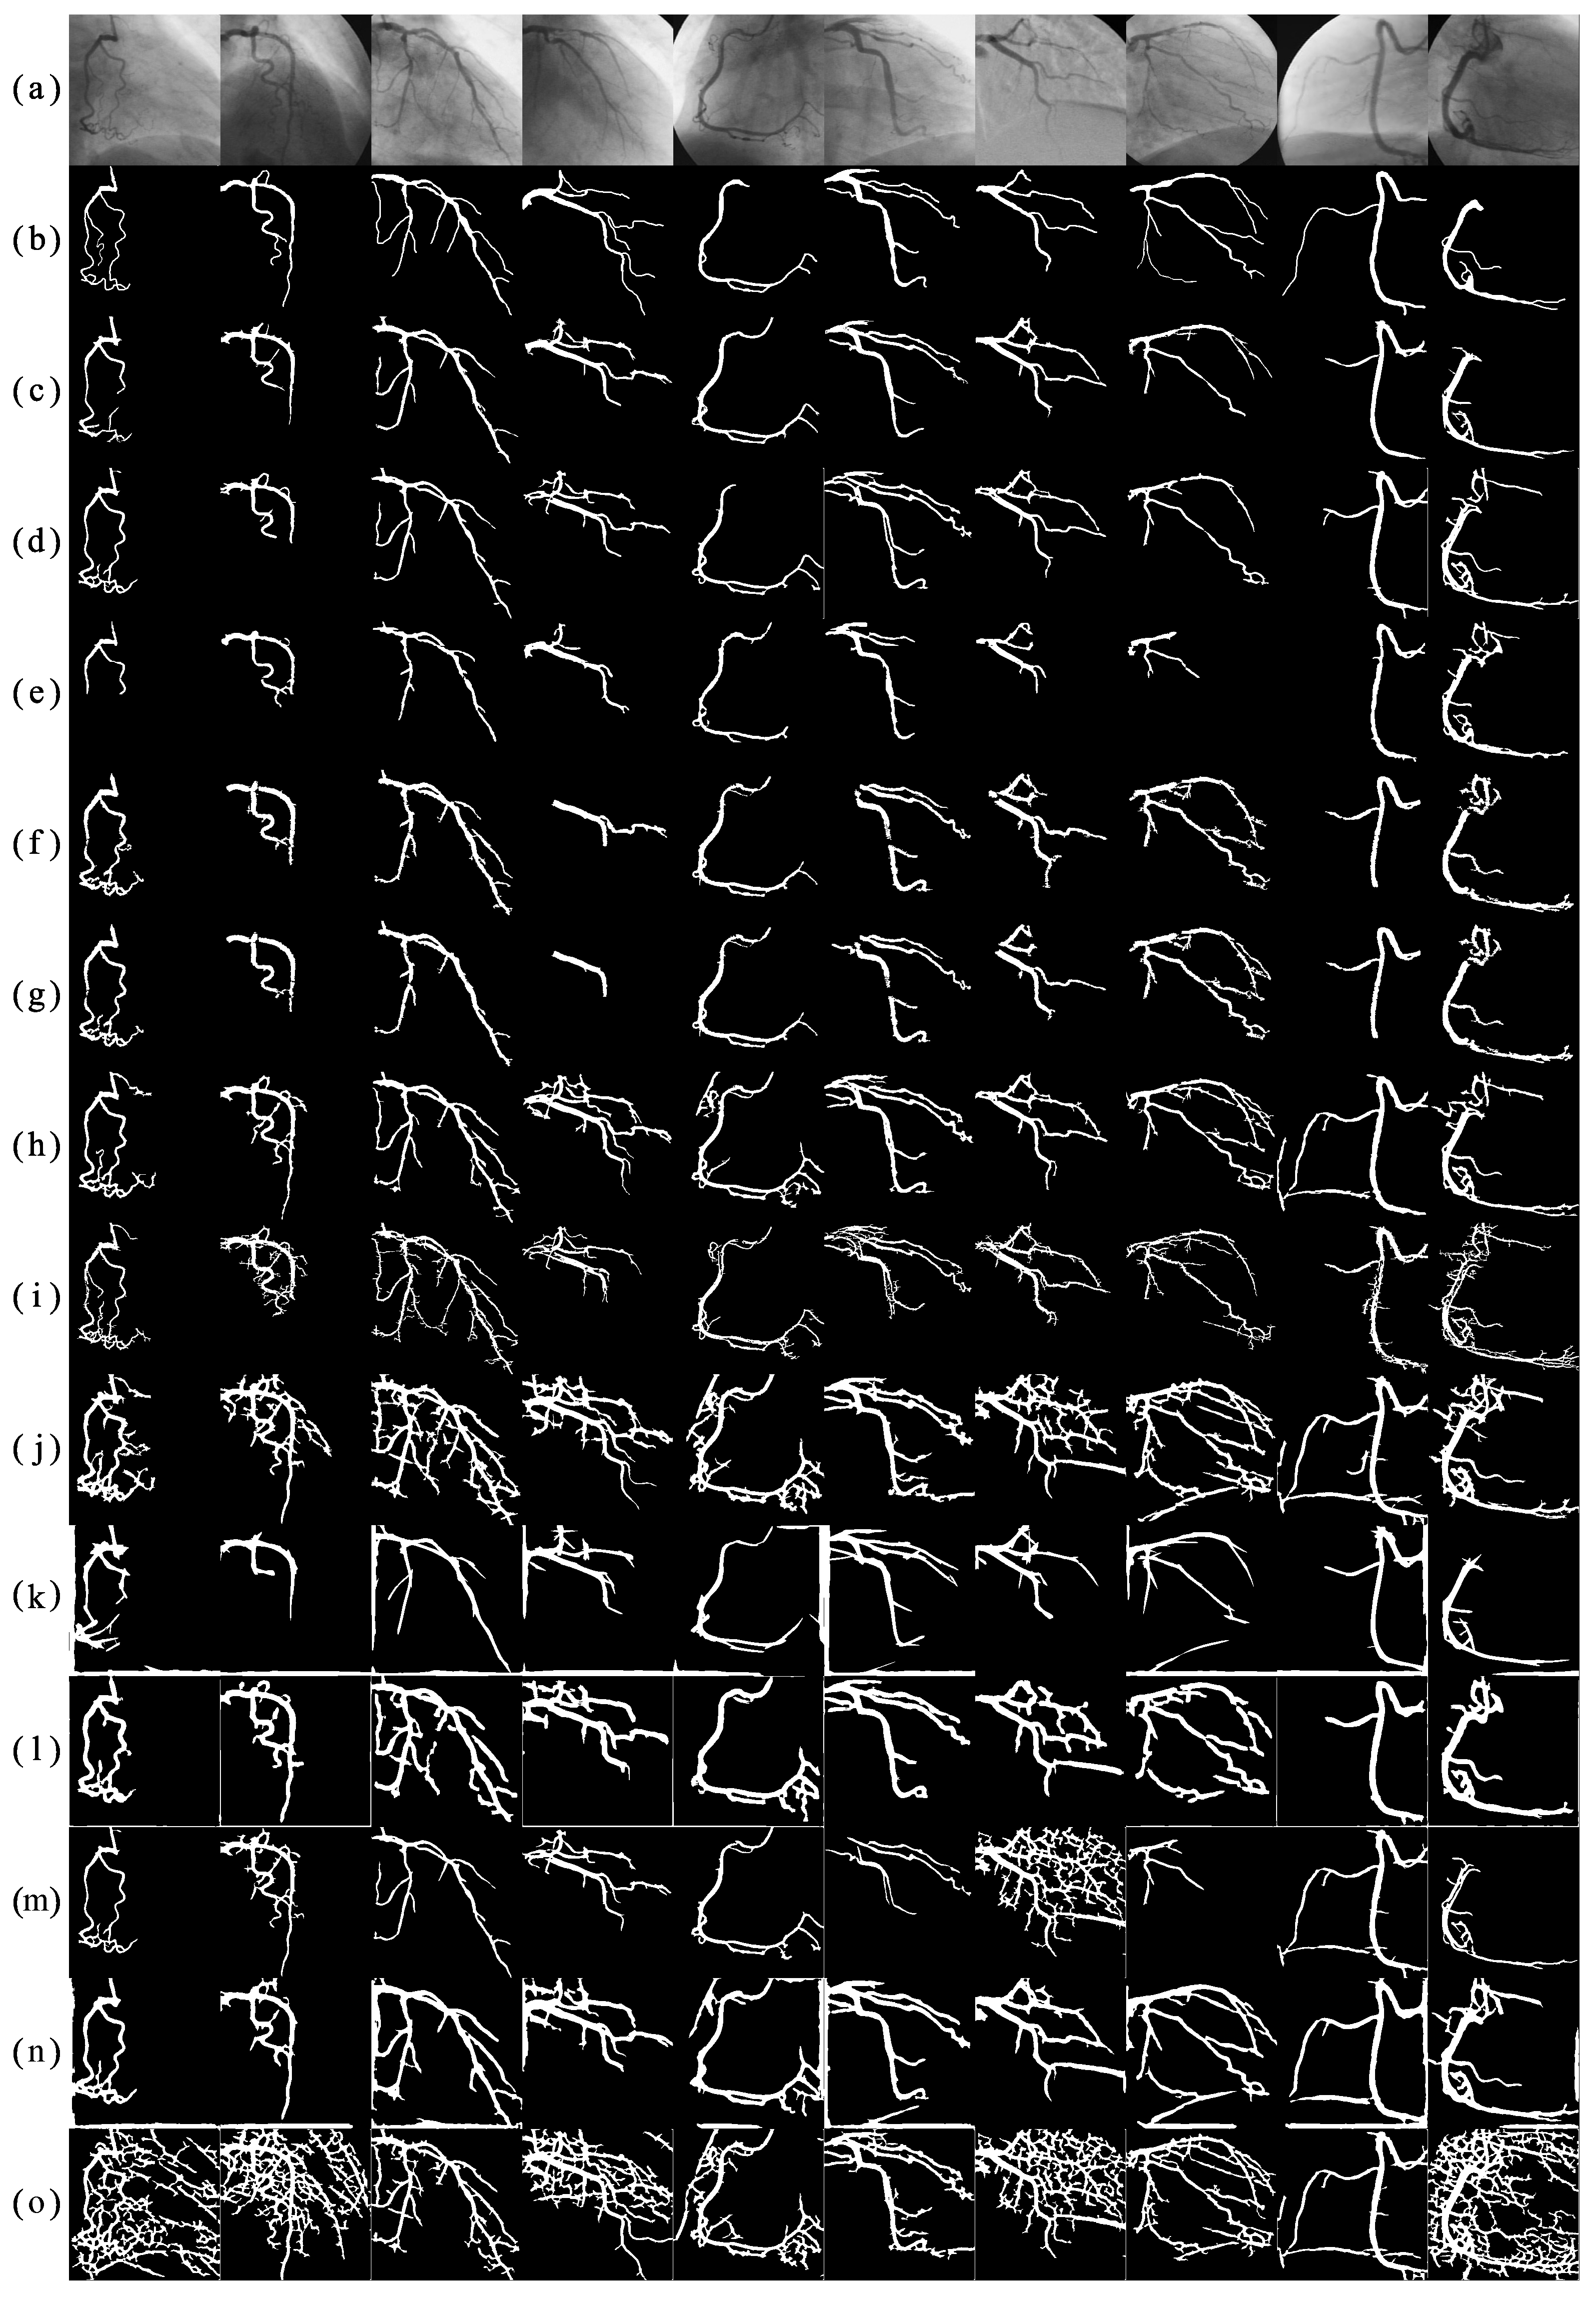
. The resulting segmentation responses of the comparative segmentation methods are illustrated in
Figure 11.
By visual inspection of
Figure 11, it can be noticed that the method of GMF/Local Entropy [
37] presents responses with a high rate of false positive pixels, obtaining the lowest segmentation accuracy of the comparison, this problem is also reflected in the low positive predictive value. The method of GMF/Degree-based [
38] can obtain a relative high number of false negative pixels, affecting the segmentation accuracy and sensitivity of the method. The method based on single-scale Gabor filters [
15] presents a frequent problem on the resulting image edges reducing the sensitivity of the method. The high false positive rate in those areas is associated to the strong detection intensities obtained by using only the average vessel width as single scale. In the method based on multiscale Gaussian templates [
17], the accuracy and positive predictive value are affected by the incorrect classification of the pixels that are closer to the main coronary artery. This problem is because of the strong detection responses obtained by the multiscale Gaussian matched filter for small tubular structures in the background. The methods Hessian Matrix-based/Vessel Repair [
5], and Multiline Detector/Threshold (0.56) [
25] achieve similar classification accuracy. However, their segmentation performance is affected by the presence of irregular edges, holes, and broken vessels, being the method of Hessian Matrix-based/Vessel Repair [
5] the most affected between both, reducing its segmentation sensitivity. The methods Top-hat/Background Unification [
1], and Multiscale Top-hat/Background Unification [
2] achieve high classification accuracy, only limited by the frequent presence of irregular borders and broken vessels in the segmentation result which reduces their positive predictive value and Dice similarity coefficient with the ground-truth. The U-Net (Ronneberger et al.) [
39] method presents the highest specificity and positive predictive value; however, the segmentation result show a high rate of false negative pixels in several images, resulting in broken vessels and a reduction of its overall vessel extraction performance. The method of GMF/Entropy Maximization [
8] presents high segmentation results in overall, being affected only by the presence of holes, broken vessels, and false positives in image edges, reducing its positive predictive value. On the other hand, the experimental results obtained by the proposed method achieved the highest segmentation accuracy, specificity, positive predictive value, and Dice similarity coefficient, using the testing set of the present database. Because of the suitable performance of the proposed method, the segmented coronary arteries present a low rate of false positives along with a low presence of holes and isolated vessels.
The comparison of the average execution time of the proposed method, and twelve vessel segmentation methods from the state of the art, is presented in
Table 6. The methods of GMF/Entropy Maximization [
8] and GMF/Degree-based [
38] present the lowest computational times, followed by the methods Top-hat/Background Unification [
1] and GMF/Local Entropy [
37], which low computational time can be attributed to the single-scale analysis performed in the detection step. The methods of Multiscale Top-hat/Background Unification [
2] and Multiline Detector/Threshold (0.56) [
25] employ a multiscale analysis during the detection step, which increases the execution time with respect to single-scale approaches. The Single-scale Gabor filters/Otsu [
15] involve transformations between the space and frequency domain that affects the overall execution time. The Multiscale GMF/Otsu [
17] method performs a multiscale analysis in the spatial domain, which demand a greater execution time than other single-scale GMF methods. The Hessian Matrix-based/Vessel Repair [
5] method employs a multiscale approach during the detection step, and a vessel repair process in the segmentation step. This method requires a greater execution time than other multiscale methods and is reflected on its average execution time. The proposed method presents the highest execution time in the comparative as a trade-off for its high segmentation accuracy. The computational time demanded by the proposed method is directly related to the number of multiple scales of the Gaussian filter applied in the spatial domain and the Gabor filters performed in the frequency domain.
Finally, it is important to point out that the proposed method for the automatic segmentation of coronary arteries achieved the most accurate results using the present database and different evaluation metrics for each of the vessel detection and segmentation steps. The high segmentation accuracy can be attributed to the multiscale analysis performed in both spatial and frequency domains along with the statistically determined artificial neural network. In addition, given the efficiency obtained by the proposed method and the competitive computational time, it could be integrated into a computer-aided diagnosis system to support cardiologist during the decision-making process.

 ,
, 


