Abstract
Alternative processes have been proposed for selective separation of fluorite and gangue minerals (carbonates and silicates) present in fluorspar ores. Calcination and gravity separation processes are methods that have low efficiency and high cost. Flotation is a chemical process that becomes important when high ore grades are required; however, the selectivity is inhibited by the superficial similarity of the chemical composition of minerals. Accordingly, interactions between dissolved ionic species of fluorite, carbonates, and silicates with some reagents under determinate conditions obstruct the flotation process. In order to optimize the flotation process of a Spanish fluorite ore, this research uses a mathematical model. In this study, the variables were the dose of potato starch, quebracho tree, white dextrine, oleic acid, and sodium silicate. On the other hand, the factors studied were the law of carbonates, silica, and fluorite, in addition to the metallurgical recovery of fluorite. The statistical technique of factor analysis that relates the variables and factors allowed to the optimization of the reagent dosage. Maximum metallurgical recovery was achieved without sacrificing the fluorite grade. The mathematical model adjusts satisfactorily to the results with a correlation coefficient of 91.58% for metallurgical recovery and 98.51% for fluorite grade. Optimizing the process 60.45% of metallurgical recovery and 68.99% of fluorite grade are achieve in the roughing step, using a dosage of 1.68 g·kg−1 of potato starch, 0.86 g·kg−1 of quebracho tree, 1.25 g·kg−1 of dextrin, 3 g·kg−1 of oleic acid, and 0.85 g·kg−1 of water glass.
1. Introduction
Fluorite ores are attracting attention due to the wide range of novel applications that this mineral possesses [1,2,3,4]. However, applications require acid grade fluorite of at least 97% purity. To achieve this level of purity, froth flotation is shown to be the most efficient and economically viable technique. However, treating fluorite ores by froth flotation is a complex process. The process is influenced by a range of different factors [5]. Froth flotation is a heterocoagulation process where target mineral particles within an aqueous pulp selectively attach to air bubbles, forming particle–bubble aggregates, which are subsequently transported out of the pulp into a froth phase. As the air bubbles mainly differentiate between hydrophobic and hydrophilic surface properties, selectivity is essentially based on differences in wetting properties of the solid particles suspended in the pulp [6]. With economic factors driving the production of acid grade fluorspar, common gangue minerals must be reduced to the minimum allowed in such a pure concentrate. The ultimate goal of all fluorite concentrate producers is to improve grade to a point where they have a marketable product, while also maintaining recovery.
Roughing, as the first step in froth flotation, has to achieve the maximum metallurgical recovery leading to a metallurgical grade. There are numbers of operation variables affecting the rougher process [7]. Particle size is a crucial physical factor in order to achieve high grade purities because it has to be small enough to ensure the liberation of minerals [8]. Otherwise, particle size smaller than 20 microns is less efficient in froth flotation process due to the formation of slime coatings. As the particle size decreases the specific surface area increases making necessary the augmentation of reagents dosage when slime coatings are presented in froth flotation [9,10]. In a flotation cell, entrainment occurs simultaneously along with true flotation. Unlike true flotation, entrainment is not chemically selective and it occurs without a direct attachment of particles to bubbles. This issue can be solved by applying enough agitation energy to the flotation process [11]. Depressants in fluorite flotation, which are used for decreasing the floatability of calcite and silica, mainly include some inorganic salts. Sodium silicate commonly known as water glass and its solution with inorganic salt ions, are often applied in fluorite flotation to depress silica [12,13]. Otherwise, tannins are presented as strong depressants of the carbonated gangue, in this way quebracho tree stands out as especially energetic tannin in the calcium carbonate depression [14]. Reagents such as starch are particularly effective for reducing common gangue constituents in fluorspar ores [15]. When slime coatings are present in the flotation process, dispersants as sodium silicate have an important role upgrading the depressant action [16]. Fatty acids and their soaps are often used as collectors in flotation for non-sulfide ores such as bauxite, hematite, apatite, scheelite, and fluorite. Oleic acid, linoleic acid, and linolenic acid have been and are commonly used as collectors. Additionally, they have low temperature resistance [17,18].
Most recent research in fluorite flotation focuses on the study of new collectors [19] and new depressants [20,21]. However, to our knowledge, no data have been published on the interaction between different reagents involved in the fluorite flotation process. Some authors have used the technique of design of experiments (DoE) to optimize some chemical and physical variables of flotation process, for example [22] use this technique to optimize the dosage of collector in the flotation of apatite and [23] Use DoE to study some hydrodynamic aspects in column flotation.
On the other hand, only [24] used a mathematical modeling to study some physical and chemical variables in fluorite flotation process. Concretely, they used a central composite design (CCD) to achieve an optimal temperature, time of flotation and collector dosage. Despite that, it is very important to analyze the interaction that the collector has on the depressors and on the rest of the reagents to obtain optimal dosages that allow the viability of the process.
Since most of the variables that influence fluorite froth flotation are of numerical data, there will be an infinite amount of variable portfolios. Though the application of simulation software can significantly reduce the experiment cost and enhance the experiment efficiency when each variable has a specific value, it can hardly deal with the situation of infinite potential variable combinations. Therefore, the experimental design must be carefully considered, which can identify the key variables and their optimum value intervals with as fewer experiments [25]. To solve this problem, DoE methodology is applied in this paper to fluorite froth flotation processes under slime coating. With the statistical analysis of simulation data, the functional relationship model is set up, discussing the influences of different variables on the performance of flotation process. Finally, the mathematical model searches out and tests the optimum variable combination.
2. Materials and Methods
2.1. Mineral
The mineral used in this work comes from the Lujar Mine, (Granada, Spain), owned by Minera de Órgiva S.L. In the Lujar Mine, the mineralization of lead (galena, cerussite, and anglesite) and fluorite is linked to the massive limestones and interspersed with Dolomites with a “Franciscan” structure of the Triassic Ladinian age. It is associated with two important dolomitic horizons, with a width of 3 km and an approximate extension of 10 km in the Northeast-Southwest direction. The thickness varies between 2 and 12 m, with grades of 1.85% of lead and 34% of fluorite.
Specifically, the mineral used in the flotation tests is a slime by-product generated in the production plant already installed in this mineral deposit (Figure 1).
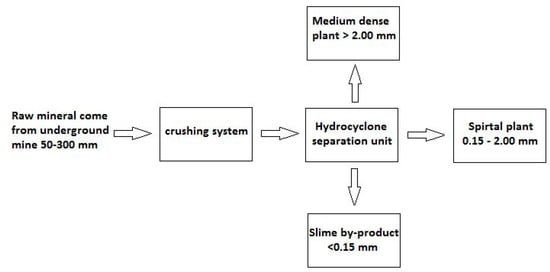
Figure 1.
Block diagram of mineral treatment performed by company Minera de Orgiva, S.L.
2.2. Flotation
Flotation tests were conducted in a D12 multi-cell flotation cell of 2 L capacity, model XFD-II-3, motor power of 120 W and operating voltage of 400 V (Figure 2). The impeller speed was fixed at 1200 rev·min−1. For each test, a 500 g of mineral sample was dispersed in 2 L of water. After adjusting the suspension pH to 9.50 and addition of the depressant reagents, the suspension was conditioned for five minutes. The conditioning period lasted three more minutes when the collector was added. The flotation time was fixed at three minutes. The floated and unfloated fractions were collected and dried separately. The mass of solids in each fraction were determined accurately and used to calculate the recovery.
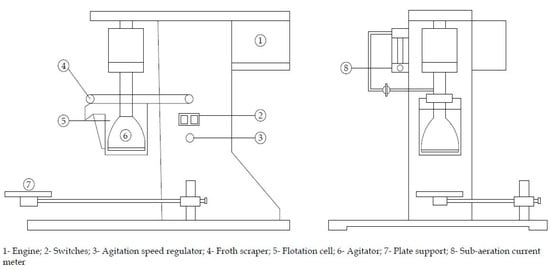
Figure 2.
Schematic representation of D12 multi-cell flotation cell equipment.
2.3. Chemical Reagents
All the chemical reagents used were of analytical grade: sodium silicate (NaSiO2) of 99% purity supplied by PA-Panreac; quebracho tree of 99% purity supplied by PA-Panreac; potato starch of 99% purity supplied by PA-Panreac; white dextrin of 99% purity supplied by PA-Panreac; calcium carbonate (CaCO3) of 99% purity supplied by PA-Panreac; oleic acid of 99% purity supplied by PA-Panreac.
2.4. Functional Model Description
DoE has been used since the last century as a tool to optimize several processes in many different fields. Energy saving [26,27], process development [28,29], material fabrication [30], analytical chemistry [31], waste valorization [32], etc. The widespread use due to the superiority of the DOE technique compared with one-factor-at-time (OFAT) or even with more simplistic trial and error (T&E) methods usually applied in industry, and second, it alludes to the statistics theory of being able to detect an effect discrimination between different realizations of a process input variable.
Few researchers have used a design that allows the development of empirical models with several independent variables, to examine the flotation of minerals. These empirical models are preferable to the theoretical ones, since the latter are too complex when they contain more than two independent variables.
For these reasons, in the present work a factorial design of central composition is used to study the influence of the chemical variables on the flotation of fluorite (whose values are normalized between −1 and +1)
The model tested experiments with a series of points (experiments) around a point of central composition (central experiment), and with additional points (additional experiments), for the estimation of the quadratic terms of a polynomial model. This design satisfies the general requirements that all parameters of the mathematical model can be estimated without an excessive number of experiments.
2.4.1. Definition of Outputs (Response) ‘Y’
Generally, the evaluation indexes of mineral flotation include recovery, purity grade of key minerals and purity grade of contaminants. Thus, Fluorite Metallurgical Recovery (FMR) is defined as Y1, Fluorite Purity Grade (FPG) is defined as Y2 while Silica Purity Grade (SPG) and Carbonates Purity Grade (CPG) are defined as Y3 and Y4, respectively. Measurement unit of all responses are ‘%’.
2.4.2. Definition of Input Variables (Factor) ‘X’
Considering the feasibility of modeling and function analysis, dosage ratio of five reagents were chosen as factors. Potato starch ratio (PS), quebracho tree ratio (QT), white dextrin ratio (WD), oleic acid ratio (OA), and sodium silicate ratio (SS), and defined as X1, X2, X3, X4, and X5, respectively. The measurement unit of all factors is grams per kilograms of the mineral sample.
2.4.3. Functional Model
The design proposed by Montgomery [33] is defined by three parameters: number of variables, X; constant p, which takes the values 0 for X < 5 and 1 for X ≥ 5; and number of central points, nc.
These parameters originate three groups of points:
- 2X−p points that constitute a factorial design
- 2·X axial points
- nc central points
The total number of points (experiments) will be given by the expression
Experimental data were fitted to the following second-order polynomial equation
where Xi represents operational variables; Yi output response and ai are constants.
Response surface design modeling and analyses were carried out using commercial software Statgraphics Centurion version 16.2. The analysis of variance (ANOVA) was employed for determination of significant variables affecting the aqueous extraction. f-value, p-value, and coefficient of determination (R2 value) were carried out to determine the adequacy of developed model. The polynomial models are represented by 3D contour plot to elucidation of significant interaction affecting the responses using MATLAB software (MathWorks Inc.) to graphing.
The values of the operational variables were normalized to values from −1 to +1 by using the expression
where is the normalized value of FMR, FPG, SPG, and CPG; is the absolute experimental value of the studied variable; is the average of and ; and and are the maximum and minimum values, respectively, of the selected variable.
3. Design of Experiments (DoE)
Design of Montgomery Factorial Experiment
The first step of experiment design was to set the values for input variables. Considering the realistic value intervals, we assigned three levels for each factor as shown (Table 1). The concentrations of the medium level were based on internal reports whereas high levels were chosen taking into account that the mineral is form by ultrafine particles (slimes) and therefore higher specific surface area. That fact makes necessary higher doses of reagents [34].

Table 1.
Description of levels in selected factors.
According to Equation (1), a three-level DoE with five variables (X) requires 26 experimental runs. Three center-point experiments were added to evaluate the error ‘ε’. The whole experiment plan including the 29 experimental runs is shown in Table 2.
Table 2.
Experimental plan of three-level full factorial design.
In this study where the parameter p is 1, there is a considerable reduction in the number of points of the factorial design, without affecting the determination of the parameters of first and second orders. Due to this reason, this model has the advantage of needing fewer experiments than the neuroborrosal and full factorial design systems.
4. Results and Discussion
4.1. Mineral Characterization
Element composition of this by-product was measured using X-ray fluorescence (XRF) with the equipment “ARL Optim’X WDRXF” from Thermo Fisher Scientific (Waltham, MA, USA), with 50 kV, rhodium anode and LiF200, InSb and AX06 crystals, together with the Oxsas 2.2 software from Thermo Fisher Scientific (Waltham, MA, USA), (Table 3). Otherwise, chemical compounds were determined by chemical analysis (Table 4).
Table 3.
XRF analysis of the pure mineral (mass fraction, %).
Table 4.
Chemical analysis of the pure mineral (mass fraction, %).
Chemical analysis was carried out using the strict UNE-7-307-86 norm. This standard allowed the determination of calcium and magnesium carbonates, silica, metal oxides, and fluorite using gravimetric methods.
The granulometric curve of the mineral was determined using Mastersizer Hydro 2000G laser diffraction particle size analyzer (A) (Alcobendas, Madrid, Spain). The particle size of the mineral under study in this research was below 100 μm (Figure 3), therefore it was not necessary to grind the sample since its size is already suitable for the flotation process [35]. However, a large part of the mineral was smaller than 20 μm of particle size. Therefore, the mineral is susceptible to form slime coatings [9]. This will have a negative influence on the flotation, which renders a greater dosage of reagents necessary for the process.
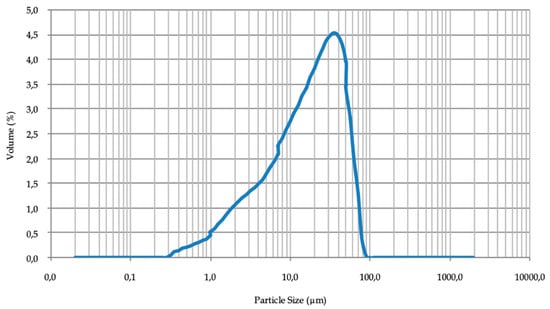
Figure 3.
Particle size distribution of mineral.
4.2. Flourite Froth Flotation
Before the analysis, once the flotation process was carried out, the concentrate and the process sterile were brought to dryness in an oven at 150 °C until constant weight. The drying time for this material at this temperature was between two and three hours.
The results of FPG, SPG, CPG, and FMR for each experiment are shown in Table 5.
Table 5.
Experimental results of three-level full factorial design.
The optimum results with regards to of FPG were obtained for the variables close to the central point. For example, at the central point values of 70.31, 67.52, and 66.46 were obtained. Furthermore, this shows that the reproducibility of the method is excellent, obtaining similar values for the same experiment. On the other hand, the optimum results for FMR were obtained, in general, when the doses of OA were highest (experiments 20 and 27). The worst result in term of carbonate purity grade is obtained at central point and with a silica grade purity of at least 6.46 (experiment 24). However, to determine the full influence of all the variables and their relationship with the rest, it is necessary to adjust and analyze the results from the described method.
4.3. Model Fitting
According to the analysis of variance (ANOVA) results, many p-values are above 0.05, which mean that these factors or second order effects do not have statistically significant effects on the response studied. The fitting of the model of each response have to avoid terms of the factor that do not make a significant effect in order to simplify the Equation (2) of the mathematical model. Table 6 shows p-values from ANOVA table to test the acceptability of the model from a statistical perspective.
Table 6.
p-value from ANOVA table to test the acceptability of the model from a statistical perspective.
The proposed adjusted model fits satisfactorily to the results obtained, with correlation coefficients shown in Table 7 for each response.
Table 7.
ANOVA correlation coefficients.
Otherwise, the regression coefficients of Equation (2) are shown in Table 8. The regression coefficients of the factor and second order effects that do not have a p-values under 0.05 do not make any significant effect on Equation (2).
Table 8.
Regression coefficients for each response Y.
4.3.1. Fluorite Metallurgical Recovery (FMR)
Figure 4 shows how each of the reagents influenced FMR inside the tested range. As can be seen, the variable that most influenced the FMR was the dosage of OA, achieving the maximum fluorite recovery at the top point of the reagent dosage. Accordingly, if the objective is to carry out a roughing of the starting mineral, the flotation with the largest value of OA must be carried out in order to achieve a sterile with the minimum fluorite grade. On the other hand, an excess of QT and SS inhibit FMR while PS and WD have a minimum at their center point being more economically viable to use a lower dosage of the two reagents.
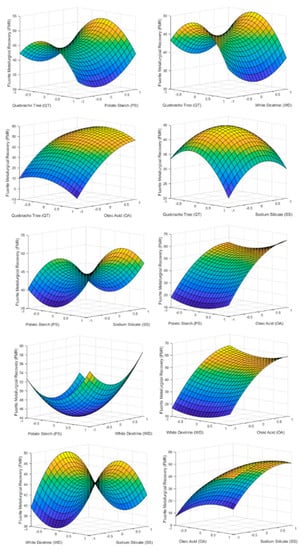
Figure 4.
3D surface graphs of FMR showing the effect of PS, QT, SS, OA, and WD.
Comparing the graphs with the results of the p-values in Table 6, it can be seen how the factors with lower p-values have a greater effect on FMR. In this case only factor X4 (oleic acid) has a significant effect on FMR because the p-values of the rest factors and second order effect are above 0.05. This fact can be seen in the graphs of Figure 4 where only AO has a marked slope in the studied range.
4.3.2. Fluorite Purity Grade (FPG)
The influence of reagent on FPG is shown in Figure 5. It is observed that PS and QT reached a maximum close to their central point. On the other hand, WD and SS are the reagents whose variation influenced the FPG the least. The fact that WD did not have a considerable effect was due to the effect of PS [15,16]. PS, being a carbonate flocculant, inhibits the effect of WD as a dispersant due to the concentrations of PS used compared to WD.
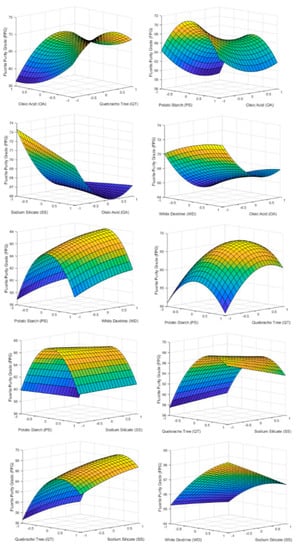
Figure 5.
3D surface graphs of FPG showing the effect of PS, QT, SS, OA, and WD.
As the oleic acid dose increased, the FPG decreases, reaching a minimum close to its upper level. This fact is due to the fact that high doses of OA promote the flotation of the rest of minerals present in the flotation cell. Therefore, it is necessary to determine the optimum value of OA dosage based on the desired FMR since it is not economically viable to obtain a very high FPG if the FMR is extremely low.
If graphs of Figure 5 are compared with the p-value of Table 6 for Y2, it can be seen that all of the factors except SS (X5) have an important effect on FPG. Some interactions between factors also are statistically significant for FPG. It is the case of PS and QT (X1X2), PS and SS (X1X5), QT and OA (X2X4), QT and SS (X2X5), OA and SS (X4X5). Finally, some quadratic effects show influence in FPG as PS2, QT2, and OA2.
4.3.3. Silica Purity Grade (SPG)
The reagents influencing SPG the most were QT and SS. High doses of QT have an undesired effect, achieving high values of silica concentration in the froth. This was due to the fact that QT acts as a depressant of carbonates and fluorite when high doses are used (Figure 6 and Figure 7). PS has a behavior similar to QT in terms of SPG but with less notoriety due to its lower energy as a carbonate depressor [15]. Otherwise high doses of SS reach a minimum, around 8% of silica concentrate in the froth phase, due to the effect of SS as a silica depressant [36].
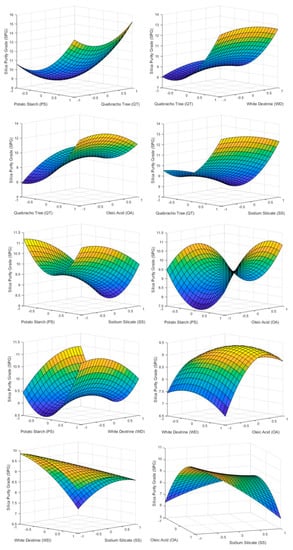
Figure 6.
3D surface graphs of SPG showing the effect of PS, QT, SS, OA, and WD.
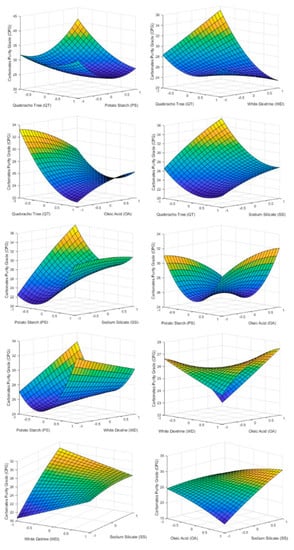
Figure 7.
3D surface graphs of CPG showing the effect of PS, QT, SS, OA, and WD.
Low doses of OA showed the lowest value obtained of concentration of silica 7.6%. This is due to the fact that OA also acts as a silica collector with less affinity than fluorite. Varying the dosage of WD showed no effects.
4.3.4. Carbonates Purity Grade (CPG)
As the dosage of QT and PT was increased, the amount of carbonate in the froth phase decreases. This supports work carried out by previous studies [14,15,16,17,18,19,20,21,22,23,24,25,26,27,28,29,30,31,32,33,34,35,36,37] regarding carbonate depression. Otherwise even with high doses of OA it does not present itself as a carbonate collector.
Since WD is low energetic depressant of carbonates, it does not show any considerable effect on CPG. This is due to the termination of the dispersing effect of PT.
SS in Figure 7 has an effect similar to that presented by QT in Figure 6. High doses of SS promoted the flotation of carbonates. This fact leads to the conclusion that for this type of deposit it is not convenient to depress carbonates and silica at the same time.
As can be seen in Table 6 QT and SS are the only factors that have significance effect on CPG. Those corroborate what is shown in Figure 7 and discussed in the paragraphs before. Table 6 also shows some interaction between factors that have a statistical effect on CPG. They are PT·QT, PT·WD, PT·SS, QT·WD, QT·OA, WD·OA, WD·SS, and OA·SS.
4.3.5. Optimization of the Regression Model
Equation (2) was derived for each response (Yi) using the ai values of Table 8. It was done using commercial software Statgraphics Centurion version 16.2. The optimization lets to the optimal value of Xi normalized between −1 and +1.
In the case of FMR and FPG, optimization aimed to obtain the maximum value. On the other hand, for the SPG and CPG responses the minimum value was obtained (Table 9). By means of a single flotation stage, the optimal values for each of the responses showed outstanding values highlighting a FMR of 70.12% and a FPG of 74.50%.
Table 9.
Optimal values for each response Yi.
In the case of the flotation process carried out in this research, the optimization of the model has short utility if the optimization of multiple responses is not performed. Through multiple optimization of FMR and FPG, assigning an equal weight to each response, the optimal factors values are shown in Table 10. The results obtained for each response were 68.99% FPG and 60.45% FMR.
Table 10.
Multiple optimal values for each response FMR and FPG.
With the optimization, the final regression equation can be defined as
Based on these results, it has gone from having a non-marketable by-product with 41% of FPG to recover, in a single flotation stage, 60.45% of the fluorite content with an FPG of 68.99%. The product obtained is marketable as metallurgical grade fluorite.
5. Conclusions
Based on the results of this work, optimal dosages of reagents were 1.68 g·kg−1 of potato starch, 0.86 g·kg−1 of quebracho tree, 1.25 g·kg−1 of dextrin, 3 g·kg−1 of oleic acid, and 0.85 g·kg−1 of water glass. However, taking into account the effect of QT and SS on silica and carbonates respectively, it is not considerable to use these two reagents at the same time. The process would be improved it is divided in two stages. Firstly, decarbonation is used excluding SS to depress carbonates. Secondly, SS would be used to depress silica. Therefore, in this research is found that WD as a reagent has no significant effect on any of the mineralogical species present in the mineral deposit. It is due to the coagulant effect produced by PS on the dispersing action of the WD. The elimination of WD in the flotation process would lead to greater economic profitability.
In the roughing stage, high recoveries and therefore high doses of OA are required. However, it must be taken into account for future flotation stages that high doses of OA limit the purity of the concentrate in fluorite. The optimization of multiple responses led to obtain a marketable product, in a single flotation stage, with 68.99% of fluorite and a metallurgical recovery of 60.45%.
To sum up, the mathematical model proposed by Montgomery fits the obtained data satisfactorily. Through this model, processes with a reduced number of experiments can be optimized obtaining remarkable results. The proposed mathematical model has limitations compared to others such as full factorial designs, Box–Behnken or neuroborrosal systems. The great reduction of experiments that can be achieved with the Montgomery model makes it more susceptible to wrong optimizations or not so close to the optimum. However, its use in very complex systems makes this model truly useful due to its simplicity and decent results.
Author Contributions
J.R.C.-M. carried out the experiments and wrote the original draft of manuscript; A.P. was especially involved experimental design and in application of software for data analysis; C.A.C. and R.N.-D. were involved in the supervision of experiments, preparation of equipment and material and reagents support; M.A.M.-L. and M.C. provided ideas, contributed to the data analysis, supervised and edited the manuscript. All authors read and approved the final manuscript.
Funding
This research was funded by company MINERA DE ÓRGIVA, S.L., Spain”.
Conflicts of Interest
The authors declare no conflict of interest.
References
- Krieke, G.; Sarakovskis, A.; Springis, M. Ordering of fluorite-type phases in erbium-doped oxyfluoride glass ceramics. J. Eur. Ceram. Soc. 2018, 38, 235–243. [Google Scholar] [CrossRef]
- Zhong, Y.; Zhang, W.; Ma, D.; Xu, D.; Lin, Z. A three-dimensional lead borate with a fluorite net constructed from different cluster building units. Inorg. Chem. Commun. 2017, 86, 108–111. [Google Scholar] [CrossRef]
- Bocharov, D.; Piskunov, S.; Zhukovskii, Y.F.; Spohr, E.; D’yachkov, P.N. First principles modeling of 3d-metal doped three-layer fluorite-structured TiO2 (4, 4) nanotube to be used for photocatalytic hydrogen production. Vacuum 2017, 146, 562–569. [Google Scholar] [CrossRef]
- Maki, R.S.; Kobayashi, K.; Suzuki, Y. Electrical properties of murataite modules with complex and large-volume fluorite-type superstructures. Mater. Res. Bull. 2016, 84, 254–258. [Google Scholar] [CrossRef]
- Wills, B.A.; Finch, J. Wills’ Mineral Processing Technology: An Introduction to the Practical Aspects of Ore Treatment and Mineral Recovery, 8th ed.; Butterworth-Heinemann: Montreal, QC, Canada, 2015; pp. 265–310. [Google Scholar]
- Fuerstenau, D.W. An introduction: Physicochemical methods of separation. In Development in Mineral Processing, 2nd ed.; Laskowski, J.S., Ralston, J., Eds.; Elsevier: Amsterdam, Holland, 1992; Volume 12, pp. 225–241. [Google Scholar]
- Yianatos, J.; Bergh, L.; Vinnett, L.; Panire, I.; Iriarte, V. Correlation between the top of froth grade and the operational variables in rougher flotation circuits. Miner. Eng. 2016, 99, 151–157. [Google Scholar] [CrossRef]
- Kowalczuk, P.B.; Drzymala, J. Surface flotation of particles on liquids, Principles and applications. Colloids Surf. A Physicochem. Eng. Asp. 2012, 393, 81–85. [Google Scholar] [CrossRef]
- Yu, Y.; Ma, L.; Cao, M.; Liu, Q. Slime coatings in froth flotation: A review. Miner. Eng. 2017, 114, 26–36. [Google Scholar] [CrossRef]
- Leistner, T.; Peuker, U.A.; Rudolph, M. How gangue particle size can affect the recovery of ultrafine and fine particles during froth flotation. Miner. Eng. 2017, 109, 1–9. [Google Scholar] [CrossRef]
- Wang, L.; Peng, Y.; Runge, K.; Bradshaw, D. A review of entrainment: Mechanisms, contributing factors and modelling in flotation. Miner. Eng. 2015, 70, 77–91. [Google Scholar] [CrossRef]
- Zhou, W.; Moreno, J.; Torres, R.; Valle, H.; Song, S. Flotation of fluorite from ores by using acidized water glass as depressant. Miner. Eng. 2013, 45, 142–145. [Google Scholar] [CrossRef]
- Zhang, G.; Gao, Y.; Chen, W.; Liu, D. The Role of Water Glass in the Flotation Separation of Fine Fluorite from Fine Quartz. Minerals 2017, 7, 157. [Google Scholar] [CrossRef]
- Rutledge, J.; Anderson, C.G. Tannins in Mineral Processing and Extractive Metallurgy. Metals 2015, 5, 1520–1542. [Google Scholar] [CrossRef]
- Yang, S.; Li, C.; Wang, L. Dissolution of starch and its role in the flotation separation of quartz from hematite. Powder Technol. 2017, 320, 346–357. [Google Scholar] [CrossRef]
- Song, S.; López-Valdivieso, A.; Martinez-Martinez, C.; Torres-Armenta, R. Improving fluorite flotation from ores by dispersion processing. Miner. Eng. 2006, 19, 912–917. [Google Scholar] [CrossRef]
- Jian, B.X. Flotation Reagents, 3rd ed.; Metallurgical Industry Press: Beijing, China, 1981; pp. 126–169. [Google Scholar]
- Gao, J.; Sun, W.; Hu, Y.; Wang, L.; Liu, R.; Gao, Z.; Lyu, F. Propyl gallate: A novel collector for flotation separation of fluorite from calcite. Chem. Eng. Sci. 2019, 193, 255–263. [Google Scholar] [CrossRef]
- Zhang, Y.; Song, S. Beneficiation of fluorite by flotation in a new chemical scheme. Miner. Eng. 2003, 16, 597–600. [Google Scholar] [CrossRef]
- Zhu, H.; Qin, W.; Chen, C.; Chai, L.; Jiao, F.; Jia, W. Flotation separation of fluorite from calcite using polyaspartate as depressant. Miner. Eng. 2018, 120, 80–86. [Google Scholar] [CrossRef]
- Zhang, C.; Sun, W.; Hu, Y.; Tang, H.; Yin, Z.; Guan, Q.; Gao, J. Investigation of two-stage depressing by using hydrophilic polymer to improve the process of fluorite flotation. J. Clean. Prod. 2018, 193, 228–235. [Google Scholar] [CrossRef]
- Jafari, M.; Chelgani, S.C.; Pourghahramani, P.; Ebadi, H. Measurement of collector concentrations to make an efficient mixture for flotation of a low grade apatite. Measurement 2018, 121, 19–25. [Google Scholar] [CrossRef]
- Vadlakonda, B.; & Mangadoddy, N. Hydrodynamic study of three-phase flow in column flotation using electrical resistance tomography coupled with pressure transducers. Sep. Purif. Technol. 2018, 203, 274–288. [Google Scholar] [CrossRef]
- Asadi, M.; Mohammadi, M.T.; Moosakazemi, F.; Esmaeili, M.J.; Zakeri, M. Development of an environmentally friendly flowsheet to produce acid grade fluorite concentrate. J. Clean. Prod. 2018, 186, 782–798. [Google Scholar] [CrossRef]
- Fisher, R.A. Statistical Methods for Research Workers, 5th ed.; Oliver and Boyd Ltd.: Edinburgh, Great Britain, 1925; pp. 80–317. [Google Scholar]
- Kazemian, M.E.; Ebrahimi-Nejadc, S.; Jaafariana, M. Experimental Investigation of Energy Consumption and Performance of Reverse Osmosis Desalination using Design of Experiments Method. Desalination 2018, 7, 9. [Google Scholar]
- Sun, N.; Wu, Y.; Chen, H.; Fang, Y. An energy-optimal solution for transportation control of cranes with double pendulum dynamics: Design and experiments. Mech. Syst. Signal Process. 2018, 102, 87–101. [Google Scholar] [CrossRef]
- Nguyen, A.T.; Sentouh, C.; Popieul, J.C. Fuzzy steering control for autonomous vehicles under actuator saturation: Design and experiments. J. Frankl. Inst. 2018, 355, 9374–9395. [Google Scholar] [CrossRef]
- Didaskalou, C.; Kupai, J.; Cseri, L.; Barabas, J.; Vass, E.; Holtzl, T.; Szekely, G. Membrane-grafted asymmetric organocatalyst for an integrated synthesis–separation platform. ACS Catal. 2018, 8, 7430–7438. [Google Scholar] [CrossRef]
- Yu, C.; Guo, X.; Shen, M.; Shen, B.; Muzzio, M.; Yin, Z.; Sun, S. Maximizing the Catalytic Activity of Nanoparticles through Monolayer Assembly on Nitrogen-Doped Graphene. Angew. Int. Ed. 2018, 57, 451–455. [Google Scholar] [CrossRef]
- Rajput, S.J.; Sathe, M.A. Application of Doe and Statistical Analysis for Development and Validation of Analytical Method for Chlrohexidine Gluconate and Cetrimide in its Bulk and Pharmaceutical Dosage Forms. Int. J. Pharm. Sci. Res. 2018, 9, 2800–2806. [Google Scholar]
- Dahmane, N.; Ayad, A.; Bensaid, S. Eddy current evaluation of recovered conductive waste purity. Waste Manag. 2018, 77, 43–49. [Google Scholar] [CrossRef] [PubMed]
- Montgomery, D.C. Design and Analysis of Experiments, 9th ed.; John Wiley & Sons: Cary, NC, USA, 2017; pp. 141–147. [Google Scholar]
- Laskowski, J.S. Reagents. Dev. Miner. Process. 2001, 14, 111–179. [Google Scholar]
- Nikolaev, A. Flotation kinetic model with respect to particle heterogeneity and roughness. Int. J. Miner. Process. 2016, 155, 74–82. [Google Scholar] [CrossRef]
- Al-Thyabat, S. Empirical evaluation of the role of sodium silicate on the separation of silica from Jordanian siliceous phosphate. Sep. Purif. Technol. 2009, 67, 289–294. [Google Scholar] [CrossRef]
- Sarquís, P.E.; Menéndez-Aguado, J.M.; Mahamud, M.M.; Dzioba, R. Tannins: The organic depressants alternative in selective flotation of sulfides. J. Clean. Prod. 2014, 84, 723–726. [Google Scholar] [CrossRef]


© 2019 by the authors. Licensee MDPI, Basel, Switzerland. This article is an open access article distributed under the terms and conditions of the Creative Commons Attribution (CC BY) license (http://creativecommons.org/licenses/by/4.0/).