Article

Cloud-Fog Architecture Based Energy Management and Decision-Making for Next-Generation Distribution Network with Prosumers and Internet of Things Devices

1
School of Electrical Engineering and Automation, Wuhan University, Wuhan 430047, China
2
School of Electrical Engineering, Xinjiang University, Urumqi 830046, China
3
Sovectron, 31000 Toulouse, France
4
Department of Energy Technology, Aalborg University, 9220 Aalborg, Denmark
*
Authors to whom correspondence should be addressed.
Appl. Sci. 2019, 9(3), 372; https://doi.org/10.3390/app9030372
Submission received: 9 December 2018 / Revised: 18 January 2019 / Accepted: 21 January 2019 / Published: 22 January 2019
(This article belongs to the Section Energy Science and Technology)

Abstract

:

Featured Application

A state-of-the-art fog-cloud hierarchical energy management structure embedded with artificial intelligence can be applied in the next-generation distribution network with prosumers and large-scale Internet of Things devices. This work makes a contribution to the construction of a real-time optimal energy management and decision-making system of the distribution network.

Abstract

With the increasing penetration of Internet of Things devices and distributed energy resources in the next-generation distribution network, the efficient energy management for system operation are facing new challenges. One reason is that the large-scale resources cannot be all connected to the supervisory control and data acquisition system, which have limited storage and computation capabilities. In order to adapt to the new energy management requirements of next-generation distribution networks, a state-of-the-art energy management method called cloud-fog hierarchical architecture is proposed in this work. Based on this architecture, we established a utility and revenue model for various stakeholders, including normal customers, prosumers, and distribution system operators. Furthermore, by embedding an artificial intelligence module in the proposed architecture, energy management could be implemented automatically. In this work, neural network are used at fog computing layers to achieve regression prediction of energy usage behavior and power source output. Moreover, based on the maximizing utility objective function, the amount of energy consumption of customers and prosumers in the distribution network was optimized with a genetic algorithm at cloud layer. The proposed methods were tested with a set of normal customers and prosumers in a general distribution network, and the results, including the captured usage patterns of the customers and revenues of various stakeholders, verify the effectiveness of the proposed method. This work provides an effective reference for the development of real-time energy management systems for the next-generation distribution network.

1. Introduction

1.1. Motivation

With the rapid penetration of distributed energy resources (DERs) in the distribution network (DN), conventional electricity consumers who own these small-scale generation facilities become prosumers, that is, they not only consume energy from but also generate to the utility grid. Active prosumers, who allow for bi-directional flows of energy, are increasing, accordingly enabling more grid operation flexibility. This transition is driven not only by environmental awareness but also the desire of prosumers at the residential level to get benefit through efficient energy transactions with the grid [1].
Meanwhile, it is estimated that there will be 26 billion Internet of Things (IoT) devices connected by 2020 [2]. The IoT brings a new era where various end-devices and sensors are linked in a wired or wireless manner with the aid of modern communication and Internet technologies [3]. With the increasing number of IoT devices and the application of energy internet technology in almost all aspects of the power grid, the information and data exchange among different parties becomes more frequent, and increasingly controllable units participate in the energy operation and management process of the DN. This increased penetration of smart things and renewable energy resources (RESs) in the DN have paved the way for the next-generation distribution grid. Thus, the real-time energy management of these next-generation distribution grid is attracting increasing attention [4,5,6,7,8].

1.2. Related Work

There is a wide range of studies covering the issue of energy management for DN with microgrids (MGs) [9,10,11,12,13,14,15,16,17]. Most of the work is focused on economic scheduling for different entities.The operating cost of microgrids in the DN is minimized through effective energy management considering the real-time electricity price in [11]. In [14], energy management considering the demand response for a microgrid, is achieved for the economic operation of the microgrid, and also for peak shaving of the distribution grid. Multi-agent approaches and game theories have been widely applied to the decision-making and energy management of AC and DC MGs [15,16,17].
Artificial Intelligence (AI) based techniques are being developed and deployed worldwide in various areas. With regards to AI being applied to grid services, there are also several studies on solving the problem of decision-making optimization. The intelligent algorithms are used to obtain energy demand response and change the behavior of electricity consumption in [18]. In [19], an optimal power dispatch on a 24h basis for distribution systems, including large-scale controllable loads, is presented with a swarm particles optimization algorithm. The genetic algorithm (GA), as a heuristic algorithm, does not depend on the specific domain of the problem and is robust enough to be used in complex and difficult optimization problems in power systems [20,21,22]. Most of the previous work have focused on formulating the optimization problem to achieve economic efficiency in a conventional centralized way, without considering how the architecture of this energy management might improve operational preformation with emerging information and communications technology.
On the other hand, the application of IoT devices and smart meters in distribution grids generates a large amount of data, and the expansion of IoT and knowledge discovery will drive changes in current MG planning [23]. Moreover, the sources of this data are different, the format is diversified, and the processing of cloud-intensive data alone, might risk overloading the cloud computation capability. Fog computing is therefore proposed to addressing the massive amounts of data from these devices [24,25]. A three-layer energy management architecture based on the IoT and fog computing is proposed in [26]. The first layer is for users to communicate and interconnect with the system through the networked gateway and smart meter. The second layer realizes the operations of the user and retail market. Moreover, the third layer is for the calculating the stability of the system and data storage. In [27], an IoT-based smart home energy management system was designed and implemented in reality. Also, with regards to laboratory practice, there are a few pioneering cases. For example, Aalborg University set up an IoT-Oriented microgrid living lab, where major smart devices and a DC/AC microgrid can interconnect and communicate [28].
From the previous work, the combination of scheduling prosumers’ generation and larger-scale IoT devices in DN opens new doors for the operation of the next-generation DN. Additionally, the development of AI technologies is also contributing to energy management of grids. Previous works have rarely included a layered interaction to solve the energy management problems related to the next-generation distribution network. This paper will address the need for efficient decision-making and real-time management of DN by establishing models based on a novel architecture incorporating and harnessing these aspects.

1.3. Contribution

This work aims to address the challenge of energy management and decision-making under the high penetration of distributed RES and the application of large scale IoT devices in next-generation DN. Firstly, a fog-cloud hierarchical architecture is proposed for energy management and decision-making. With the generated large-scale data in DN, AI technologies deployed separately in fog and cloud layers can capture the usage of customers and the RES output. Moreover, various stakeholders in the distribution system, including common customers, prosumers, and distribution system operator (DSO) are modeled, and the user’s electricity consumption behavior is captured with the concept of microeconomics. Finally, the validity of the proposed method is demonstrated through retail electricity price optimization and real-time revenue management of various stakeholders in the DN. The rest of the paper is organized as follows. Section 2 proposes the cloud-fog hierarchical architecture for the energy management of a DN, where the underlying structure, and the function of fog/cloud layers are introduced. The model for normal customers, prosumers and distribution system operators (DSOs) is established in Section 3. The verification conducted is implemented in Section 4, where AI technologies are embedded into the fog and cloud layers to implement the energy management and decision-making processes. At the fog layer, the aims mainly include the prediction of the user’s electricity usage behavior and RES output; at the cloud layer, optimization of the calculation for a given target takes place. In addition, a utility and revenue model for normal users, prosumers, and DSO in a regional DN is established to achieve maximum goal optimization with full social welfare simulation.

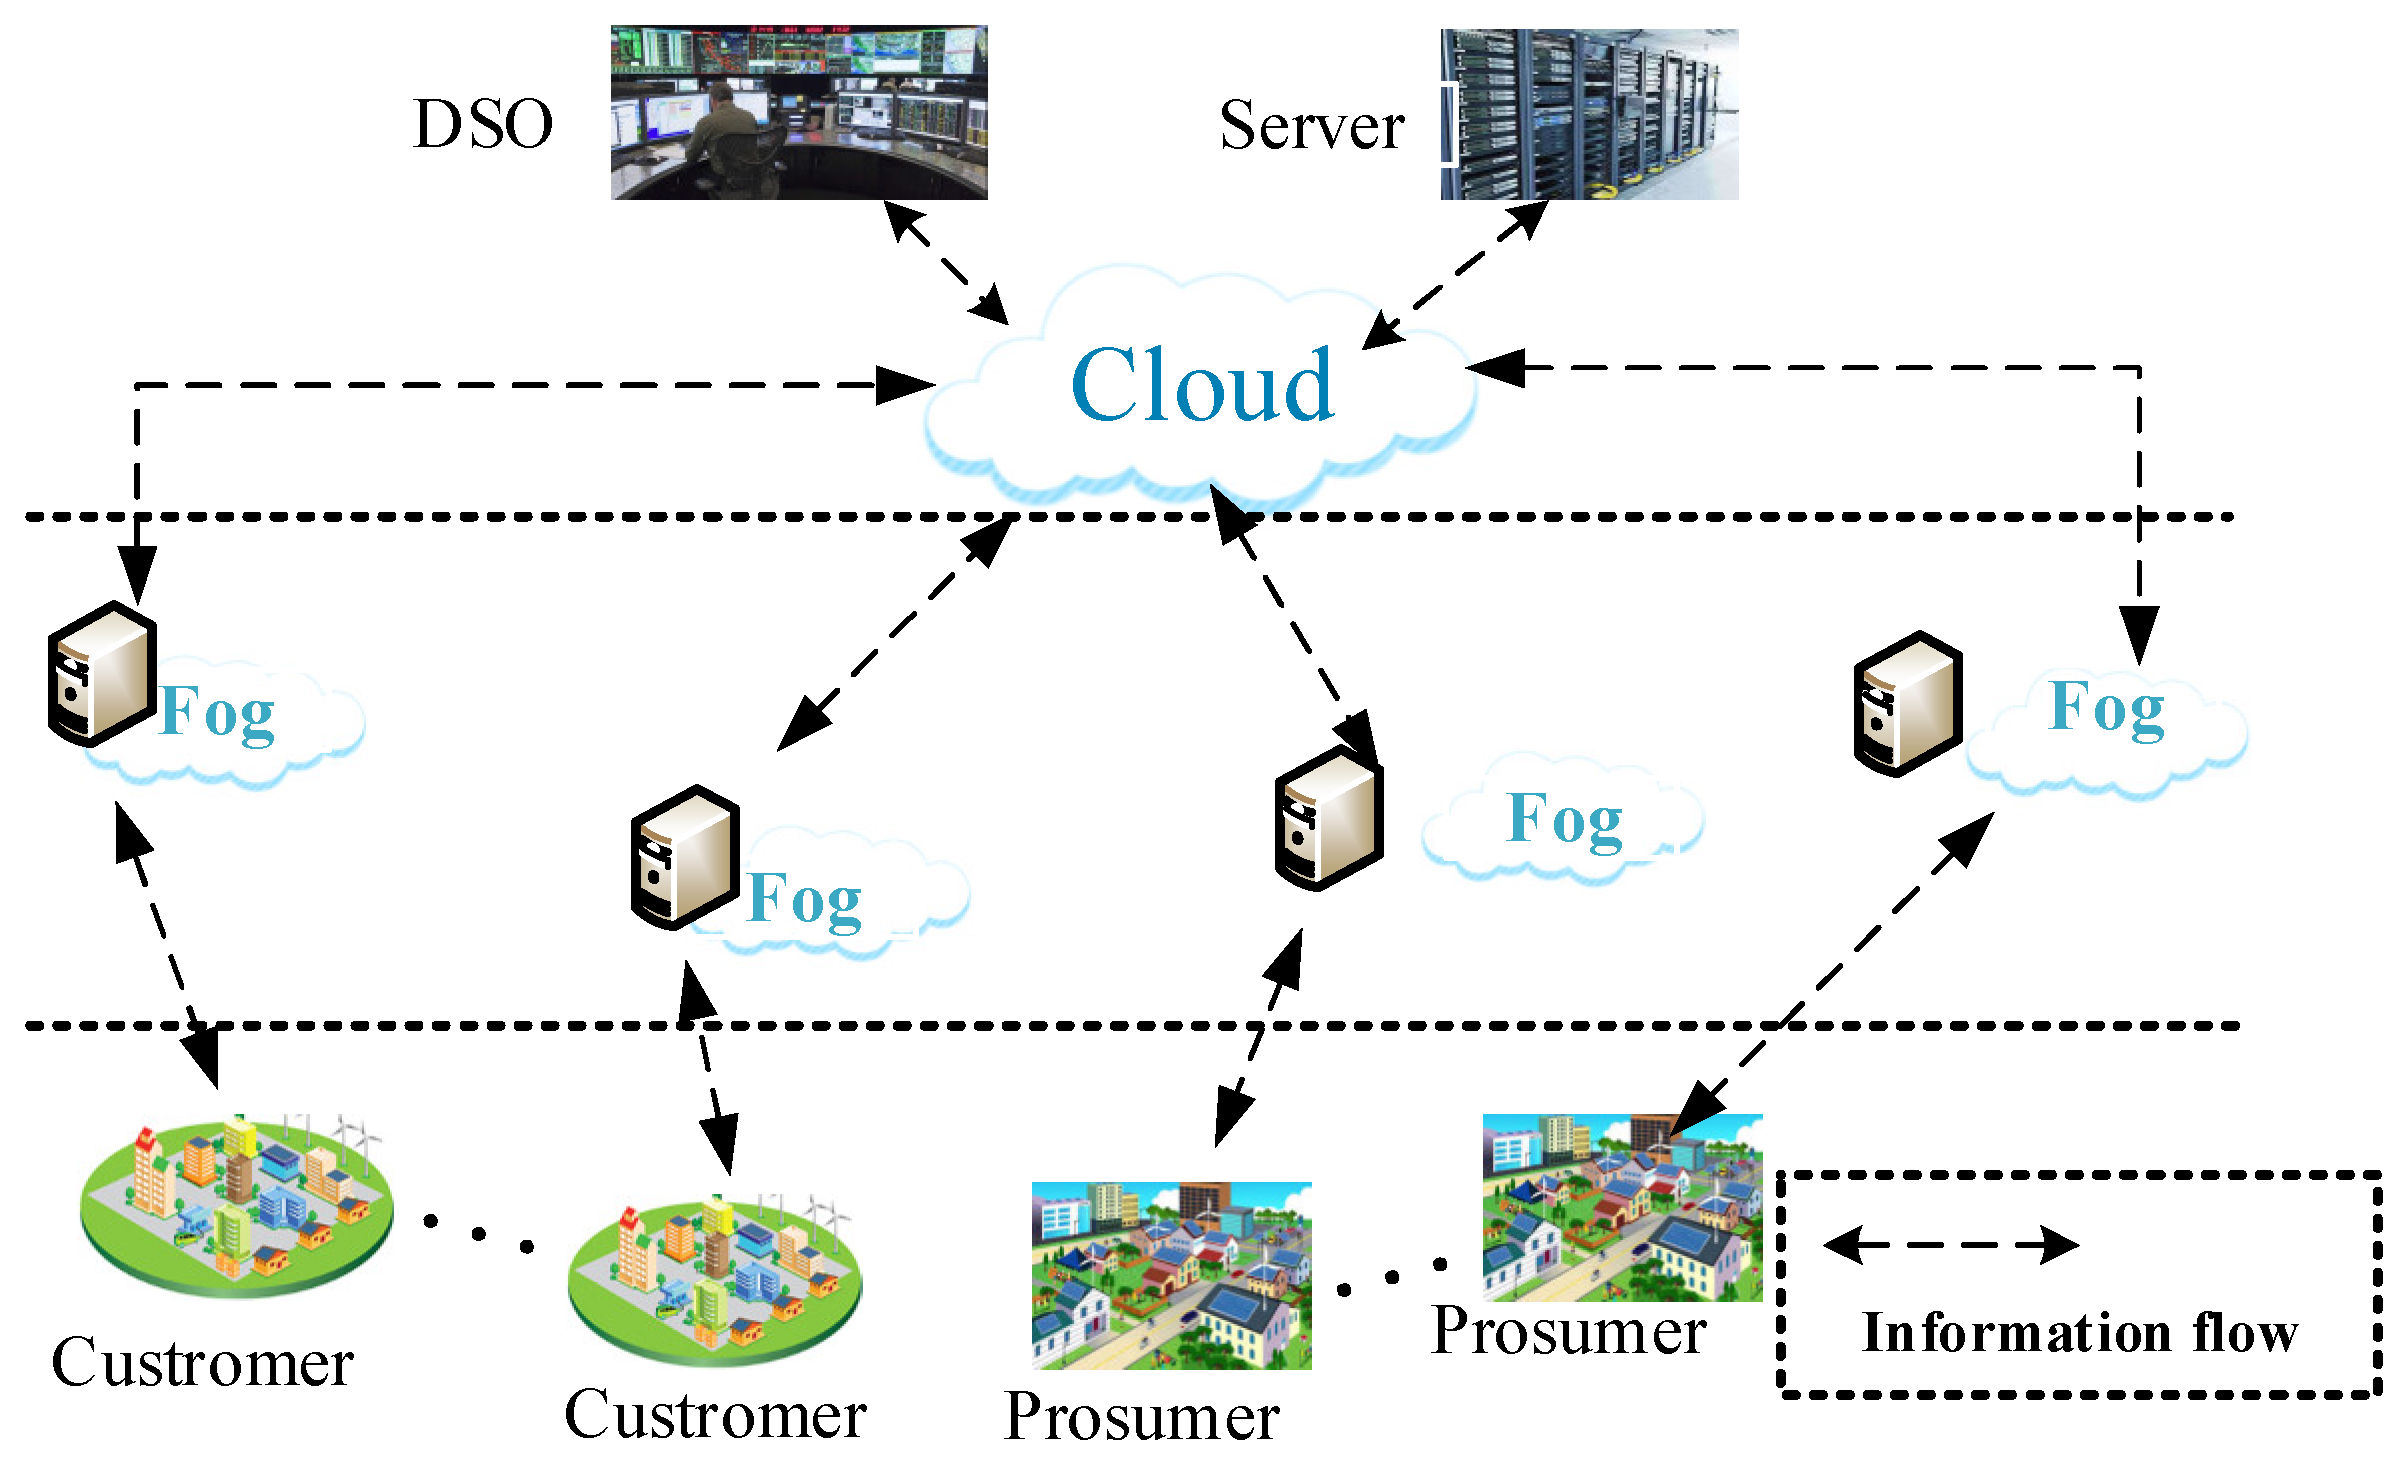
2. Cloud-Fog Hierarchical Architecture for Energy Management

This section mainly introduces the proposed cloud-fog hierarchical architecture shown in Figure 1. The fog computing layers are responsible for clustering analysis and regression prediction by mining the underlying data from the basic customers and prosumers units in the DN. The cloud computing layer is used to achieve the overall objective optimization.
In this architecture, customers and prosumers are pending at the terminal of the DN, the hierarchical fog and cloud layers work cooperatively in the energy management process. The specific deployment and functions are described in the following subsection.

2.1. Terminal Units

In the next-generation DN, the terminal units include various IoT devices and DER (such as photovoltaic (PV), wind turbine (WT), storage, etc.), which could be installed by customers or prosumers. Figure 2 shows the connection and communication structure in the DN, where the database system is used to store the data from the smart meter and the IoT devices, and the fog layers connected with the database systems can perform the specific computing function to prepare input for upper layer services. The communication between the local area network gateway and the device can be realized through wired or wireless modes such as IEEE 802.11 (WLAN), IEEE 802.15 (WPAN), IEEE802.15.4 (Zigbee), etc. In addition, the gateway can collect the information from both the IoT devices and the utilities (such as DSO, market, etc.), Then, the specified behaviors (such as load management, demand response, etc.) can be operated by using the Open ADR communication protocol between the terminal units and DN [3,29].

2.2. Fog Layers Operation

The responsibility of fog computing is to process requests from users and DN operators, which can be implemented by deploying CPUs and databases at specified nodes of the DN. Fog computing can help to reduce cloud data processing pressure and reduce latency by storage and management of the terminal information. As shown in Figure 2, the fog computing nodes can communicate with the gateway and smart meter of the underlying user.
Furthermore, AI modules deployed at the fog layers can capture the electricity consumption behavior of customers under various conditions. As a kind of AI tool, artificial neural networks (NN) have performed well in pattern recognition and machine learning as the amount of data increase. Artificial NNs, shown in Figure 3, can be used for the regression analysis through learning and training for the sample data [30]. There are input layers, the hidden layer and regression layer, in a general artificial neural NN. Taking the regression analysis of a user’s electricity usage as an example, the input data (i.e., date attribute, electricity price attribute, weather data, etc.), are factors that may affect consumption behavior, and the output is the amount of energy consumption. The consumption behavior of customers and prosumers can then be predicted based on the regression analysis of NN. In this way, the fog computing layers can provide adequate load management information for distribution system operators. Moreover, the output from RES for prosumers can also be used for the regression analysis with NN learning and training at the fog layers, where the input data information includes geographic information, weather data (e.g., wind speed, illumination, etc.), distributed power type, etc.

2.3. Cloud Layer Operation

Based on the information collected from fog layers, the cloud layer is responsible for energy management of the entire DN and decision making, which includes the optimal scheduling, stability calculation and participation in market transactions. Communication with fog and command information can be performed through a wide area network, e.g., the Internet. The AI algorithm deployed in the cloud will help to make the optimal decision.
This paper solves the global optimization problem established by the cloud by using the GA, which can solve large-scale discrete and nonlinear problems with good robustness. GA simulates the mutation, exchange, and natural selection of biological reproduction (the survival of the fittest), coding the possible solutions of the problem into a vector, with each element of the vector called a gene, and uses the objective function to evaluate each in the group. According to the degree of fitness, individuals are selected, exchanged, mutated and other GA operations are used to obtain new generations, as shown in Figure 4.

3. Modeling of Various Stakeholders in the Distribution Network (DN)

3.1. Utility Model of Customers

The electricity usage habits and preferences of customers are generally independent of each other. It is possible to capture the electricity habits of each user with the aid of IoT, smart meters and big data technologies. The electricity behaviors of customers can be analyzed by collecting data such as temperature, electricity price, electricity time, power, etc. This paper uses the functional concept of microeconomics to build a utility model of residential customers. The user’s power line is modeled by selecting different utility functions U ( x i t , ω i t ) . For each customer, the function represents the user’s utility satisfaction. In this paper, we reference [31] to define the U ( x i t , ω i t ) as a quadratic function with decreasing marginal utility:
U ( x i t , ω i t ) = { ω i t x i t α 0 2 ( x i t ) 2 i f    0 x i t ω i t α 0 ( ω i t ) 2 2 α 0 i f        x i t ω i t α 0
where x i t represents the customer’s energy consumption quantity at time slot t, and parameter ω i t characterizes the user’s electricity consumption behavior at time slot t, the parameter α 0 which was set in advance, represents the uniform conditions.
Figure 5 shows the utility changes for various customers as energy consumption changes, and it shows that the marginal utilities of all satisfaction levels are decreasing at the different degrees. The marginal utility ω = 0.5 is taken as an example to illustrate the diminishing effect.
To sum up, the total revenue of the customer contains two parts; the utility that the customer obtains and the cost of purchasing electricity. Therefore, the comprehensive utility of customer i in time interval t can be written as:
R c u m s t o m e r s , i = t T [ U ( x i t , ω i ) P r e t a i l e r t x i t ]
where P r e t a i l e r t is the real-time retail price for purchasing electricity of customers, and x i t is the quantity of energy consumption of customer i at time slot t.

3.2. Prosumers Model

In this work, prosumers are considered as grid-connected and allow for a two-way power flow, i.e., prosumers can optimize power flow through their own energy management system based on internal conditions and external signals (such as price, demand response, etc.). Generally, the tariff price of RES to the grid is relatively fixed, but the purchase price is based on the retail price of the entire DN, such as real-time electricity price and time of use (TOU) price.
The economic model for prosumers is established based on the cost of each part and the income from tariffs of RES to the grid. The sub-models are as follows:
1) Storage Cost
EMS is responsible for setting the operation strategy of storage. Based on the concept of life cycle management, the cost of batteries can be converted into daily investment costs and average maintenance costs [32]:
C S j = 24 α 1 C c a p T a + β 1
where C c a p is the capital cost of the storage system (i.e., cost of the battery and converter), α 1 is capital recovery factor of storage, β 1 is average maintenance cost. T a is lifetime of battery.
2) RES Cost
The RESs of prosumers mainly include PVs and WTs. The cost model can be established based on the value of PES power to the grid r j k . The cost includes two parts: one is the loss cost of energy from the perspective of the life cycle, which is similar to the storage cost; the other is the maintenance cost. RES cost can thus be expressed as:
C R j = t T [ α 2 ( r j t ) 2 + β 2 r j t ]
where r j t is feed-in power of RES to the grid, α 2 is constant coefficient of RES cost, and β 2 represents average maintenance cost of RES.
3) Utility of Consumption
The consumption of prosumers is the same as normal customers, and this model can thus be written as the utility model mentioned in Section 3.1:
L j = t T [ U ( x j t , ω j ) P r e t a i l e r t x j t ]
where P r e t a i l e r t is the real-time retail price for purchasing electricity of prosumers, and x j t is the quantity of energy consumption of prosumer j at time slot t.
4) Income from Tariffs from RES to the Grid
It is assumed that the local tariffs of RES to the grid is a fixed value, the income can thus be calculated as:
H renewable , j = t T [ P t a r i f f × E r e n e w a b l e , j t ]
where P t a r i f f is the local tariff of RES to the gird, E r e n e w a b l e , j t represents the energy amount of RES to the grid at time slot t, which is subject to the total energy of the prosumer. i.e., E r e n e w a b l e , j t should be less than the sum of the energy at interval t − 1 and the RES output at interval t:
0 E r e n e w a b l e , j t B i n i t i a l + r j t + t = 1 T ( r j t 1 E r e n e w a b l e , j t 1 )
where B i n i t i a l is the initial energy in the storage, r j t is the output power of RES at interval t.
To sum up, the revenue of the prosumer at interval t is the sum of the above:
R prosumer , i = H r e n e w a b l e , j + L j C S j C R j

3.3. Distribution System Operator (DSO) Model

DSO is responsible for purchasing electricity from the wholesale market and prosumers, and then providing it to customers at retail prices. The economic model is as follows:
1) Energy Purchase Cost
The DSO has the responsibility of supplying electrical energy to customers by purchasing energy from both the wholesale market and the prosumer. Based on the laws of economics and the type of customer, the price from the wholesale market depends on the quantity and time. The cost of purchasing from wholesale market is expressed as (9), the DSO purchase energy from prosumers as a fixed price (such as local tariff price), and the cost is expressed as (10):
C wholesale = P wholesale × E wholesale
C renewable = P tariff × t T E r e n e w a b l e t
where P wholesale is the purchasing price from the wholesale market. The amount of electricity purchased from the wholesale market E wholesale should satisfy the total demand of customers in the DN:
E w h o l e s a l e = i = 1 N ( x i t + x j t ) - j = 1 J E r e n e w a b l e , j t
where t T E r e n e w a b l e t should be less than the total power of prosumer at time interval t:
t T E r e n e w a b l e t t T j K E r e n e w a b l e , j t
2) Carbon Income
The Kyoto Protocol stipulates that greenhouse gas emission reductions can be traded as intangible commodities [33]. The relationship between carbon emission gains and renewable energy generation over a period can be expressed as:
H c = a t T E r e n e w a b l e t 2 + b t T E r e n e w a b l e t
The derivation process of this model is described in Appendix A.
3) Retail Electricity Income
The DSO sell the electricity to the customer at the retail price, the income is:
R retail = i = 1 N j = 1 K t T P r e t a i l t ( x i t + x j t )
To sum up, the total revenues of the DSO can be expressed as:
R D S O = H c C r e n e w a b l e + R retail C w h o l e s a l e

3.4. Objective Function at the Cloud Layer

We assume there are N-normal customers, K-prosumers, and one DSO in the DN. The utility maximization of the normal customers and prosumers are chosen as the objective function at the cloud layer, which is expressed as a quadratic function:
M a x i m i z e i N [ U ( x i t , ω i ) P r e t a i l t x i t ] + t K [ U ( x j t , ω j ) P r e t a i l t x i t ) ]
where the optimized variable is the total amount of consumption of customers and prosumers at each time slot based on the retail price announced by the DSO. The retail price P r e t a i l t is cited from [31]. The utility parameters ω i and ω j can be captured through the NN at the fog layer. The cloud layer function can be considered flexibly, and below is an example of the maximization utility of prosumers and customers. The models for other stakeholders are not used in the optimization but are used for the real-time revenue calculation after the optimal is found.

4. Implementation and Results

In this test, 55 prosumers (each one is equipped with 20KW RES) and 503 normal customers are distributed in a general DN, where the proposed cloud-fog architecture is deployed to implement energy management and decision-making optimization. The location and number of fog nodes are deployed according to the amount of generated data and the location of prosumers and customers. The prosumers are normally connected to a bus of the underlying DN by the point of common coupling (PCC) in the distribution grid. Among prosumers, the generators mainly include WTs and PVs. The storage refers to the Tesla Powerwall, the capital cost of storage is 5500 $ , and the lifetime is 15 years [34].
As the flow of energy management, the regression and forecasting of RES and loads in prosumers and customers are first implemented at the fog layers, the real-time consumption characteristics ω can be calculated. Furthermore, the retail price of the DN and the total purchase energy quantity from the wholesale market can be optimized at the cloud layer.

4.1. Fog Computing Operation

At fog layers, multi-layer feed-forward NN based on the Levenberg-Marquardt algorithm are used to supervise and learn all customers’ electricity consumption, and ultimately to make the prediction with regression analysis. The dataset of this test refers to the load data of German BlOND buildings [35]. The NN settings are as follows: 1) the input data include time, time type, temperature, humidity, illumination; 2) the output date is the prediction value of the customers’ continuous load; 3) the training set is 70% of the input data, the validation set is 15% of the input data t and the test set is 15% of the data; 4) this NN consists of one hidden layer with 10 neurons; 5) NN training will stop when the generalization ability of the network is not improved. The regression effects are shown as follows.
As above in Figure 6, the error of root mean square begins to meet the requirements at 34 generations through NN training, and it stops learning after 40 iterations.
It is generally believed that the regression effect is good if the value is greater than 0.9. The R-value shown as Figure 7 is more than 0.92, thus it is considered that the regression effect is good after training. The normalized utility feature is shown as Figure 8.
Furthermore, the NN embedded in the fog computing layers can also be used to predict the output power of RES in prosumers. The process is similar to the load prediction through regression analysis. Although we do not predict the output power of RES with NN here. In this test, the daily storage operation for arbitrage and prediction of the RES of prosumers are out of our scope as the prediction of the RES with NN is another research topic. To simplify the test, the data of feed-in RES to the grid from Open Energy Information (OpenEI) [36] are referred to directly, and this is shown in Table A1 of Appendix B.

4.2. Cloud Computing Operation

Based on the data collected from fog layers, the objective of maximization of total social welfare mentioned in Section 4.1 is implemented at the cloud computing layer. The detailed parameters of various stakeholders are listed in Table 1.
When real-time optimization is performed at the cloud layer, the ω at each time slot is taken as ϖ (average value) in Figure 8. The intelligent GA tool is used to optimize the decision-making objectives globally at cloud layer. The parameters of GA are selected as follows: population size is chosen as 40, maximum genetic algebra 30, mutation rate 0.05, and cross-inheritance is 0.6. Before calculating the whole time (1–24 h), we take the input data of 13 h to verify the validity of the algorithm. The convergence trajectory of the GA algorithm is shown in Figure 9.
It can be seen that the results begin to converge in the 23rd generation. The result of real-time purchasing load is shown in Figure 10.
The real-time retail price of DN used to calculate the real-time revenues of stakeholders is shown in Figure 11.
After the implementation at the fog/cloud layers, the DSO can create a purchasing strategy from the wholesale market. The wholesale market price is set as 0.353 cents/kWh. Finally, the cost and revenue of each stakeholder in a day (24 h) are listed in Table 2
The above results show that different operational information in the DN can be organized and managed real-time under the proposed energy management architecture. The system provides an automated energy management and hour-by-hour decision-making process for the next-generation DN.

5. Conclusions

Due to the continuous penetration of DERs and IoT devices in DN, the amount of data generated by the system is increasing. With the development of the energy internet, big data technology and power market reform, this paper proposes the concept of cloud-fog hierarchical energy management architecture for DN energy management and decision-making. Detailed models for common customers, prosumers and DSO are discussed in this work. Furthermore, NN technology can capture the RES output and usage behavior in the fog layer, and the GA is used to solve decision-making issues in the DN. This work provides a reference for the development of a real-time energy management system for DN. In addition, with the reform of the electricity market deepening, new stakeholders such as power-selling companies, operators of virtual power plants etc. will play a greater role in the next-generation DN, which will enrich the demand-side model. Meanwhile, the advances in AI technology will drive grid management to be smarter and more efficient. Therefore, optimal decision-making and intelligent energy management with diversified stakeholders and advanced AI in next-generation DN are our future research direction.

Author Contributions

Conceptualization, J.Y.; Formal analysis, Z.H.; Funding acquisition, X.Z.; Investigation, J.Y.; Methodology, C.L.; Project administration, Z.H.; Software, J.Y.; Supervision, Z.H. and J.M.G.; Validation, R.H.; Writing – original draft, J.Y.; Writing – review & editing, Z.H., R.H., J.D. and C.L.

Funding

This research was funded by National Natural Science Foundation of China (51667018).

Conflicts of Interest

The authors declare no conflict of interest.

Nomenclature

x i t x j t Energy consumption quantity of customer i at time slot t
Energy consumption quantity of prosumer j at time slot t
ω i t Utility parameter characterizing the electricity consumption of customer i at time slot t
R c u s t o m e r s , i Revenue of customer i in distribution network
P r e t a i l e r t Real-time retail price for purchasing electricity in distribution network (DN) at time slot t
α 1 , β 1 C S j t Cost coefficients of storage of the prosumers
Cost of storage in prosumer j
S j t Charge/discharge capacity of the energy storage system of the prosumer j at time slot t
α 2 , β 2 Cost coefficients of renewable energy resource (RES) of the prosumers
r j t Feed-in power of RES of prosumer j to grid at time slot t
C R j Cost of RES in prosumer i
L j Utility of consumption of prosumer j
H renewable , j Income from tariff-in RES to grid
E r e n e w a b l e , j t Energy amount of RES to grid at time slot t
P t a r i f f Local tariff of RES to gird
B i n i t i a l Initial energy in the storage of the prosumer
R prosumer ,   i Revenue of MG i in wholesale market
C wholesale Purchasing cost from wholesale market
C renewable a, bPurchasing cost from RES of the prosumers
Coefficients of the carbon income
H c Carbon trading income of distribution system operator (DSO)
R D S O Total revenue of DSO

Appendix A

In the carbon emission market, the profit obtained by reducing carbon emission M is formulated as (A1). According to general economic principles, price and emission are negatively correlated linearly, i.e. expressed as formula (A2), which means the carbon emission of unit M can be reduced by purchasing renewable energy from unit E. 1kWh electricity is equivalent to about 0.78 kg of carbon emission in China, thus, the link between renewable energy generation and carbon emissions is formulated as (A3). Therefore, the relationship between carbon emission benefits and renewable energy generation in a certain period can be expressed as (A4).
R ( M ) = P c M
P c = - a M + b
M = σ * E r e n e w a b l e t
H c = a t T E r e n e w a b l e t 2 + b t T E r e n e w a b l e t
where P c is the price of carbon emission market, M is the carbon emission, D expresses the relationship coefficient between the purchase of renewable energy and the reduction of carbon emissions. Moreover, the coefficients a and b between carbon emissions and prices are set by the principle of carbon market commodity trading. From the above formula, we can see that the relationship between carbon income and new energy purchased is a quadratic function.

Appendix B

Table A1. Load and renewable generators (kW). WT: wind turbine, PV: photovoltaic.
TimeWTPV
00–01168.20.0
01–02138.80.0
02–03145.40.0
03–04127.60.0
04–05175.40.0
05–06121.4167.4
06–0798.0529.7
07–08155.4635.6
08–09138.1649.6
09–10126.3703.2
10–11100.4834.7
11–12133.6720.9
12–13109.4594.5
13–14117.1754.5
14–15133.3842.9
15–16142.4723.6
16–17162.7603.9
17–18146.1427.1
18–19138.2217.9
19–20135.7204.3
20–21157.88.5
21–2293.30.0
22–23148.10.0
23–24115.60.0

References

  1. Meng, L.; Sanseverino, E.R.; Luna, A.; Dragicevic, T.; Vasquez, J.C.; Guerrero, J.M. Microgrid supervisory controllers and energy management systems: A literature review. Renew. Sustain. Energy Rev. 2016, 60, 1263–1273. [Google Scholar] [CrossRef]
  2. Lee, I.; Lee, K. The Internet of Things (IoT): Applications, investments, and challenges for enterprises. Bus. Horiz. 2015, 58, 431–440. [Google Scholar] [CrossRef]
  3. Jalali, F.; Vishwanath, A.; de Hoog, J.; Suits, F. Interconnecting Fog computing and microgrids for greening IoT. In Proceedings of the 2016 IEEE Innovative Smart Grid Technologies—Asia (ISGT-Asia), Melbourne, VIC, Australia, 28 November–1 December 2016; pp. 693–698. [Google Scholar]
  4. Chiu, T.C.; Shih, Y.Y.; Pang, A.C.; Pai, C.W. Optimized Day-Ahead Pricing with Renewable Energy Demand-Side Management for Smart Grids. IEEE Internet Things J. 2017, 4, 374–383. [Google Scholar] [CrossRef]
  5. Reinders, A.; Übermasser, S.; van Sark, W.; Gercek, C.; Schram, W.; Obinna, U.; Lehfuss, F.; van Mierlo, B.; Robledo, C.; van Wijk, A. An Exploration of the Three-Layer Model Including Stakeholders, Markets and Technologies for Assessments of Residential Smart Grids. Appl. Sci. 2018, 8, 2363. [Google Scholar] [CrossRef]
  6. Lu, T.; Wang, Z.; Ai, Q.; Lee, W. Interactive Model for Energy Management of Clustered Microgrids. IEEE Trans. Ind. Appl. 2017, 53, 1739–1750. [Google Scholar] [CrossRef]
  7. Zafar, R.; Mahmood, A.; Razzaq, S.; Ali, W.; Naeem, U.; Shehzad, K. Prosumer based energy management and sharing in smart grid. Renew. Sustain. Energy Rev. 2018, 82, 1675–1684. [Google Scholar] [CrossRef]
  8. Ejaz, W.; Naeem, M.; Shahid, A.; Anpalagan, A.; Jo, M. Efficient Energy Management for the Internet of Things in Smart Cities. IEEE Commun. Mag. 2017, 55, 84–91. [Google Scholar] [CrossRef] [Green Version]
  9. Golshannavaz, S.; Afsharnia, S.; Aminifar, F. Smart Distribution Grid: Optimal Day-Ahead Scheduling with Reconfigurable Topology. IEEE Trans. Smart Grid 2014, 5, 2402–2411. [Google Scholar] [CrossRef]
  10. Liu, T.; Tan, X.; Sun, B.; Wu, Y.; Guan, X.; Tsang, D.H.K. Energy management of cooperative microgrids with P2P energy sharing in distribution networks. In Proceedings of the 2015 IEEE International Conference on Smart Grid Communications (SmartGridComm), Miami, FL, USA, 2–5 November 2015; pp. 410–415. [Google Scholar]
  11. Yue, J.; Hu, Z.; Li, C.; Vasquez, J.C.; Guerrero, J.M. Optimization scheduling in intelligent Energy Management System for the DC residential distribution system. In Proceedings of the 2017 IEEE 2nd Int. Conf. Direct Curr. Microgrids, ICDCM 2017, Nuremburg, Germany, 27–29 June 2017; pp. 558–563. [Google Scholar]
  12. Yin, C.; Wu, H.; Sechilariu, M.; Locment, F. Power Management Strategy for an Autonomous DC Microgrid. Appl. Sci. 2018, 8, 2202. [Google Scholar] [CrossRef]
  13. Li, C.; Bosio, F.; Chen, F.; Chaudhary, S.K.; Vasquez, J.; Guerrero, J. Economic Dispatch for Operating Cost Minimization Under Real Time Pricing in Droop Controlled Dc Microgrid. IEEE J. Emerg. Sel. Top. Power Electron. 2016, 5, 587–595. [Google Scholar] [CrossRef]
  14. Shen, J.; Jiang, C.; Liu, Y.; Qian, J. A Microgrid Energy Management System with Demand Response for Providing Grid Peak Shaving. Electr. Power Compon. Syst. 2016, 44, 843–852. [Google Scholar] [CrossRef]
  15. Karavas, C.-S.; Kyriakarakos, G.; Arvanitis, K.G.; Papadakis, G. A multi-agent decentralized energy management system based on distributed intelligence for the design and control of autonomous polygeneration microgrids. Energy Convers. Manag. 2015, 103, 166–179. [Google Scholar] [CrossRef]
  16. Karavas, C.-S.; Arvanitis, K.; Papadakis, G. A Game Theory Approach to Multi-Agent Decentralized Energy Management of Autonomous Polygeneration Microgrids. Energies 2017, 10, 1756. [Google Scholar] [CrossRef]
  17. Karavas, C.-S.; Arvanitis, K.G.; Kyriakarakos, G.; Piromalis, D.D.; Papadakis, G. A novel autonomous PV powered desalination system based on a DC microgrid concept incorporating short-term energy storage. Sol. Energy 2018, 159, 947–961. [Google Scholar] [CrossRef]
  18. Chen, C.-R.; Lan, M.-J.; Huang, C.-C.; Hong, Y.-Y.; Low, S.H. Demand Response Optimization for Smart Home Scheduling Using Genetic Algorithm. In Proceedings of the 2013 IEEE International Conference on Systems, Man, and Cybernetics, Manchester, UK, 13–16 October 2013; pp. 1461–1465. [Google Scholar]
  19. Graditi, G.; di Silvestre, M.L.; Gallea, R.; Sanseverino, E.R. Heuristic-based shiftable loads optimal management in smart micro-grids. IEEE Trans. Ind. Inform. 2015, 11, 271–280. [Google Scholar] [CrossRef]
  20. Wang, Y.; Zhang, K.; Zheng, C.; Chen, H. An Optimal Energy Management Method for the Multi-Energy System with Various Multi-Energy Applications. Appl. Sci. 2018, 8, 2273. [Google Scholar] [CrossRef]
  21. Marzband, M.; Parhizi, N.; Savaghebi, M.; Guerrero, J.M. Distributed Smart Decision-Making for a Multimicrogrid System Based on a Hierarchical Interactive Architecture. IEEE Trans. Energy Convers. 2016, 31, 637–648. [Google Scholar] [CrossRef]
  22. Wen, S.; Lan, H.; Fu, Q.; Yu, D.C.; Zhang, L. Economic Allocation for Energy Storage System Considering Wind Power Distribution. IEEE Trans. Power Syst. 2015, 30, 644–652. [Google Scholar] [CrossRef]
  23. Gamarra, C.; Guerrero, J.M.; Montero, E. A knowledge discovery in databases approach for industrial microgrid planning. Renew. Sustain. Energy Rev. 2016, 60, 615–630. [Google Scholar] [CrossRef] [Green Version]
  24. Chiang, M.; Zhang, T. Fog and IoT: An Overview of Research Opportunities. IEEE Internet Things J. 2016, 3, 854–864. [Google Scholar] [CrossRef]
  25. Negash, B.; Gia, T.N.; Anzanpour, A.; Azimi, I.; Jiang, M.; Westerlund, T.; Rahmani, A.M.; Liljeberg, P.; Tenhune, H. Leveraging fog computing for healthcare IoT. In Fog Computing in the Internet of Things; Springer: Cham, Switzerland, 2017; pp. 145–169. [Google Scholar]
  26. Moghaddam, M.H.Y.; Leon-Garcia, A. A Fog-Based Internet of Energy Architecture for Transactive Energy Management Systems. IEEE Internet Things J. 2018, 5, 1055–1069. [Google Scholar] [CrossRef]
  27. Lin, Y.-H. Design and Implementation of an IoT-Oriented Energy Management System Based on Non-Intrusive and Self-Organizing Neuro-Fuzzy Classification as an Electrical Energy Audit in Smart Homes. Appl. Sci. 2018, 8, 2337. [Google Scholar] [CrossRef]
  28. The IoT Microgrid Living Laboratory. Available online: https://www.et.aau.dk/department/laboratory-facilities/IoT+Microgrid+Living+Demonstration+Laboratory/ (accessed on 5 December 2018).
  29. Kim, J.; Byun, J.; Jeong, D.; Choi, M.-I.; Kang, B.; Park, S. An IoT-Based Home Energy Management System over Dynamic Home Area Networks. Int. J. Disturb. Sens. Netw. 2015, 2015. [Google Scholar] [CrossRef]
  30. Schmidhuber, J. Deep learning in neural networks: An overview. Neural Netw. 2015, 61, 85–117. [Google Scholar] [CrossRef] [PubMed] [Green Version]
  31. Samadi, P.; Mohsenian-Rad, A.-H.; Schober, R.; Wong, V.W.S.; Jatskevich, J. Optimal Real-Time Pricing Algorithm Based on Utility Maximization for Smart Grid. In Proceedings of the 2010 First IEEE International Conference on Smart Grid Communications, Gaithersburg, MD, USA, 4–6 October 2010; pp. 415–420. [Google Scholar]
  32. Li, N.; Chen, L.; Low, S.H. Optimal demand response based on utility maximization in power networks. In Proceedings of the 2011 IEEE Power and Energy Society General Meeting, Detroit, MI, USA, 24–29 July 2011; pp. 1–8. [Google Scholar]
  33. Almer, C.; Winkler, R. Analyzing the effectiveness of international environmental policies: The case of the Kyoto Protocol. J. Environ. Econ. Manag. 2017, 82, 125–151. [Google Scholar] [CrossRef]
  34. Powerwall | The Tesla Home Battery. Available online: https://www.tesla.com/powerwall (accessed on 31 December 2018).
  35. Kriechbaumer, T.; Jacobsen, H.A. BLOND, a building-level office environment dataset of typical electrical appliances. Sci. Data 2018, 5, 1–14. [Google Scholar] [CrossRef]
  36. Energy Information and Data | OpenEI.org. Available online: https://openei.org/wiki/Main_Page. (accessed on 6 December 2018).
Figure 1. Cloud-fog based energy management architecture. DSO: distribution system operator.
Applsci 09 00372 g001
Figure 2. Diagram of Internet of Things (IoT) devices connection and communication.
Applsci 09 00372 g002
Figure 3. Diagram of neural networks (NN) deployed at fog layers.
Applsci 09 00372 g003
Figure 4. Diagram of decision-making optimization with the genetic algorithm (GA).
Applsci 09 00372 g004
Figure 5. Utility function of consumers energy usage.
Applsci 09 00372 g005
Figure 6. NN learning generalization trajectory.
Applsci 09 00372 g006
Figure 7. Regression effect of training/test/validation (set) regression effect.
Applsci 09 00372 g007
Figure 8. Customers’ utility feature in one day.
Applsci 09 00372 g008
Figure 9. Optimization convergence trace of genetic algorithm (GA).
Applsci 09 00372 g009
Figure 10. The amount of electricity purchased over 24 h in the wholesale market.
Applsci 09 00372 g010
Figure 11. The electricity retail price for 24 h.
Applsci 09 00372 g011
Table 1. Parameters of various stakeholders in DN. DN: distribution network, DSO: distribution system operator.
Normal CustomersProsumersDSO
α 0 = 0.3
ω ( 0 , 1 ]
α 1 = 0.95 , β 1 = 0
α 2 = 1 , β 2 = 1.2
a = 0.78 , b = 1
P tariff = 25 C ent / kWh
Table 2. Analysis of revenue of entities in a day.
Cost of normal customers ($)Prosumers’ Average Revenue ($)
0.29 × 10515.9
DSO’s Revenue ($)Carbon income ($)
0.56 × 1041.749 × 103

