Article

An Experimental Investigation of Moisture-Induced Softening Mechanism of Marble Based on Quantitative Analysis of Acoustic Emission Waveforms

State Key Laboratory of Hydraulics and Mountain River Engineering, College of Water Resource & Hydropower, Sichuan University, Chengdu 610064, China
*
Author to whom correspondence should be addressed.
Appl. Sci. 2019, 9(3), 446; https://doi.org/10.3390/app9030446
Submission received: 14 December 2018 / Revised: 11 January 2019 / Accepted: 23 January 2019 / Published: 28 January 2019
(This article belongs to the Special Issue Application of Acoustic Emission (AE) on Rock Samples)

Abstract

:
The decrease of strength after saturation of rocks is known as moisture-induced softening. To date, there are numerous studies on the mechanism of moisture-induced softening of different rocks. However, due to a lack of effective observational methods, the microcosmic mechanism of moisture-induced softening still needs to be understood. We collected and processed acoustic emission (AE) signals during the uniaxial compression test of marble specimens. The results of spectral and statistical analysis show that two dominant frequency bands of AE waveforms exist regardless of the specimen’s water content. Additionally, for the AE signals from the saturated specimens, the ranges of the low and high frequency bands are wider than dried rock samples. Besides, since the tensile and shear failures in the rock release low and high dominant frequency AE signals, respectively, the test results of this paper show that micro-shear and micro-tensile failures dominate the final failure of dried and saturated rocks, respectively.

1. Introduction

In geotechnical engineering, moisture-induced softening of saturated rocks is an important issue that has been studied at length. To date, many researchers tried to study its mechanism through various experimental tests. Price [1] in 1960 compared the different compressive strength in saturated, air-dried and ‘completely’ dry sandstone specimens, and the result showed that sandstone’s strength decreased due to the water effect. After summing up the test results of 35 different categories of non-expansive clay sandstones, Hawkins and McConnell [2] argued that, for moisture-induced softening, the main factor is the content of quartz and clay minerals, and the secondary factor is the microstructure of rock. The influence of water content on strength and elastic modulus of rocks was investigated by Zhang et al. [3]. Through laboratory tests and data analyses, Jones et al. [4] deduced an empirical formula of rock’s permeability coefficient and effective stress. Rajabzadeh et al. [5] reported that the limestone obtained from Fars Province, southern Iran suffered from a 70% reduction in UCS (uniaxial compressive strength) due to saturation. Erguler and Ulusay [6] found out the water effect can result in the reduction of UCS in siltstone, mud stone, and marl. To igneous rocks, the reduction of UCS due to water effect can also be observed in diabase [7], tuffs [6,8,9] and granite [10,11,12]. Lau, Gorski and Jackson [12] investigated the effects of temperature and water saturation on Lac du Bonnet pink granite based on not only traditional mechanical properties, such as peak strength, Young’s modulus and Poisson’s ratio, but also the stress at the onset of stable crack growth and the stress at the onset of unstable crack growth. Hae-sik Jeong, Seong-seung Kang and Bo-An Jang [13] considered stress corrosion as a very important mechanism of crack growth thorough data analysis. Although the above examples of research were based on massive laboratory tests, the experimental data used were only macroscopical mechanical parameters such as uniaxial compressive strength and Young’s modulus. Therefore, a microcosmic mechanism to describe the rock’s moisture-induced softening is still required.
In recent years, acoustic emission (AE) technology has been introduced to the analysis of mechanical properties of rocks and rock-like materials under compression [14,15,16,17,18], impact load [19], seismic load [20] and four-point bending tests [21,22,23,24]. Many researchers studied micro-failure mechanism of rock by employing AE technology [17,18,21,22,23,24,25,26,27,28]. AE signal contains a series of parameters such as ib-value [18,21], AF(average frequency) and RA(Rise Time/Amplitude) [18,21,22,23,24], energy and RMS (Root Mean Square) [17], dominant frequency [29] and so on. In addition, among them, the domain frequency AF and RA have been proved to be associated with the mode of microscopic failure [22,23,24,29,30,31].
On account of the existing drawbacks of the moisture-induced softening research, this article focuses on investigating the mechanism of rock’s softening from both macroscopic and microscopic perspectives through newly introduced waveform-based AE analysis, which involves a statistical analysis of the double dominant frequency bands of AE waveforms. First, macroscopic failure patterns of dried and saturated rocks under compression are compared and analyzed. Subsequently, differences between the failure mechanisms of dried and saturated rocks will be investigated. The findings in this article will facilitate the understanding of the intrinsic failure mechanisms of rock’s moisture-induced softening.

2. Experimental Approach

2.1. Sample Preparation

The white marble samples we used in the experiment were taken from Baoxing in southwestern China. Eight cylindrical samples, referred to as DM1, DM2, DM3, DM4, SM1, SM2, SM3 and SM4 were prepared with the required dimensions of φ 50 × H100 mm. Before the test, DM1–DM4 were dried in the drying oven at the temperature of 105 °C for 48 h. On the contrary, SM1–SM4 were saturated in the vacuum air extractor for 8 h.

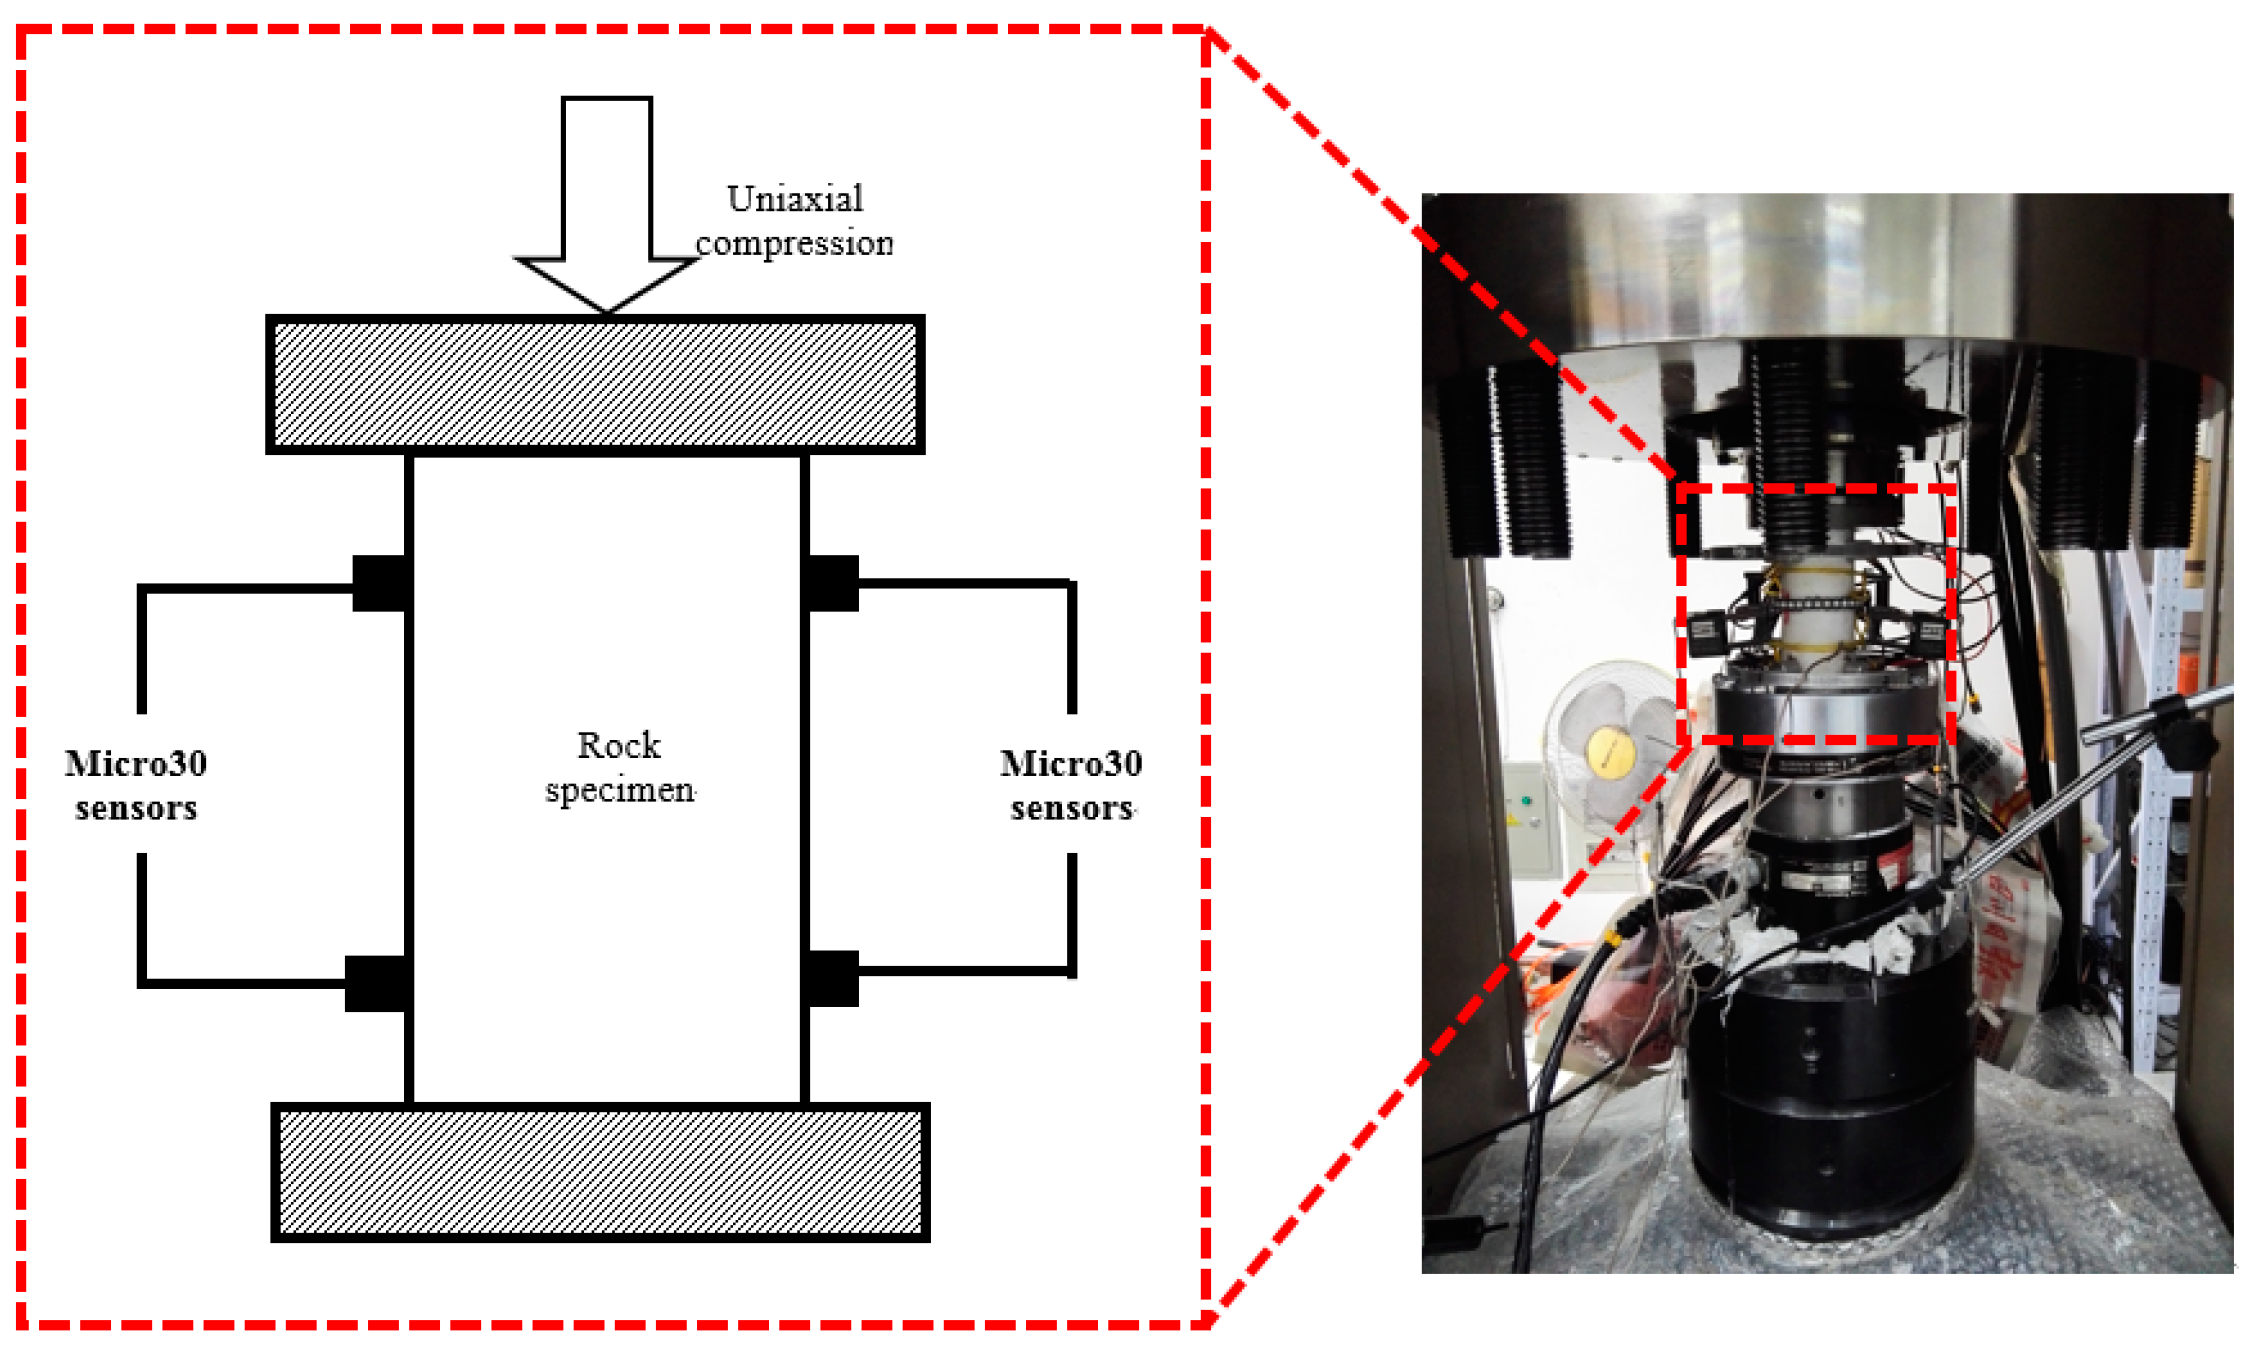
2.2. Experimental Setup and Equipment

The uniaxial compression tests employ a rock mechanics test system (MTS815, MTS, Eden Prairie, MN, USA). The axial displacement was measured with a linear variable differential transformer (LVDT), with a range of ±2.5 mm. A three-dimensional real-time monitoring system (PCI-2, PAC, Princeton, NJ, USA), was utilized to monitor and capture the AE waveforms automatically. For all of the samples, the loading rate was set at 20 kN/min. There are eight micro30 sensors installed symmetrically in the radical direction along the surface of the cylinder. The micro30 sensor has a good sensitivity to AE data. The pre-amplification is 40 dB, and the sampling frequency is 1 MHz. Between the sensors and the specimens, Vaseline was used as a coupling agent for enhancing the connections. The overall setup of uniaxial compression tests is shown in Figure 1.

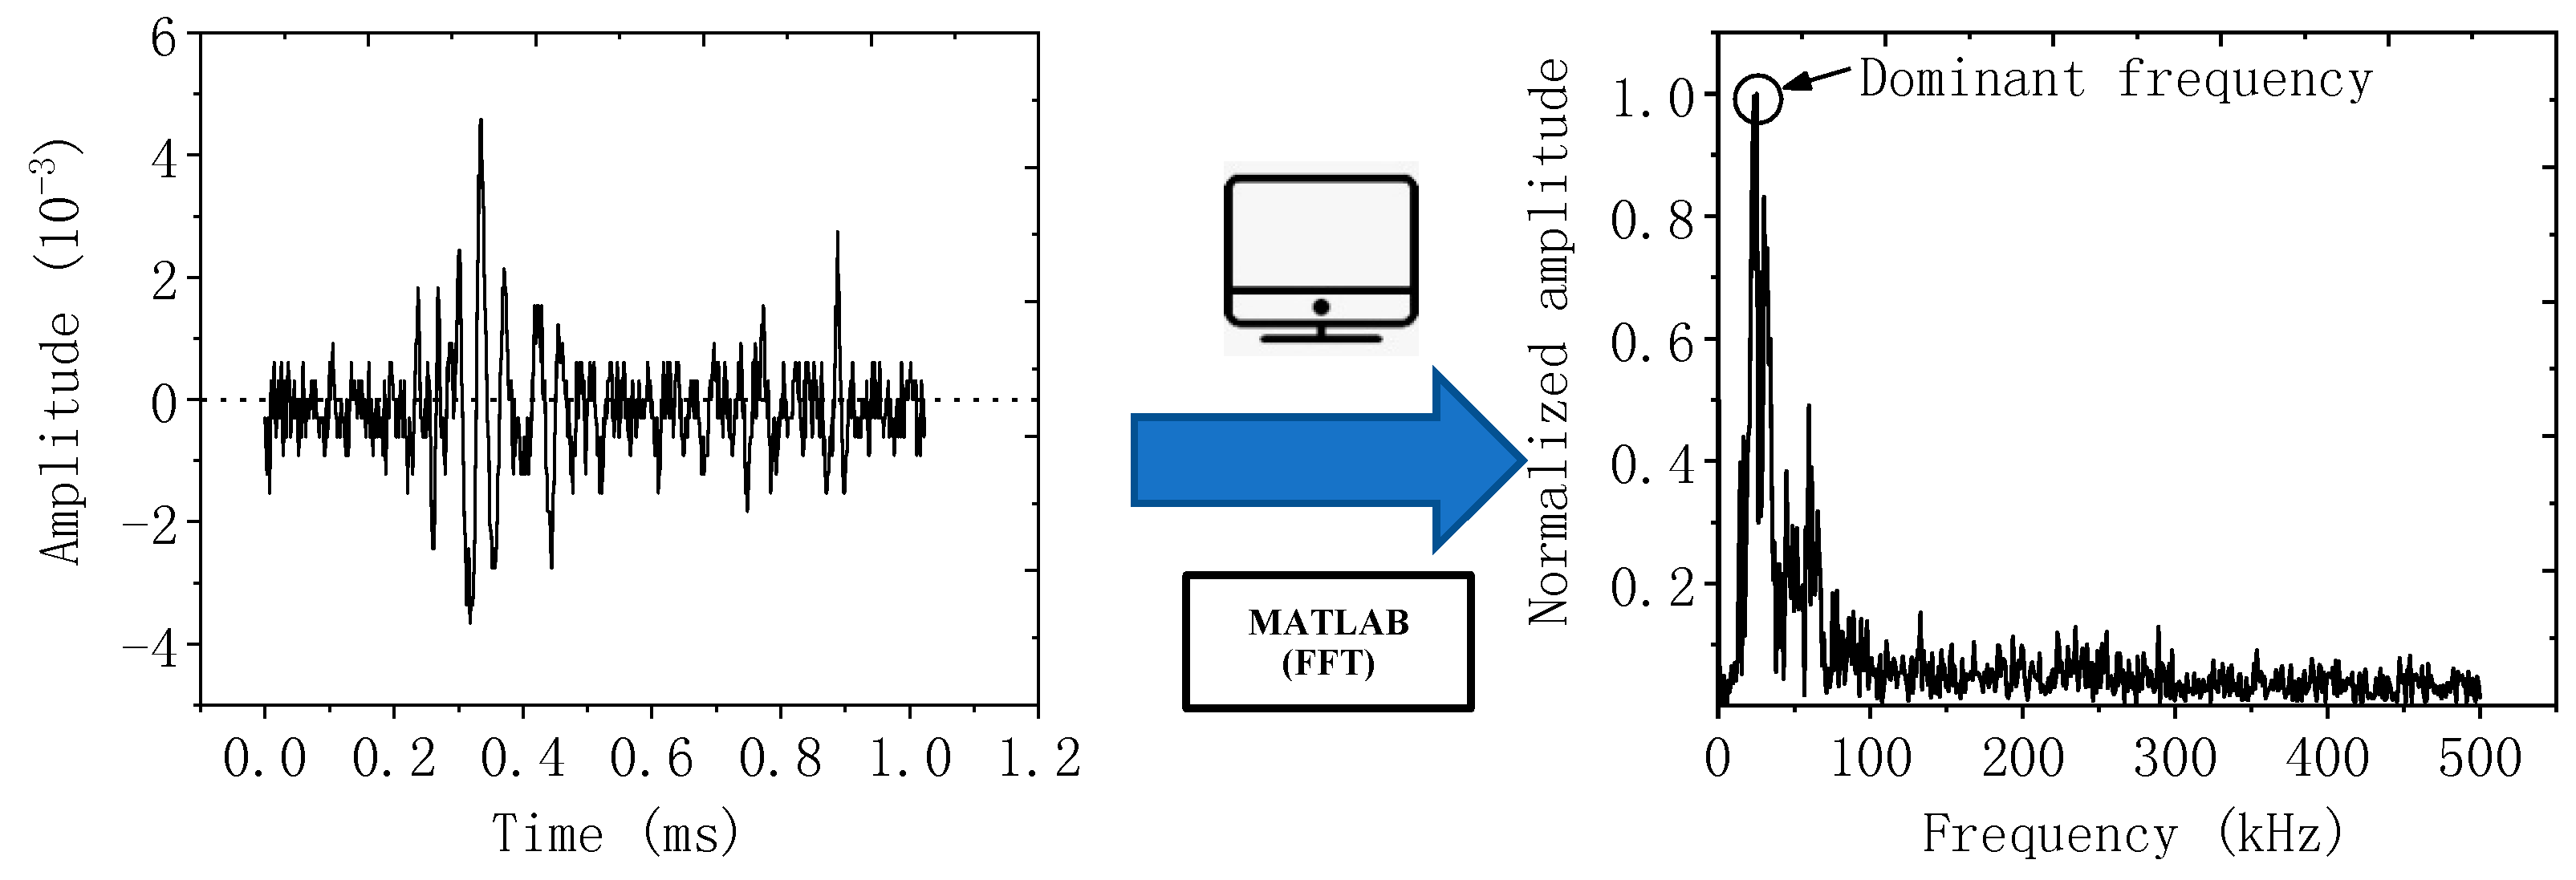
2.3. Waveform Data Processing

The typical AE waveform and its data processing are shown in Figure 2. AE waveforms were recorded as a single data file by PCI-2; each data file recorded one AE waveform that represents one fracture event. The available AE waveform data was analyzed through Fast Fourier transformation (FFT) and transformed into amplitude spectra conventionally. With the help of a MATLAB (R2016a, MathWorks, Natick, MA, USA) programming process, the dominant frequencies of AE waveforms were calculated through a batch process and exported to Excel automatically.

3. Testing Results

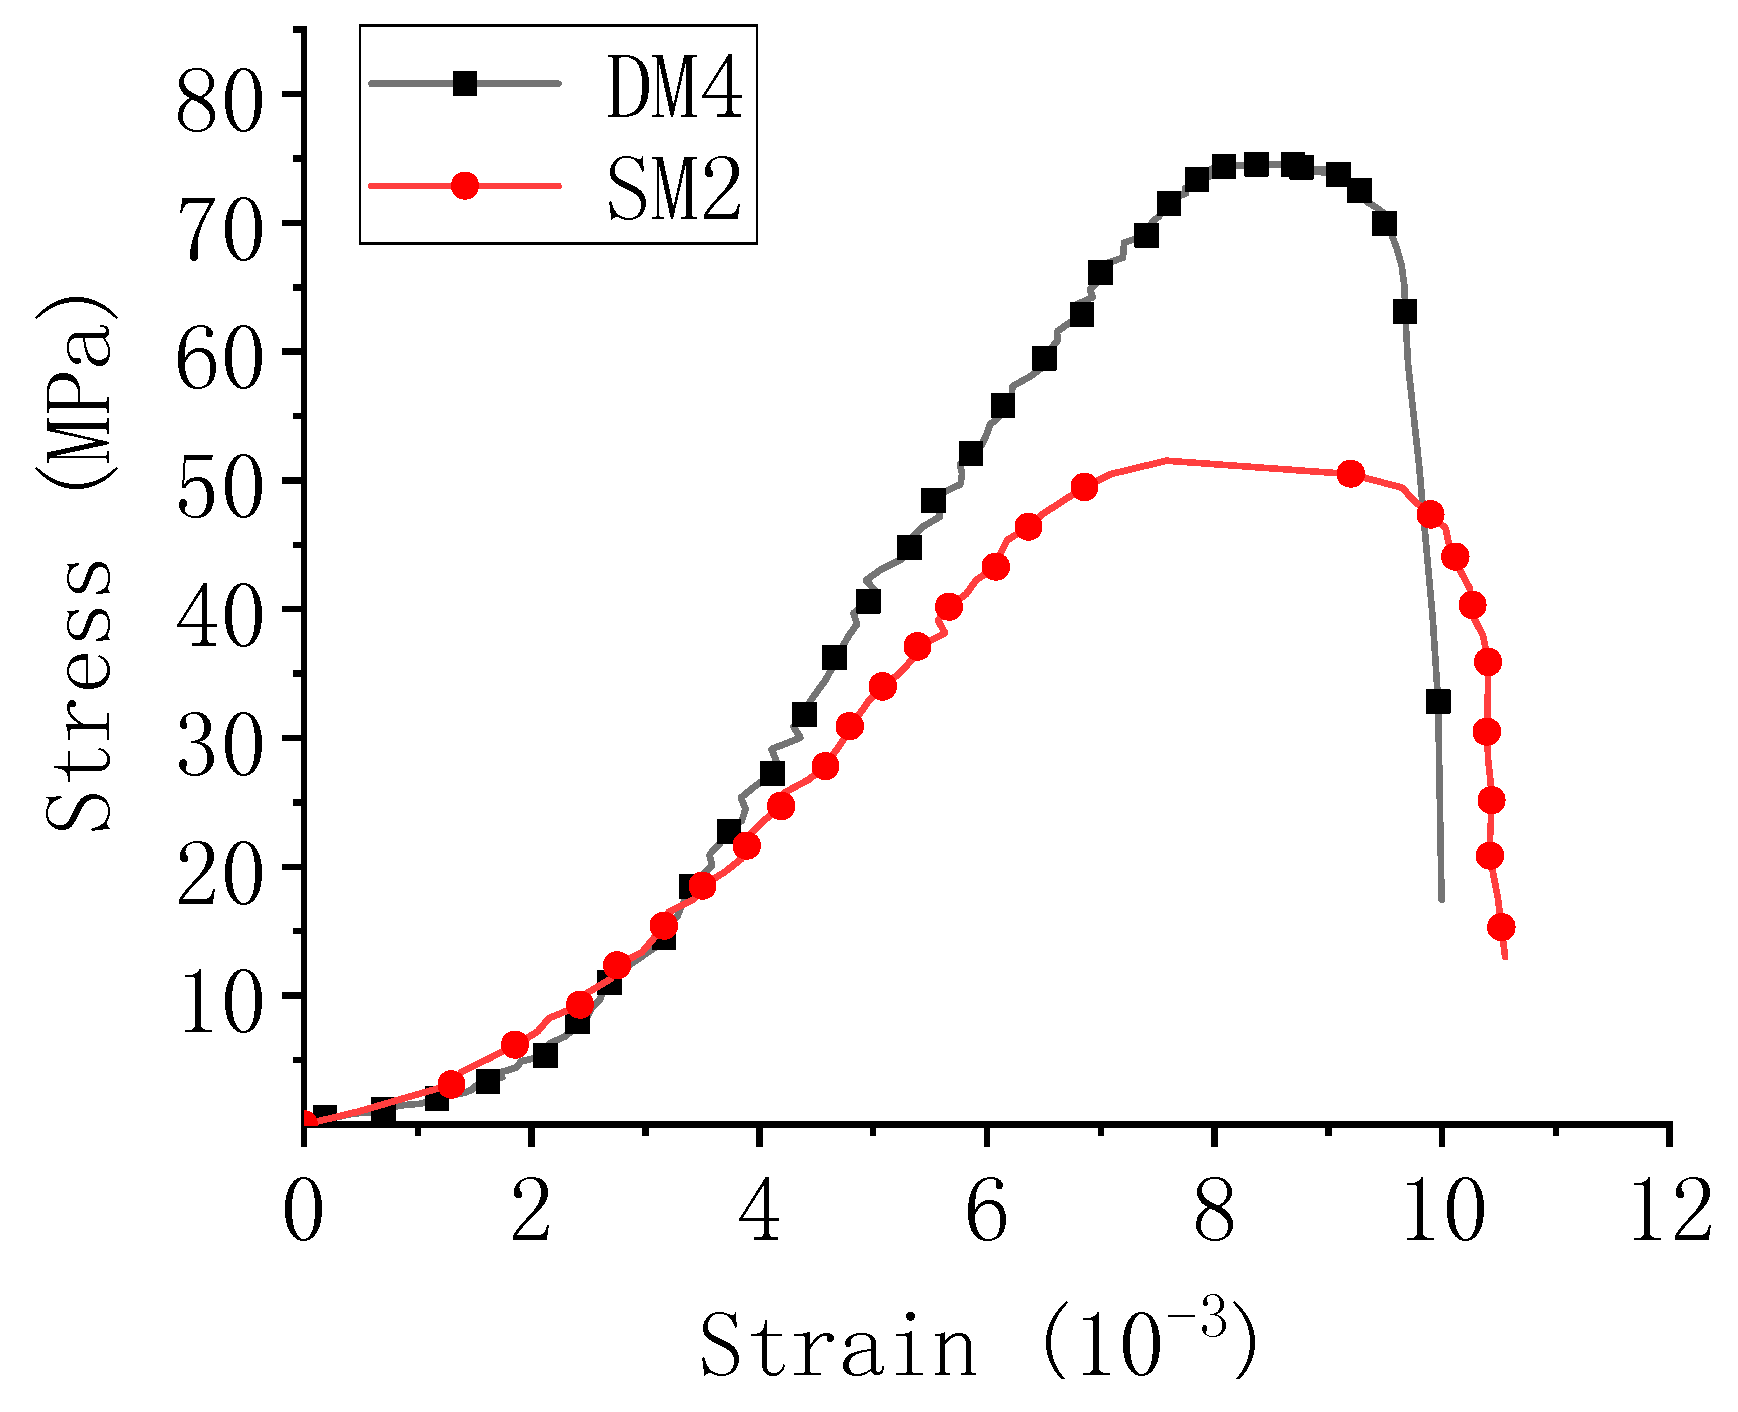
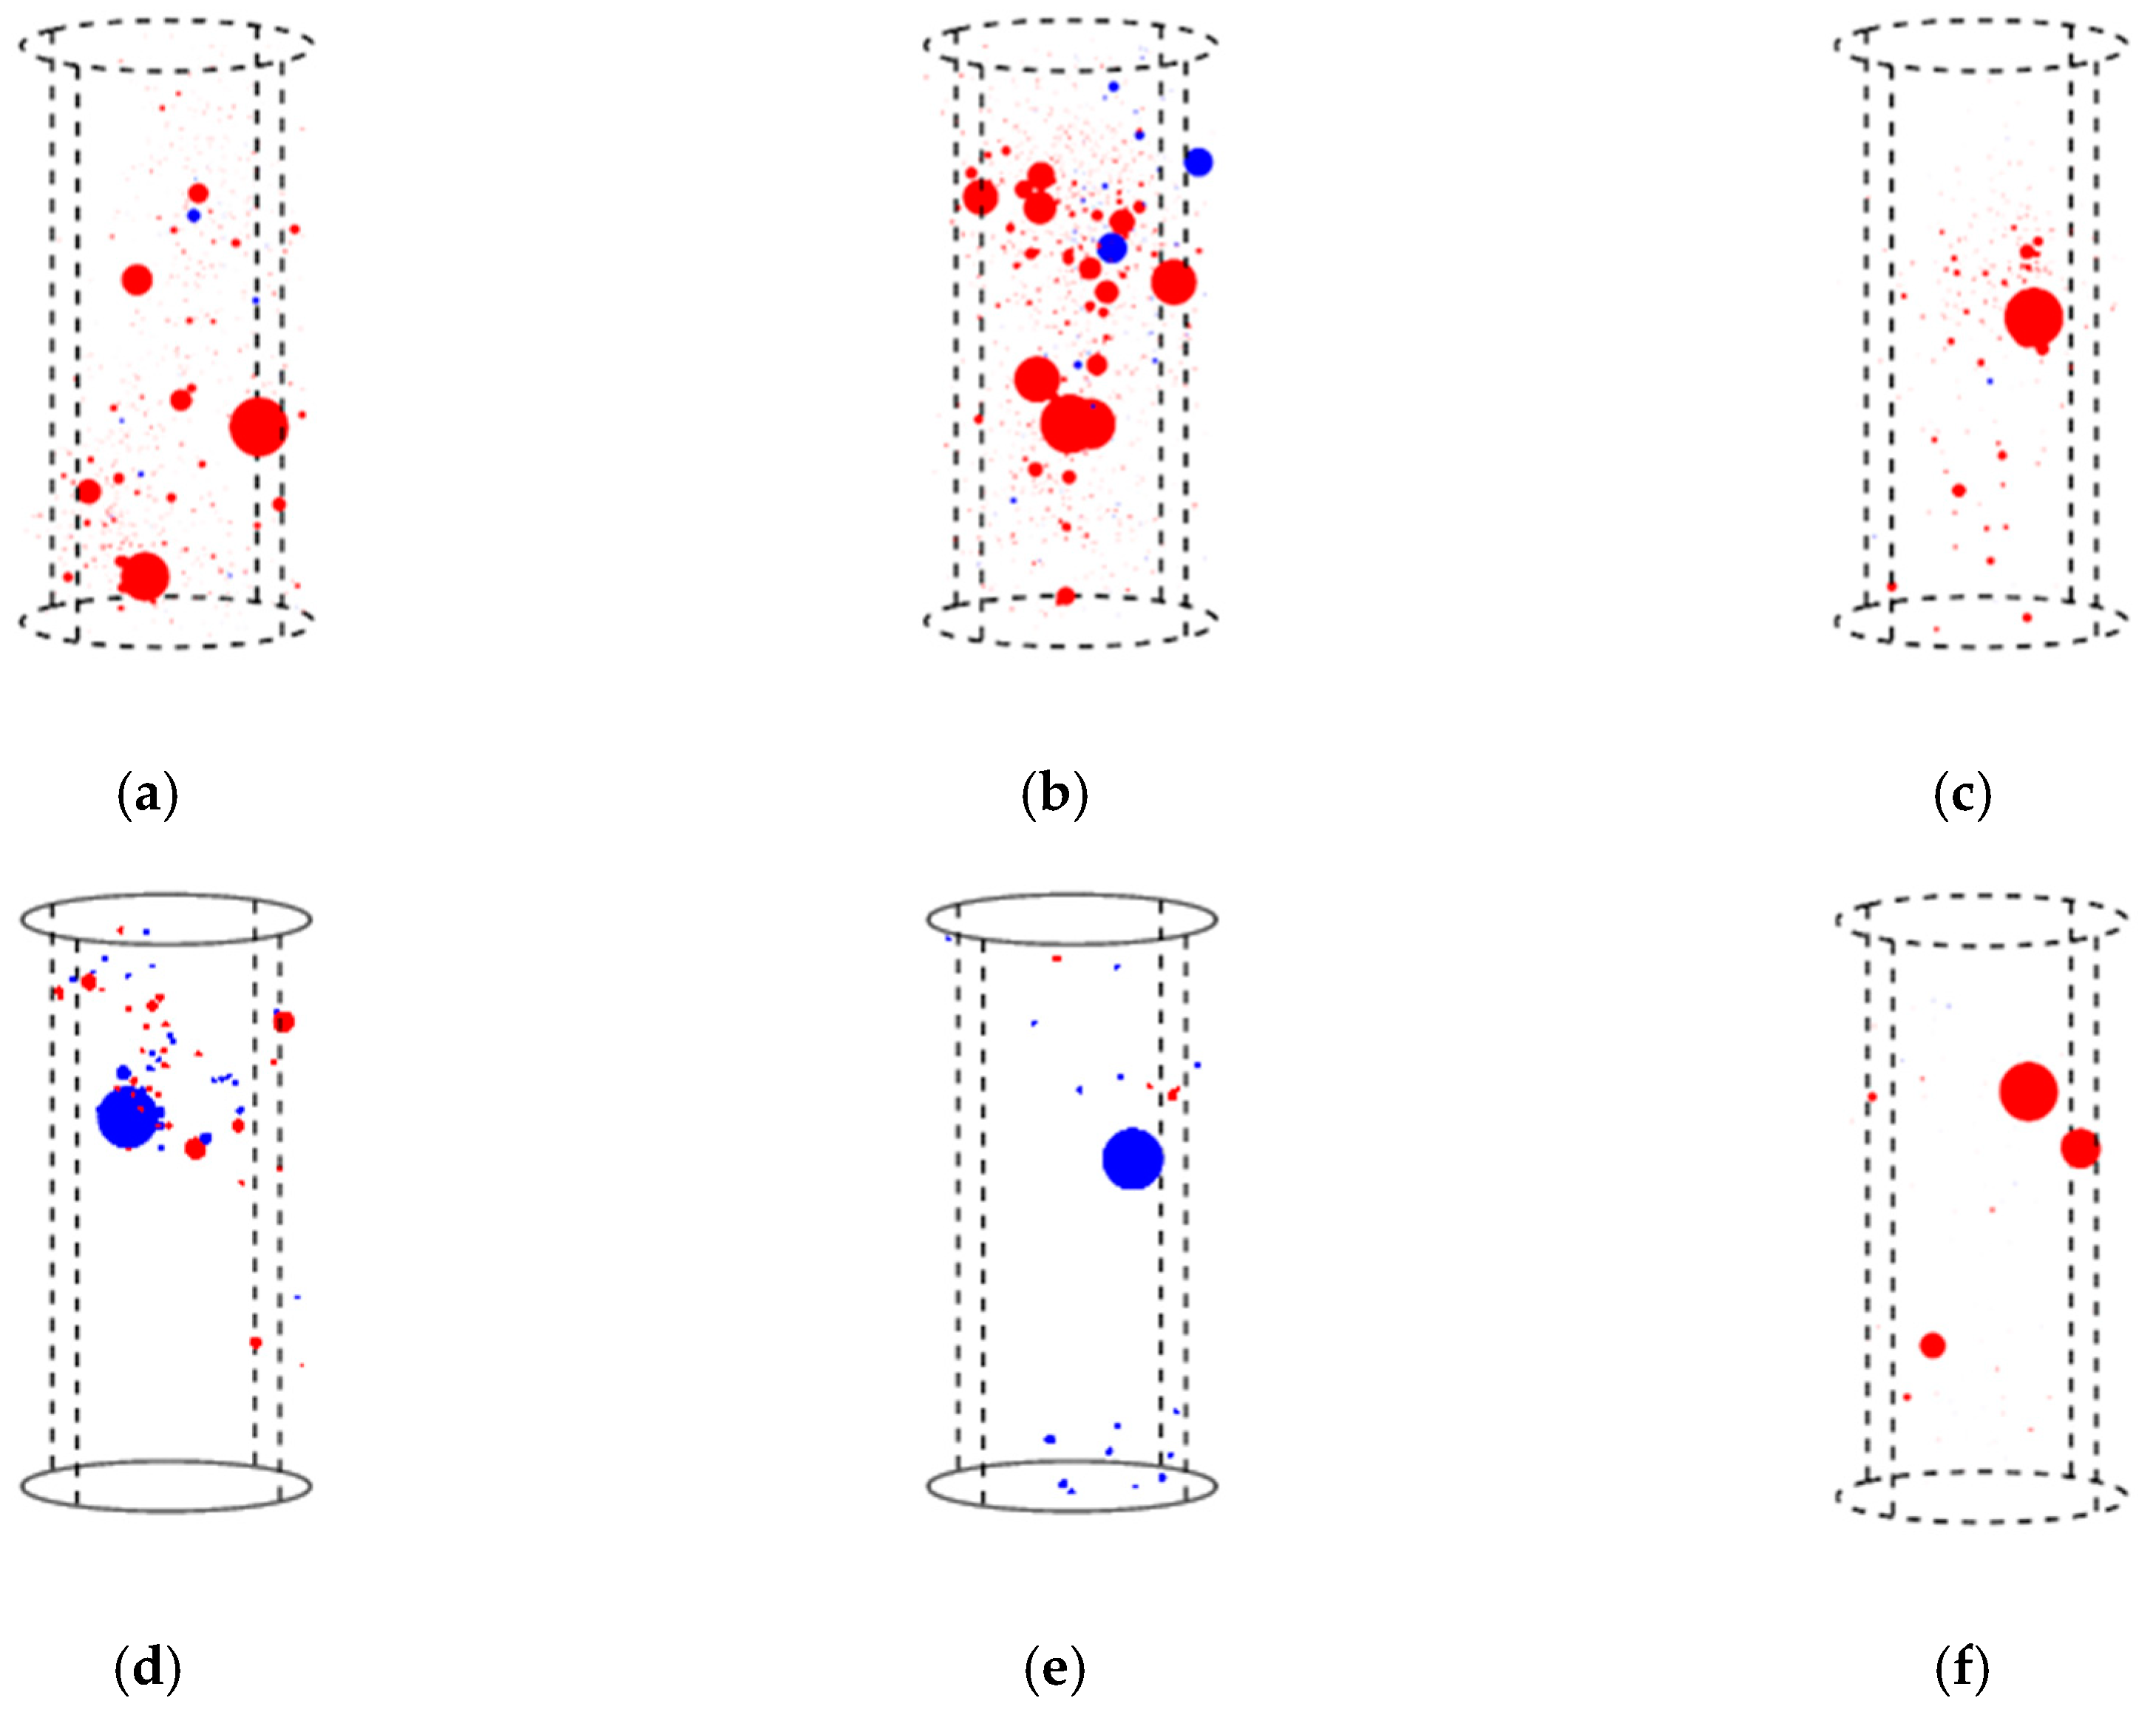
3.1. Macroscopic Failure Patterns

Figure 3 exhibits the relationship of stress and strain of two typical specimens with different moisture conditions. It can be found that the uniaxial compressive strength (UCS) of the saturated specimen is obviously lower than the dried one. Table 1 shows the UCS of each sample based on the test results. Due to the misoperation of the load cell of MTS, the failure of DM3 occurred before the start of test. Therefore, its mechanical and AE data failed to collect. The range of the dried samples’ UCS is among 67.06 to 74.57 MPa, with an average value of 70.16 MPa. In comparison, the range of the saturated samples’ UCS is between 61.33 and 69.03 MPa; the average value is 61.25 MPa. The softening efficient (UCSsat/UCSdri) can be obtained as 0.87, which obviously indicates a moisture-induced softening of rock.
Figure 4 shows the macroscopic failures of two representative samples following the test. It clearly indicates that dried samples’ failure models are mostly shear failure. In addition, the failure model of saturated samples is the combination of both shear and tensile failures. Therefore, the number of tensile cracks increased during the test of saturated rock, is due to the effect of pore water.

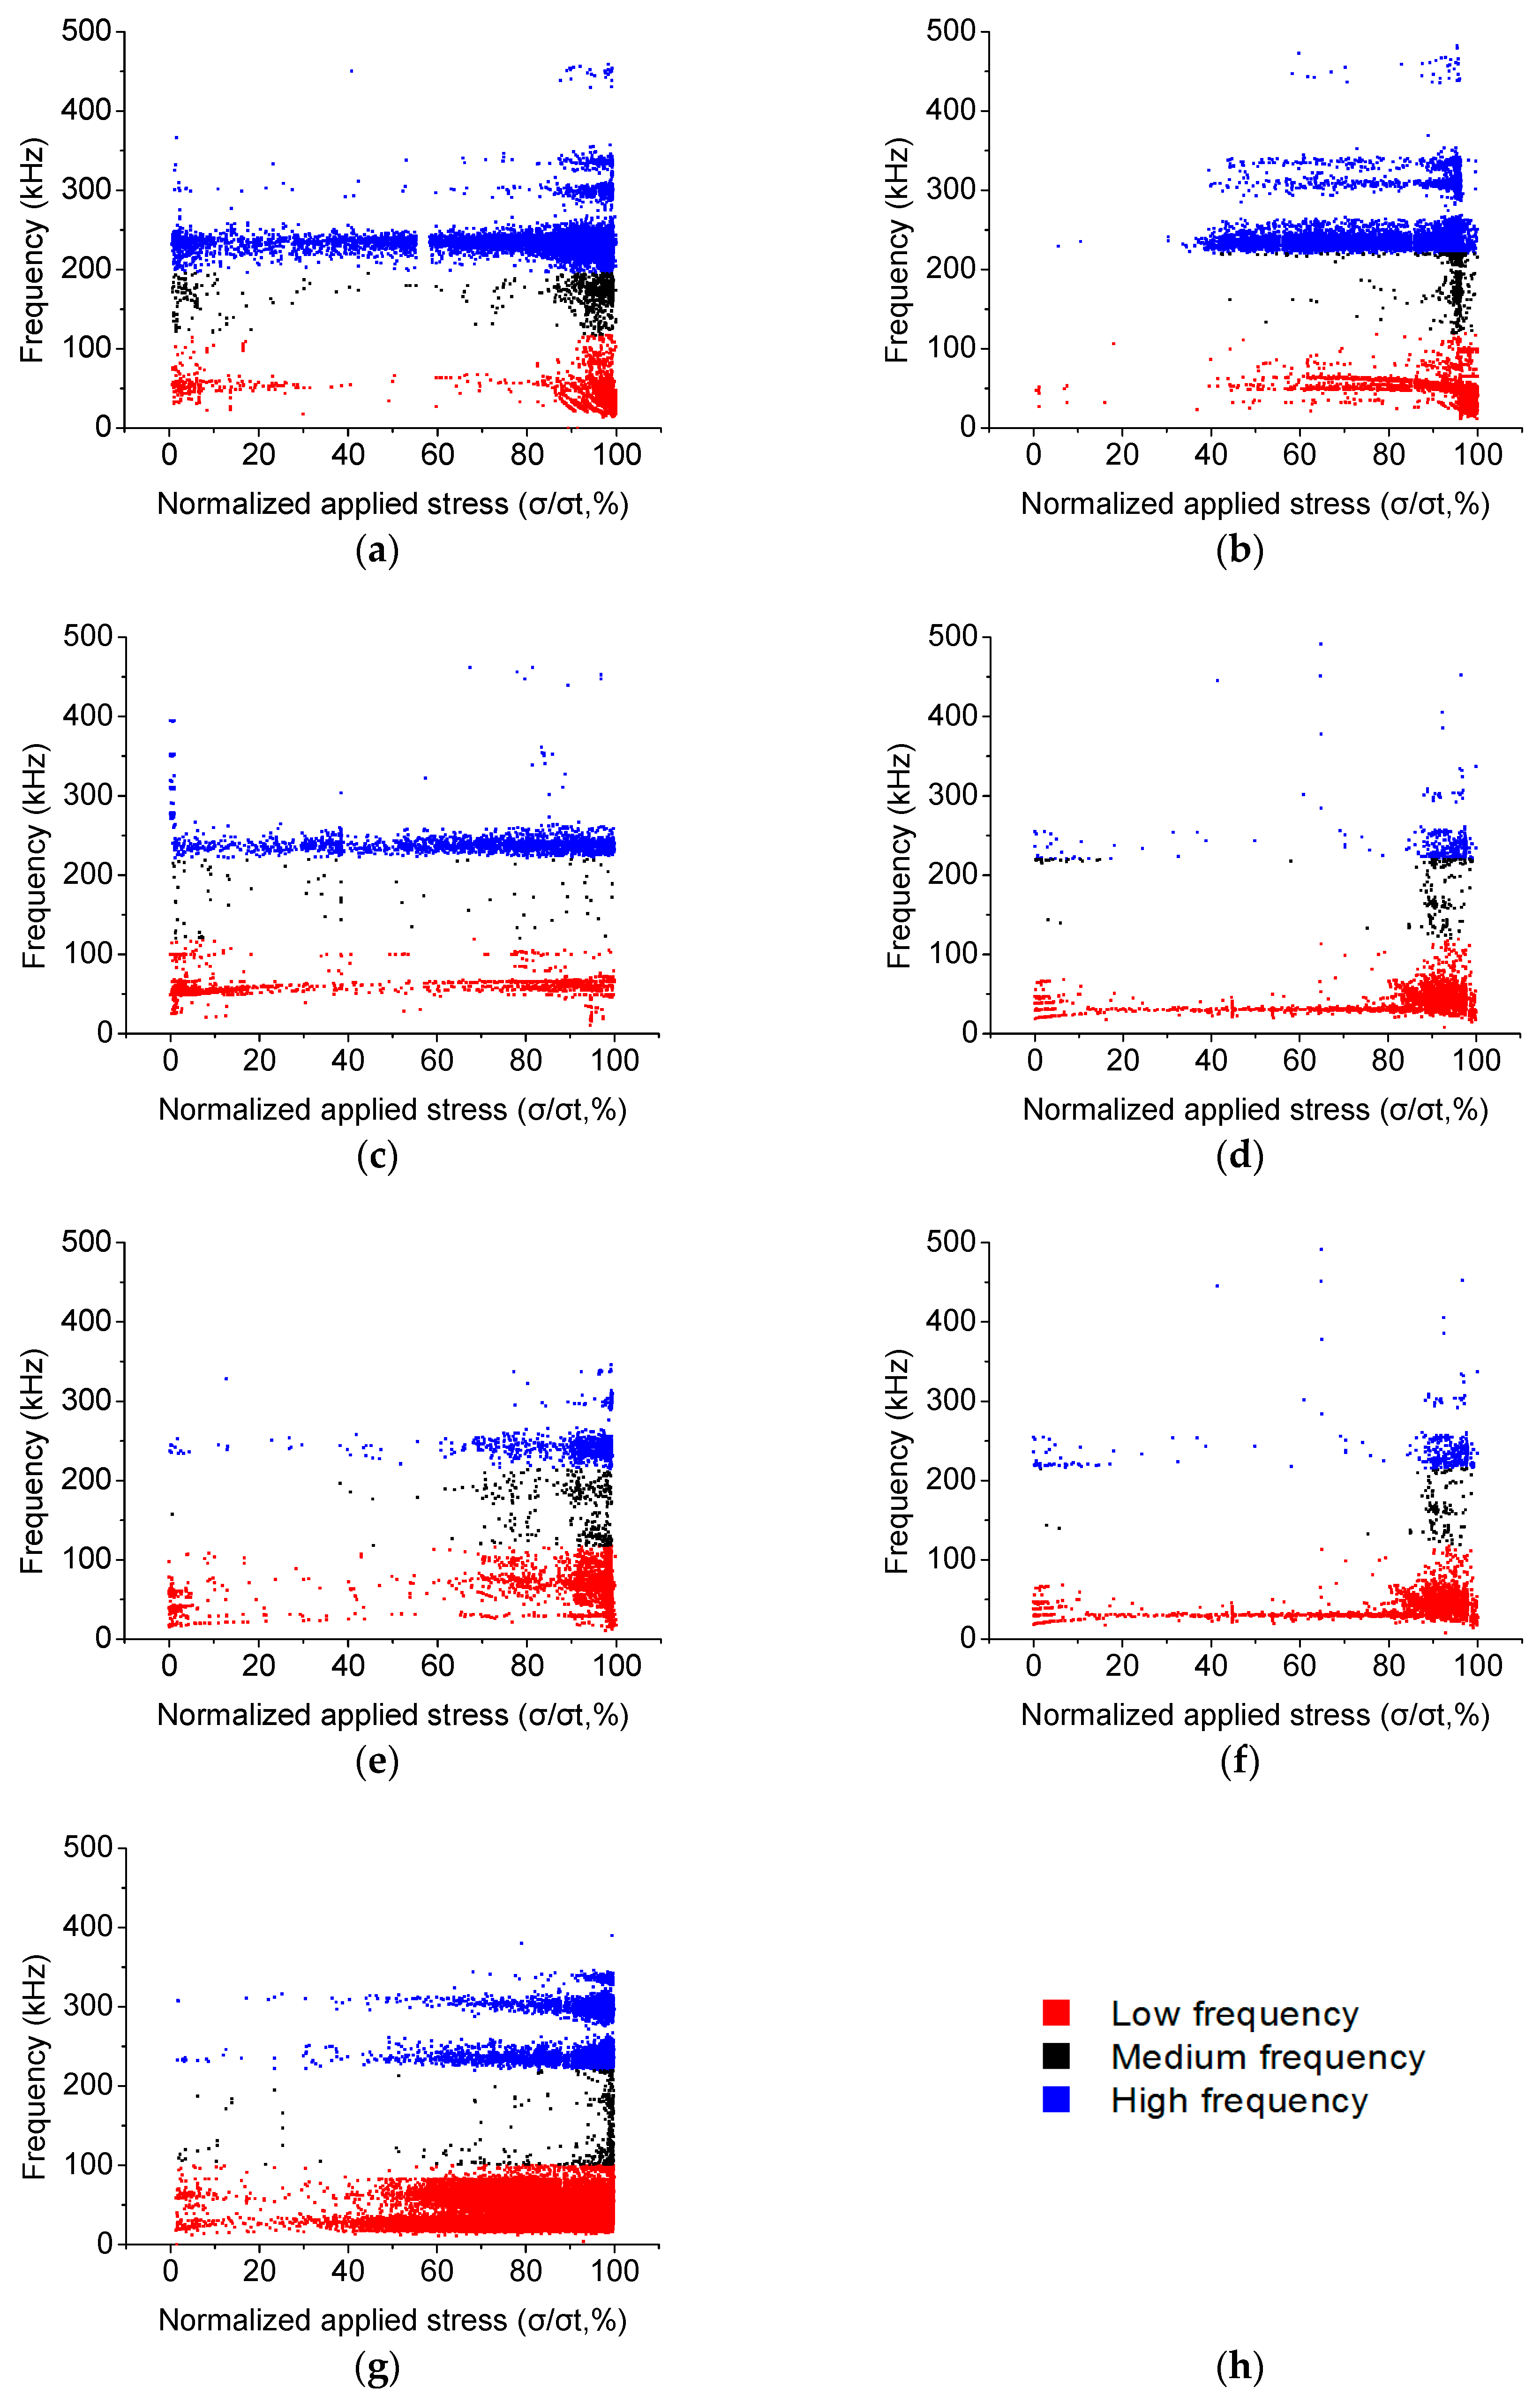
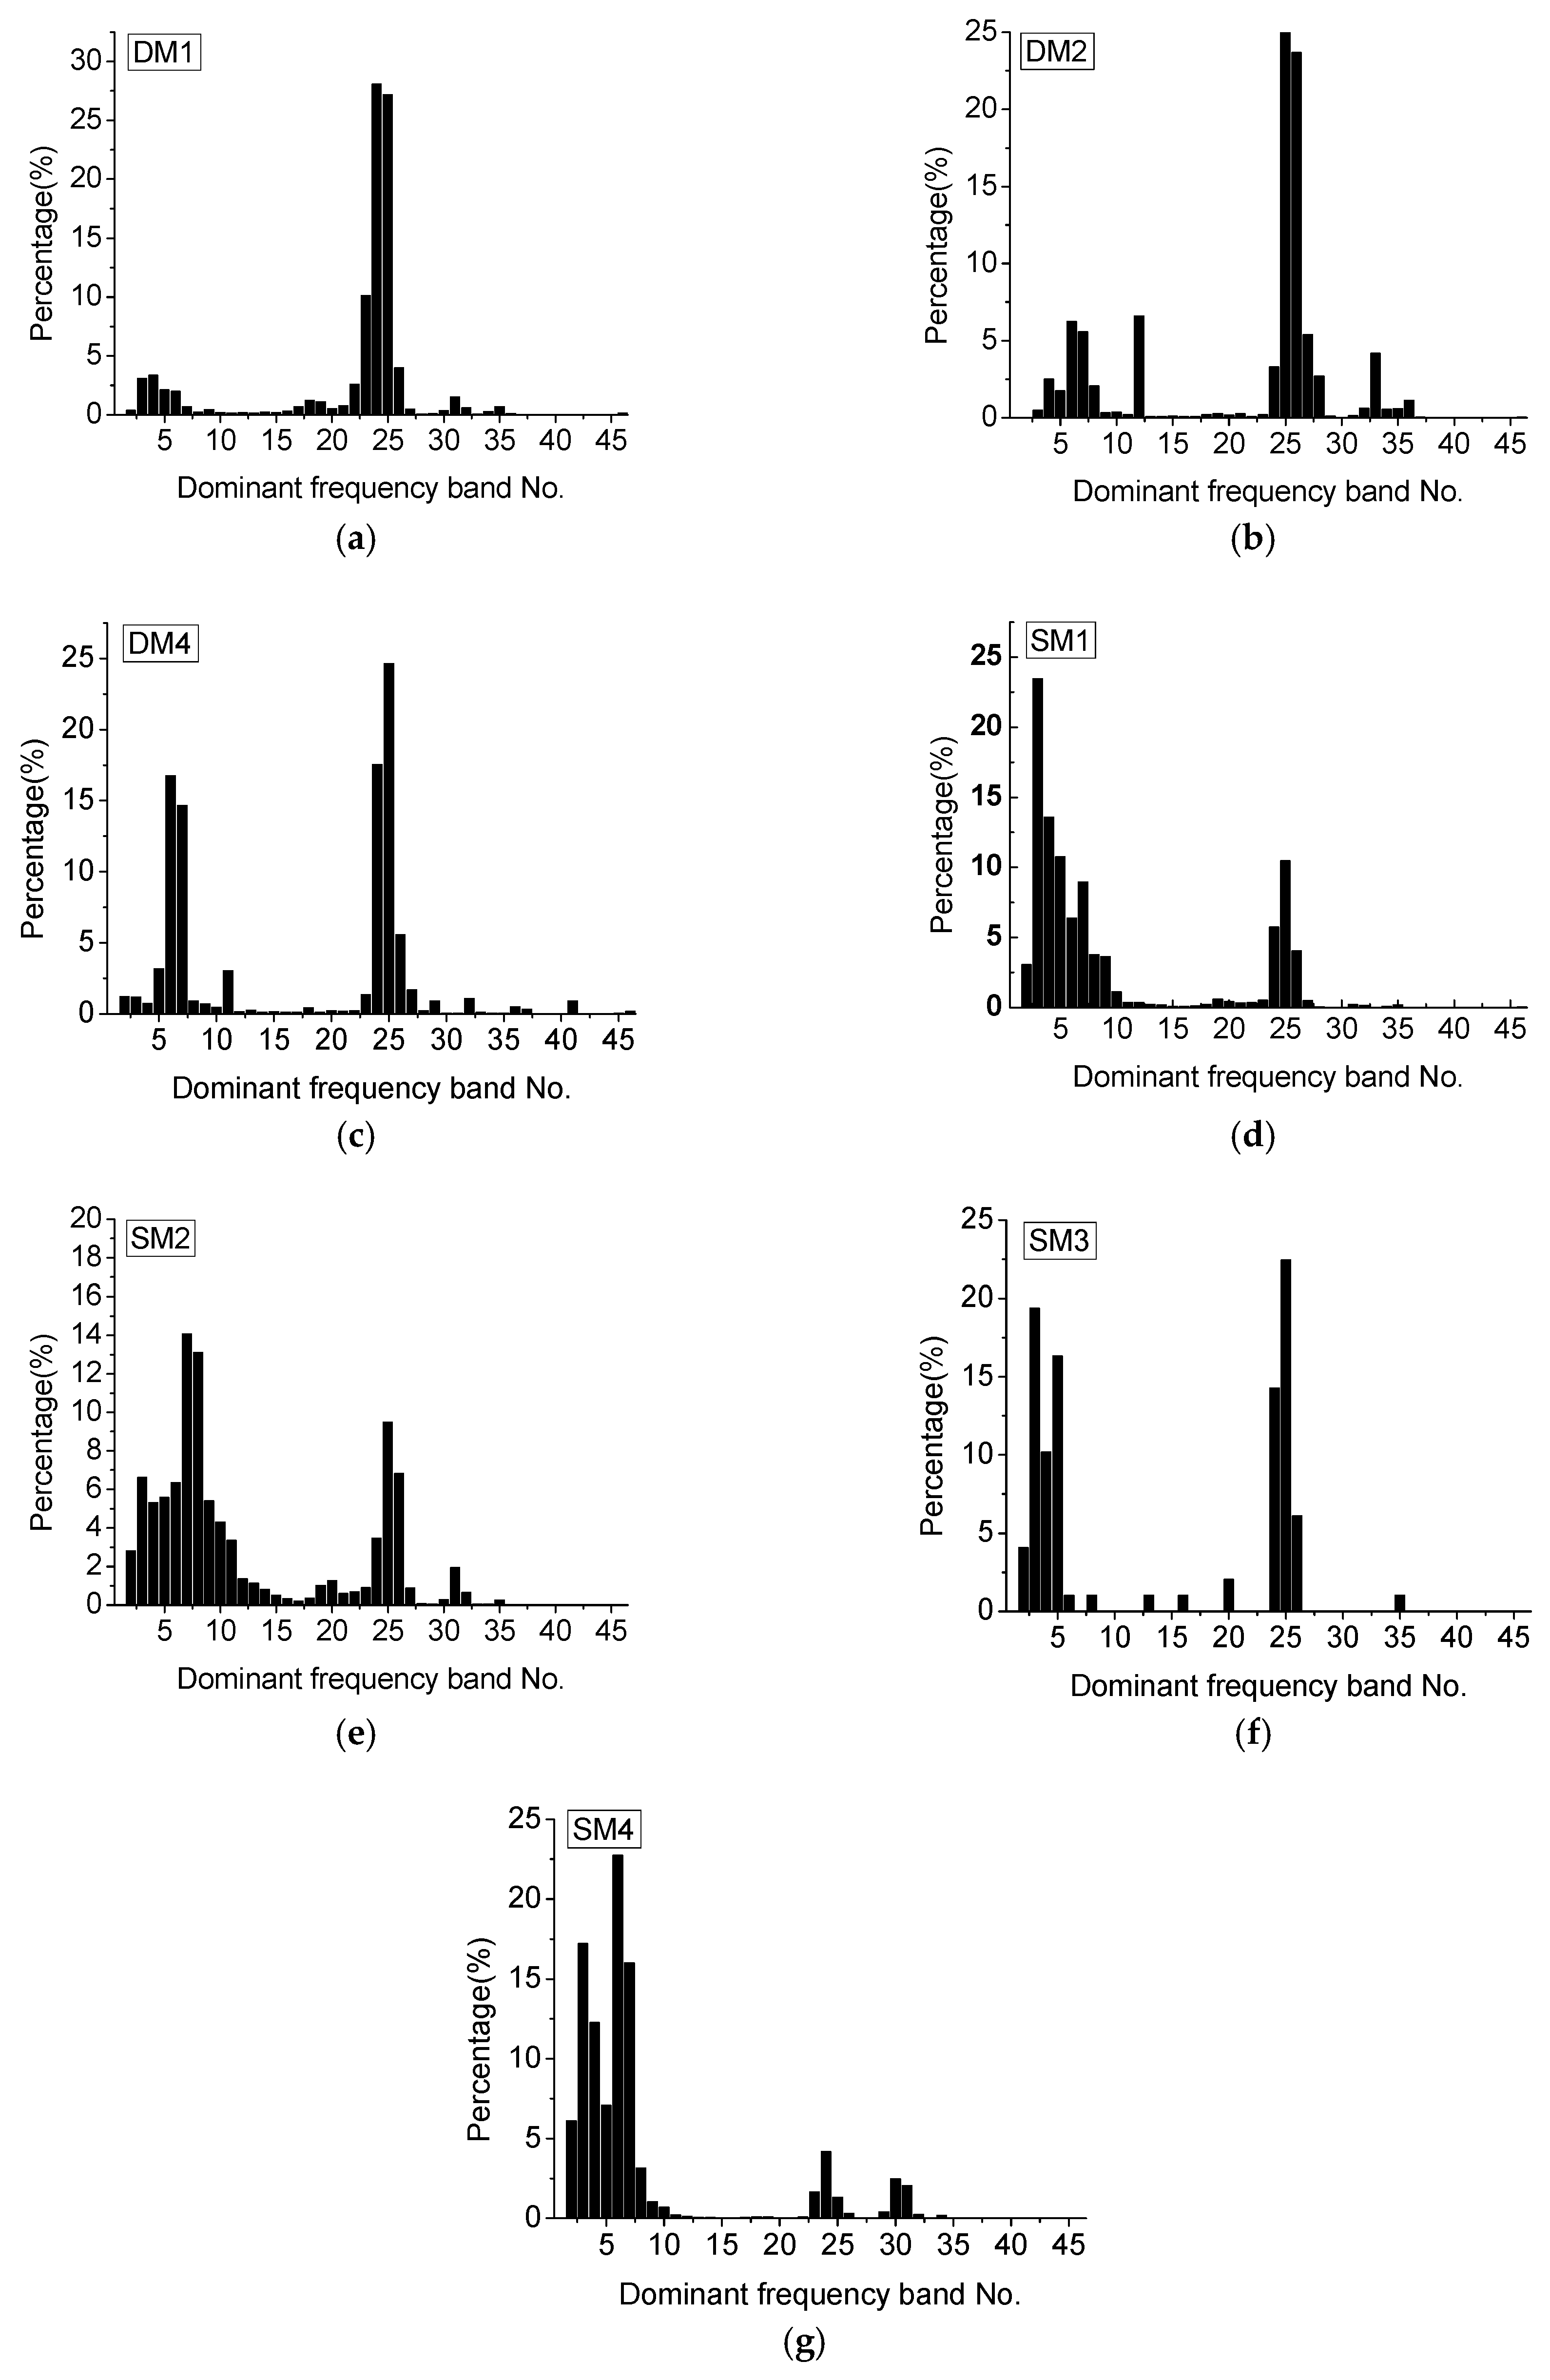
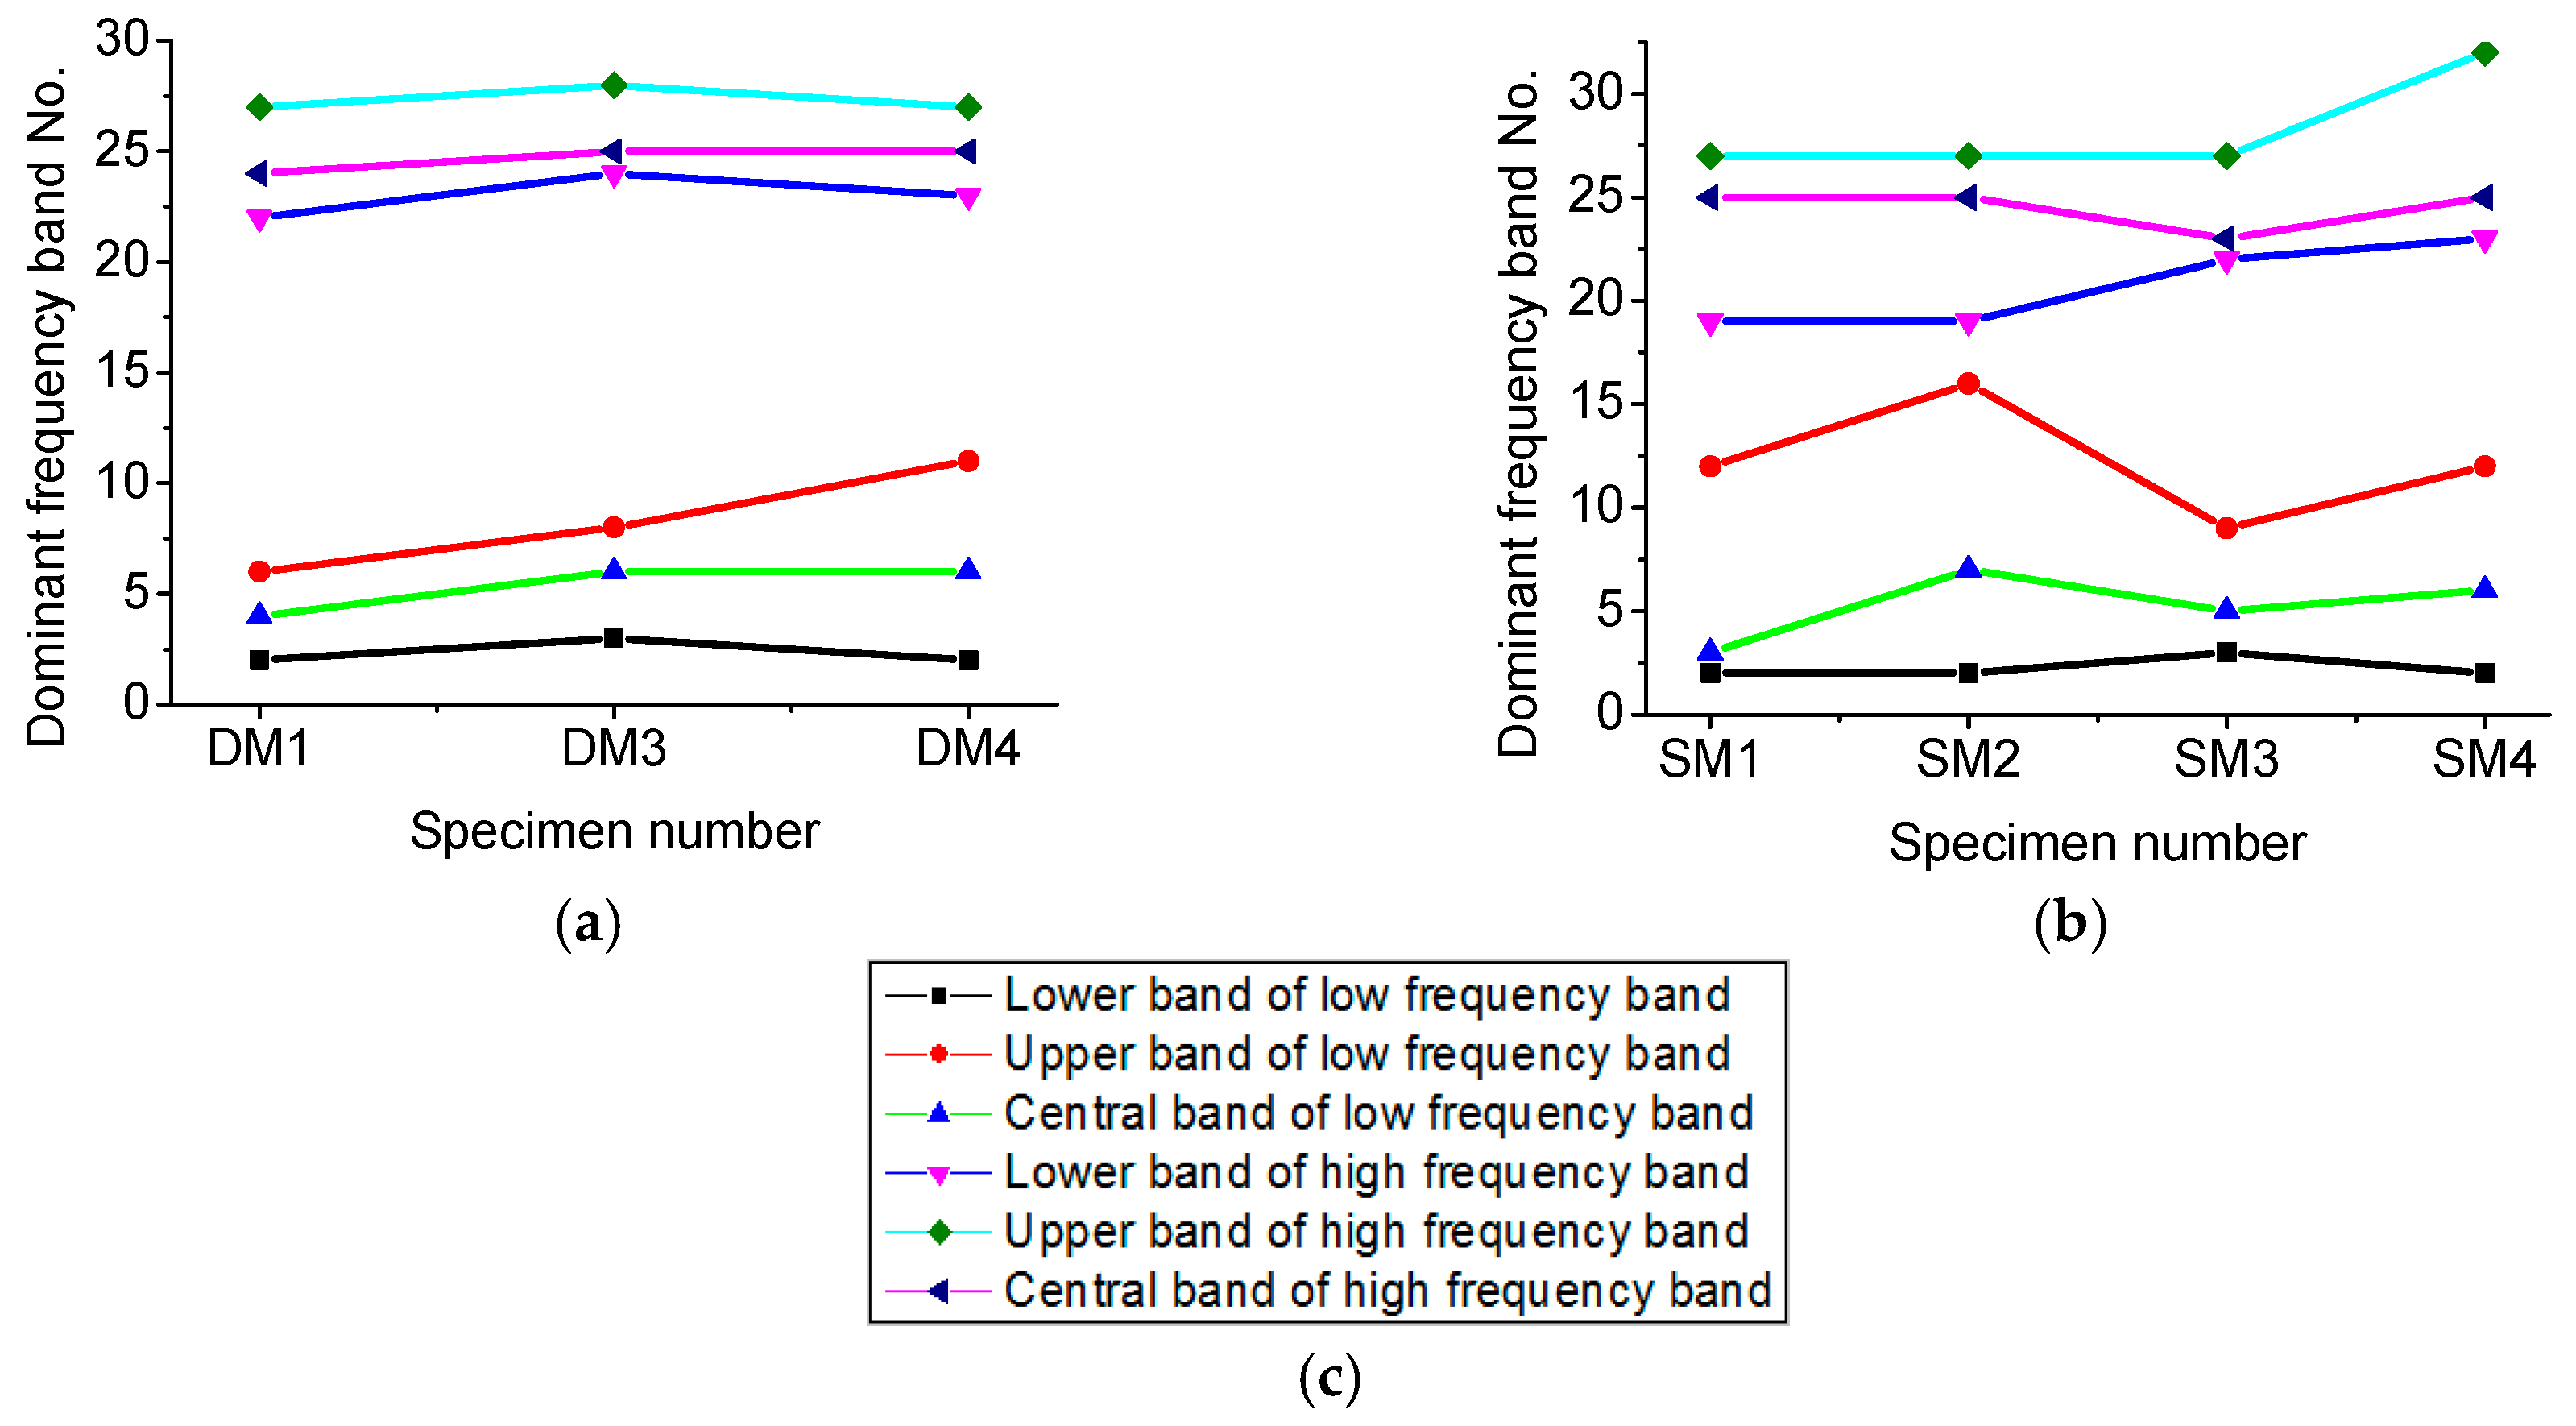
3.2. Frequency Characteristics

Figure 5 shows the dominant frequency distribution of AE waveforms corresponding to the normalized applied stress (σ/σt) throughout the whole process of the test.
It can be easily observed that dominant frequencies of AE waveforms are mainly concentrated in two frequency bands. The AE waveforms with low band dominant frequencies (1–117 kHz) were represented by the red dots; meanwhile, the AE waveforms with high band dominant frequencies (214–491 kHz) were represented by the blue dots. The figure also shows the AE that occurred during the whole process of the test. This means the samples’ global failure is accumulation of microcosmic cracks. For dried samples DM1 to DM4, the AE increased when the normalized applied stress reached 85%. On the contrary, for saturated samples SM1 to SM4, the AE increased when the normalized applied stress reached 80%.
The statistical analysis of the dominant frequency characteristics of AE waveforms are shown in Figure 6. The dominant frequencies were classified into 46 bands. Since the dominant frequencies of AE waveforms in rocks are mostly lower than 450 kHz, the band range from 0 to 450 kHz was divided equally into the first 45 bands, and the No. 46 band contains the rest. Figure 4 clearly demonstrates that there are two concentrations of dominant frequency bands in both dried and saturated rocks. Following the findings of Li et al. [29] and Li [31], the feature of double dominant frequency bands is intrinsic for rocks is further confirmed by this observation, regardless of the water content in the rock specimen.
As shown in Table 2, the range of dried specimens’ percentage of high frequency AE is from 53.41% to 77.03% compared with 17.43% to 42.91% for the low frequency AE. On the contrary, the percentage of saturated specimens of high frequency AE ranges from 12.41% to 43.88% compared with 68.25% to 86.29% for the low frequency AE. The rock specimens’ average percentage of low frequency AE was raised from 28.80% to 75.40% after saturation.
The range and central frequency band of both low and high frequency bands are shown in Figure 7. For dried specimens, the range of their low frequency band is from No. 2 to No. 11 dominant frequency bands, and the central frequency band is around No. 6 dominant frequency band. Besides, the range of their high frequency band is from No. 22 to No. 28 dominant frequency band, and the central frequency band is around No. 25 dominant frequency band. On the contrary, the range of saturated specimens in both low and high frequency bands varies considerably. Their low frequency band is between No. 2 and No. 16 dominant frequency bands with No. 6 dominant frequency band as the central frequency. The high frequency band is between No. 19 and No. 32 dominant frequency band with No. 25 dominant frequency band as central frequency.
The test result indicates that pore water has little effect on marble specimens’ central frequency of both low and high frequency bands. This is due to the marble consisting of a single mineral and relatively homogeneous. Besides, the pore water broadens the saturated specimens’ range of both low and high frequency bands. This phenomenon reflects that pore water in rocks results in a more complex failure.
The normalized applied stress is defined as the ratio of the current stress and the UCS. Figure 8 demonstrates the cumulative percentages of both low and high frequency AE versus increasing normalized applied stress in dried and saturated rocks, respectively. Both proportions of low and high frequency AE raise along with the increasing of normalized applied stress. The proportion of high frequency AE is generally higher than that of low frequency AE in dried rocks, whereas the magnitude of the relationship between the proportions of high and low frequency AE is the opposite. A significant growth in AE signals can be found in dried and saturated rocks before final failure. However, numerous AE signals occurred at the early loading stage in saturated rocks (Figure 8d,f).
Besides dominant frequency, the average frequency (AF) of the signals is another parameter to classify the failure mode of crack. This parameter can be calculated from the waveform’s counts divided by its duration [21]. Figure 9 demonstrates the average frequency versus increasing normalized applied stress in dried and saturated rocks, respectively. In order to show the variation clearly, the curve is the moving average of the recent more than 50 hits. It can be observed that in the last stages prior to the sample failure for normalized applied stress higher than 80%, the range of variation of AF in dried rocks (generally from 20 to 140 kHz) is distinctly larger than the one in saturated rocks (generally from 40 to 260 kHz).

3.3. Energy Characteristics

The location of AE signals are indicated in Figure 10. Blue and red balls represent low and high frequency AE, respectively, and large balls represent the AE with high energy. It can be clearly observed that most of high energy AE in dried specimens are the ones with high frequency. In contrast, high energy AE are mostly with low frequency in saturated specimens (except SM4).
As shown in Table 3, the range of dried specimens’ percentage of energy of high frequency waveforms is from 71.21% to 80.20% in comparison with 13.99% to 27.03% for the range of low frequency waveforms. On the contrary, the percentage of energy of high frequency AE in saturated specimens ranges from 15.02% to 56.97% compared to 39.04% to 84.71% for the low frequency AE. Due to the saturation, the rock specimens’ average percentage of energy of low frequency waveforms was raised from 18.96% to 64.43%.

4. Distinctions Between Failure Mechanisms of Dried and Saturated Rocks

4.1. Macroscopic Failure Mechanism

As shown in Figure 2, single slope shear failure occurs for dried specimens. While the failure modes of saturated specimens are not unique, unlike dried rocks. Both shear failure and tensile failure (parallel to the direction of stress) were both observed for saturated rocks.

4.2. Microscopic Failure Mechanism

Through the AE test, Li [31] proposed the theory that micro-shear failure generates a high frequency AE signal and micro-tensile failure releases a low frequency one. Based on that theory, the result of this paper shows that micro-shear and micro-tensile failure account for approximately 68% and 29%, respectively, of the total failure events during uniaxial compression for dried rocks. This observation indicates that micro-shear failure plays a dominant role for dried rock’s failure under compression. This observation coincides with past findings for rock micro failure modes (Jaeger et al. [32]; Li et al. [29]).
Compared with dried rocks, the phenomenon of increasing micro-tensile failure events (from approximately 29% to 75% on average) and decreasing micro-shear failure events (from approximately 78% to 21% on average) can be found in saturated rocks. This observation shows that, for saturated rocks, the dominant category of micro failure under compression is varied from micro-shear to micro-tensile.
The ranges of low and high frequency bands reflect the complexity of micro-tensile and micro-shear failures, respectively. Under compression, stress distribution around pores is changed due to the existence of pore water, which results in relatively complicated micro failure in saturated rocks.
The roles of micro-tensile and micro-shear failures during the compression of rock can be reflected by the characteristics of cumulative low frequency and high frequency AE signals with stress level [33]. For dried rocks, micro-shear failures mainly contribute to the final macro-failure. In contrast, the existence of pore water in saturated rocks results in a more complicated accumulation of micro-shear and micro-tensile failure during compression. The relative relationship in magnitude between the percentages of micro-tensile and micro-shear failures is not stable during the whole progress of compression. Compared with dried rock, a significant increase in the number of micro failure events can be found in some saturated rocks at low stress level. This observation indicates fractures in the saturated rock could be initiated earlier than in the dried rock.
In the view of energy release, it can be observed clearly that in dried specimen, most of the energy was released during the crack of micro-shear failure. On the other hand, micro-tensile failures contribute more energy release in saturated specimens. Considered that rock’s tensile strength is lower than its shear strength, the increasing of ratio and energy of micro-tensile failures in saturated rock can be considered as a main cause of moisture-induced softening.
Based on the research of Aggelis et al. [21], AE waveforms with relatively high and low AF represents micro-tensile and -shear failure, respectively. The test results indicate that in the last stages prior to the sample failure for normalized applied stress higher than 80%, the cracks in dried rocks are mainly micro-shear failures, whereas the ones in saturated rocks are a combination of tensile and shear failures.

5. Conclusions

(1) Two dominant frequency bands of AE waveforms in white marble exist in the uniaxial compression tests. This phenomenon had no variation at different water content of rock specimens.
(2) From a macroscopic perspective, under uniaxial compression, the saturated rock shows a more complicated failure pattern than dried rock. Dried rock specimens present single slope shear failures, whereas both tensile and shear failure in different scales can be found in saturated specimens.
(3) Under compression, the pore water in saturated rock results in increasing complexity of micro failures. Micro-tensile failures play a dominant significant role in the final failure of saturated rocks. In contrast, the final failure of dried rocks under uniaxial compression is mainly attributed to micro-shear failures. Besides, cracks in saturated rock can be initiated in a relatively low stress level. In addition, in regards to dried and saturated specimen under compression, cracks that released high energy are mainly micro-shear and micro-tensile failures, respectively.
(4) For saturated rock under compression, the existence of water pore pressure results in the increasing of ratio and energy of micro-tensile failures. This phenomenon can be considered as a main cause of rock’s moisture-induced softening

Author Contributions

Data curation, Y.H., J.Z.; Formal analysis, Y.H.; Writing—original draft, Y.H.; Writing—review & editing, Y.H.; Funding acquisition, J.D.; Project administration, J.D.; Supervision, J.D.

Funding

This study was funded by the National Natural Science Foundation of China (No. 41772322).

Acknowledgments

The authors thank Dr. Hu Xuanyu from Technische Universität Berlin and Mr. Jose Flores for their valuable advices.

Conflicts of Interest

The authors declare no conflict of interest.

References

  1. Price, N.J. The compressive strength of coal measure rocks. Colliery Eng. 1960, 37, 283–292. [Google Scholar]
  2. Hawkins, A.B.; Mcconnell, B.J. Sensitivity of sandstone strength and deformability to changes in moisture content. Q. J. Eng. Geol. Hydrogeol. 1992, 25, 115–130. [Google Scholar] [CrossRef]
  3. Zhang, C.; Zhao, Q. Triaxial tests of effects of varied saturations on strength and modulus for sandstone. Rock Soil Mech. 2014, 35, 951–958. [Google Scholar]
  4. Jones, F.O. A laboratory study of the effects of confining pressure on fracture flow and storage capacity in carbonate rocks. J. Pet. Technol. 1975, 27, 21–27. [Google Scholar] [CrossRef]
  5. Rajabzadeh, M.A.; Moosavinasab, Z.; Rakhshandehroo, G. Effects of Rock Classes and Porosity on the Relation between Uniaxial Compressive Strength and Some Rock Properties for Carbonate Rocks. Rock Mech. Rock Eng. 2012, 45, 113–122. [Google Scholar] [CrossRef]
  6. Erguler, Z.A.; Ulusay, R. Water-induced variations in mechanical properties of clay-bearing rocks. Int. J. Rock Mech. Min. Sci. 2009, 46, 355–370. [Google Scholar] [CrossRef]
  7. Simpson, D.R.; Fergus, J.H. The effect of water on the compressive strength of diabase. J. Geophys. Res. 1968, 73, 6591–6594. [Google Scholar] [CrossRef]
  8. Chen, T.C.; Yeung, M.R.; Mori, N. Effect of water saturation on deterioration of welded tuff due to freeze-thaw action. Cold Reg. Sci. Technol. 2004, 38, 127–136. [Google Scholar] [CrossRef]
  9. Çelik, M.Y.; Ergül, A. The influence of the water saturation on the strength of volcanic tuffs used as building stones. Environ. Earth Sci. 2015, 74, 1–17. [Google Scholar] [CrossRef]
  10. Kessler, D.; Insley, H.; Sligh, W. Physical, mineralogical and durability studies on the building and monumental granites of the United States. J. Res. Natl. Bur. Stand. 1940, 24, 161–206. [Google Scholar] [CrossRef]
  11. Ruiz, M.D. Some technological of twenty-six characteristics Brazilian rock types. In Proceedings of the 1st Congress of the International Society of Rock Mechanics, Lisbon, Portugal, 25 September–1 October 1966. [Google Scholar]
  12. Lau, J.S.O.; Gorski, B.; Jackson, R. The Effects of Temperature and Water-saturation on Mechanical Properties of Lac Du Bonnet Pink Granite. In Proceedings of the 8th ISRM Congress, Tokyo, Japan, 25–29 September 1995. [Google Scholar]
  13. Jang, H.S.; Kang, S.S.; Jang, B.A. Determination of Joint Roughness Coefficients Using Roughness Parameters. Rock Mech. Rock Eng. 2014, 47, 2061–2073. [Google Scholar] [CrossRef]
  14. Yuan, P. A Study of AE Characteristics of Marble Specimens Under Uniaxial Compression—Failure Prediction. J. Kunming Univ. Sci. Technol. 1987, 2, 12–17. [Google Scholar]
  15. Ohnaka, M.; Mogi, K. Frequency characteristics of acoustic emission in rocks under uniaxial compression and its relation to the fracturing process to failure. J. Geophys. Res. Solid Earth 1982, 87, 3873–3884. [Google Scholar] [CrossRef]
  16. Zhang, C.; Liang, W.; Li, Z.; Xu, S.; Zhao, Y. Observations of acoustic emission of three salt rocks under uniaxial compression. Int. J. Rock Mech. Min. Sci. 2015, 77, 19–26. [Google Scholar] [CrossRef]
  17. Filipussi, D.A.; Guzmán, C.A.; Xargay, H.D.; Hucailuk, C.; Torres, D.N. Study of Acoustic Emission in a Compression Test of Andesite Rock. Procedia Mater. Sci. 2015, 9, 292–297. [Google Scholar] [CrossRef] [Green Version]
  18. Triantis, D. Acoustic emission monitoring of marble specimens under uniaxial compression. Precursor phenomena in the near-failure phase. Struct. Integr. Procedia 2018, 10, 11–17. [Google Scholar] [CrossRef]
  19. Ling, T.; Liao, Y.; Zhang, S. Application of wavelet packet method in frequency band energy distribution of rock acoustic emission signals under impact loading. J. Vib. Shock 2010, 29, 127–130. [Google Scholar]
  20. Armstrong, B.H. Acoustic emission prior to rockbursts and earthquakes. Bull. Seismol. Soc. Am. 1969, 59, 1259–1279. [Google Scholar]
  21. Aggelis, D.G.; Soulioti, D.V.; Sapouridis, N.; Barkoula, N.M.; Paipetis, A.S.; Matikas, T.E. Acoustic emission characterization of the fracture process in fibre reinforced concrete. Constr. Build. Mater. 2011, 25, 4126–4131. [Google Scholar] [CrossRef]
  22. Aggelis, D.G. Classification of cracking mode in concrete by acoustic emission parameters. Mech. Res. Commun. 2011, 38, 153–157. [Google Scholar] [CrossRef]
  23. Ohno, K.; Ohtsu, M. Crack classification in concrete based on acoustic emission. Constr. Build. Mater. 2010, 24, 2339–2346. [Google Scholar] [CrossRef]
  24. Aggelis, D.G.; Mpalaskas, A.C.; Ntalakas, D.; Matikas, T.E. Effect of wave distortion on acoustic emission characterization of cementitious materials. Constr. Build. Mater. 2012, 35, 183–190. [Google Scholar] [CrossRef]
  25. Shiotani, T.; Ohtsu, M.; Ikeda, K. Detection and evaluation of AE waves due to rock deformation. Constr. Build. Mater. 2001, 15, 235–246. [Google Scholar] [CrossRef]
  26. Behnia, A.; Chai, H.K.; Shiotani, T. Advanced structural health monitoring of concrete structures with the aid of acoustic emission. Constr. Build. Mater. 2014, 65, 282–302. [Google Scholar] [CrossRef]
  27. Aker, E.; Kühn, D.; Vavryčuk, V.; Soldal, M.; Oye, V. Experimental investigation of acoustic emissions and their moment tensors in rock during failure. Int. J. Rock Mech. Min. Sci. 2014, 70, 286–295. [Google Scholar] [CrossRef]
  28. Liu, J.P.; Li, Y.H.; Xu, S.D.; Xu, S.; Jin, C. Cracking mechanisms in granite rocks subjected to uniaxial compression by moment tensor analysis of acoustic emission. Theor. Appl. Fract. Mech. 2015, 75, 151–159. [Google Scholar]
  29. Li, L.R.; Deng, J.H.; Zheng, L.; Liu, J.F. Dominant Frequency Characteristics of Acoustic Emissions in White Marble During Direct Tensile Tests. Rock Mech. Rock Eng. 2017, 50, 1337–1446. [Google Scholar] [CrossRef]
  30. Committee, R.T. Recommendation of RILEM TC 212-ACD: Acoustic emission and related NDE techniques for crack detection and damage evaluation in concrete. Mater. Struct. 2010, 43, 1187–1189. [Google Scholar]
  31. Li, L.R. Dominant Frequencies and Their Mechanical Mechanism of Acoustic Emissions in Rock Failures. Ph.D. Thesis, Sichuan University, Chengdu, China, 2017. [Google Scholar]
  32. Jaeger, J.C.; Cook, N.G.W.; Zimmerman, R.W. Fundamentals of Rock Mechanics, 4th ed.; Blackwell Publishing: Hoboken, NJ, USA, 2007. [Google Scholar]
  33. Zhang, Z.H.; Deng, J.H.; Zhu, J.B.; Li, L.R. An Experimental Investigation of the Failure Mechanisms of Jointed and Intact Marble under Compression Based on Quantitative Analysis of Acoustic Emission Waveforms. Rock Mech. Rock Eng. 2018, 51, 2299–2307. [Google Scholar] [CrossRef]
Figure 1. Experimental setup of uniaxial compression tests.
Applsci 09 00446 g001
Figure 2. Typical acoustic emission (AE) waveform and its spectrum.
Applsci 09 00446 g002
Figure 3. Stress-strain curves of typical dried and saturated specimens.
Applsci 09 00446 g003
Figure 4. Macroscopic Failure of rock samples (red: shear failure, blue: tensile failure). (a) Dried sample; (b) saturated sample
Applsci 09 00446 g004
Figure 5. Characteristics of dominant frequency versus the normalized loading stress. (ac) DM1–DM4; (dg) SM1–SM4; (h) Explanation of the three colors: red, black and blue.
Applsci 09 00446 g005
Figure 6. Proportions of the dominant frequency bands of AE signals in specimens (ac) DM1–DM4; (dg) SM1–SM4
Applsci 09 00446 g006
Figure 7. The range and central frequency band of AE waveform in specimen: (a) Dried marble; (b) saturated marble; (c) explanation of different lines.
Applsci 09 00446 g007
Figure 8. Characteristics of cumulative increasing curve of low frequency AE and high frequency AE, respectively, corresponding to the normalized applied stress. (ac) DM1–DM4; (dg) SM1–SM4; (h) explanations of different lines.
Applsci 09 00446 g008
Figure 9. Curves of average frequency corresponding to the normalized applied stress. (ac) DM1–DM4; (dg) SM1–SM4.
Applsci 09 00446 g009aApplsci 09 00446 g009b
Figure 10. The space distribution of AE events. (a) DM1; (b) DM2; (c) DM4; (d) SM1; (e) SM2; (f) SM4.
Applsci 09 00446 g010
Table 1. The UCS (uniaxial compressive strength) of dried and saturated rock specimens.
Specimen No.UCS (MPa)
DM167.06
DM268.86
DM474.57
SM161.72
SM252.90
SM369.03
SM461.33
Table 2. Percentage of high and low dominant frequency bands in dried and saturated rock specimens.
Specimen No.Percentage of Low Frequency Bands (%)Percentage of High Frequency Bands (%)
DM117.4377.03
DM226.0672.49
DM442.9153.41
SM175.4122.08
SM268.2525.24
SM352.0443.88
SM486.2912.41
Table 3. Percentage of energy of high and low dominant frequency waveforms in dried and saturated rock specimens.
Specimen No.Percentage of Energy of Low Frequency Waveforms (%)Percentage of Energy of High Frequency Waveforms (%)
DM113.9979.28
DM215.8680.20
DM427.0371.21
SM169.3529.29
SM284.7115.02
SM339.0456.97
SM464.6235.17

