3.1. The Effect of Volume Flow Rate and Temperature on Conversion
The experimental measurements for the ethyl acetate saponification reaction were conducted in different reactor systems (
Figure 7,
Figure 8 and
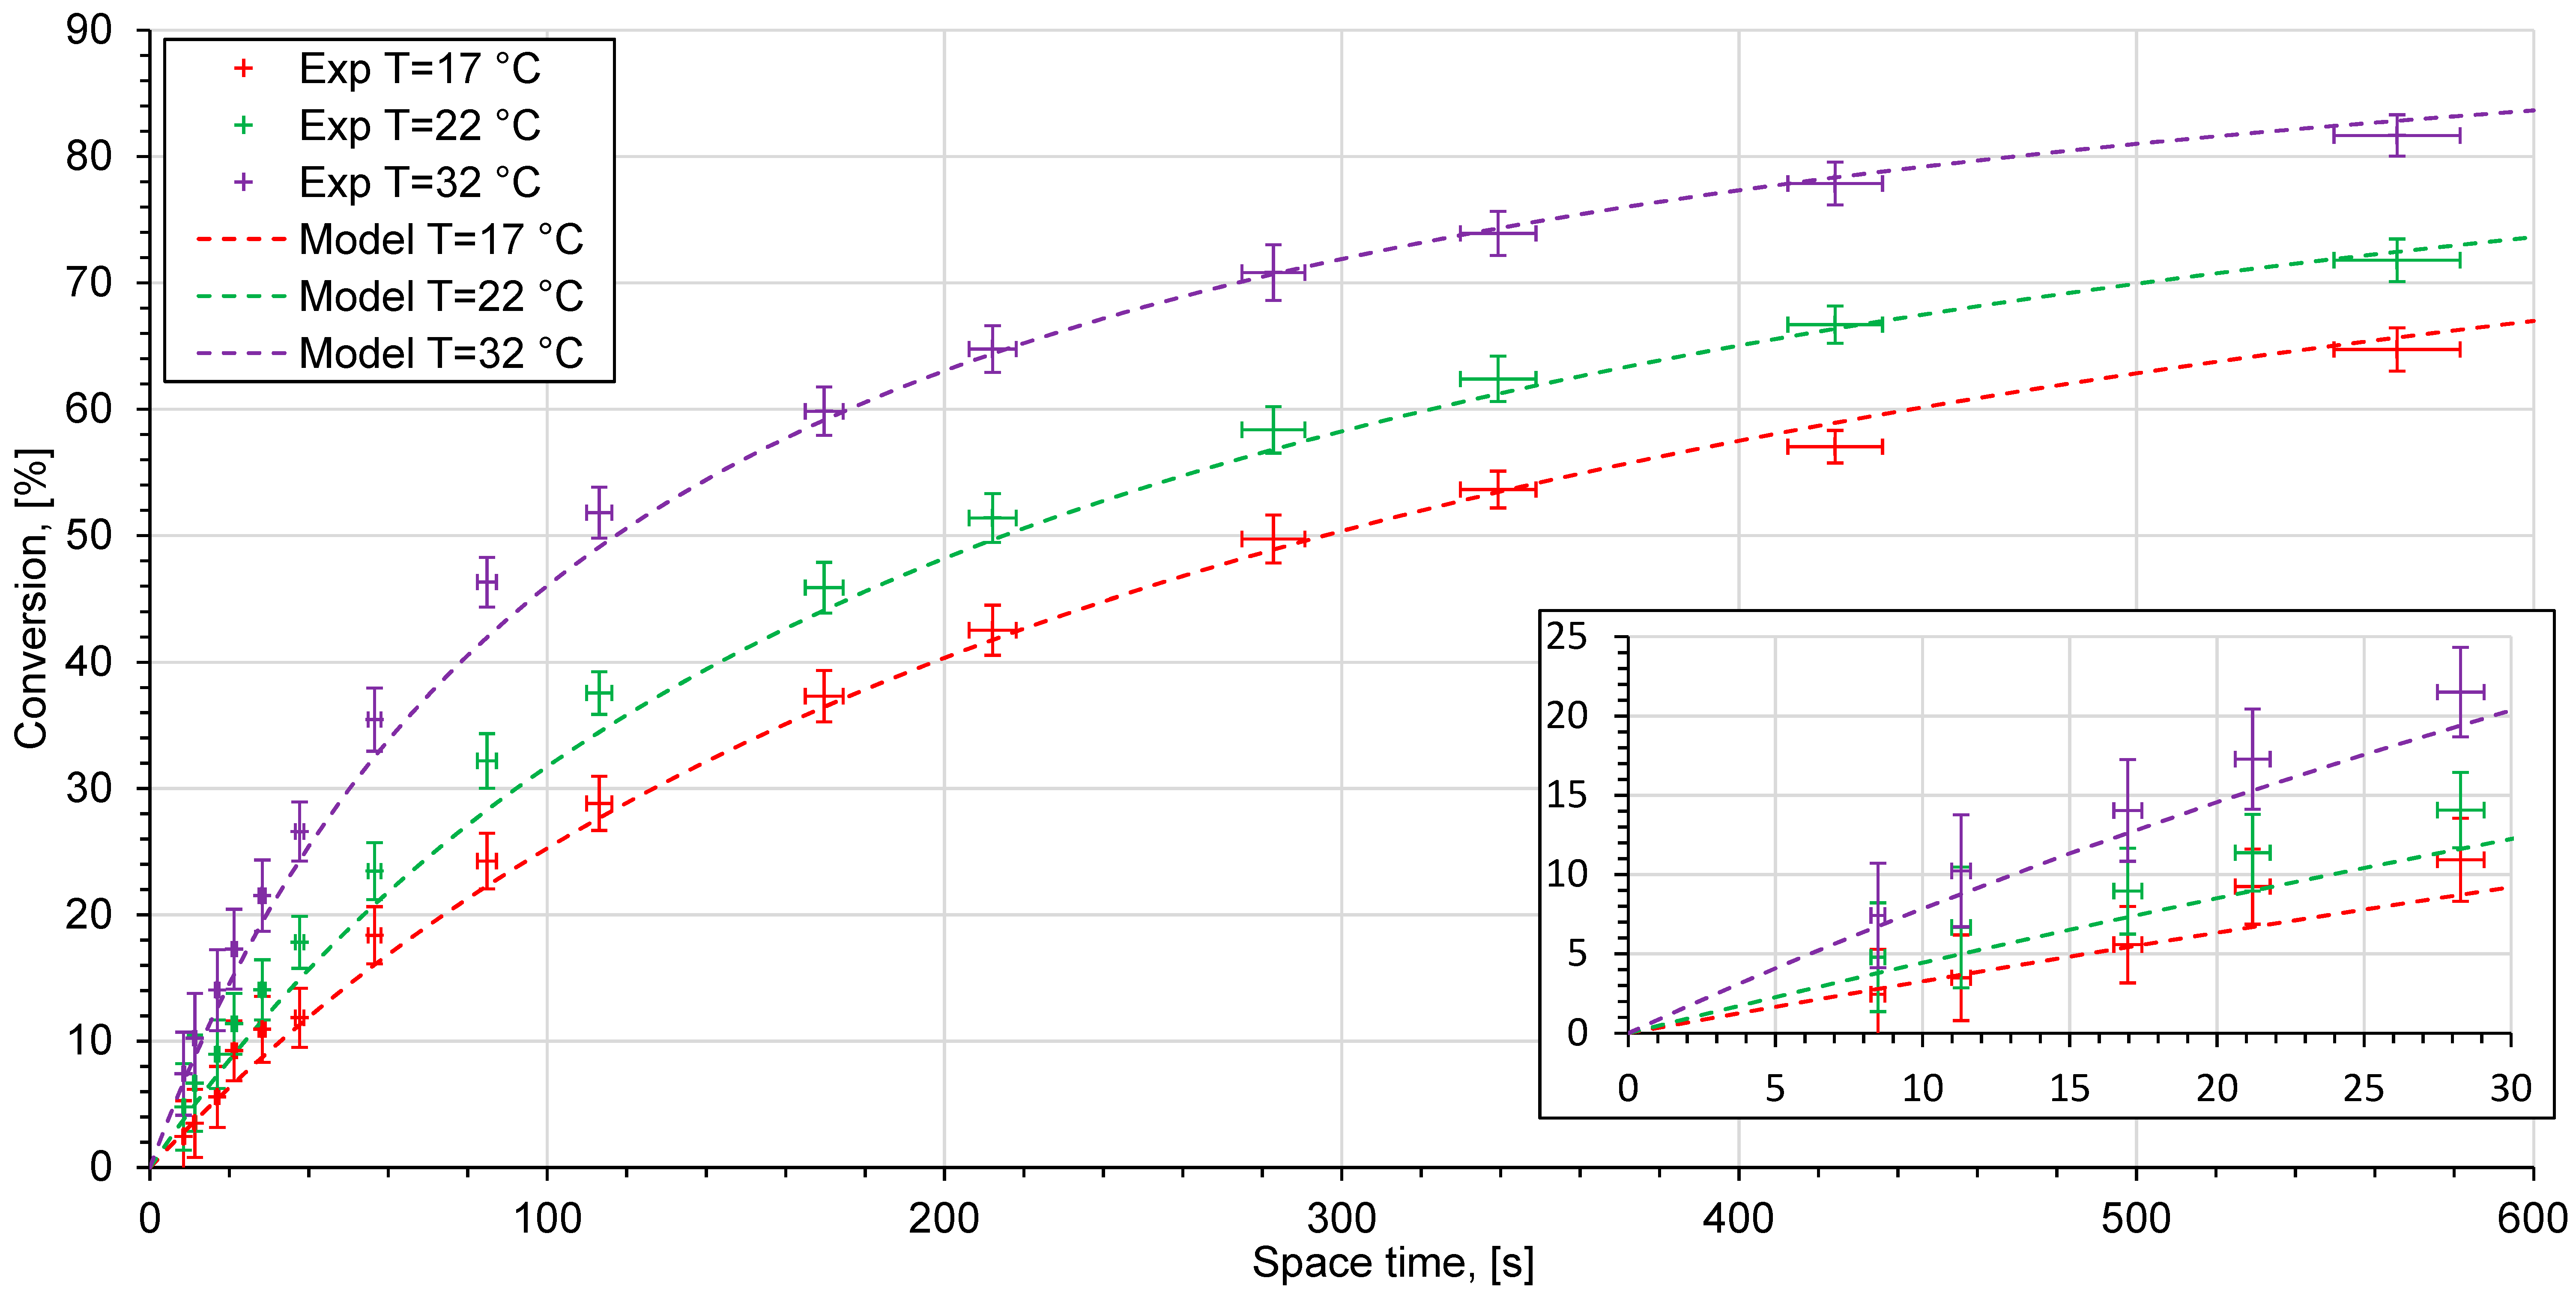
Figure 9). The experimental data are given as points with error bars. Horizontal error bars represent inaccuracies in the experimental determination of the volumes of the whole reactor system: the reactor, the residence time unit, the tube connectors, and the conductivity cell. Vertical error bars consider uncertainties of conductivity measurements and inaccuracies of conductivity measurements for 0% and 100% conversion solutions from
Figure 6. The dashed lines represent the reactor model, based on the kinetic modeling using the Arrhenius parameters which were obtained from the kinetic study. Since the experimental points lie very close to each other, a zoomed in view at low space times is shown.
The measured conversion values in different reactor systems indicate the differences from the kinetic model. The reactor performance is considered as poor if the experimental points lie below the model curve. Otherwise, if the experimental points coincide, or are above the model curve the reactor system shows a good reactor performance.
The reactor system with a T-shaped reactor gives a good reactor performance only at high volume flow rates from 0.8 to 20 mL/min (space time from 8.3 to 55.5 s). At flow rates lower than 0.6 mL/min (space time longer than 278 s) and 17 °C, as well as at flow rates higher than 0.5 mL/min (space time longer than 332 s) at 22 °C, the experimental points lie below the model curve. This indicates this system’s low reactor performance.
Figure 10 shows the mixing state for different volume flow rates obtained using a micro camera. At a low flow rate, a clearly distinct interface between two solutions can be observed (
Figure 10a).
This corresponds to a low degree of mixing grade and indicates a strongly stratified flow, which is completely insufficient for mixing purposes [
34]. Since the T-shaped reactor serves as the main mixing element in this system, further mixing can only be enhanced by molecular diffusion and weak secondary flow formations in the residence time unit. Therefore, the mixing time at low volume flow rates is relative long, thus having a negative effect on sodium hydroxide conversion. At higher flow rates, a significant intensification of the mixing process can be observed (
Figure 10b). The flow consists of alternating layers of both solutions due to the formation of vortices in the cross-section. This flow is called vortex flow [
34]. The interfacial area between solutions becomes significantly larger, which results in enhanced molecular diffusion which takes place in the residence time unit. Conversion at a volume flow rate of 5 mL/min or higher (space time less than 33 s) is equal to the results according to the kinetic model at the same space time because of weak vortices. Moreover, higher volume flow rates cause more intensive secondary flow vortices inside the residence time unit. At a volume flow rate of 20 mL/min, an extremely fast mixing process takes place, due to a vortex manifold of different length scales (
Figure 10c). Therefore, mixing quality at 20 mL/min higher flow rate seems to be more efficient than at 5 mL/min.
There are differences between the experimental data and the model in the reactor system with a T-shaped reactor, and they can be observed at low flow rates and the highest investigated temperature (32 °C). At higher temperatures, the value of the diffusion constant increases. Since the primary mixing process occurs through molecular diffusion, the value of the diffusion constant may have a significant influence on the diffusion rate.
At high flow rates or short space times, several measurement points lie slightly above the model curve. A possible reason for this behavior is the fact that the hydrodynamics inside the conductivity cell can differ at various flow rates. A flow in a domain with a sudden contraction, a so-called back-step geometry, can cause the formation of recirculation and stagnation areas and other instabilities [
48]. The intensity of secondary flow raises at higher values and depends on the Reynolds number. Furthermore, the fluid elements which have become trapped in the stagnation zone can stay inside for a long time. This may cause a significant difference between the space time and the residence time in the reactor. The chemical reaction proceeds in stagnated fluid elements and the conversion of sodium hydroxide increases. This can contribute to measurement inaccuracies in conductivity measurements, especially when the stagnation and measurement areas are located in the same place as in the present study. The impact of this may result in higher reaction rate constants in the T-shaped reactor than those obtained in the kinetic model. Both of the effects described above persist in all of the experimental setups and are likely to belong to a systematic error present in all investigated experimental setups (
Figure 8,
Figure 9 and
Figure 10).
Figure 8 shows the experimental data for a sodium hydroxide conversion over time in a microreactor system with an interdigital microreactor. Compared to the experimental data seen in the setup with a T-shaped reactor, there is no significant decrease in conversion values at low volume flow rates. The mixing process in the interdigital microreactor is based on the multilamination mixing principle and striation thickness reduction. The interdigital microreactor was developed especially for operation at low flow rates [
16]. It gives a sufficient mixing rate across the entire range of the volume flow rates studied. The conversion values which have been achieved indicate good reactor performance.
The measured conversion values versus space time in the experimental setup using a chicane microreactor are shown in
Figure 9. The volume flow rate could be varied over a wider range, starting at 0.3, and reaching 20 mL/min. The experimental data indicates a good match of the experimentally achieved conversion with the results of the modeling. This type of microreactor has a chicane channel structure and belongs to a reactor type which is based on chaotic advection and is designed to be utilized at high flow rates. Nevertheless, even when flow rates are small, the chicane mixing channel provides good reactor performance due to a greater mixing rate, which is much faster than the reaction rate seen in a saponification reaction.
Figure 11 shows the mixing process carried out at different volume flow rates in the initial region of the chicane microreactor, after passing through two rows, each with 33 cells. When there is a strongly stratified flow at a flow rate of 0.1 mL/min, the mixing quality is clearly low. The interface between the solutions is blurred due to the long diffusion time at low flow rate (
Figure 11). With a higher flow rate of 5 mL/min, a significant change in hydrodynamics is observed, starting from the first cell (
Figure 11). In this case, eddy structures of chaotic advection can be observed. The desired homogeneous mixing state is achieved after passing only a few mixing elements. The remaining elements are not necessary for mixing.
In summary, the utilization of a complex microreactor system is not necessary to provide good mixing performance of slow homogeneous chemical reactions. For example, the reaction time of ethyl acetate saponification using sodium hydroxide (both solutions are 0.1 M) at a temperature of 17 °C is approximately 303 s. Even the investigated T-shaped reactor, coupled with a tube of 1.6 mm at high volume flow rates, provides a much faster mixing rate than reaction rate, resulting in good reactor performance but small conversions. In this case, the reaction is mainly limited by the reaction rate and a so-called chemical regime is provided [
49]. On the other hand, there are discernible differences between the experimental data and the kinetic model at low flow rates in the reactor system with a T-shaped reactor, indicating a lack of mixing under these conditions. In this case, reactor performance depends on both chemical kinetic and mass transport in the reactor, providing higher conversions due to lower volume flow rates. Behavior such as this is called the chemical/diffusional regime [
49]. In this case, several additional mixing elements, or a more complex reactor structure, are necessary to give a much faster mixing rate than the reaction rate [
14,
19,
49,
50].
The parallel multilamination mixing principle, which is utilized in the interdigital microreactor, provides fast mixing across the entire range of the investigated volume flow rates. In the microreactor system with a chicane microreactor, mixing intensification is mainly excessive. Homogeneous mixing can be achieved after the elements of the chicane channel are first mixed at all volume flow rates. The remaining elements serve as a residence time unit with complex geometry. A similar microreactor with a lower number of chicane mixing elements could be sufficient to carry out such a slow reaction.
Similar results for reactor systems based on microfluidic devices were observed in the article by Schwolow et al. [
38]. The authors evaluated mixing time lower than one second at high flow rates. Comparing these mixing times with the reaction time-scale needed for the ethyl acetate saponification, it can be concluded that such a fast mixing rate is not necessary for such a slow reaction. Regardless, reaction systems with interdigital and chicane microreactors provide mixing of constant quality. This is especially important at lower volume flow rates because under these conditions, higher conversions can be achieved.
3.2. Effect of Volume Flow Rate on Pressure Drop
Pressure drop is a physical process in which flow energy dissipates due to frictional shear forces within the channel. A higher pressure drop in a reactor system requires higher pump power, tougher materials and as a result, increased financial operational and production costs [
16].
Therefore, pressure drop is an important parameter which should be considered in microfluidic systems [
43].
The mechanical energy in laminar flow in a reactor system dissipates mainly via two processes: the laminar flow wall friction
and the chaotic secondary flow vortex structures
[
4]:
The first term is proportional to the volume flow rate, while the second term shows a quadratic dependency of the volume flow rate. The simplified model, which is based on the model seem in the article by Kockmann et al. [
4], can be formulated as follows:
where a denotes the term which relates to the wall friction, and b characterizes the secondary vortices intensity.
The experimental and calculated pressure drop values over the volume flow rate in different reactor systems are shown in
Figure 12. The flow which consumes the least energy in the reactor system is based on the T-shaped reactor because it has the simplest structure and the largest characteristic lengths of 2.8 mm, compared to other microreactors. In this reactor type, pressure drop is less than 0.1 bar at flow rates of up to 10 mL/min. At higher volume flow rates, the formation of hydrodynamic vortices dramatically increases the pressure drop within this type of reactor. Therefore pressure drop dependency of the volume flow rate becomes quadratic.
In the microreactor system with an interdigital microreactor, the pressure drop is much higher since the characteristic length of the microchannels is several times smaller. The extremely small dimensions of microchannels cause higher wall friction due to their larger wall area. This leads to a higher flow of mechanical energy consumption, which is shown by the pressure drop.
The highest-pressure drop is observed in the microreactor system with a chicane microreactor. The reason for this is found in the structure of the chicane mixing channel, which is specially designed for building vortices. Increasing the volume flow rate causes a significant growth in the vortices’ intensity in flow, resulting in higher energy dissipation due to larger frictional losses via chaotic advection.
The wall friction and secondary chaotic friction factors of the model used are listed in
Table 6. The reactor system with a T-shaped reactor provides the lowest values of both factors. The relatively small wall area of this reactor causes low wall friction. Due to the structure of the reaction system, an intense vortex pattern only appears in the T-shaped reactor. A slight growth in pressure drop in the system with a T-shaped reactor is observed at flow rates higher than 15 mL/min. This is because the intensity of chaotic advection greatly depends on the volume flow rate. In the interdigital microreactor, a high number of parallelly combined microchannels inside the microreactor provides a large area-to-volume ratio. Therefore it is possible to achieve a much higher value for the wall friction factor in this microreactor compared to other reactor systems. At the same time, the small channel dimensions provide a more intensive formation of vortex structures within an interdigital microreactor than seen in the setup with a T-shaped reactor. Consequently, both wall friction and chaotic advection play a similar role with regard to pressure drop in the interdigital microreactor. In the chicane microreactor, the vortex factor has a remarkably higher value, likely due to its mixing principle, which is mainly based on intensive chaotic advection in the chicane mixing channel. A rapid growth in pressure drop in this type of system over the volume flow rate begins at a flow rate of 4.5 mL/min. However, due to the geometry of the chicane channel, the area-to-volume ratio is high as well, providing a higher value of wall friction factor than in the reactor systems with a T-shaped reactor or an interdigital microreactor.


