Article

Sensitivity Analysis of a Numerical Model for Percutaneous Auricular Vagus Nerve Stimulation

1
Department of Information Technology Ghent University/imec, Ghent 9052, Belgium
2
Research Group Biomedical Sensing, Institute of Electrodynamics, Microwave and Circuit Engineering, TU Wien, Vienna 1040, Austria
3
Department of Surgery, Medical University Vienna, Vienna 1090, Austria
*
Author to whom correspondence should be addressed.
Appl. Sci. 2019, 9(3), 540; https://doi.org/10.3390/app9030540
Submission received: 7 January 2019 / Revised: 29 January 2019 / Accepted: 1 February 2019 / Published: 6 February 2019
(This article belongs to the Section Applied Biosciences and Bioengineering)

Abstract

:
Background: Less-invasive percutaneous stimulation of the auricular branch of the vagus nerve (pVNS) gained importance as a possible nonpharmacological treatment for various diseases. The objective is to perform a sensitivity analysis of a realistic numerical model of pVNS and to investigate the effects of the model parameters on the excitation threshold for single and bundled axons. Methods: Sim4Life electrostatic solver and neural tissue models were combined for electromagnetic and neural simulation. The numerical model consisted of a high-resolution model of a human ear, blood vessels, nerves, and three needle electrodes. Investigated parameters include the axon diameter and number, model temperature, ear conductivity, and electrodes’ penetration depth and position. Results: The electric field distribution was evaluated. Model temperature and ear conductivity are the non-influential parameters. Axons fiber diameter and the electrodes’ penetration depth are the most influential parameters with a maximum threshold voltage sensitivity of 32 mV for each 1 μm change in the axon diameter and 38 mV for each 0.1 mm change in the electrodes’ penetration depth. Conclusions: The established sensitivity analysis allows the identification of the influential and the non-influential parameters with a sensitivity quantification. Results suggest that the electrodes’ penetration depth is the most influential parameter.

Graphical Abstract

1. Introduction

The vagus nerve is an important constituent of the autonomic nervous system and plays a major role in the regulation of metabolic homeostasis. The sympathetic and parasympathetic (vagal) branches of the autonomic nervous system control and regulate the function of glands, organs, and involuntary muscles throughout the body [1]. Specific stimulation of the afferent vagus nerve can trigger both inhibitory and excitatory modulation of the autonomic nervous system. Vagus nerve stimulation may thus reduce pain [2], increase blood perfusion [3,4], and downregulate inflammation [5,6], all highly beneficial, for instance, in the treatment of chronic pain or peripheral arterial disease.
Today, cervical vagus nerve stimulation by implanted stimulators is used as a non-pharmacological treatment for drug-resistant epilepsy, congestive heart failure, and major depression [7,8]. Less-invasive ways of stimulation were developed to minimize the stimulation risks by using electrodes in targeted regions of the auricle and access afferent Aβ fibers of the auricular branch of the vagus nerve (ABVN) [9,10,11]. A shortcoming of current applications of ABVN stimulation is the mostly empirical selection of both the stimulation regions in the ear and the stimulation patterns with mostly unknown variations of therapeutic/physiologic effects, which may lead to overstimulation with unfavorable recruitment of pain-related Aδ fibers or under-stimulation. Omnipresent inter-patient variability is neglected, while safety margins when stimulating different fibers are missing. To elevate the understanding of stimulation mechanisms, a realistic numerical model for percutaneous auricular vagus nerve stimulation (pVNS) at the human auricle including nerves and vessels was recently developed by our group [12]. The study provides a better understanding of the electric potential and current distribution in tissues surrounding the stimulation electrodes. For the first time, the quantitative sensitivity of the stimulation thresholds and the percentage of activated axons to the electrodes’ depth and position were reported.
However, due to the dense innervation of the auricle with various nerves, high sensitivity and specificity of stimulation is of huge importance [11]. By stimulation of different nerves, opposite physiological reactions and an even adverse therapeutic outcome may be elicited. Thus, a sensitivity analysis (SA) of the numerical model is an invaluable tool to better quantify the dependence of the numerical model developed in Reference [12] to different parameters. SA is used to link the uncertainty in the model output to different sources of uncertainty in the model parameters [13,14,15,16]. It is also used to identify the most contributing input parameter and to ascertain the interaction effects within the model. Thus, we can achieve better model verification and understanding, factor prioritization, and model simplification.
The objective of this study is to perform a SA of a numerical model for pVNS. We start by specifying the input parameters range of values. Then we investigate the effects of the axon fiber diameter, number of axons, model temperature, ear conductivity, as well as electrodes’ penetration depth and position on the stimulation thresholds for single and bundled axons. The final goal is to identify and prioritize the most influential parameters, to identify non-influential parameters in order to fix them to nominal values, and to map the output behavior as a function of the parameters by limiting the input range values to a specific domain if necessary.

2. Materials and Methods

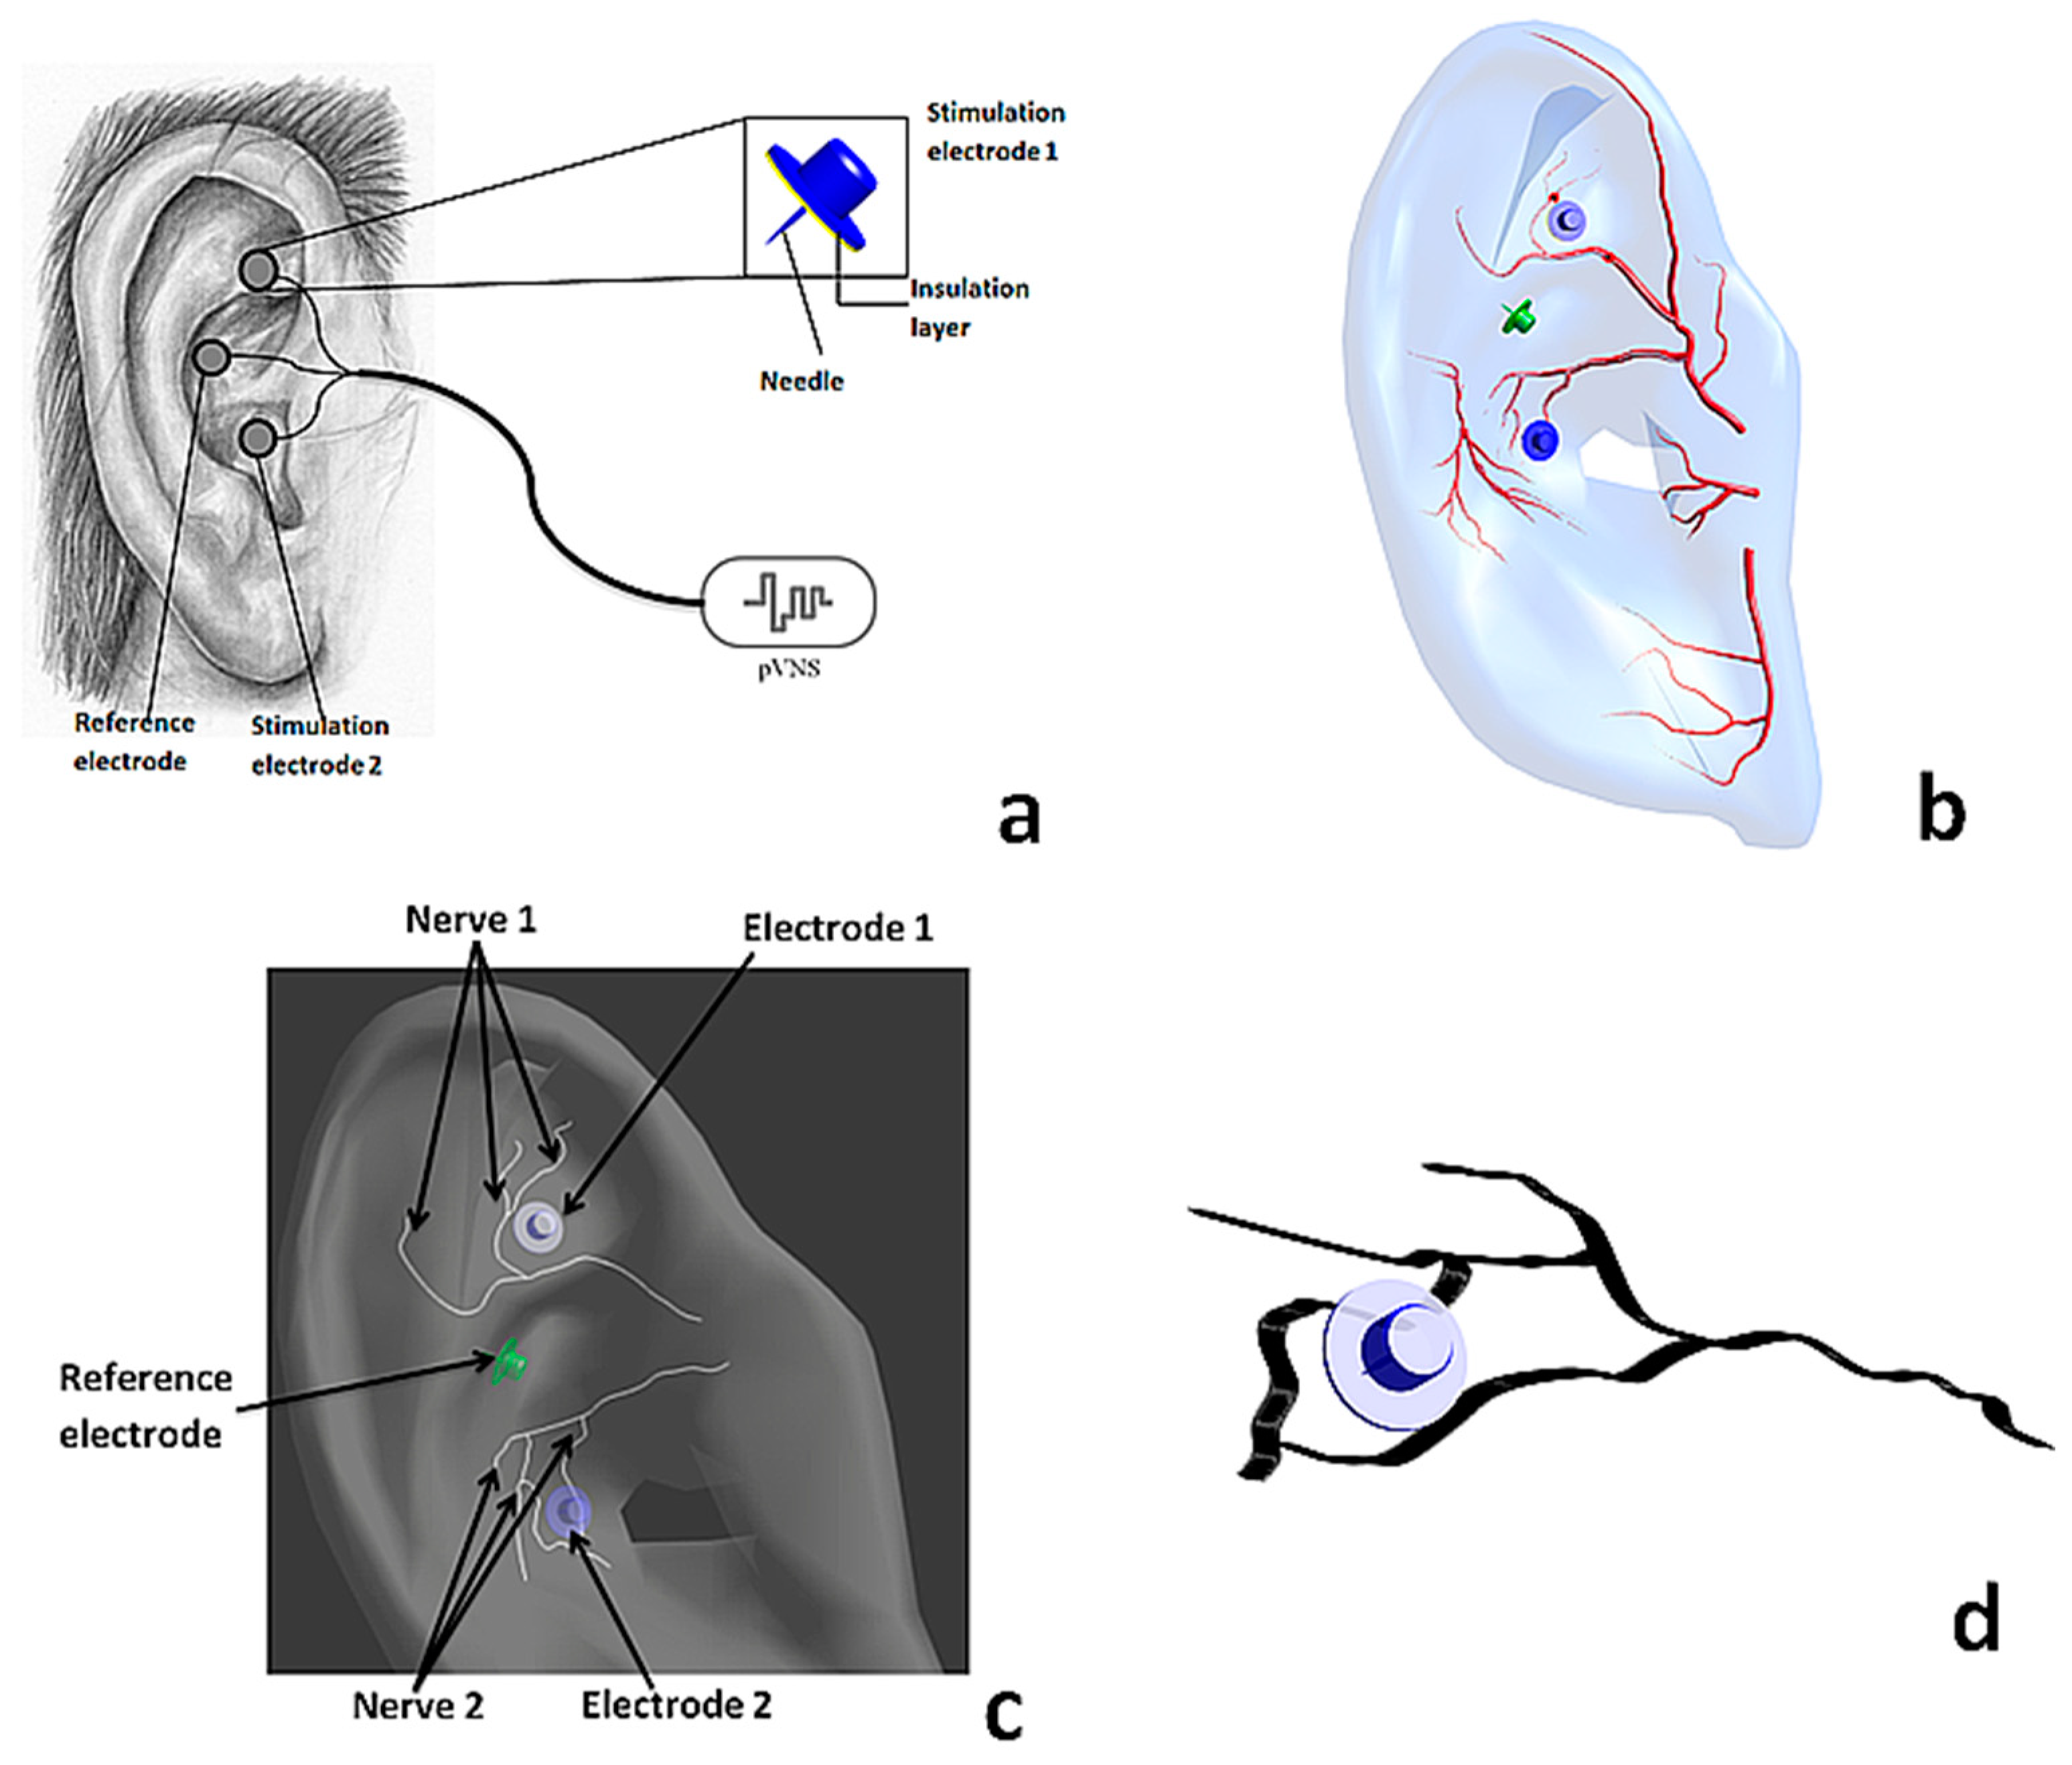
2.1. Simulation Platform

We used the Sim4Life platform [17] to conduct the numerical simulations. Electromagnetic simulations were performed using the low frequency solver. Neuronal simulations were performed using the neuronal tissue models from Sim4Life. The time response of the axonal membrane potential to external injected currents was simulated using the spatially extended nonlinear node (SENN) [18,19] model. The threshold amplitude of a pulse to depolarize the axons was calculated using the titration mechanism. Titration consists of stimulating a neuron with a varying series of pulses to find the threshold above which a single action potential is generated. The titration process provides a scaling factor of the actual modulated current needed to generate an action potential. Details of the simulation platform can be found in Reference [12]. The SENN model is based on the Frankenhaeuser and Huxley [19,20] equations to describe the time course of the membrane potential at all nodes of a myelinated fiber given by
d V n d t = 1 C m [ G a ( V n 1 2 V n + V n + 1 + V e , n 1 2 V e , n + V e , n + 1 ) G m V n ]
where V n is the voltage difference across the membrane at node n. It is equal to
V n = V i , n V e , n
C m ,   G a , and G m are given by
G m = g m π d l
G a = π d 2 4 ρ i L
C m = c m π d l
where
  • V i , n and V e , n are the internal and external nodal voltages, respectively;
  • C m is the nodal capacitance;
  • G a is the axial internodal conductance;
  • G m is the nodal membrane conductance;
  • t is time;
  • d is the axon diameter;
  • L is the internodal distance;
  • g m is the membrane conductivity (30.4 mS/ cm 2 );
  • l is the nodal gap (2.5 μm);
  • ρ i is the axoplasm resistivity (110 Ω·cm); and
  • c m is the membrane capacity (2 μF/ cm 2 ) [18,19].

2.2. Numerical Model

Figure 1 shows an overview of the numerical model. We used a realistic high-resolution model of a human ear (spatial resolution 3 mm), three electrodes (E1, E2, and reference electrode E3), and a spatial model of the major blood vessels and nerves. The conductivity of the vessels and ear was set to 0.7 S/m and 0.2 S/m, respectively. Shapes and locations of the nerves (Nerve 1: N1 and Nerve 2: N2) are shown in Figure 1b,c based on an exemplary nerve supply and vascularization of the human auricle [11,21,22]. Stimulation was performed with a single monophasic voltage pulse (amplitude = 1 V, anodic pulse, and duration 1 ms) and a single biphasic voltage pulse (amplitude = ±1 V, anodic phase precedes cathodic phase, and duration of the biphasic pulse is 1 ms). A number of axons was defined from a rectangular seed region close to the stimulation electrodes to generate an axon population composing nerves, based on the axon count used for the SA. According to Reference [23], a space equal to the diameter of a single axon is modelled between two adjacent axons to simulate a dense axon population.

2.3. Sensitivity Assessment of the Numerical Model

A sensitivity analysis of the numerical model parameters is critical to model the robustness and validity. It also serves to guide future research on the most influential of these factors. The method used to assess the sensitivity of the numerical model to the parameters’ fluctuation and uncertainty is to repeatedly change one parameter at a time while keeping the others fixed (at an average value). We increase the parameter by a given step and we observe the change in model output, which is the stimulation threshold for single axons and the stimulation threshold for 100% recruitment volume for the whole axon population. This figure of merit represents a good quantification of the parameter model and variability [14]. A sensitivity index (SI) is calculated (as percentage) for each parameter as follows:
S I p a r a m e t e r = O m a x O m i n O m a x
where O m i n and O m a x are minimum and maximum output values, respectively, resulting from changing the respective input over its selected range. The output values are defined as the stimulation threshold for single axons and the stimulation threshold for a 100% activation of an axon population, respectively. The largest SI values correspond to a high degree of sensitivity of the output values to the given input. This figure of merit represents a good quantification of the parameter model and variability [14]. Two more quantifications were used for the variation of the stimulation thresholds to achieve 100% axon activation: relative variation of the stimulation thresholds compared to an average value ( Δ B ) and relative variation between the thresholds of two adjacent inputs (Δ). These two quantities show the variation in the stimulation threshold compared to a reference value and between thresholds of two consecutives inputs. The investigated SENN model parameters include the axon fiber diameter, number of axons, axon population region size, and SENN model temperature.
For each of the above parameters, a range of values, an average (AV), and an incremental step were determined from literature and summarized in Table 1:
  • Safi et al. [24] provided the number of targeted myelinated Aβ axons with diameter ≥ 7 μm [25] of the auricular vagus nerve branch in the left and the right ear for nine evaluated individuals.
  • The model temperature was changed based on recent investigations of the variation in normal ear temperature measured in 2006 individuals [26].
The ear conductivity was changed from 0.1 S/m to 0.7 S/m based on Reference [27]. The needle penetration depth of E1 and E2 inside the ear was changed from 1.5 to 0.8 mm in steps of 0.1 mm [12]. The lateral position of the electrodes (E1 and E2) was also changed from the original position by ±0.1 mm in the y and z directions, with a maximum of (±0.1, ±0.1) mm [12].

3. Results

3.1. Electric Field Distribution

Figure 2 shows the electric field distribution. The E-field is directed from the anodic electrodes (E1 and E2 at 1 V) to the reference electrode (E3 at 0 V). Vessels and nerves near E2 are more exposed to the electric fields than those in the E1 region. Maximum field values occur near the electrodes (89 V/m near E1 and 98 V/m near E2) and are penetrating inside the ear, vessels, and nerves. N2 branches are in locations with higher electric field values compared to branches of N1.

3.2. Sensitivity of the Stimulation Thresholds for Single Nerves

Table 2 summarizes the sensitivity indices for all investigated parameters. In the following sections, these indices will be discussed and compared.

3.2.1. Effect of the Fiber Diameter

Figure 3 shows the effect of the fiber diameter on the stimulation thresholds for N1 and N2. The axon fiber diameter was changed from 7 μm to 12 μm in steps of 0.5 μm. Results show that the stimulation thresholds decrease with increasing fiber diameter. Biphasic pulses require slightly less amplitude to stimulate the nerves than the monophasic pulses (0.24%–0.88% and 0.28%–2.54% less for biphasic for N1 and N2, respectively). N2 is stimulated with lower amplitudes than N1 for the two types of pulses (with a fiber diameter of 8 μm, for example, the stimulation thresholds are 0.89 V and 0.88 V for N1 and 0.82 V and 0.80 V for N2). The sensitivity index for this parameter and for each configuration is in average equal to SI d _ axon _ 1 = 13 % and SI d _ axon _ 2 = 17 % for N1 and N2, respectively. N2 is more sensitive to the axon fiber diameter.

3.2.2. Effect of the Temperature

Figure 4 shows the effect of the temperature on the stimulation thresholds for N1 and N2. The SENN model temperature was changed from 35.6 °C to 37 °C in steps of 0.2 °C. Simulations were performed using the axon diameter of 8 μm. Results show only a small impact of the temperature on the stimulation threshold for this range of values (0.9% and 0.7% change over the entire temperature range for N1 and N2, respectively). Changes in stimulation thresholds occurred only for 35.6 °C (0.7%) and 37 °C (0.4%) for N2. Stimulation thresholds were more irregular over the temperature range for N1 than N2 (3 changes in the stimulation thresholds for N1 compared to one change for N2). The sensitivity index for this parameter for each configuration is equal to SI T _ axon _ 1 = 0.9 % and SI T _ axon _ 2 = 0.7 % for N1 and N2, respectively.

3.2.3. Effect of the Tissue Conductivity

Figure 5 shows the effect of the ear conductivity on the stimulation thresholds. Only a very small change in the stimulation thresholds occurred (0.11% over the entire range 0.1–0.7 S/m). The sensitivity index for this parameter is equal to SI conductivity = 0.1 % for monophasic and biphasic configurations and both N1 and N2.

3.3. Sensitivity of the Percentage of Stimulated Axons

3.3.1. Effect of the Fiber Diameter

Figure 6 shows the amplitudes needed to obtain 100% activation for an axon population in N2 as a function of the axon fiber diameter from 7 μm to 12 μm in steps of 0.5 mm. Δ B and Δ refer to the relative variation compared to the average value (8 μm) and between two adjacent diameters, respectively. Similar results for single axons were found for the axon population. The figure shows decreasing stimulation thresholds as a function of the axon fiber diameter for monophasic and biphasic pulses. Maximum deviation from the average value and between two adjacent diameters (5.88%) was obtained for the fiber diameter of 8.5 μm. The sensitivity index for this parameter is equal to SI d _ population _ 1 = 14 % and SI d _ population _ 2 = 13 % for monophasic and biphasic configurations, respectively.

3.3.2. Effect of the Axons Number

Figure 7 shows the amplitudes for 100% activation of the axon population in N2 as a function of the axon number from 21 to 133 in steps of 18 (half the standard deviation of the axons number range). Δ B and Δ refer to the relative variations compared to the average value (68 axons) and between two adjacent numbers, respectively. The stimulation thresholds increase as a function of the number of axons. Monophasic pulses require slightly higher amplitudes than biphasic pulses (1%–1.94% less for biphasic pulses). Maximum deviation from the average value (68 axons) and between two adjacent diameters was obtained for 57 axons (0.27%). The sensitivity index for this parameter is equal to SI Numb _ population = 18 % for monophasic and biphasic configurations.

3.3.3. Effect of the Model Temperature

Figure 8 shows the effect of the temperature on the stimulation thresholds for the axon population in N2. The temperature was changed from 35.6 °C to 37 °C in steps of 0.2 °C. We used 68 axons with a diameter of 8 μm. As seen in the results for single axons, the effect of temperature is less significant than the axon diameters’ effect (SI of 14% and 0.7% for axon diameter and temperature, respectively). The threshold was almost stable in the whole range except for the change at 35.8 °C and 36 °C. The sensitivity index for this parameter is equal to SI T _ population = 0.7 % for both monophasic and biphasic configurations.

3.3.4. Effect of the Electrodes’ Position and Depth on the Percentage of Activated Axons

Figure 9 shows the effect of the electrodes’ depth on the stimulation thresholds for the axon population in N1 and N2. Simulations were performed using anodic and cathodic monophasic pulses. E1 and E2 penetration depth were changed from 1.5 mm to 0.8 mm inside the ear with a step of 0.1 mm. The sensitivity index for the E1’s depth is equal to 20.1% and 21.5% for the anodic and cathodic stimulations, respectively. For the E2’s depth, the sensitivity index is equal to 24% and 23.8% for the anodic and cathodic stimulations, respectively. This yields an average value for the sensitivity index of the electrodes’ depth of SI E _ depth = 22.3 % .
Figure 10 shows the stimulation thresholds for 100% axon activation for N1 and N2 as a function of the electrodes’ position with ±0.1 mm displacements. For each electrode, some positions provide lower stimulation thresholds than the original position (positions (0.1, 0.1), (0, 0.1), and (0.1, 0) for E1 and positions (0, −0.1), (−0.1, 0), and (−0.1, −0.1) for E2). The sensitivity index for the E1’s position is equal to 4.7% and 7.3% for the anodic and cathodic stimulations, respectively. For the E2’s position, the sensitivity index is equal to 6.1% and 7.9% for the anodic and cathodic stimulations, respectively. This yields an average value for the sensitivity index of the electrodes’ position of SI E _ position = 6.5 % .

4. Discussion

For the first time, a sensitivity study of a numerical model for pVNS has been performed. Electric field distribution shows that highest electric field values appear near the needle with a fast decline over distance, which is due to the point effect on the needle. Locations of the N2 branches shows higher electric fields compared to the N1’s branches locations.
Results show decreasing stimulation thresholds with increasing axon fiber diameter (a decrease of 17% over the entire range of 7–12 μm for N2). An examination of Equations (3)–(5) shows that the three components C m ,   G a , and G m are proportional to fiber diameter d ( G a d since Ld) [19]. Since C m ,   G a , and G m occur only in Equation (1) as ratios, changes in the axon fiber diameter affect the solution only through its relation to the internodal distance L. The only effect of the changing axon diameter is then in the calculation of the external potential at the nodes. For a point electrode (in situ) and homogenous current distribution, the external nodal potential is given by [19]
V e = I ρ e 4 π r
where ρ e is the resistivity of the external medium surrounding the neuron, I is the stimulus current, and r is the electrode-node distance. The induced voltage along the nodes and thus the associated transmembrane voltage will be decreased quite considerably for the 7 μm axon diameter compared to the 12 μm axon diameter since the internodal distance L is greater in the latter case. Thus, the excitability will be decreased for the axons of lower diameter.
Biphasic stimulation requires slightly less amplitude to stimulate the nerves than the monophasic pulses. This indicates that bend-mode and end-mode stimulation may dominate as well as that the single-phase duration is sufficiently long for excitation to develop. The axon population around N2 was slightly more sensitive in the monophasic configuration than in the biphasic configuration. Similar behavior was also recorded in our previous study and explained by the additional chance for stimulation at the reversal phase for the biphasic pulses compared to the monophasic pulses [12]. Since cathodic stimulation has lower thresholds than anodic stimulation (in the straight-mode stimulation), the varying polarity of stimulus (biphasic stimulus) increases the probability of firing in comparison with the constant polarity (monophasic stimulus). N2 was activated with lower amplitudes than N1 using both monophasic and biphasic patterns. This is due to its branches being at the location with higher electric field values compared to the branches of N1 (Figure 2). N2 was more sensitive to the axon fiber diameter than N1. This can be explained by its exposure to higher electric field values; thus, the effect of small changes in the axons’ diameters can be enhanced by these higher values of E-fields. However, due to the decreasing behavior of the plots in Figure 3, one can see that SI depends only on the stimulation thresholds for 7 μm and 12 μm. Thus, SI will mostly reflect changes occurring between these two edges of the axon diameter interval.
In the range of interval between 0.1 S/m and 0.7 S/m, the ear conductivity has the lowest effect on the stimulation thresholds among all the parameters (change of 0.1% over the entire range of 0.1–0.7 S/m). In fact, as suggested by de Santis et al. [27], any value of the skin in the range 0.1–0.7 S/m will not considerably alter the E-fields. Works on the effect of skin conductivity in a low frequency exposure assessment for peripheral nerve tissue [28] show that the choice of skin conductivity significantly affects the induced electric field, resulting in an increasing factor of three in the induced electric field when using a skin conductivity of 0.0002 S/m instead of 0.1 S/m. However, since the ratio of maximum to minimum values in Reference [28] is two orders higher than in our study (ratio of maximum to minimum is 7 and 500 for 0.1–0.7 S/m and 0.0002–0.1 S/m, respectively), we expect the induced electric field to change way less in our study compared to in Reference [28]. The effect of skin conductivity on the induced electric field for peripheral nerve exposure was also investigated in Reference [29] using a skin conductivity of 0.1 S/m and 0.2 S/m. Results of the study in Reference [29] show maximum changes in the electric field of 4%. However, the values reported in Reference [29] concern the maximum (99% value) induced electric field for an adult model completely inside shielded whole-body x-, y-, and z-gradient coils. Furthermore, the ear conductivity is less likely to change a lot in the range of 0.1–0.7 S/m between individuals. Thus, dielectric properties of the ear have no effect on the stimulation thresholds and the axons’ recruitment volume.
Results of Figure 7 show that the stimulation thresholds increase with an increasing number of axons. By increasing the number of axons, we also increase the size of the axon population region and we expand the location of the axon population. Some axons will then be located in regions of lower electric fields. By increasing the size of the axon population region, we are more likely to find axons in different E-field iso-layers, which will enhance the differences between the axons’ stimulation thresholds.
The temperature and ear conductivity are the non-influential parameters in the specified range of values. Maximum change in the stimulation threshold is equal to 8 mV (0.9%) and 1 mV (0.1%) over the entire range for the temperature and ear conductivity, respectively. The electrodes’ position is a more influential parameter with an SI equal to 6.5% over the entire range and less than 7 mV for 0.1 mm shift in the electrodes’ position. The number of axons seems to be the more influential parameter than the axon diameter (18% is the maximum change in the stimulation threshold for 100% axon activation over the entire range). However, this parameter has a wider range of values than the axon diameter (number of axons is in the range 21–133 while the axon diameter is from 7 μm to 12 μm). If we adjust the SI with the range of values for each parameter, the axon fiber diameter sensitivity will become 1.5 mV for each axon and 25.6 mV for each 1 μm diameter. The frequency distribution of the axon fiber diameters from 7–12 µm shows that more than 60% of the ABVN axons have a diameter between 7 μm and 8 μm [24]. In this range, the maximum variation in the stimulation threshold for 100% axon activation is 32 mV, which represents a 3.2% relative variation. The electrodes’ penetration depth is the most influential parameter with a maximum variation of 38 mV for each 0.1 mm penetration depth. Clinical data show that 38 mV is a rather small voltage change. Stimulations are typically applied with several 100 mV up to several Volts. In some cases, steps of approximately 50 mV can be perceived by the patients.

5. Conclusions

A sensitivity analysis of a realistic numerical model for a pVNS application was performed. The numerical model was used to investigate the excitation threshold in single and bundled axons with respect to the axon fiber diameter, axon number, SENN temperature, electrodes’ penetration depth and position, and the ear conductivity. Results show that the stimulation thresholds increase with an increasing number of axons and a decreasing axon fiber diameter. The SENN model temperature and the ear conductivity effect are negligible compared to the effect of the axon fiber diameter and the electrodes’ penetration depth. The electrodes’ penetration depth is the most influential parameter with maximum sensitivity of 38 mV for each 0.1 mm and bundled axons. The sensitivity analysis results show the high importance of the electrodes’ position to prevent opposite physiological reactions and an even adverse therapeutic outcome by unfavorable stimulation of pain-related fibers or under-stimulation. The proposed model does not consider any network between the nerves and relies on the SENN model for transmembrane mechanisms and axon activation. Future works will further evaluate the numerical model by comparing numerical results with experimental data using clinical studies. Additional stimulation patterns (pulses with equal energy and triphasic pulses) and bursted stimulation will also be investigated to perform both experimental validation and mutual optimization of the model and the experimental setup.

Author Contributions

A.M.S., S.K., E.T., J.C.S., L.M., E.K., and W.J. conceived and designed the simulations; A.M.S. performed the simulations; A.M.S., S.K., E.K., E.T., and W.J. analyzed the data; A.M.S., S.K., E.T., J.C.S., L.M., E.K., and W.J. contributed reagents/materials/analysis tools; A.M.S. wrote the paper.

Funding

The research was supported by COST Action BM1309 (COST EMF-MED) and the FWO G003415N project. E. Tanghe: is a postdoctoral fellow of the Research Foundation-Flanders (FWO-V).

Conflicts of Interest

J.C.S., E.K., and S.K are shareholders and receive remunerations from SzeleSTIM GmbH. The authors declare no conflict of interest.

References

  1. Berthoud, H.; Neuhuber, W. Functional and chemical anatomy of the afferent vagal system. Auton. Neurosci. 2000, 85, 1–17. [Google Scholar] [CrossRef]
  2. Sator-Katzenschlager, S.M.; Michalek-Sauberer, A. P-Stim auricular electroacupuncture stimulation device for pain relief. Expert Rev. Med. Devices 2007, 4, 23–32. [Google Scholar] [CrossRef] [PubMed]
  3. Payrits, T.; Ernst, A.; Ladits, E.; Pokorny, H.; Viragos, I.; Längle, F. Vagal stimulation—A new possibility for conservative treatment of peripheral arterial occlusion disease. Zentralblatt für Chirurgie 2011, 136, 431–435. [Google Scholar] [CrossRef] [PubMed]
  4. Széles, J.; Litscher, G. Objectivation of cerebral effects with a new continuous electrical auricular stimulation technique for pain management. Neurol. Res. 2004, 26, 797–800. [Google Scholar] [CrossRef] [PubMed]
  5. Tracey, K. Reflex control of immunity. Nat. Rev. Immunol. 2009, 9, 418–428. [Google Scholar] [CrossRef] [PubMed] [Green Version]
  6. Zhao, Y.; He, W.; Jing, X.; Liu, J.L.; Rong, P.J.; Ben, H.; Liu, K.; Zhu, B. Transcutaneous Auricular Vagus Nerve Stimulation Protects Endotoxemic Rat from Lipopolysaccharide-Induced Inflammation. Evid.-Based Complement. Altern. Med. 2012, 2012, 1–10. [Google Scholar] [CrossRef] [PubMed]
  7. Groves, D.; Brown, V. Vagal nerve stimulation: A review of its applications and potential mechanisms that mediate its clinical effects. Neurosci. Biobehav. Rev. 2005, 29, 493–500. [Google Scholar] [CrossRef] [PubMed]
  8. De Ferrari, G.; Crijns, H.; Borggrefe, M.; Milasinovic, G.; Smid, J.; Zabel, M.; Gavazzi, A.; Sanzo, A.; Dennert, R.; Kuschyk, J.; et al. Chronic vagus nerve stimulation: A new and promising therapeutic approach for chronic heart failure. Eur. Heart J. 2011, 32, 847–855. [Google Scholar] [CrossRef]
  9. Ellrich, J. Transcutaneous Vagus Nerve Stimulation. Eur. Neurol. Rev. 2011, 6, 254. [Google Scholar] [CrossRef]
  10. Kampusch, S.; Kaniusas, E.; Széles, J. New Approaches in Multi-Punctual Percutaneous Stimulation of the Auricular Vagus Nerve. In Proceedings of the 6th International IEEE EMBS Conference on Neural Engineering, San Diego, CA, USA, 6–8 November 2013; pp. 263–266. [Google Scholar]
  11. Peuker, E.; Filler, T. The nerve supply of the human auricle. Clin. Anat. 2002, 15, 35–37. [Google Scholar] [CrossRef]
  12. Samoudi, A.M.; Kampusch, S.; Tanghe, E.; Széles, J.C.; Martens, L.; Kaniusas, E.; Joseph, W. Numerical modeling of percutaneous auricular vagus nerve stimulation: A realistic 3D model to evaluate sensitivity of neural activation to electrode position. Med. Biol. Eng. Comput. 2017. [Google Scholar] [CrossRef] [PubMed]
  13. Saltelli, A.; Chan, K.; Scott, E.M. Sensitivity Analysis; Wiley Series in Probability and Statistics; Wiley: Hoboken, NJ, USA, 2000. [Google Scholar]
  14. Hamby, D.M. A review of techniques for parameter sensitivity analysis of environmental models. Environ. Monit. Assess. 1994, 32, 135–154. [Google Scholar] [CrossRef] [PubMed] [Green Version]
  15. Iooss, B.; Lemaitre, P. A review on global sensitivity analysis methods. Uncertainty Management in Simulation-Optimization of Complex Systems: Algorithms and Applications. In Uncertainty Management in Simulation-Optimization of Complex Systems; Springer: Berlin, Germany, 2015. [Google Scholar]
  16. Cacuci, D.G. Sensitivity theory for nonlinear systems. I. Nonlinear functional analysis approach. J. Math. Phys. 1981, 22, 2794. [Google Scholar] [CrossRef]
  17. Sim4Life, Zurich Med Tech. Available online: www.zurichmedtech.com/sim4life/ (accessed on 3 January 2019).
  18. Reilly, J.; Freeman, V.; Larkin, W. Sensory Effects of Transient Electrical Stimulation—Evaluation with a Neuroelectric Model. IEEE Trans. Biomed. Eng. 1985, 32, 1001–1011. [Google Scholar] [CrossRef] [PubMed]
  19. McNeal, D. Analysis of a Model for Excitation of Myelinated Nerve. IEEE Trans. Biomed. Eng. 1976, 23, 329–337. [Google Scholar] [CrossRef] [PubMed]
  20. Frankenhaeuser, B.; Huxley, A.F. The action potential in the myelinated nerve fiber of Xenopus Laevis as computed on the basis of voltage clamp data. J. Physiol. 1964, 171, 302. [Google Scholar] [CrossRef] [PubMed]
  21. Tilotta, F.; Lazaroo, B.; Laujac, M.; Gaudy, J. A study of the vascularization of the auricle by dissection and diaphanization. Surg. Radiol. Anat. 2009, 31, 259–265. [Google Scholar] [CrossRef]
  22. Alvord, L.; Farmer, B. Anatomy and orientation of the human external ear. J. Am. Acad. Audiol. 1997, 8, 383–390. [Google Scholar]
  23. Chaturvedi, A.; Foutz, T.; McIntyre, C. Current steering to activate targeted neural pathways during deep brain stimulation of the subthalamic region. Brain Stimul. 2012, 5, 369–377. [Google Scholar] [CrossRef] [Green Version]
  24. Safi, S.; Ellrich, J.; Neuhuber, W. Myelinated Axons in the Auricular Branch of the Human Vagus Nerve. Anat. Rec. 2016, 299, 1184–1191. [Google Scholar] [CrossRef] [Green Version]
  25. Erlanger, J.; Gasser, H.S. Electrical Signs and Nervous Activity; Univ of Pennsylvania Press: Philadelphia, PA, USA, 1938. [Google Scholar]
  26. Levander, M.S.; Grodzinsky, E. Variation in Normal Ear Temperature. Am. J Med. Sci. 2017, 354, 370–378. [Google Scholar] [CrossRef] [PubMed]
  27. Santis, V.; Chen, X.; Laakso, I.; Hirata, A. An equivalent skin conductivity model for low-frequency magnetic field dosimetry. Biomed. Phys. Eng. Express 2015, 1, 015201. [Google Scholar] [CrossRef]
  28. Schmid, G.; Cecil, S.; Überbacher, R. The role of skin conductivity in a low frequency exposure assessment for peripheral nerve tissue according to the ICNIRP 2010 guidelines. Phys. Med. Biol. 2013, 58, 4703–4715. [Google Scholar] [CrossRef] [PubMed]
  29. Samoudi, A.M.; Vermeeren, G.; Tanghe, E.; Van Holen, R.; Martens, L.; Josephs, W. Numerically simulated exposure of children and adults to pulsed gradient fields in MRI. J. Magn. Reson. Imaging 2016, 44, 1360–1367. [Google Scholar] [CrossRef] [PubMed] [Green Version]
Figure 1. A numerical model of the percutaneous auricular vagus nerve stimulation (pVNS) application. (a) The scheme of the application. (b) The auricle, vessels, nerves, and the electrodes. Vessels and nerves are inside the ear and not on the surface of the ear. (c) The locations and shapes of the nerves: Nerve 1, N1 and Nerve 2, N2. Electrode 1, E1 and Electrode 2, E2, are the stimulating electrodes. (d) The details of the axon population N2 (refer to Table 1 for the number of axons and Figure 1c for the Nerve 2 location) and Electrode 2 (refer to Figure 1c for the Electrode 2 location).
Applsci 09 00540 g001
Figure 2. The electric field distribution, in dB normalized to 100 V/m: Electrodes 1 and 2 are at 1 V, and the reference electrode is at 0 V. Electrodes are completely inside the ear (electrode penetration depth 1.5 mm).
Applsci 09 00540 g002
Figure 3. The effect of the axon fiber diameter on the stimulation thresholds for N1 and N2.
Applsci 09 00540 g003
Figure 4. The effect of the temperature on the stimulation thresholds for N1 and N2.
Applsci 09 00540 g004
Figure 5. The effect of the ear conductivity on the stimulation thresholds for N1 and N2.
Applsci 09 00540 g005
Figure 6. The effect of the axon fiber diameter on the stimulation thresholds for the axon population around N2. Δ B and Δ refer to the relative variations compared to the average value (8 μm) and between two adjacent diameters, respectively.
Applsci 09 00540 g006
Figure 7. The effect of the axon numbers on the stimulation thresholds for the axon population around N2. Δ B and Δ refer to the relative variations compared to the average value (68) and between two adjacent diameters, respectively.
Applsci 09 00540 g007
Figure 8. The effect of the temperature on the stimulation thresholds for the axon population around N2. Δ B and Δ refer to the relative variations compared to the average value (36.3 °C) and between two adjacent diameters, respectively.
Applsci 09 00540 g008
Figure 9. The effect of the electrodes’ penetration depth on the stimulation thresholds for 100% axon activation using anodic and cathodic monophasic pulses.
Applsci 09 00540 g009
Figure 10. The effect of the electrodes’ position on the stimulation thresholds for 100% axon activation using anodic and cathodic monophasic pulses. (a) Effect of electrode1 position on the stimulation thresholds for 100% axon activation, (b) Effect of electrode2 position on the stimulation thresholds for 100% axon activation.
Applsci 09 00540 g010
Table 1. The range, average (AV), and the incrementation step for each parameter used in the sensitivity analysis.
ParameterRangeAVStepReference
Number of axons (1)21–1336818[24]
Axon fiber diameter (μm)7–1280.5[24]
Model temperature (°C)35.6–3736.30.2[26]
Ear conductivity (S/m)0.1–0.70.40.1[27]
Electrode penetration depth (mm)0.8–1.5- *0.1[12]
Electrode position (mm)(±0.1, ±0.1)00.1[12]
* For sensitivity index simulations of other parameters the electrode penetration depth was fixed to 1.5 mm.
Table 2. Sensitivity index (SI) for the respective input parameters.
ParameterSI (%)
Diameter of axon (N1, single axon)13
Diameter of axon (N2, single axon)17
Temperature (N1, single axon)0.9
Temperature (N2, single axon)0.7
Ear conductivity (single axons)0.1
Diameter (nerve population, monophasic)14
Diameter (nerve population, biphasic)13
Number of axons18
Temperature (nerve population)0.7
Electrode penetration depth (nerve population) *22.3
Electrode position (nerve population) *6.5
* The SI for the electrode penetration depth and position are an averaged value of the E1 and E2 penetration depth and position sensitivity using anodic/cathodic monophasic pulses.

