Article

Identification and Description of Outliers in the Densmore Collection of Native American Music

by
Kerstin Neubarth
1 and
Darrell Conklin
2,3,*
1
Europa-Universität Flensburg, 24943 Flensburg, Germany
2
Department of Computer Science and Artificial Intelligence, University of the Basque Country UPV/EHU, 20018 San Sebastian, Spain
3
IKERBASQUE, Basque Foundation for Science, 48013 Bilbao, Spain
*
Author to whom correspondence should be addressed.
Appl. Sci. 2019, 9(3), 552; https://doi.org/10.3390/app9030552
Submission received: 30 November 2018 / Accepted: 1 February 2019 / Published: 7 February 2019
(This article belongs to the Section Acoustics and Vibrations)

Abstract

:
This paper presents a method for outlier detection in structured music corpora. Given a music collection organised into groups of songs, the method discovers contrast patterns which are significantly infrequent in a group. Discovered patterns identify and describe outlier songs exhibiting unusual properties in the context of their group. Applied to the collection of Native American music collated by Frances Densmore (1867–1957) during fieldwork among several North American tribes, and employing Densmore’s music content descriptors, the proposed method successfully discovers a concise set of patterns and outliers, many of which correspond closely to observations about tribal repertoires and songs presented by Densmore.

1. Introduction

Computational ethnomusicology refers to the development and exploitation of technological tools and computational methods for accessing, analysing and documenting world musics [1]. Early, pre-digital, approaches were largely championed by anthropologists and musicologists, including pioneering applications to Native American language and music such as the possibly earliest adoption of the phonograph [2], phonophotographic analysis of recorded songs [3] and quantitative studies of song corpora [4]. During recent decades, the field has often been dominated by technological and computational perspectives, applications have been seen as lacking a clear musicological motivation and results have been described as “solutions in search of a problem” ([1], p. 12). This paper explores synergies between pre-digital quantitative music studies and research in data mining: it revisits Frances Densmore’s collection and analysis of Native American music using computational pattern discovery and outlier detection.
Frances Densmore (1867–1957), regarded as one of the leading experts on Native American music in her time ([5], p. 45), collected music to support its preservation and further study by scholars as well as contemporary composers [6]. In her work for the Bureau of American Ethnology [7,8,9,10,11,12,13,14,15,16,17,18], she “selected typical tribes in the principal areas of the United States and gave special attention to recording their old songs and preserving the information concerning their use” ([19], p. 176). In addition to transcriptions of songs and contextual information, Densmore published systematic analyses of many songs and suggested common characteristics of tribal repertoires and interesting features of individual songs (see example in Figure 1). Densmore’s quantitative comparison of songs by different tribes (Figure 1 bottom) can productively be seen as an instance of contrast pattern mining [20]. Within the repertoire of a tribe, songs may be distinguished by features which are surprisingly rare, unusual or peculiar (Figure 1 top right), that is, they deviate from common characteristics of the tribe’s songs and thus represent outliers [21]. Figure 1 gives an example: in the Papago group, songs with a harmonic structure (with chord-based intervals between contiguous accented tones) are under-represented in comparison with other tribal repertoires and hence unusual. In this paper we present a method for detecting and describing outliers in grouped data based on infrequent contrast patterns and illustrate this method in an application to Densmore’s collection and analyses of Native American music.
Compared to classical tasks in collection-level music analysis such as clustering [22,23,24,25,26], classification [27,28,29,30,31] and pattern matching and discovery [32,33,34,35,36,37], outlier detection has attracted less attention in music computing research [38]. Outlier detection has been mainly used for cleaning datasets from noisy or erroneous examples in order to improve performance of subsequent classification, music recommendation or sound sampling [39,40,41,42,43]. A recent study of outliers in world music [44] focused on quantitative distributions of outliers in and between countries; outlier descriptions at country level were derived by listening to selected recordings. In this respect the study resembled the situation in wider research on computational outlier analysis which largely neglects outlier description in favour of outlier detection [45].
The current paper outlines a method which integrates identification and symbolic description of outliers. More specifically we introduce an outlier detection method which exploits significantly infrequent contrast patterns to both identify and describe songs in a music collection which show unusual properties in the context of related songs (Section 3). The method is applied to the Densmore collection of Native American music (Section 2), and discovered outliers are presented with reference to Densmore’s writings (Section 4). The proposed method complements previous work in outlier detection and music pattern discovery, and findings from its application to Densmore’s collection illustrate its potential for studies in computational ethnomusicology (Section 5).

2. Densmore’s Collection and Analysis of Native American Music

To study Native American music, Densmore carried out field observation and recorded songs, which she subsequently transcribed and analysed ([6], p. 191). Many of the resulting materials were published in bulletins of the Bureau of American Ethnology (BAE), Smithsonian Institution, with which she became associated as a collaborator in 1907 [5]. As evident from Table 1, the publications were collated over almost half a century and cover an extensive repertoire of Native American music, spanning the continent from the West coast to the Great Lakes and the Southeast. Generally songs were collected on reservations. As an exception, the publication on Pueblos music represents songs from the Isleta, Cochiti and Zuñi Pueblos in New Mexico but is based on recordings undertaken in Washington and Wisconsin: records of 16 Acoma songs made available by Dr. M. W. Stirling, director of the BAE, and recordings made by Densmore during the Stand Rock Indian Ceremonial at Wisconsin Dells, in which members of Pueblos tribes took part [18].
Metadata   Densmore’s publications provide a range of metadata on individual songs, such as a unique catalogue number for each song, a serial number within the respective bulletin, information related to collecting a song (e.g., the name of the singer) and the use of the song (e.g., song type or context of use). This study primarily considers the tribes among which songs were collected, following the structure of the bulletins to partition the corpus into groups: focusing on songs covered by Densmore’s systematic analyses, the corpus in the current study comprises 1700 songs, organised into eleven groups (Table 1).
Transcriptions   The transcriptions presented in Densmore’s publications (see example in Figure 1, top right) are generally based on phonograph recordings, where possible taking into account multiple renditions of a song. Densmore transcribed the recordings into standard musical notation, occasionally using special signs to indicate slight deviations in pitch or duration. While standard notation does not systematically reflect microtonal or timbral aspects of performances, it provides an accessible format ([6], p. 192) and serves as a basis to analyse the melodic trend, principal rhythm and general character of songs which are maintained across renditions ([7], p. 3). In our work we use Densmore’s transcriptions during data preparation to disambiguate uncertain feature assignments in her analyses and to replace selected missing values.
Music content analysis of songs   In her systematic analyses of the collected songs, Densmore applied various analysis criteria relating to tone material, melody and rhythmic-metric aspects. Criteria were chosen which can be analysed for large numbers of songs ([15], p. 37). For these attributes Densmore determined an attribute value for each song. The bulletins record these analyses by serial number, listing against each attribute value the songs matching the respective value (Figure 1 top left). In the current study we consider 13 of Densmore’s attributes which are documented across the majority of bulletins (Table 2). While Densmore’s analyses are remarkably consistent, given the extended period of time from the 1910s to the late 1950s, the selection and terminology of attributes and their values vary slightly between bulletins. To allow analysis of feature distributions across the groups, attribute names and values were harmonised. Missing attributes were added based on the song transcriptions where feasible; the remaining cases are explicitly encoded as missing the attribute value.
Tabular comparative analyses   The music content analysis of songs serves as a preliminary to Densmore’s tabular analyses ([4], p. 549); an example of her quantitative comparison between songs of different tribes is shown in Figure 1 (bottom left). Generally, Densmore compared the repertoire under consideration against all previously analysed songs. These analyses reveal features which are over- or under-represented in a tribe compared to other tribes and can contextualise outlying examples and their description. Please note that Densmore’s comparisons depend on the chronology of publications, analysing a tribe against songs published in earlier bulletins—e.g., Northern Ute songs against the combined Chippewa and Sioux songs—rather than against all other songs in the complete corpus of 1700 songs to which outlier detection is applied in the current study.
Textual commentary   The transcriptions of songs as well as the comparative analyses are accompanied by narrative descriptions of songs or groups (Figure 1 right), which serve as a reference for the interpretation of our data mining results. It should be noted that these descriptions are selective rather than exhaustive, i.e., they do not necessarily cover all analysis attributes nor do they always assess observed features as either typical or unusual. Thus, they are more suited to support qualitative than quantitative evaluation of discovered outliers.

3. Outlier Identification and Description with Infrequent Contrast Patterns

The method presented in this paper discovers local outliers in group-labelled data, using infrequent contrast patterns: given a set of songs organised into groups, it finds songs distinguished by one or more properties which are unexpectedly rare in the relevant group. The method is summarised in Figure 2, outlining the partitioning of the dataset in preparation of contrast mining and outlier detection.

3.1. Data Representation and Organisation

Each song in the database is encoded by multiple attributes. Attributes are categorical (such as musical material, e.g., major pentatonic scale); numeric attributes are discretised into value ranges (such as compass of a song, e.g., between a fifth and an octave). If for a song an attribute is undetermined its value is explicitly marked as missing. For convenience, an attribute-value pair (e.g., material: major_pentatonic) will be called a feature; a feature set is a set of features (e.g., {material: major_pentatonic, compass: five_to_eight_tones}). A song satisfies a feature if it is described by the attribute-value pair; it satisfies a feature set if it satisfies all features in the set. The number of songs satisfying a feature set is called the support count of the feature set.
In addition, each song is associated with a group label. Labels can refer to e.g., different ethnic or language groups, geographical regions, diachronic periods or song types. The group labels are used to partition the dataset for contrast mining and outlier detection, as illustrated in Figure 2: each group in the dataset is taken in turn as the target group G and compared against a background ¬ G formed by the union of all other groups. Thus, in a dataset organised into k groups, the mining performs k one-vs-all comparisons [46] to discover infrequent contrast patterns and outlying songs for each of the groups. Interestingly, Densmore’s group-level analyses generally are also carried out as one-vs-all comparisons (see example in Figure 1, bottom).

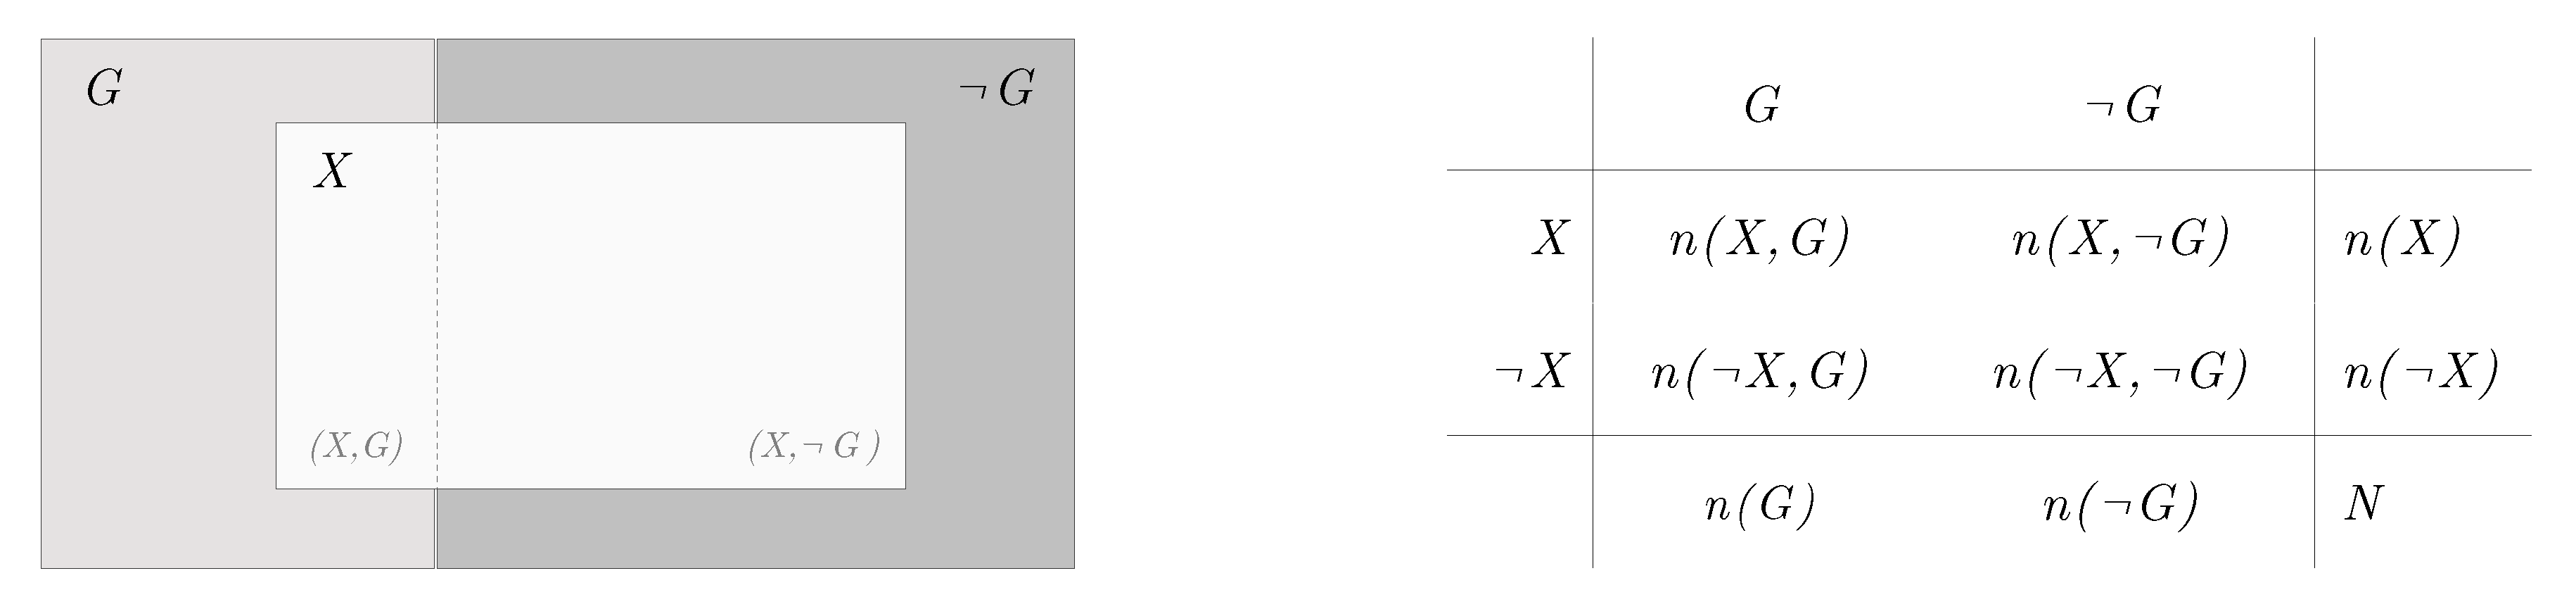
3.2. Discovery of Significantly Infrequent Contrast Patterns

A pattern is a feature set associated with a group. A pattern is infrequent in a group if the proportion of songs in the group which support the feature set is low. However, if the feature set is infrequent across the complete dataset, its low frequency in the group is trivial, not specific to the group. Thus, we are particularly interested in feature sets which are proportionally less frequent in the target group than in the background; feature sets satisfying this condition will be called infrequent contrast patterns.
Figure 3 (left) illustrates the concept schematically. The two larger boxes represent the target group G of songs labelled with the respective group label (light grey box) and the remaining corpus ¬ G of songs in other groups (dark grey box). The inner white box indicates the songs satisfying a feature-set pattern X. For the purposes of outlier detection and description, the pattern should cover a proportionally smaller part in the target group than in the background, that is ( X , G ) relative to G should be smaller than ( X , ¬ G ) relative to ¬ G . Figure 3 (right) indicates the 2 × 2 contingency table underlying the evaluation of pattern candidates: the table maps the occurrence of a pattern X in a target group G and the background ¬ G . Here N denotes the total number of songs in the corpus, n ( G ) the number of songs in group G, n ( X ) the number of songs in the complete corpus which satisfy pattern X and n ( X , G ) the number of songs in group G which satisfy pattern X. The marginal counts in the table are adjusted to take into account songs with missing values in one or more attributes represented in the candidate pattern: for these songs it cannot be determined whether or not they satisfy the feature-set pattern, i.e., whether they satisfy X or ¬ X , and thus they should not be considered in counts n ( ¬ X , G ) and n ( ¬ X , ¬ G ) , and consequently n ( G ) , n ( ¬ G ) and N.
A contrast pattern is significantly infrequent if its low frequency in the group is less than expected given the pattern’s frequency in the corpus and the size of the group relative to the complete corpus. Statistical significance is evaluated by applying Fisher’s exact test (left tail): the p-value computed by the test gives the probability of observing at most n ( X , G ) songs in G satisfying X, given the (adjusted) marginal counts n ( X ) , n ( G ) and N. A pattern is considered a significantly infrequent contrast pattern if the p-value is below a specified threshold α . As testing multiple hypotheses, or candidate patterns, increases the probability of finding one or more false positives (family-wise error rate), the threshold α is adjusted using a Bonferroni correction.
Figure 4 provides a concrete example of p-value computation for a real pattern in Densmore’s analysis. This is the pattern {structure: harmonic} for the group Papago, which also appears in Figure 1 (group-level analysis). Here the marginal counts are n ( Papago ) = 167 and n ( structure : harmonic ) = 184 , and the corpus size is N = 987 . Figure 4 shows how the p-value varies under different hypothetical support counts for the pattern in the group. The actual support count (9, solid vertical bar) in the corpus gives a low p-value: therefore this pattern would be significantly infrequent ( α = 0.01 ) and suggests that songs with the pattern {structure: harmonic} are outliers among Papago songs. Support counts of 20 or more (dashed vertical bar) are not significant ( α = 0.01 ): the 20 or more songs would not be considered outliers to the group.

3.3. Pattern Pruning and Outlier Detection

The output of the infrequent contrast pattern mining is used to identify outlying songs: the discovered patterns are unexpectedly rare in the relevant group, thus songs satisfying these patterns may be outliers with respect to other members of the group.
The set of all significantly infrequent patterns includes redundant patterns. To reduce the pattern set considered in the outlier detection, two pruning strategies are applied. First, the pattern set is restricted to minimal significantly infrequent contrast patterns, i.e., with the least number of features, in order to reduce redundancy between discovered patterns and to enhance comprehensibility of outlier descriptions by focusing on concise patterns [47]: a significantly infrequent feature-set pattern is minimal if none of the feature subsets is significantly infrequent. Second, support-based pruning is employed: a maximum support count threshold θ is set such that only patterns with n ( X , G ) θ are considered. The value of θ depends on the analysis interest: a low support count threshold restricts the mining output to individual outliers, i.e., songs characterised by patterns which are satisfied by only a few exceptions in a group. A higher threshold, on the other hand, also captures sets of outliers, i.e., several outlying songs sharing the same patterns.
To detect outliers given the pruned pattern set, the proposed method iterates over the set of contrast patterns and the songs in the respective group which satisfy the patterns, assigning to each song all satisfied patterns. A song is considered an outlier in its group if it satisfies one or more statistically significant infrequent contrast patterns. The patterns used to identify outlying songs at the same time provide a direct description of their unusual properties.

4. Outliers in the Densmore Collection of Native American Music

The proposed outlier detection method was applied to the Densmore corpus of 1700 Native American songs which are organised into eleven groups, as described in Section 2. The results presented here are obtained with a significance level of α = 0.01 and maximum support count threshold θ = 15 . Table 3 lists the significant minimal contrast patterns discovered in the analysis corpus. For reference, Table 3 gives both the proportion of songs satisfying the respective pattern in the group and their proportion in the background: in each case the proportion in the group is significantly lower than the frequency in the background of all remaining groups. The focus on minimal patterns favours short patterns, providing concise descriptions; the listed patterns consist of single features or feature pairs. Inspection of the outliers identified and described by these infrequent patterns supports several observations, which are summarised in the following sections.

4.1. Outlier Songs with Unusual Features

Table 4 lists several outliers characterised by single-feature patterns whose descriptions can be related to similar observations in Densmore’s writings. For example, the Nootka song ID1337 “is a lively, interesting melody, with a compass of 10 tones, and begins on the highest tone of the compass [the third above the octave], which is unusual” ([16], p. 93, our emphasis). Densmore’s description of the Papago song ID1027 explicitly refers to the context of the song’s group: “The song is harmonic in structure, which is unusual in the present series” ([13], p. 112, our emphasis). If underlying a categorical attribute is an inherently ordinal scale the outlying feature may represent a value towards the margins of the scale: the Choctaw song ID2357 “has a compass of 11 tones which is the largest in the Choctaw songs” ([17], p. 140, our emphasis). Similarly, the compass of ten tones in the Yuman song ID1241 is “larger than any other song in the analysed group” ([15], p. 196, our emphasis).
For some discovered outliers the outlier description is reflected in Densmore’s comments on the song without Densmore explicitly identifying a feature as rare. In several cases, however, the unusual occurrence of properties can be inferred from Densmore’s comments on other songs in the group. For example, while for the Nootka song ID1337 Densmore emphasises the unusual beginning on the tenth, for song ID1345 the same property is not explicitly described as being unusual though it can be assumed by analogy to ID1337. Still in other cases Densmore’s comments do not include the features highlighted in the outlier description. For example, Densmore’s narrative analysis of the Pueblos song ID1907 omits reference to the constant metre: “This is a pleasing melody with a simple rhythmic unit and a compass of nine tones. It progresses chiefly by whole tones, which comprise 19 of the 33 intervals. Next in frequency is a minor third” ([18], p. 27). Nevertheless, the outlier status of these songs is indirectly confirmed by Densmore’s group-level description: “A change of measure lengths occurs in 97 percent of these Pueblo songs […] and in only 80 percent of the combined group” ([18], p. 112); less than 3% of the analysed Pueblos songs (2 out of 82 songs) contain no change of metre, a smaller proportion than in any other group. Similarly, the infrequent beginning on the octave in Nootka and Quileute songs, such as songs ID1303 and ID1474, is highlighted at the group-level, here explicitly emphasising the under-representation of the feature: “With one exception, the Nootka and Quileute songs show the smallest percentage beginning on the octave above the keynote, only 6 percent having this beginning in contrast to 17 percent in the total number of songs previously analyzed” ([16], p. 42). Please note that these two songs satisfy not only one but two infrequent patterns (a mixed structure as well as the beginning on the octave), which suggest them to be outliers in their group.

4.2. Outlier Songs with Unusual Feature Combinations

While Densmore’s tabular analyses consider each attribute on its own (Figure 1 left), computational analysis supports systematic consideration of feature combinations. Table 5 lists six of the 16 outliers suggested by infrequent feature sets. In these cases it is not the individual feature which is rare but the co-occurrence of the features participating in the patterns; hence this is different from songs ID1303 and ID1474 in Table 4 which satisfy more than one infrequent single-feature pattern. For example, 68 (41%) of the Papago songs in the corpus end on the keynote, but only two of these, songs ID930 and ID954, start on the octave above the keynote. Among Menominee songs in the collection, 40% have a compass of between five and eight tones and 31% start with an ascending interval, but only 10% satisfy both of these features. In fact, in her description of song ID1609 Densmore points out that the compass of eight tones is shared among several Menominee songs. In the three examples in Table 5 in which Densmore highlights a property which is unusual (songs ID930 and ID1607) or interesting to note (song ID1632), her narrative description is more specific than the attributes underlying her quantitative analysis (firstReKey and firstDir): in song ID930, the initial tone is the octave above the keynote additionally characterised by the duration of a half note; for songs ID1607 and ID1632, the textual description further specifies the upward-directed motion at the beginning of the song by its interval. The results demonstrate that the computational outlier detection method can discover significantly infrequent feature sets, but generally mining for minimal infrequent contrast patterns favours short, even single-feature, patterns; in the current study, this facilitates the comparison of computationally discovered outliers with Densmore’s own analyses.

4.3. Performance and Encoding

Table 6 illustrates outliers pointing to challenges in the transcription or analysis of a song, or to peculiarities in the performance when the song was collected. For example, for the Chippewa song ID70 Densmore comments that “[the] tonality of this song is obscure. It is transcribed exactly as sung, the different renditions being identical, yet the key is not definitely established, neither are modulations indicated with sufficient clearness to be safely assumed” ([7], p. 80), hence the ending of the song cannot be related to a clearly defined keynote (lastReKey: irregular). In the Chippewa song ID125, the ambivalence between two keys arises from the presentation of the song, when the singer shifted pitch by a semitone between sections of the song. The resulting change in key from C minor to C sharp minor highlighted in Densmore’s narrative analysis is clearly reflected by the change of key signature in her transcription of the song (Figure 5).
The Choctaw songs in Densmore’s collection generally begin on an accented count of the measure ([17], p. 182); the song ID2271 is one of only eight (out of 65) Choctaw songs starting with an unaccented tone. However, of this song two renditions were recorded and transcribed, and only the first rendition indeed begins on an unaccented part of the measure, while the second starts on the first, accented, beat of the measure, thus following the more common trend of the Choctaw songs in the collection.

4.4. Context

Reference to metadata or contextual information can support further exploration of discovered outliers. The outliers listed in Table 7 provide some examples. Infrequent properties of outliers may be related to a different origin or type of song, a minority subset within the song’s class: Densmore’s publication on Yuman and Yaqui songs also presents three songs of the Mohave, including the Mohave song ID1289 with a compass of nine to twelve tones: “only four [Mohave songs] were recorded, as the Mohave songs were not a subject of special investigation. Three were transcribed […]. These Mohave songs have a somewhat larger compass and are more lively in general character than the songs of the other Yuman tribes under consideration” ([15], p. 183, our emphasis). As another example, the Teton Sioux song ID679 “is said to be the only lullaby used among the Sioux. […] This and song No. 204 [ID682] are the only songs in the present series having a compass of but four tones” ([9], p. 493, our emphasis). Song ID682 is a begging song with “a wailing melody, well calculated to wear out the patience of the listeners” ([9], p. 482).
Alternatively inspection of outlying songs sharing the same unusual features may reveal links between individual songs. Commenting on the Chippewa song ID280, Densmore remarks: “This melody contains three peculiarities which rarely occur in Chippewa songs. First, it begins and ends on the same tone [the keynote]. This feature is found in only 11 songs (3 per cent) of the entire series of 340” ([8], pp. 139–140, our emphasis). Among these 11 songs, songs ID102 and ID447 are in fact two versions of the same lullaby recorded at different reservations (Figure 6): “The only two songs which the Lac du Flambeau Chippewa were found to have in common with the White Earth Chippewa are the lullaby and the song accompanying the folk tale of We’nabo’jo and the ducks” ([8], p. 241). The ending on the keynote is common among Chippewa songs, thus the outlier description based on minimal infrequent patterns highlights the beginning on the keynote.

5. Discussion and Conclusions

The method introduced in this paper integrates outlier detection and description in grouped data based on infrequent contrast patterns. The outlier identification is unsupervised: the method is used for exploratory analysis of a music collection in which neither outliers nor inliers are known a priori.
Existing work in outlier detection has exploited both frequent and infrequent patterns: an example is less likely an outlier if it satisfies frequent patterns [48], or more likely an outlier if it satisfies infrequent patterns [49] or violates frequent patterns [50]. Despite the suitability of patterns for descriptive analysis, however, among the mentioned methods only FP-Outlier [48] explicitly includes outlier description: while the identification of outliers is based on frequent patterns satisfied by an example—with a larger number of satisfied frequent patterns making the example less likely to be an outlier—the description is based on frequent patterns not satisfied by the example (contradicting patterns), i.e., identification and description are based on different sets of patterns. In contrast, our method elegantly uses the same significantly infrequent patterns to both identify and describe outliers. Furthermore, our analysis interest is complementary to existing work on pattern-based outlier detection in grouped data. On the one hand, as unsupervised outlier identification the method differs from supervised or semi-supervised approaches which contrast a target group (known outliers or unlabelled examples) against a background assumed to contain no outliers (examples labelled ‘normal’) [51,52,53]. On the other hand, among unsupervised outlier detection methods it focuses on attribute outliers, i.e., examples with unusual attribute values or attribute-value combinations in the context of their group, rather than class outliers or class noise, i.e., examples with a deviating and potentially erroneous group label [54].
Applications of outlier detection to music generally assume numeric input data and employ instance- or model-based outlier detection methods [40,41,42,43]. In contrast to the pattern-based outlier analysis proposed here, the existing applications lack an explicit description of outlying examples.
Within computational ethnomusicology, our method builds on research in contrast pattern mining [55]. In particular, it complements work on antipatterns, i.e., patterns over-represented in the background or anticorpus [35]: while the earlier study illustrated that exceptions to antipatterns might reveal erroneous or ambiguous class labelling (class outliers), here songs described by infrequent patterns reveal properties which are unusual within their class (attribute outliers). In this context, Densmore’s collection and analyses provide an invaluable opportunity to qualitatively assess outlier identification for exploratory analysis of music collections. The fact that many discovered outliers can be directly or indirectly matched to related observations by Densmore indicates that the proposed method is effective in identifying songs with unusual properties. Beyond Densmore’s manual analysis, computational outlier detection and description facilitates transparent discovery of infrequent feature combinations in addition to infrequent single features. A further extension to Densmore’s analysis concerns the evaluation of pattern candidates, which employs a statistical test to discover significantly infrequent patterns.
Descriptions of outlying songs and their groups depend on the chosen feature vocabulary. The study presented here has adopted Densmore’s own content descriptors, thus allowing to compare results of the computational analysis with Densmore’s observations. Digital encoding of the Densmore collection [56] offers opportunities to complement Densmore’s features by computational feature extraction [57] and sequential pattern mining [35], both to systematically analyse aspects occasionally mentioned in Densmore’s narrative analyses but not captured in her features (e.g., linking melodic and duration features) and to add further music content descriptors (e.g., aspects of melodic contour or melodic motifs [20,58]). Computational features applied to symbolically encoded music data focus on structural features and generally do not reflect aspects of performance or context. Interestingly, as illustrated in this paper, further inspection of outliers discovered based on music content analysis may lead to investigation of performance or context. More generally, beyond supporting exploratory navigation of large music collections pattern-based outlier detection and description can provide a starting point to combine corpus-level analysis with subsequent in-depth study of selected songs.

Author Contributions

Conceptualization, K.N.; Methodology, K.N. and D.C.; Software, K.N.; Formal Analysis, K.N. and D.C.; Data Curation, K.N.; Writing—Original Draft Preparation, K.N. and D.C.; Writing—Review & Editing, K.N. and D.C.

Funding

This research received no external funding.

Conflicts of Interest

The authors declare no conflict of interest.

References

  1. Tzanetakis, G.; Kapur, A.; Schloss, W.; Wright, M. Computational ethnomusicology. J. Interdiscip. Music Stud. 2007, 1, 1–24. [Google Scholar]
  2. Fewkes, J.W. On the use of the phonograph in the study of the languages of American Indians. Science 1890, 15, 267–269. [Google Scholar] [CrossRef] [PubMed]
  3. Wickwire, W. Theories of ethnomusicology and the North American Indian: Retrospective and critique. Can. Univ. Music Rev. 1985, 25, 186–221. [Google Scholar] [CrossRef]
  4. Densmore, F. The study of Indian music. In Annual Report of the Board of Regents of the Smithsonian Institution; Smithsonian Institution: Washington, DC, USA, 1941; pp. 527–550. [Google Scholar]
  5. Hofmann, C. Frances Densmore and the music of the American Indian. J. Am. Folk. 1946, 59, 45–50. [Google Scholar] [CrossRef]
  6. Densmore, F. The study of Indian music. Music. Q. 1915, 1, 176–178. [Google Scholar] [CrossRef]
  7. Densmore, F. Chippewa Music; Smithsonian Institution, Bureau of American Ethnology, Bulletin 45: Washington, DC, USA, 1910. [Google Scholar]
  8. Densmore, F. Chippewa Music II; Smithsonian Institution, Bureau of American Ethnology, Bulletin 53: Washington, DC, USA, 1913. [Google Scholar]
  9. Densmore, F. Teton Sioux Music; Smithsonian Institution, Bureau of American Ethnology, Bulletin 61: Washington, DC, USA, 1918. [Google Scholar]
  10. Densmore, F. Northern Ute Music; Smithsonian Institution, Bureau of American Ethnology, Bulletin 75: Washington, DC, USA, 1922. [Google Scholar]
  11. Densmore, F. Mandan and Hidatsa Music; Smithsonian Institution, Bureau of American Ethnology, Bulletin 80: Washington, DC, USA, 1923. [Google Scholar]
  12. Densmore, F. Papago Music; Smithsonian Institution, Bureau of American Ethnology, Bulletin 90: Washington, DC, USA, 1929. [Google Scholar]
  13. Densmore, F. Pawnee Music; Smithsonian Institution, Bureau of American Ethnology, Bulletin 93: Washington, DC, USA, 1929. [Google Scholar]
  14. Densmore, F. Menominee Music; Smithsonian Institution, Bureau of American Ethnology, Bulletin 102: Washington, DC, USA, 1932. [Google Scholar]
  15. Densmore, F. Yuman and Yaqui Music; Smithsonian Institution, Bureau of American Ethnology, Bulletin 110: Washington, DC, USA, 1932. [Google Scholar]
  16. Densmore, F. Nootka and Quileute Music; Smithsonian Institution, Bureau of American Ethnology, Bulletin 124: Washington, DC, USA, 1939. [Google Scholar]
  17. Densmore, F. Choctaw Music; Smithsonian Institution, Bureau of American Ethnology, Bulletin 136: Washington, DC, USA, 1943. [Google Scholar]
  18. Densmore, F. Music of Acoma, Isleta, Cochiti and Zuñi Pueblos; Smithsonian Institution, Bureau of American Ethnology, Bulletin 165: Washington, DC, USA, 1957. [Google Scholar]
  19. Densmore, F. Music of the Indians in our Western states. J. Am. Folk. 1957, 70, 176–178. [Google Scholar] [CrossRef]
  20. Neubarth, K.; Shanahan, D.; Conklin, D. Supervised descriptive pattern discovery in Native American music. J. New Music Res. 2018, 47, 1–16. [Google Scholar] [CrossRef]
  21. Chandola, V.; Banerjee, A.; Kumar, V. Anomaly detection: A survey. ACM Comput. Surv. 2009, 41. [Google Scholar] [CrossRef]
  22. Steinbeck, W. Struktur und Ähnlichkeit. Methoden Automatisierter Melodienanalyse; Kieler Schriften zur Musikwissenschaft 25, Bärenreiter: Kassel, Germany; Basel, Switzerland; London, UK, 1982. [Google Scholar]
  23. Toiviainen, P.; Eerola, T. A method for comparative analysis of folk music based on musical feature extraction and neural networks. In Proceedings of the VII International Symposium on Systematic and Comparative Musicology/III International Conference on Cognitive Musicology, Jyväskylä, Finland, 16–19 August 2001; pp. 41–45. [Google Scholar]
  24. Juhász, Z. A systematic comparison of different European folk music traditions using self-organizing maps. J. New Music Res. 2006, 35, 95–112. [Google Scholar] [CrossRef]
  25. Savage, P.E.; Brown, S. Mapping music: Cluster analysis of song-type frequencies within and between cultures. Ethnomusicology 2014, 58, 133–155. [Google Scholar] [CrossRef]
  26. Mora, J.; Gómez, F.; Gómez, E.; Díaz-Báñez, J.M. Melodic contour and mid-level global features applied to the analysis of flamenco cantes. J. New Music Res. 2016, 45, 145–159. [Google Scholar] [CrossRef]
  27. Müllensiefen, D.; Frieler, K. Optimizing measures of melodic similarity for the exploration of a large folk song database. In Proceedings of the 5th International Conference on Music Information Retrieval (ISMIR 2004), Barcelona, Spain, 10–14 October 2004; pp. 274–280. [Google Scholar]
  28. Gómez, E.; Haro, M.; Herrera, P. Music and geography: content description of musical audio from different parts of the world. In Proceedings of the 10th International Society for Music Information Retrieval Conference (ISMIR 2009), Kobe, Japan, 26–30 October 2009; pp. 753–758. [Google Scholar]
  29. Conklin, D. Multiple viewpoint systems for music classification. J. New Music Res. 2013, 42, 19–26. [Google Scholar] [CrossRef]
  30. Van Kranenburg, P.; Volk, A.; Wiering, F. A comparison between global and local features for computational classification of folk song melodies. J. New Music Res. 2013, 42, 1–18. [Google Scholar] [CrossRef]
  31. Martins, M.L.; Silla, C.N., Jr. Irish traditional ethnomusicology analysis using decision trees and high level symbolic features. In Proceedings of the 12th Sound and Music Computing Conference (SMC 2015), Maynooth, Ireland, 26 July–1 August 2015. [Google Scholar]
  32. Conklin, D.; Anagnostopoulou, C. Comparative pattern analysis of Cretan folk songs. J. New Music Res. 2011, 40, 119–125. [Google Scholar] [CrossRef]
  33. Pikrakis, A.; Gómez, F.; Oramas, S.; Díaz-Báñez, J.M.; Mora, J.; Escobar, F.; Gómez, E.; Salamon, J. Tracking melodic patterns in flamenco singing by analyzing polyphonic music recordings. In Proceedings of the 13th International Society of Music Information Retrieval Conference (ISMIR 2012), Porto, Portugal, 8–12 October 2012; pp. 421–426. [Google Scholar]
  34. Van Kranenburg, P.; Volk, A.; Wiering, F. On identifying folk song melodies employing recurring motifs. In Proceedings of the 12th International Conference on Music Perception and Cognition and the 8th Triennial Conference of the European Society for Cognitive Sciences of Music (ICMPC/ESCOM 2012), Thessaloniki, Greece, 23–28 July 2012; pp. 1057–1062. [Google Scholar]
  35. Conklin, D. Antipattern discovery in folk tunes. J. New Music Res. 2013, 42, 161–169. [Google Scholar] [CrossRef]
  36. Gupta, S.; Srinivasamurthy, A.; Kumar, M.; Murthy, H.A.; Serra, X. Discovery of syllabic percussion patterns in tabla solo recordings. In Proceedings of the 16th International Society for Music Information Retrieval Conference (ISMIR 2015), Malaga, Spain, 26–30 October 2015; pp. 385–391. [Google Scholar]
  37. Conklin, D.; Weisser, S. Pattern and antipattern discovery in Ethiopian bagana songs. In Computational Music Analysis; Meredith, D., Ed.; Springer International: Cham, Switzerland, 2016; pp. 393–443. [Google Scholar]
  38. Bountouridis, D.; Koops, H.V.; Wiering, F.; Veltkamp, R.C. Music outlier detection using multiple sequence alignment and independent ensembles. In Proceedings of the 9th International Conference on Similarity Search and Applications (SISAP 2016), Tokyo, Japan, 24–26 October 2016; pp. 286–300. [Google Scholar]
  39. Flexer, A.; Pampalk, E.; Widmer, G. Novelty detection based on spectral similarity of songs. In Proceedings of the 6th International Conference on Music Information Retrieval (ISMIR 2005), London, UK, 11–15 September 2005; pp. 260–263. [Google Scholar]
  40. Hansen, L.K.; Lehn-Schiøler, T.; Petersen, K.B.; Arenas-García, J.; Larsen, J.; Jensen, S.H. Learning and clean-up in a large scale music database. In Proceedings of the 15th European Signal Processing Conference (EUSIPCO 2007), Poznan, Poland, 3–7 September 2007; pp. 946–950. [Google Scholar]
  41. Livshin, A.; Rodet, X. Purging musical instrument sample databases using automatic musical instrument recognition methods. IEEE Trans. Audio Speech Lang. Proc. 2009, 17, 1046–1051. [Google Scholar] [CrossRef]
  42. Lukashevich, H.; Dittmar, C. Improving GMM classifiers by preliminary one-class SVM outlier detection: Application to automatic music mood estimation. In Classification as a Tool for Research; Locarek-Junge, H., Weihs, C., Eds.; Springer: Berlin/Heidelberg, Germany, 2010; pp. 775–782. [Google Scholar]
  43. Lu, Y.C.; Wu, C.W.; Lu, C.T.; Lerch, A. Automatic outlier detection in music genre datasets. In Proceedings of the 17th International Society for Music Information Retrieval Conference (ISMIR 2016), New York, NY, USA, 7–11 August 2016; pp. 101–107. [Google Scholar]
  44. Panteli, M.; Benetos, E.; Dixon, S. A computational study on outliers in world music. PLoS ONE 2017, 12, e0189399. [Google Scholar] [CrossRef] [PubMed]
  45. Tang, G.; Pei, J.; Bailey, J.; Dong, G. Mining multidimensional contextual outliers from categorical relational data. Intel. Data Anal. 2015, 19, 1171–1192. [Google Scholar] [CrossRef]
  46. Novak, P.K.; Lavrač, N.; Gamberger, D.; Krstačić, A. CSM-SD: methodology for contrast set mining through subgroup discovery. J. Biomed. Inf. 2009, 42, 113–122. [Google Scholar] [CrossRef] [PubMed]
  47. Atzmüller, M. Subgroup discovery—Advanced review. Wiley Interdiscip. Rev. Data Min. Knowl. Discov. 2015, 5, 35–49. [Google Scholar]
  48. He, Z.; Xu, X.; Huang, J.Z.; Deng, S. FP-Outlier: Frequent pattern based outlier detection. Comput. Sci. Inf. Syst. 2005, 2, 103–118. [Google Scholar] [CrossRef]
  49. Ghoting, A.; Otey, M.E.; Parthasarathy, S. LOADED: link-based outlier and anomaly detection in evolving data sets. In Proceedings of the 4th IEEE International Conference on Data Mining (ICDM 2004), Brighton, UK, 1–4 November 2004; pp. 387–390. [Google Scholar]
  50. Narita, K.; Kitagawa, H. Outlier detection for transaction databases using association rules. In Proceedings of the 9th IEEE International Conference on Web-Age Information Management (WAIM 2008), Zhangjiajie, China, 20–22 July 2008; pp. 373–380. [Google Scholar]
  51. Chan, P.K.; Mahoney, M.V.; Arshad, M.H. A Machine Learning Approach to Anomaly Detection; Technical Report CS-2003-06; Florida Institute of Technology: Melbourne, FL, USA, 2003. [Google Scholar]
  52. Das, K.; Schneider, J.; Neill, D.B. Anomaly pattern detection in categorical datasets. In Proceedings of the 14th ACM SIGKDD International Conference on Knowledge Discovery and Data Mining (KDD ’08), Las Vegas, NV, USA, 24–27 August 2008; pp. 169–176. [Google Scholar]
  53. Angiulli, F.; Fassetti, F.; Palopoli, L. Discovering characterizations of the behavior of anomalous sub-populations. IEEE Trans. Knowl. Data Eng. 2013, 25, 1280–1292. [Google Scholar] [CrossRef]
  54. Van Hulse, J.; Khoshgoftaar, T.M. Class noise detection using frequent itemsets. Intel. Data Anal. 2006, 10, 487–507. [Google Scholar] [CrossRef]
  55. Neubarth, K.; Conklin, D. Contrast pattern mining in folk music analysis. In Computational Music Analysis; Meredith, D., Ed.; Springer: Cham, Switzerland, 2016; pp. 393–424. [Google Scholar]
  56. Shanahan, D.; Shanahan, E. The Densmore collection of Native American songs: a new corpus for studies of effects of geography and social function in music. In Proceedings of the 13th International Conference for Music Perception and Cognition (ICMPC 2014), Seoul, Korea, 4–8 August 2014; pp. 206–209. [Google Scholar]
  57. Shanahan, D.; Neubarth, K.; Conklin, D. Mining musical traits of social functions in Native American music. In Proceedings of the 17th International Society for Music Information Retrieval Conference (ISMIR 2016), New York, NY, USA, 7–11 August 2016; pp. 681–687. [Google Scholar]
  58. Levine, V.L. American Indian musics, past and present. In The Cambridge History of American Music; Nicholls, D., Ed.; Cambridge University Press: Cambridge, UK, 1998; pp. 3–29. [Google Scholar]
Figure 1. Examples of Densmore’s analyses of Native American songs (here Papago songs). (Top left): analysis by serial number. (Top right): song transcription and commentary. (Bottom left): tabular analysis. (Bottom right): descriptive analysis ([12], pp. 8, 12, 112, 222).
Applsci 09 00552 g001
Figure 2. Overview of the method. The input is a corpus of songs that is partitioned into groups G 1 , , G k , and the output is the union of the outlier songs found in each group.
Applsci 09 00552 g002
Figure 3. Schematic overview of infrequent contrast pattern mining (left). The 2 × 2 contingency table summarising the distribution of a pattern X in a target group G and the background ¬ G of songs in groups other than G (right).
Applsci 09 00552 g003
Figure 4. The behaviour of the p-value of a pattern X under different support counts n ( X , G ) , assuming marginal counts n ( X ) = 184 , n ( G ) = 167 , and N = 987 (see example in Figure 1, group-level analysis, third row, attribute value Harmonic).
Applsci 09 00552 g004
Figure 5. Chippewa song ID125, transcribed in outline ([7], p. 59).
Applsci 09 00552 g005
Figure 6. (Top): Chippewa lullaby ID102, recorded on the White Earth Reservation ([7], p. 163). (Bottom): Chippewa lullaby ID447, recorded on the Red Lake (Lac du Flambeau) Reservation ([8], p. 241).
Applsci 09 00552 g006
Table 1. Analysis corpus based on Densmore’s publications (with year of publication).
YearGroupLocation of ReservationsNo. Songs
1910/13Chippewa I/IIMinnesota (incl. 20 Sioux songs recorded by Chippewa)360
1918Teton SiouxNorth and South Dakota240
1922Northern UteUtah110
1923Mandan and HidatsaNorth Dakota110
1929PapagoArizona167
1929PawneeOklahoma86
1932MenomineeWisconsin140
1932Yuman and YaquiCalifornia (Yuma, Mohave); Arizona (Cocopa, Yaqui)130
1939Nootka and QuileuteWashington210
1943ChoctawMississippi65
1957PueblosNew Mexico (recorded in Washington and Wisconsin)82
Table 2. Music content attributes included in this study, based on analyses by Frances Densmore.
AttributeDescriptionAttributeDescription
tonalitytonality (third above keynote)structurerelation between accented tones
firstReKeyfirst tone relative to keynotefirstDirdirection of first melodic progression
lastReKeylast tone relative to keynotefirstMetrmetrical position of first tone
lastReCompasslast tone relative to compassinitMetremetre of first measure
compasscompass of songmetreChangechange of metre (measure-lengths)
materialtone material, scalerhythmUnitrepeated rhythmic unit(s)
accidentalschromatic alterations
Table 3. Significantly infrequent minimal contrast patterns in the Densmore collection (significance level α = 0.01 , with Bonferroni correction; maximum support count threshold θ = 15 ).
GroupOutlier DescriptionOutliersGroupBackground
Papago{firstReKey: third_or_fifth_above_octave}1 0.6 % 14.1 %
Choctaw{compass: nine_to_twelve_tones}2 3.1 % 35.2 %
Papago{firstReKey: octave, lastReKey: keynote}2 1.2 % 12.7 %
Pueblos{metreChange: no}2 2.4 % 18.0 %
Teton Sioux{compass: four_or_less_tones}2 0.8 % 8.6 %
Chippewa{lastReKey; irregular}3 0.9 % 6.2 %
Nootka and Quileute{firstReKey: third_or_fifth_above_octave}3 1.4 % 14.4 %
Yuman and Yaqui{compass: nine_to_twelve_tones}3 2.3 % 37.0 %
Chippewa{firstReKey: keynote}8 2.3 % 17.5 %
Choctaw{firstMetr: unaccented}8 12.3 % 43.3 %
Mandan and Hidatsa{lastReCompass: containing_lower}9 8.2 % 37.7 %
Papago{structure: harmonic}9 5.4 % 17.7 %
Nootka and Quileute{structure: melodic_with_harmonic_framework}10 4.8 % 17.8 %
Nootka and Quileute{firstReKey: octave}12 5.7 % 16.3 %
Menominee{compass: five_to_eight_tones, firstDir: up}14 10.0 % 27.1 %
Table 4. Outliers in the Densmore collection, with related observations by Densmore where available.
SongGroupOutlier Description
ID857Mandan and Hidatsa{lastReCompass: containing_lower}
“The ascent of a semitone to the final tone is somewhat unusual.” ([11], p. 136)
ID907Mandan and Hidatsa{lastReCompass: containing_lower}
“In this song there is no ascending sequence between accented tones, though the final interval is an ascending interval.” ([11], p. 152)
ID1027Papago{structure: harmonic}
“The song is harmonic in structure, which is unusual in the present series.” ([12], p. 112)
ID1241Yuman and Yaqui{compass: nine_to_twelve_tones}
“This song has a compass of 10 tones, which is larger than any other song under present analysis.” ([15], p. 196)
ID1303Nootka and Quileute{firstReKey: octave}, {structure:melodic_with_harmonic_framework}
ID1337Nootka and Quileute{firstReKey: third_or_fifth_above_octave}
“It is a lively, interesting melody, with a compass of 10 tones, and begins on the highest tone of the compass, which is unusual.” ([16], p. 93)
ID1345Nootka and Quileute{firstReKey: third_or_fifth_above_octave}
“This song has a compass of 10 tones, beginning on the highest tone of the compass and ending on the lowest.” ([16], p. 326)
ID1474Nootka and Quileute{firstReKey: octave}, {structure: melodic_with_harmonic_framework}
ID1907Pueblos{metreChange: no}
ID2357Choctaw{compass: nine_to_twelve_tones}
“This song has a compass of 11 tones, which is the largest in the Choctaw songs.” ([17], p. 140)
Table 5. Outliers in the Densmore collection with significantly infrequent feature combinations.
SongGroupOutlier Description
ID930Papago{firstReKey: octave, lastReKey: keynote}
“The melodic formation of this song is unusual. The song begins with a half note on the highest tone of the compass. This tone is the keynote [octave] and does not occur again in the song.” ([12], p. 200)
ID954Papago{firstReKey: octave, lastReKey: keynote}
“The song has a range of an octave and a steadily descending trend.” ([12], p. 37)
ID1540Menominee{compass: five_to_eight_tones, firstDir: up}
“The ascent of an octave at the opening was changed to a major sixth in the repetition of the melody.” ([14], p. 206)
ID1607Menominee{compass: five_to_eight_tones, firstDir: up}
“The opening intervals are unusual and comprise an ascending whole tone followed by an ascending seventh.” ([14], p. 66)
ID1609Menominee{compass: five_to_eight_tones, firstDir: up}
“This song resembles others of the present group in having a compass of eight tones, lying partly above and partly below the keynote.” ([14], p. 67)
ID1632Menominee{compass: five_to_eight_tones, firstDir: up}
“It is interesting to note the ascent of an octave within three intervals at the opening of the song and in one interval, midway the length of the song.” ([14], p. 207)
Table 6. Outliers in the Densmore collection with reference to performance or encoding.
SongGroupOutlier Description
ID70Chippewa{lastReKey: irregular}
“The tonality of this song is obscure. […]” ([7], p. 80)
ID125Chippewa{lastReKey: irregular}
“[The song] is interesting in that the singer began the last half slightly too high, thus changing the key from C minor to C sharp minor.” ([7], p. 59)
ID194Chippewa{lastReKey: irregular}
“This song offers a distinct problem in tonality. The tones are those of the fourth five-toned scale on G flat, but the first part of the song affiliates only with the chords of the key of D flat and the last part only with the chords of the key of G flat. Neither key is well established by the melody.” ([7], p. 100)
ID820Mandan and Hidatsa{lastReCompass: containing_lower}
“The descent of an octave in the third measure from the last extends the compass of the song to 13 tones. The low tone [the only tone lower than the last tone] is short and was simply touched by the voice, as it was below the singer’s natural range.” ([11], p. 93)
ID2271Choctaw{firstMetr: unaccented}
“Two renditions of this song were recorded and both are presented […]. The first rendition contains an introductory phrase which is indicated as a rhythmic unit. This does not occur in the repetition of the song.” ([17], p. 169)
Table 7. Outliers in the Densmore collection which invite further inspection considering metadata or contextual information (for details see text).
SongGroupOutlier Description
ID102Chippewa{firstReKey: keynote}
“This lullaby is very old and is widely used among the Chippewa […].” ([7], p. 163)
ID280Chippewa{firstReKey: keynote}
“This melody contains three peculiarities which rarely occur in Chippewa songs. First, it begins and ends on the same tone [the keynote].” ([8], p. 139)
ID447Chippewa{firstReKey: keynote}
“This lullaby was first recorded at White Earth, Minnesota (Bulletin 45, p. 163). On comparing the two transcriptions it will be seen that the first four measures are identical and that the latter parts differ, though both renditions end on the same tone.” ([8], p. 241)
ID679Teton Sioux{compass: four_or_less_tones}
“This and song No. 204 [ID682] are the only songs in the present series having a compass of but four tones […].” ([9], p. 493)
ID682Teton Sioux{compass: four_or_less_tones}
“[…] the song having a compass of four tones.” ([9], p. 482)
ID1289Yuman and Yaqui{compass: nine_to_twelve_tones}
“The compass is nine tones, the only songs in this work which have a compass of more than an octave being this and No. 124 […].” ([15], p. 183)

