Article

Potential of Workshop Measurement Positioning System to Measure Oscillation Frequencies of Rigid Structures

1
School of Civil Engineering, Tianjin University, Tianjin 300072, China
2
State Key Laboratory of Precision Measuring Technology and Instruments, Tianjin University, Tianjin 300072, China
*
Author to whom correspondence should be addressed.
Appl. Sci. 2019, 9(3), 595; https://doi.org/10.3390/app9030595
Submission received: 7 November 2018 / Revised: 17 January 2019 / Accepted: 22 January 2019 / Published: 11 February 2019
(This article belongs to the Special Issue Structural Damage Detection and Health Monitoring)

Abstract

:
A workshop measuring and positioning system (wMPS) is a large three-dimensional (3D) coordinate-measurement system based on optoelectronic scanning. It is capable of large-range coverage, high measurement accuracy and frequency, and multi-task synchronous measurement. Existing geodetic instruments cannot measure the intrinsic parameters of strong rigid structures. Thus, this study conducted experiments to explore the feasibility of the wMPS to measure the intrinsic parameters of rigid structures. A test bed was established using a reverse-engineering method to simulate the oscillation frequency of the structure. Displacement data, which changed with the time series through the fast Fourier transformation method, were analyzed to determine the feasibility and range of the wMPS in measuring intrinsic parameters of the structure. The experimental results demonstrated that the wMPS can measure the vibrational frequency up to 9 Hz with a 3-mm amplitude and up to 4 Hz with a 30-mm amplitude.

1. Introduction

Monitoring the short- and long-term deformation of large-span bridges, high-rise buildings, and other engineering structures, verifying whether their spectral characteristics are identical to those of the structure design, and checking whether the structure differs from its design due to external forces or design defects [1,2] can enable the timely detection of structural damage and the assessment of a structure’s safety. It can also help predict structural performance changes and facilitate maintenance decisions, which is very important for improving the efficiency of a structure.
Over the past few years, researchers used accelerometers to obtain monitoring data, and they performed many experiments [3,4]. However, accelerometers cannot directly measure structural deformation and are insensitive for slow-deformation monitoring [5,6,7]. Furthermore, the acceleration of the quadratic integral leads to error accumulation [8]. Thus, many researchers began using geodetic devices combined with accelerometers for deformation monitoring [9,10,11,12], and the data are processed through optimization algorithms using computer technology [13].
Geodetic devices can directly measure the instantaneous three-dimensional coordinates of a specified point when the amplitude varies from a few millimeters to a few centimeters with a high frequency (<5 Hz) in a structure, independent of the structure itself [14]. They can perform quasi-static, semi-static, and dynamic measurements [15,16]. These characteristics allow convenient monitoring of the spectral characteristics of a structure using geodetic equipment. Therefore, this became the main method used by geodetic researchers to monitor the health of engineering structures [17,18,19,20].
Researchers recently began monitoring relatively rigid structures, such as pedestrian bridges [21,22,23]. Such bridges are subject to complex forces, and they are built on main roads with large traffic flows; thus, monitoring is necessary. Existing measurement methods are still based on global positioning systems (GPSs) and robotic total stations (RTSs) combined with accelerometer measurement [24,25]. However, some structures exhibit small-amplitude and high-frequency motions, for which RTS and GPS cannot fully meet the requirements. The main reason is that the actual sampling frequency of an RTS is only 6–7 Hz (rated frequency 10 Hz) [11], and it cannot be used for measurements in parallel. A GPS can measure in parallel, but its dynamic accuracy is only ±10 mm [26]. Even though an optimization algorithm can be used to obtain an amplitude of 5 mm or more, the accuracy of the results is difficult to verify. These shortcomings make it impossible for the current measurement methods to fully meet the requirements for monitoring small rigid structures. To overcome this problem, this paper discusses the feasibility of monitoring data acquisition with industrial measuring equipment.
In recent years, the team at Tianjin University developed a space coordinate measurement technology called the workspace measuring and positioning system (wMPS) [27,28,29,30,31,32]. The system’s characteristics include high measurement precision, real-time measurements, and multi-task synchronization measurements. It can expand the working space by increasing the number of transmitting stations to avoid the contradiction between measurement ranges and accuracy. This approach is popular in large aircraft manufacturing, digital shipbuilding, and other fields.
In this study, the feasibility of using the wMPS to monitor changes in rigid structure displacement was verified; moreover, the range of the inherent parameters of a rigid structure measured by the wMPS was explored, and the measurement-error rule was analyzed. The experiment was based on an oscillating device that produces known preset parameters. This is similar to an experiment designed by a geologist [19]. By using the instrument to obtain the displacement data, the data can be identified using fast Fourier transform (FFT) analysis and compared with the known input values to analyze the accuracy of the wMPS while measuring a rigid structure.
This article is organized as follows: in Section 2, the working principle and the mathematical model of the wMPS are studied and deduced. In Section 3, the experiment design based on the reverse-engineering method is presented, and a coordinate transformation method suitable for this experiment is proposed. This method uses the least-squares method to fit a straight line to define the coordinate transformation method of the X-coordinate axes. In Section 4, the time-series data are analyzed using the FFT method, and the feasibility of the intrinsic parameters of the wMPS measurement structure is evaluated. In Section 5, the characteristics of the main sources of the wMPS dynamic measurement errors are described and analyzed. In Section 6, the respective advantages of wMPS, GPS, and RTS for monitoring the intrinsic parameters of engineering structures are discussed.

2. Basic Working Principle of wMPS

The wMPS is connected via transmitting stations, receivers, and a computer (Figure 1).
The transmitting station is composed of an upper rotating head and a bottom base (Figure 1). The two laser devices on the rotating head are spaced 90° apart in the horizontal direction of rotation. The laser can transmit a sector-shaped beam, and the two laser sectors and the horizontal plane are at 60° angles. A pulsed laser is installed on the base. When the system is in operation, the rotating head rotates around the fixed axis in a counterclockwise direction. The two laser devices continuously scan the space. When the rotor arrives at the initial position, the synchronous impulse transmitter on the base emits one round of synchronized optical signals and the timing begins accordingly. When any sector-shaped laser plane sweeps over the receiver, the rotation angle of the plane from the initial position to the receiver position can be obtained by counting pulses. When all the laser planes in the space scan the same receiver, a constraint equation based on multi-plane constraints can be established using the same method; thus, the coordinates of the receiver can be obtained.
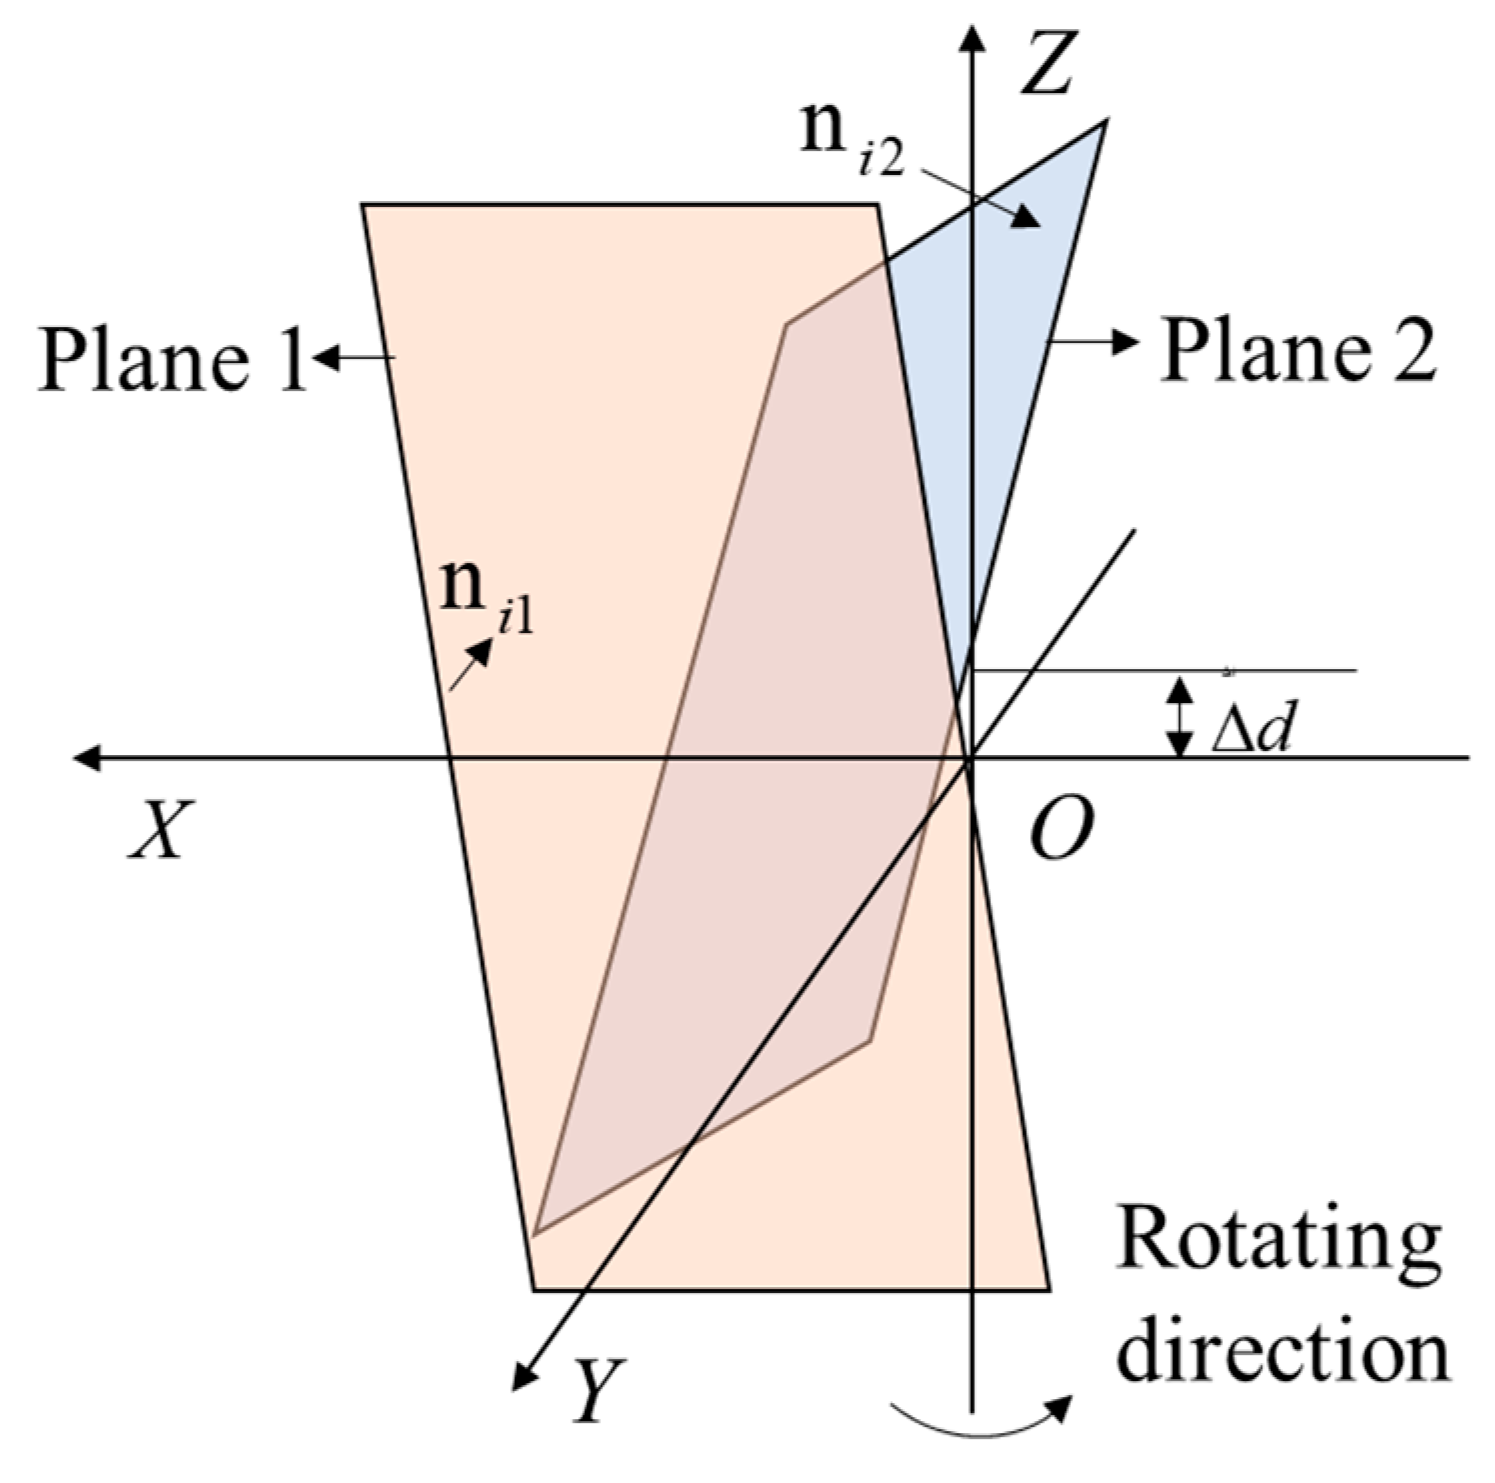
The digital model of the transmitting stations of the wMPS can be simplified to two sector half-planes rotating around an axis. The axis is defined as the Z-axis, and the intersection between plane 1 and the Z-axis is the origin of the measurement coordinates (point O). The initial position of the optical axis of plane 1 is the X-axis. On this basis, a right-handed coordinate system is established (Figure 2). The coordinate system is the transmitting station measurement coordinate system.
Internal parameters (initial plane parameters) of the transmitting station i are calibrated after the instrument is assembled. The normal vectors of the initial plane n i 1 = ( a i 1 , b i 1 , c i 1 ) , n i 2 = ( a i 2 , b i 2 , c i 2 ) , and Δ d are unit normal vectors of planes 1 and 2, while Δ d is the deviation between the two laser planes along the Z-axis. In Figure 2, ( a i 1 , b i 1 , c i 1 , d i 1 ) and ( a i 2 , b i 2 , c i 2 , d i 2 ) are known variables. When any laser plane scans over the receiver P m ( x m , y m , z m ) , the relationship between the light-plane parameters ( a i j , b i j , c i j , d i j ) and the initial plane parameters can be expressed as follows:
[ a i j b i j c i j d i j ] = [ R ( θ j ) 0 0 1 ] [ a i j b i j c i j d i j ] , i = 1 , 2 , j = 1 , 2
R ( θ j ) = [ cos ( θ j ) sin ( θ j ) 0 sin ( θ j ) cos ( θ j ) 0 0 0 1 ] , j = 1 , 2 ,
where θ j ( j = 1 , 2 ) is the rotation angle of the plane from the initial position to the receiver. Based on the recording time of synchronous pulse transmitters and the rotation angle of the transmitting stations, the relationship can be expressed as
θ j = t j T × 2 π , j = 1 , 2 ,
where T is the rotation period of the rotor. Suppose the regional independent coordinate system is a global one. The rotation and translation matrices of the measuring coordinate system of any transmitting station i to the global coordinate system are denoted R i and T i , respectively. When the laser plane sweeps over the receiver, the light plane factor can be expressed as
[ a i j b i j c i j d i j ] = [ [ R i T i 0 1 ] 1 ] T [ a i j b i j c i j d i j ] , i = 1 , 2 , 3 , j = 1 , 2 .
In this situation, when the optical plane scans over the receiver P m ( x m , y m , z m ) , the optical plane equation of any transmitting station i in the global coordinate system can be expressed as follows:
{ a i 1 x m + b i 1 y m + c i 1 z m + d i 1 = 0 a i 2 x m + b i 2 y m + c i 2 z m + d i 2 = 0 , i = 1 , 2 , 3 .
After the external parameters ( R i , T i ) of the wMPS are calibrated, when the number of transmitting stations in the measurement region is i 2 , Equation (5) can be solved using the least-squares method to obtain the three-dimensional (3D) coordinates of the testing receivers [33,34].

3. Test Description

3.1. Test Equipment

We used four of the latest wMPS prototypes and one receiver from Tianjin University, and the sampling frequency of the transmitting stations was 20 Hz. The accuracy of the measurement points is discussed in the literature [31,33,34].
The main experimental equipment consisted of one linear guideway and a sliding block fixed on the baseboard, one computer for controlling the oscillation frequencies, one controller to translate the computer signals to an oscillation signal, one servo motor to move the sliding block on the guideway, and one turntable to adjust the amplitude. This device used a computer to control the servo motor, allowing it to rotate at a fixed speed such that the sliding block underwent a simple harmonic vibration of a fixed frequency along the linear guideway. The experimental site is shown in Figure 3.

3.2. Test Method

Figure 4 shows the experimental method. The servo motor was controlled by a computer and rotated at a specified speed. A transmission shaft drove the sliding block to perform simple harmonic oscillations along the linear guideway. Figure 4b shows the slide motion analysis diagram. The displacement equation of the slider can be expressed as
s = R + L R cos α L cos β .
The design value of L was 300 mm. When R was 3, 5, 10, 20, and 30 mm, the λ values, where λ = R / L , were 1 100 , 1 60 , 1 30 , 1 15 , and 1 10 , respectively. Furthermore, expanding cos β = 1 λ 2 sin 2 α as a Newtonian binomial, since the λ values were very small and the higher order terms were ignored, the approximate equation of the slider displacement could be expressed as
s = R [ ( 1 cos α ) + λ 4 ( 1 cos 2 α ) ] .
As λ 4 is very small, in the following calculation, we only take s = R ( 1 - cos α ) . Before the experiment, each driving wheel was tested to ensure the accuracy of R. Each data segment was measured in the radius order (3, 5, 10, 20, and 30 mm) and frequency order (0.5, 1, …, 10 Hz).
Several experiments (>50) were carried out in the 20 m × 20 m space of the State Key Laboratory of Precision Measuring Technology and Instruments in Tianjin University from March to June 2017. Four transmitting stations were located in front of the testbed to ensure that each receiver could accept signals from every transmitting station. The test apparatus was placed on the marble ground surface to ensure that the oscillation table generated no displacements during the tests. The oscillation frequency was set to 0.5–10 Hz, and the amplitude range was set to 3–30 mm. These measurements were chosen because the natural frequency of the strong rigid structure exceeds 10 Hz. The oscillation frequency at a 30-mm amplitude of oscillation is relatively low.
The minimum duration of the experiment was set to two minutes, exceeding the duration of events that caused the dynamic displacements, such as earthquakes. However, the low-frequency (≤0.5 Hz) segment of the experiment lasted several minutes to obtain the necessary data to achieve significant results.

4. Time-Series Analysis

4.1. Data Preprocessing

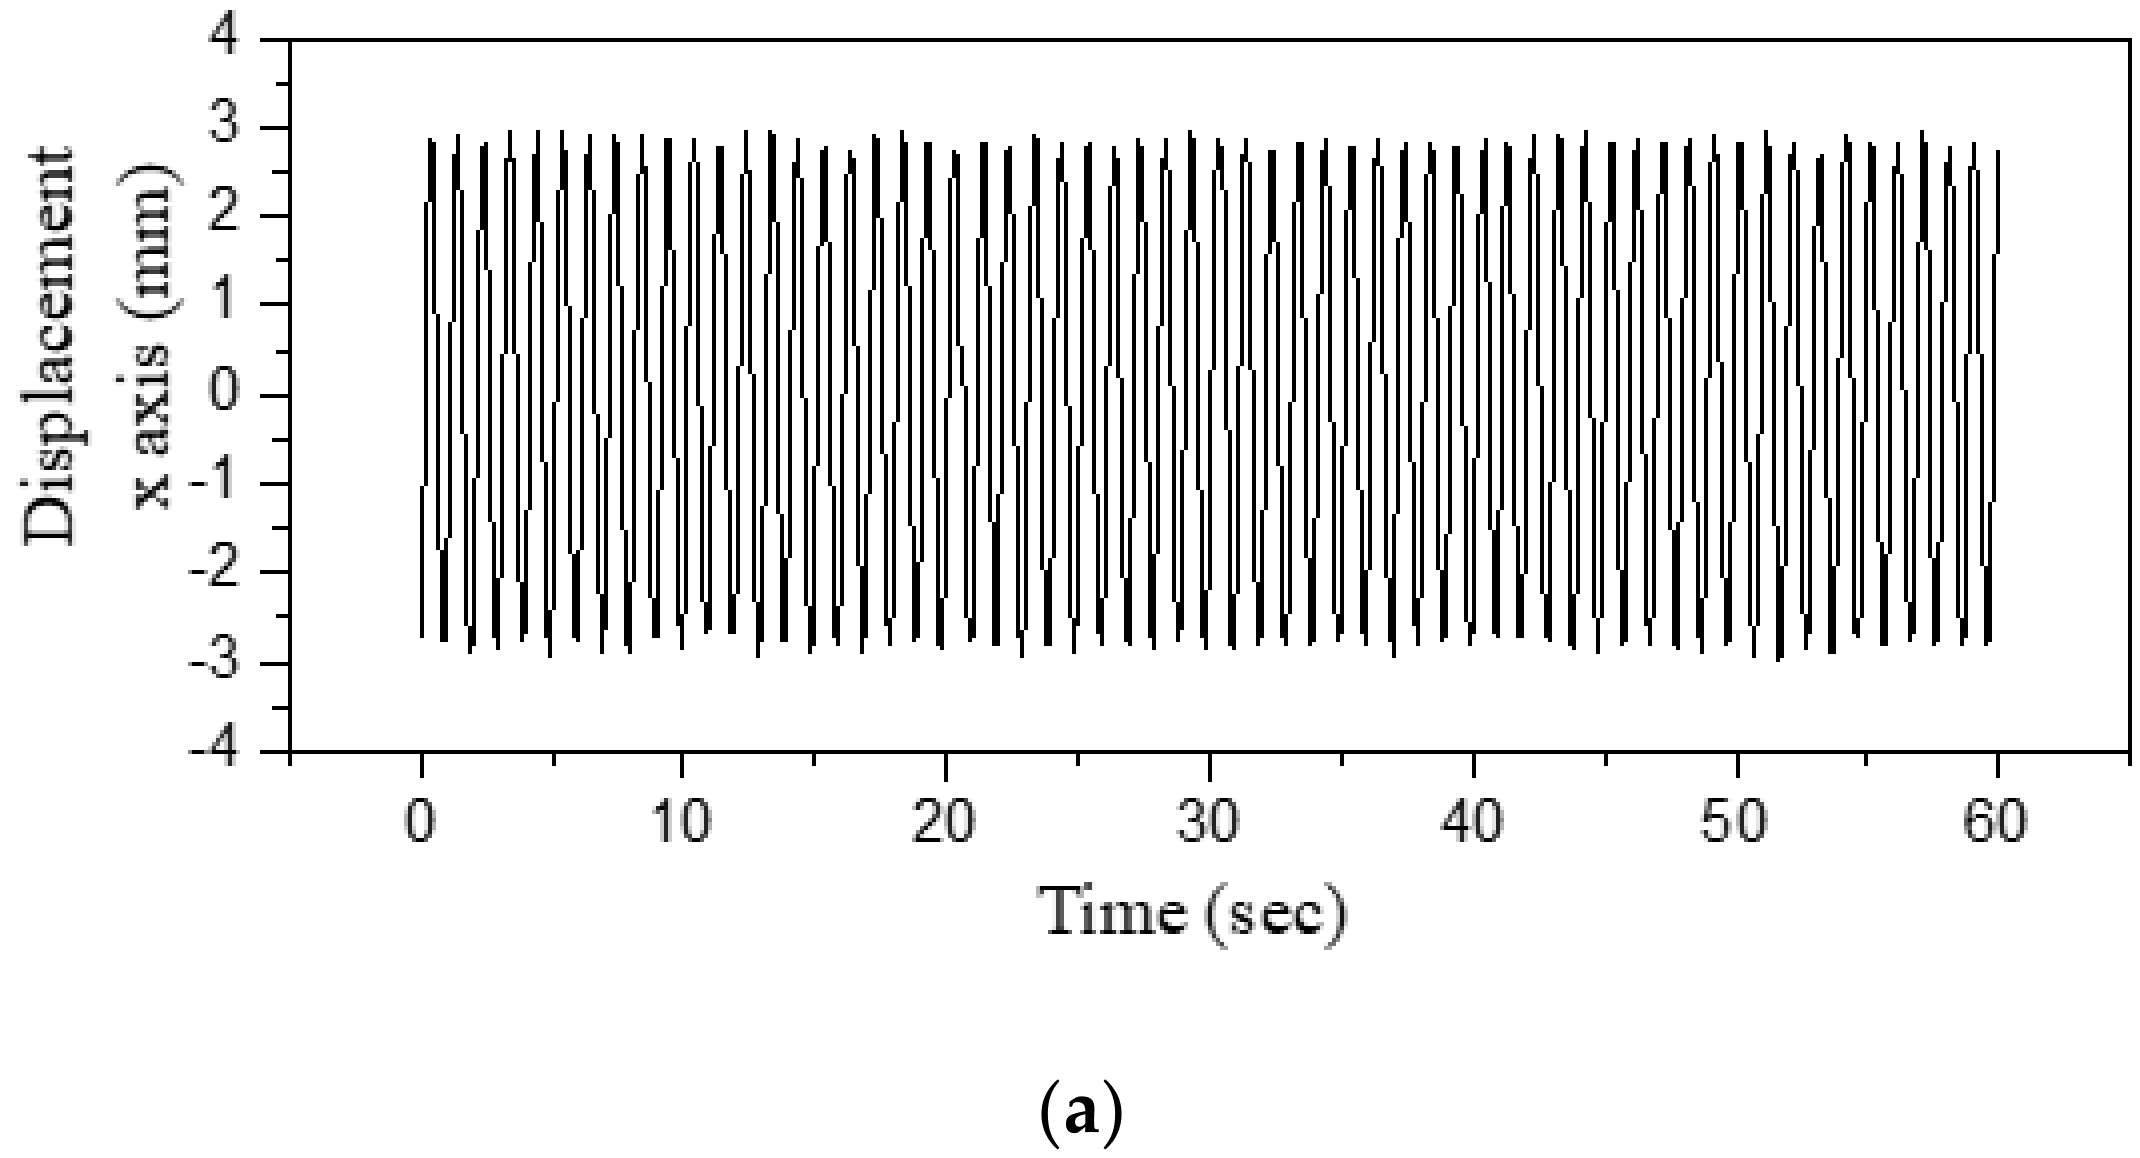
Before performing the test data analysis, the wMPS could not be leveled at the center. Although other instruments can be used for control-point calibration, bench leveling can also cause serious errors. Therefore, an independent coordinate system was established using a gauge-based calibration method [35]. The sliding block moved linearly along the guide during movement, which was the actual movement of the sliding block. If the direction of the linear movement is defined as the X-axis, then the calculation can be simplified significantly by analyzing only the X-axis, resulting in more intuitive results. The Y- and Z-axes were considered to be measurement errors brought by the movement. Thus, the least-squares method was used to fit the measured data for each measurement segment to a straight line (motion trail of the sliding block). This line was used as the reference axis of the rectilinear motion and was defined as the X-axis. The direction perpendicular to the test bench was defined as the Z-axis. The Y-axis was defined according to a right-handed coordinate rule. Thus, a rectangular coordinate system was constructed, and all the measured data were transformed to the new coordinate system through the coordinate-transformation equations. In Figure 5, the measured data of the 3-mm, 1-Hz segment transformed by the X-, Y-, and Z-axes is shown. The X-axis reflects the real displacement of the sliding block, while the data of the Y- and Z-axes showed very small oscillations, which were considered to be noise caused by the measurements [19].

4.2. Elimination of Gross Error

A servo motor was used to control the wheel rotations to simulate harmonic vibrations. This is different from spring-based simple harmonic oscillations [19]. This experiment guarantees the continuity of the data. Less error was introduced in the experiment, and it was simpler to ensure that the wMPS performed well. Using a spring as a medium [19] can simulate realistic structural oscillations. However, the proposed method has no influence on the performance of the wMPS. In different data segments, only those with large measurement frequencies exhibited significant fluctuations at a few monitoring points, which were eliminated directly, and had no effect on the final results [16,19]. The results of the time-series spectral analysis along the Y-axis, as shown in Figure 6, were measured as white noise. This topic is not studied in the subsequent text [19].

4.3. Assessment of the Potential of wMPS for Estimating the Oscillation Amplitude

The estimation of the accuracy of the wMPS for the determination of the oscillation amplitude was based on a comparison of the oscillation amplitude derived from the wMPS time series with the real amplitude (designed value). The real amplitude (designed value) is the radius of each driving wheel, marked by red lines in Figure 7 in the representative examples for the wMPS. The wMPS time-series amplitude was computed from the mean values of the maximum and minimum peaks using a simple peak-picking technique [19]. Absolute deviations and mean-square errors of amplitudes of different segments are listed in Table 1, which shows that, when the deviation value ranged from 0.05 ± 0.06 mm to 4.13 ± 6.01 mm, the absolute deviations increased with increases in amplitude and frequency. For the cases shown in Figure 7a–c, the wMPS described a nearly ideal sinusoidal oscillation; however, in other cases, i.e., Figure 7d–j, several cycles were misrecorded and clearly deviated from sinusoidal curves. Based on the analysis of these signals, the quality of the measurements mainly depends on two parameters [15].
Firstly, the wMPS can collect enough signals (Figure 7a–c) to recover the displacement curve in the low-frequency stage; however, with increasing frequency, certain cycles were poorly described or even lost, because there were few displacement signals recorded in one period (Figure 7d–j).
The second parameter is the maximum velocity of the oscillation, υ max = 2 π f R . If υ max < 13 c m / s , the oscillation amplitude was described well (Figure 7a–c,) corresponding to 3, 6, and 12.5 cm/s, respectively. On the contrary, for υ max > 18 c m / s , the oscillation amplitude was poorly described (Figure 7d–j).
Figure 8 shows a more intuitive error distribution than that presented in Table 1. As shown in Figure 8, the absolute deviation of the displacement of different segments under the red line was similar and reliable (the effect of the sampling frequency on the absolute deviation can be ignored for these segments), because the absolute deviation was very close to the sensitivity of the instrument (approximately 0.2 mm). Above the red line, the uncertainties were relatively large.

4.4. Extraction of Natural Frequency

The natural frequencies of different segments were mainly calculated using the FFT method [19]. The calculated results of all segments are shown in Table 2. The results of the time-series analysis under a 10-mm amplitude and the 0.5–9-Hz frequency band are shown in Figure 9. The growth of small-peak amplitudes in Figure 9 reflects the reduction of the signal-to-noise ratio in the observations. Table 2 shows that the principal frequencies of the data segments within 0.5–8 Hz can be acquired accurately. The maximum deviation was less than 2.5%. The principal frequency could still be acquired at 9 Hz, but the signal had already become unstable. When the frequency was 10 Hz, the main frequency value was unobtainable, and the measurement data were lost. The same results were obtained at two amplitudes (3 and 5 mm). The maximum frequency that could be obtained was 6 Hz at a 20-mm amplitude and 4 Hz at 30-mm amplitude. Therefore, the maximum frequency of the wMPS under the amplitude range of 3–10 mm is 9 Hz, which can meet the requirements for measuring the natural frequencies of rigid structures.

5. Dynamic Error Analysis of the wMPS

Dynamic measurement error of the wMPS was mainly due to the delay caused by the receiver’s motion and observation of the measurement, which produced a position error of spatial intersection. The dynamic measurement error was divided into a single-station set-up phase error and synchronization error between multiple transmitting stations.
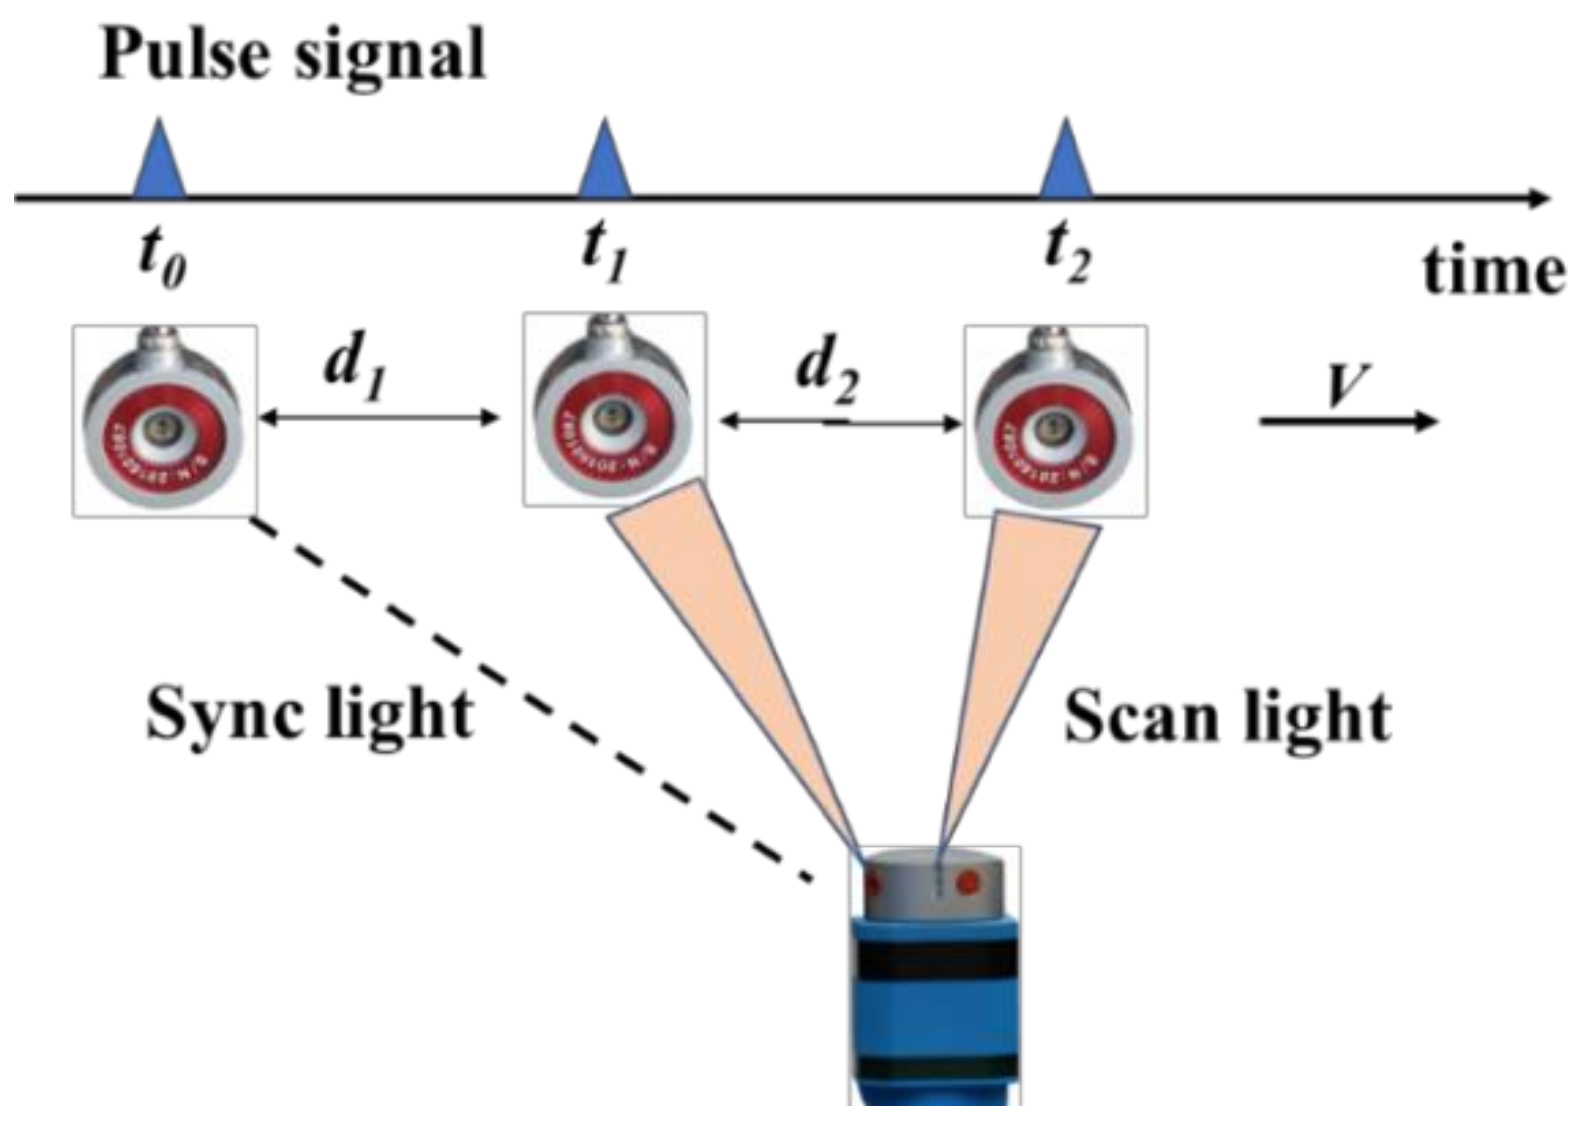
For a single transmitting station, the movement of the measurement points caused a delay between a group of matching synchronous optical signals and scanning optical signals obtained by the receiver, which caused measurement errors in the scanning angle. This delay caused a phase error whose value was related to the moving speed of the receiver. In Figure 10, the receiver received synchronous optical signals at t 0 . Owing to the movement of the receiver, the scanning optical signals 1 and 2, received at t 1 and t 2 , respectively, involved a phase error caused by the movement of the receiver. To solve for the location of the receiver at t 0 , two scanning angles θ 1 t 0 and θ 2 t 0 at t 0 must be known. In the static measurements, θ 1 t 0 and θ 2 t 0 do not change as time passes. However, due to the movement of the receiver, the scanning optical signals θ 1 t 0 and θ 2 t 2 received by the rotor in the transmitting station in one rotation cycle deviate from θ 1 t 0 and θ 2 t 0 . Using a deviated scanning angle to establish the plane-constraint equation will result in errors in the positions of the coordinates [30,35].
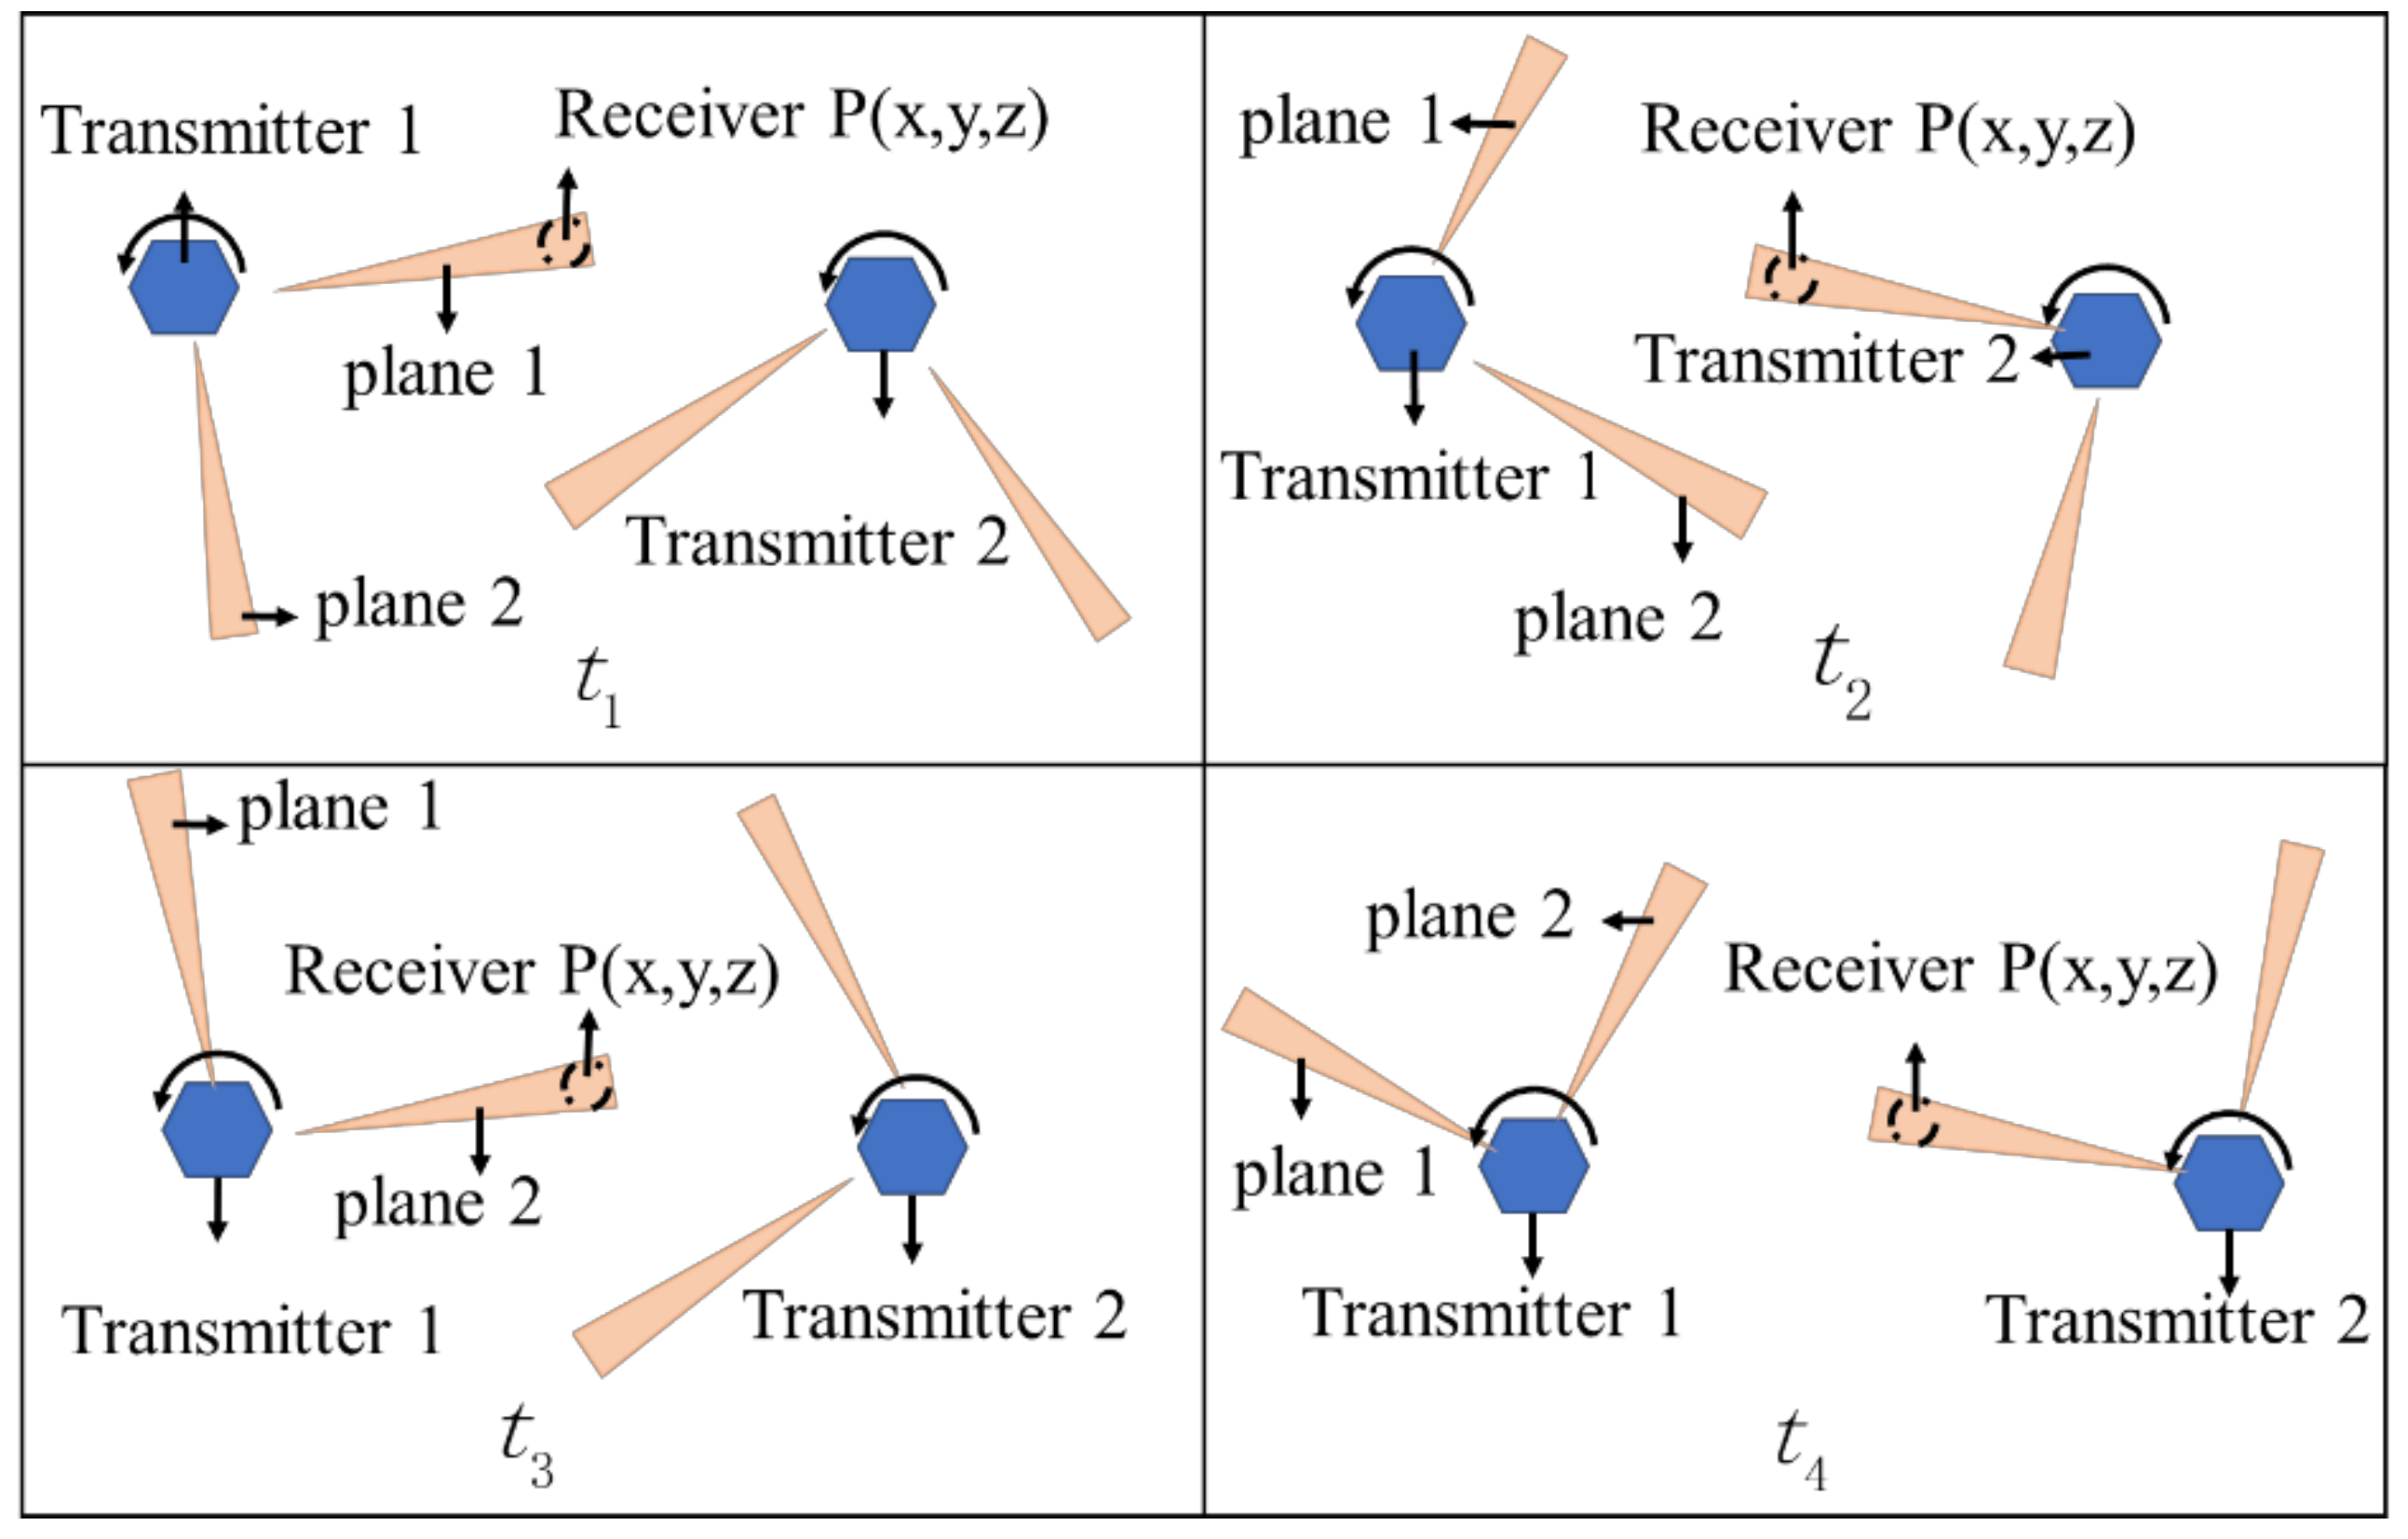
Synchronous error was caused by the delay of synchronous light emissions between two stations. This primarily occurred because the transmitting stations rotated at different speeds, which is unavoidable in wMPS dynamic measurements. Figure 11 shows the errors caused by the out-of-sync rotations of the transmitting stations. Considering a measurement system involving double transmitting stations as an example, a synchronous error brings a different timing base for scanning-angle measurement in the two stations, resulting in a measurement error of the scanning angle. When the receiver is static, although the rotating phases and speeds of the two transmitting stations are not synchronous, the plane of rotating light reversely calculated from the pulse time still strictly meets the surface of the receiver, and accurate spatial coordinates can be obtained when the scanning beam scans over the receiver. Therefore, the information delay caused by different rotation speeds of the transmitting stations will not influence the static measurement of the wMPS. Figure 12 shows that the rotating phases and speeds of the two stations are not synchronous. Therefore, when the scanning beam sweeps at each transmitting station, the receivers scatter around the motion trail. Hence, the angle-intersection conditions are destroyed, and the calculation accuracy of the receiver coordinates decreases. This situation will influence the field application of the wMPS.
Figure 13 shows that, as time changes, the sliding block experiences one period of motion when the driving wheel rotates exactly for one cycle. When the connecting point O is at the highest and lowest positions, the sliding block achieves a peak movement speed υ max ( υ max = ω R = 2 π f R ). O and the guideway are in one line, and the instantaneous movement speed of the sliding block is zero. When the speed is greater (the receiver moves faster), the intersection conditions are worse, and the error will be larger. Data at discrete points at 0.5, 1, 2, and 4 Hz are shown in Figure 14a, and projections of discrete points on the XY, XZ, and YZ planes are shown in Figure 14b. On the XY and XZ planes, the line will move along the X-axis, accompanied by concentrated points at the maximum amplitude (instantaneous speed = 0) and a small error. The frequency band of 4 Hz at point 0 on the X-axis has the highest speed, accompanied by scattered points and a large error. This result agrees with the intersection error shown in Figure 12.

6. Discussion

As shown in Table 1, when the vibration amplitude was 3 mm, the wMPS could recognize the frequency of 9 Hz, and the absolute deviation was 1.06 ± 1.35 mm. When the vibration amplitude was 30 mm, it could recognize the frequency of 4 Hz, and the absolute deviation was 3.28 ± 4.40 mm. The GPS and RTS could recognize only the minimum amplitude of 5 mm, and only the frequency values of 4 and 3 Hz. When the vibration amplitude was 30 mm, only a frequency of 2 Hz could be recognized.
Comparing these two results, we inferred some observations. Firstly, the wMPS in cooperation with an accelerometer can measure the intrinsic parameters while monitoring a small rigid structure, and it is more accurate than the GPS and RTS. It is simple to identify a vibration amplitude of 3 mm. Secondly, for a general large structure, the natural frequency is usually within 1 Hz, and the GPS dynamic-measurement accuracy fully meets the requirements. Also, the GPS range was not limited. Because the wMPS range is limited by its working principle, and the transmitting station cannot be installed in some places, the measurement range is limited. Therefore, a GPS is more convenient than the wMPS in large-structure monitoring.
Thus, GPS, RTS, and the wMPS have their own advantages. The wMPS can directly monitor a rigid structure with an accelerometer. It can also be combined with GPS and RTS measurements to verify the accuracy of GPS and RTS monitoring of rigid structural data and analysis results. In the field of monitoring, with the application of the wMPS, a minimum value of the monitoring displacement amplitude can achieve a new level.

7. Conclusions

This study yielded three basic conclusions. Firstly, through experience, it was determined that the wMPS can monitor the displacement amplitude and oscillation frequency of a structure, and it is feasible to apply it for engineering monitoring. Secondly, the wMPS is convenient for structural monitoring, without other software and hardware assistance and complex solutions. It is as convenient as GPS and RTS for monitoring structures. Thirdly, the wMPS can be used to monitor rigid structures. It can completely allow for the inadequacies of the rigid structure of GPS and RTS monitoring. It can be directly combined with an accelerometer to monitor the displacement deformation of a rigid structure. Our experiment proved that the vibration of the frequency could be recognized at 9 Hz when the vibration amplitude was 3 mm, and the frequency of 4 Hz could be recognized when the displacement was 30 mm.

Author Contributions

H.B. designed and implemented the test, and prepared the paper; C.X. and J.L. supervised this project.

Acknowledgments

This work was supported by the National Natural Science Foundation of China (Grant No. 51775380). The authors thank Zhu Jigui from State Key Laboratory of Precision Measuring Technology and Instruments at Tianjin University for providing the equipment.

Conflicts of Interest

The authors declare no conflicts of interest.

Abbreviations

All the variables and abbreviations used in this paper.
GPSglobal positioning system
RTSrobotic total station
wMPSworkspace measuring and positioning system
R i coordinate rotation matrices
T i coordinate translation matrices
βswinging angle of connecting rod
Δ d deviation between the two planes along Z axis
ni1normal vectors of plane 1
ni2normal vectors of plane 2
vmaxmaximum slider speed
θj (j = 1,2)rotation angle of the plane
Rcrank throw
tj (j = 1,2)record time
Tperiod
Lconnecting rod length
λcrank-link rod ratio
ωangular velocity
sslider displacement
ffrequency
vslide speed
αangle of rotation
R(θ)plane rotation matrix

References

  1. Glaser, S.D.; Li, H.; Wang, M.L.; Ou, J.; Lynch, J. Sensor technology innovation for the advancement of structural health monitoring: A strategic program of us-china research for the next decade. Smart Struct. Syst. 2007, 3, 221–244. [Google Scholar] [CrossRef]
  2. Jain, H.; Rawat, A.; Sachan, A.K. A review on advancement in sensor technology in structural health monitoring system. J. Struct. Eng. Manag. 2015, 2, 1–7. [Google Scholar]
  3. Şafak, E. Response of a 42-storey steel-frame building to the, ja:math, loma prieta earthquake. Eng. Struct. 1993, 15, 403–421. [Google Scholar] [CrossRef]
  4. Durukal, E. Dynamic response of two historical monuments in istanbul deduced from the recordings of kocaeli and duzce earthquakes. Bull. Seismol. Soc. Am. 2003, 93, 694–712. [Google Scholar] [CrossRef]
  5. Dong, D.; Fang, P.; Bock, Y.; Cheng, M.K.; Miyazaki, S. Anatomy of apparent seasonal variations from gps-derived site position time series. J. Geophys. Res. Solid Earth 2002, 107, ETG9-1–ETG9-16. [Google Scholar] [CrossRef]
  6. Breuer, P.; Chmielewski, T.; Górski, P.; Konopka, E. Application of gps technology to measurements of displacements of high-rise structures due to weak winds. J. Wind Eng. Ind. Aerodyn. 2002, 90, 223–230. [Google Scholar] [CrossRef]
  7. Nakamura, S.I. GPS measurement of wind-induced suspension bridge girder displacements. J. Struct. Eng. 2000, 126, 1413–1419. [Google Scholar] [CrossRef]
  8. Stiros, S.C. Errors in velocities and displacements deduced from accelerographs: An approach based on the theory of error propagation. Soil Dyn. Earthq. Eng. 2008, 28, 415–420. [Google Scholar] [CrossRef]
  9. Li, X.; Ge, L.; Ambikairajah, E.; Rizos, C.; Tamura, Y.; Yoshida, A. Full-scale structural monitoring using an integrated GPS and accelerometer system. GPS Solut. 2006, 10, 233–247. [Google Scholar] [CrossRef]
  10. Lovse, J.W.; Teskey, W.F.; Lachapelle, G.; Cannon, M.E. Dynamic deformation monitoring of tall structure using GPS technology. J. Surv. Eng. 1995, 121, 35–40. [Google Scholar] [CrossRef]
  11. Heo, G.; Kim, C.; Jeon, S.; Jeon, J. An Experimental Study of a Data Compression Technology-Based Intelligent Data Acquisition (IDAQ) System for Structural Health Monitoring of a Long-Span Bridge. Appl. Sci. 2018, 8, 361. [Google Scholar] [CrossRef]
  12. Yu, J.; Yan, B.; Meng, X.; Shao, X.; Ye, H. Measurement of bridge dynamic responses using network-based real-time kinematic GNSS technique. J. Surv. Eng. 2016, 142, 04015013. [Google Scholar] [CrossRef]
  13. Yan, Q.; Zhang, C.; Lin, G.; Wang, B. Field monitoring of deformations and internal forces of surrounding rocks and lining structures in the construction of the Gangkou double-arched tunnel—A case study. Appl. Sci. 2017, 7, 169. [Google Scholar] [CrossRef]
  14. Xu, L.; Guo, J.J.; Jiang, J.J. Time-frequency analysis of a suspension bridge based on GPS. J. Sound Vib. 2002, 254, 105–16. [Google Scholar] [CrossRef]
  15. Psimoulis, P.A.; Stiros, S.C. Measurement of deflections and of oscillation frequencies of engineering structures using Robotic Theodolites (RTS). Eng. Struct. 2007, 29, 3312–3324. [Google Scholar] [CrossRef]
  16. Psimoulis, P.; Pytharouli, S.; Karambalis, D.; Stiros, S. Potential of Global Positioning System (GPS) to measure frequencies of oscillations of engineering structures. J. Sound Vib. 2008, 318, 606–623. [Google Scholar] [CrossRef]
  17. Górski, P. Investigation of dynamic characteristics of tall industrial chimney based on GPS measurements using Random Decrement Method. Eng. Struct. 2015, 83, 30–49. [Google Scholar] [CrossRef]
  18. Chan, W.S.; Xu, Y.L.; Ding, X.L.; Xiong, Y.L.; Dai, W.J. Assessment of dynamic measurement accuracy of GPS in three directions. J. Surv. Eng 2006, 132, 108–117. [Google Scholar] [CrossRef]
  19. Psimoulis, P.A.; Stiros, S.C. Experimental assessment of the accuracy of GPS and RTS for the determination of the parameters of oscillation of major structures. Comput.-Aided. Civ. Inf 2008, 23, 389–403. [Google Scholar] [CrossRef]
  20. Moschas, F.; Stiros, S. PLL bandwidth and noise in 100 Hz GPS measurements. GPS Solut. 2015, 19, 173–185. [Google Scholar] [CrossRef]
  21. Schaal, R.E.; Larocca, A. Measuring dynamic oscillations of a small span cable-stayed footbridge: Case study using L1 GPS receivers. J. Surv. Eng. 2009, 135, 33–37. [Google Scholar] [CrossRef]
  22. Moschas, F.; Stiros, S. Measurement of the dynamic displacements and of the modal frequencies of a short-span pedestrian bridge using GPS and an accelerometer. Eng. Struct. 2011, 33, 10–17. [Google Scholar] [CrossRef]
  23. Moschas, F.; Stiros, S.C. Three-dimensional dynamic deflections and natural frequencies of a stiff footbridge based on measurements of collocated sensors. Struct. Control Health 2014, 21, 23–42. [Google Scholar] [CrossRef]
  24. Moschas, F.; Stiros, S. Dynamic deflections of a stiff footbridge using 100-Hz GNSS and accelerometer data. J. Surv. Eng. 2015, 141, 04015003. [Google Scholar] [CrossRef]
  25. Stiros, S.C.; Psimoulis, P.A. Response of a historical short-span railway bridge to passing trains: 3-D deflections and dominant frequencies derived from Robotic Total Station (RTS) measurements. Eng. Struct. 2012, 45, 362–371. [Google Scholar] [CrossRef]
  26. Stiros, S.; Moschas, F. Rapid decay of a timber footbridge and changes in its modal frequencies derived from multiannual lateral deflection measurements. J. Bridge Eng. 2014, 19, 05014005. [Google Scholar] [CrossRef]
  27. Yang, L.H.; Yang, X.Y.; Zhu, J.G.; Duan, M.; Lao, D. Novel method for spatial angle measurement based on rotating planar laser beams. Chin. J. Mech. Eng. 2010, 23, 758–764. [Google Scholar] [CrossRef]
  28. Norman, A.R.; Schönberg, A.; Gorlach, I.A.; Schmitt, R. Validation of iGPS as an external measurement system for cooperative robot positioning. Int. J. Adv. Manuf. Technol. 2013, 64, 427–446. [Google Scholar] [CrossRef]
  29. Lao, D.B.; Yang, X.Y.; Zhu, J.G.; Ye, S.H. Optimization of calibration method for scanning planar laser coordinate measurement system. Opt. Precis. Eng. 2011, 19, 870–877. [Google Scholar]
  30. Xiong, Z.; Zhu, J.G.; Zhao, Z.Y.; Yang, X.Y.; Ye, S.H. Workspace measuring and positioning system based on rotating laser planes. Mechanics 2012, 18, 94–98. [Google Scholar] [CrossRef]
  31. Zhao, Z.; Zhu, J.; Xue, B.; Yang, L. Optimization for calibration of large-scale optical measurement positioning system by using spherical constraint. J. Opt. Soc. Am. A 2014, 31, 1427–1435. [Google Scholar] [CrossRef] [PubMed]
  32. Guo, S.; Lin, J.; Ren, Y.; Shi, S.; Zhu, J. Application of a self-compensation mechanism to a rotary-laser scanning measurement system. Meas. Sci. Technol. 2017, 28, 115007. [Google Scholar] [CrossRef]
  33. Liu, Z.; Zhu, J.; Yang, L.; Liu, H.; Wu, J.; Xue, B. A single-station multi-tasking 3D coordinate measurement method for large-scale metrology based on rotary-laser scanning. Meas. Sci. Technol. 2013, 24, 105004. [Google Scholar] [CrossRef]
  34. Zhao, Z.; Zhu, J.; Lin, J.; Yang, L.; Xue, B.; Xiong, Z. Transmitter parameter calibration of the workspace measurement and positioning system by using precise three-dimensional coordinate control network. Opt. Eng. 2014, 53, 084108. [Google Scholar] [CrossRef]
  35. Yang, L.H.; Zhu, J.G.; Zhang, G.J.; Ye, S.H. Orientation method for workspace measurement positioning system based on scale bar. J. Tianjin Univ. 2012, 45, 814–819. [Google Scholar]
Figure 1. Structure of the workspace measuring and positioning system (wMPS).
Applsci 09 00595 g001
Figure 2. Measurement coordinates.
Applsci 09 00595 g002
Figure 3. Hardware used in the experiments containing the experimental device and the wMPS system. A receiver was installed on top of the sliding block of the oscillation device. The wMPS stations were set in nearby positions.
Applsci 09 00595 g003
Figure 4. Simplified structure of the test and displacement analysis diagram. (a) Simplified structure of the test; (b) slide motion analysis diagram.
Applsci 09 00595 g004
Figure 5. Data of 3-mm 1-Hz segment after coordinate transformation. (a) X-axis reflects the real displacement of the sliding block of the 3-mm, 1-Hz segment; (b) shows the data captured on the Y-axis; (c) shows the data captured on the Z-axis.
Applsci 09 00595 g005aApplsci 09 00595 g005b
Figure 6. Analysis results of representative Y-axis data. (a) A representative 1Hz measuring section was analyzed as white noise; (b) a representative 6Hz measuring section was analyzed as white noise.
Applsci 09 00595 g006
Figure 7. Oscillation displacements of different segments (amplitude: 10 mm; frequency: 0.5–9 Hz) obtained through the wMPS. Horizontal lines indicate the real oscillation amplitude. (a) Oscillation displacements of 0.5Hz segment, the sampling rate can reconstruct the displacement signal almost perfectly; (b) oscillation displacements of 1Hz segment, the displacement signals described a nearly ideal sinusoidal oscillation; (c) the amplitude of displacement vibration is no longer consistent, but the error is small, indicating that the sampling rate of 2Hz can still approximately reconstruct the original signal; (d) the error of the result obtained is still small, and the sampling rate of 3Hz also meets the requirements; (e) oscillation displacements of 4Hz segment; (f) oscillation displacements of 5Hz segment; (g) oscillation displacements of 6Hz segment; (h) oscillation displacements of 7Hz segment; (i) oscillation displacements of 8Hz segment; (j) oscillation displacements of 9Hz segment. From (e) to (j), the error gradually increases with the increase of sampling rate, and the displacement signal can no longer be accurately reconstructed.
Applsci 09 00595 g007aApplsci 09 00595 g007b
Figure 8. Illustrative diagrams of absolute amplitude errors of different segments.
Applsci 09 00595 g008
Figure 9. Principal frequency diagram of spectral analysis of different segments. (a) Frequency diagram of 0.5Hz; (b) frequency diagram of 1Hz; (c) frequency diagram of 2Hz; (d) frequency diagram of 3Hz. As showed in Figures (ad), the frequency curve is very smooth, there are no obvious small-peak amplitudes; (e) frequency diagram of 4Hz; (f) frequency diagram of 5Hz; (g) frequency diagram of 6Hz; (h) frequency diagram of 7Hz; (i) frequency diagram of 8Hz. In (ei), the growth of small-peak amplitudes more and more with the increase of sampling rate. That reflects the reduction of the signal-to-noise ratio in the observations; (j) frequency diagram of 9Hz. Though the principal frequency could be acquired, but the signal had become unstable.
Applsci 09 00595 g009aApplsci 09 00595 g009b
Figure 10. Phase error of dynamic measurement in a single transmitting station.
Applsci 09 00595 g010
Figure 11. Effect of out-of-sync rotation of transmitting stations on the intersection relationship during static state of the receiver. From left to right: the moment when the plane 1 of the transmitter 1 scans over the receiver; the moment when the plane 1 of the transmitter 2 scans over the receiver; the moment when the plane 2 of the transmitter 1 scans over the receiver; the moment when the plane 2 of the transmitter 2 scans over the receiver. It is obvious that the receiver in the same position when the planes scans over the receiver separately, the information delay caused by different rotation speed of the transmitting stations will not influence the static measurement of the wMPS.
Applsci 09 00595 g011
Figure 12. Effect of out-of-sync rotation of transmitting stations on the intersection relationship during dynamic state of the receiver. From left to right: the moment when the plane 1 of the transmitter 1 scans over the receiver; the moment when the plane 1 of the transmitter 2 scans over the receiver; the moment when the plane 2 of the transmitter 1 scans over the receiver; the moment when the plane 2 of the transmitter 2 scans over the receiver. It is obvious that the receiver in different position when the planes scans over the receiver separately, the angle-intersection conditions are destroyed, and the calculation accuracy of the receiver coordinates decreases.
Applsci 09 00595 g012
Figure 13. Variation curves of movement speed of sliding blocks.
Applsci 09 00595 g013
Figure 14. Distribution of discrete points. (a) Data at discrete points at 0.5, 1, 2, and 4 Hz; (b) projections of discrete points on the XY, XZ, and YZ planes.
Applsci 09 00595 g014
Table 1. Absolute deviation of amplitude of different segments.
Frequency (Hz)Amplitude (mm)
35102030
0.50.05 ± 0.060.05 ± 0.060.09 ± 0.110.18 ± 0.190.35 ± 0.36
10.08 ± 0.090.08 ± 0.090.12 ± 0.170.21 ± 0.250.41 ± 0.44
20.09 ± 0.110.13 ± 0.170.22 ± 0.310.55 ± 0.710.89 ± 1.27
30.21 ± 0.230.22 ± 0.330.39 ± 0.601.04 ± 1.431.65 ± 2.19
40.25 ± 0.370.32 ± 0.460.84 ± 1.111.85 ± 2.653.28 ± 4.40
50.31 ± 0.440.54 ± 0.781.26 ± 1.832.61 ± 3.38-
60.43 ± 0.640.73 ± 1.091.45 ± 2.144.13 ± 6.01-
70.52 ± 0.690.96 ± 1.231.94 ± 2.44--
80.89 ± 1.161.62 ± 2.053.25 ± 4.08--
91.06 ± 1.351.94 ± 2.393.92 ± 4.80--
Table 2. Measured frequencies of oscillations of different segments.
Frequency (Hz)Amplitude (mm)
35102030
0.50.5060.5060.5040.5060.511
11.0101.0071.0251.0191.014
22.0392.0382.0402.0512.048
33.0543.0533.0763.0033.081
44.0814.0874.0494.0694.155
55.0865.0595.0765.123-
66.0666.0366.0406.102-
77.0957.0367.033--
88.1238.0868.035--
99.1109.1009.132--