2.1.1. Numerical Modelling
The FE model of a certified motorcycle helmet was already created and validated in [
48,
49]. The validation was performed by simulating the ECE standard impacts carried to certify the helmet. The materials used, EPS and agglomerated cork, were already validated in [
4].
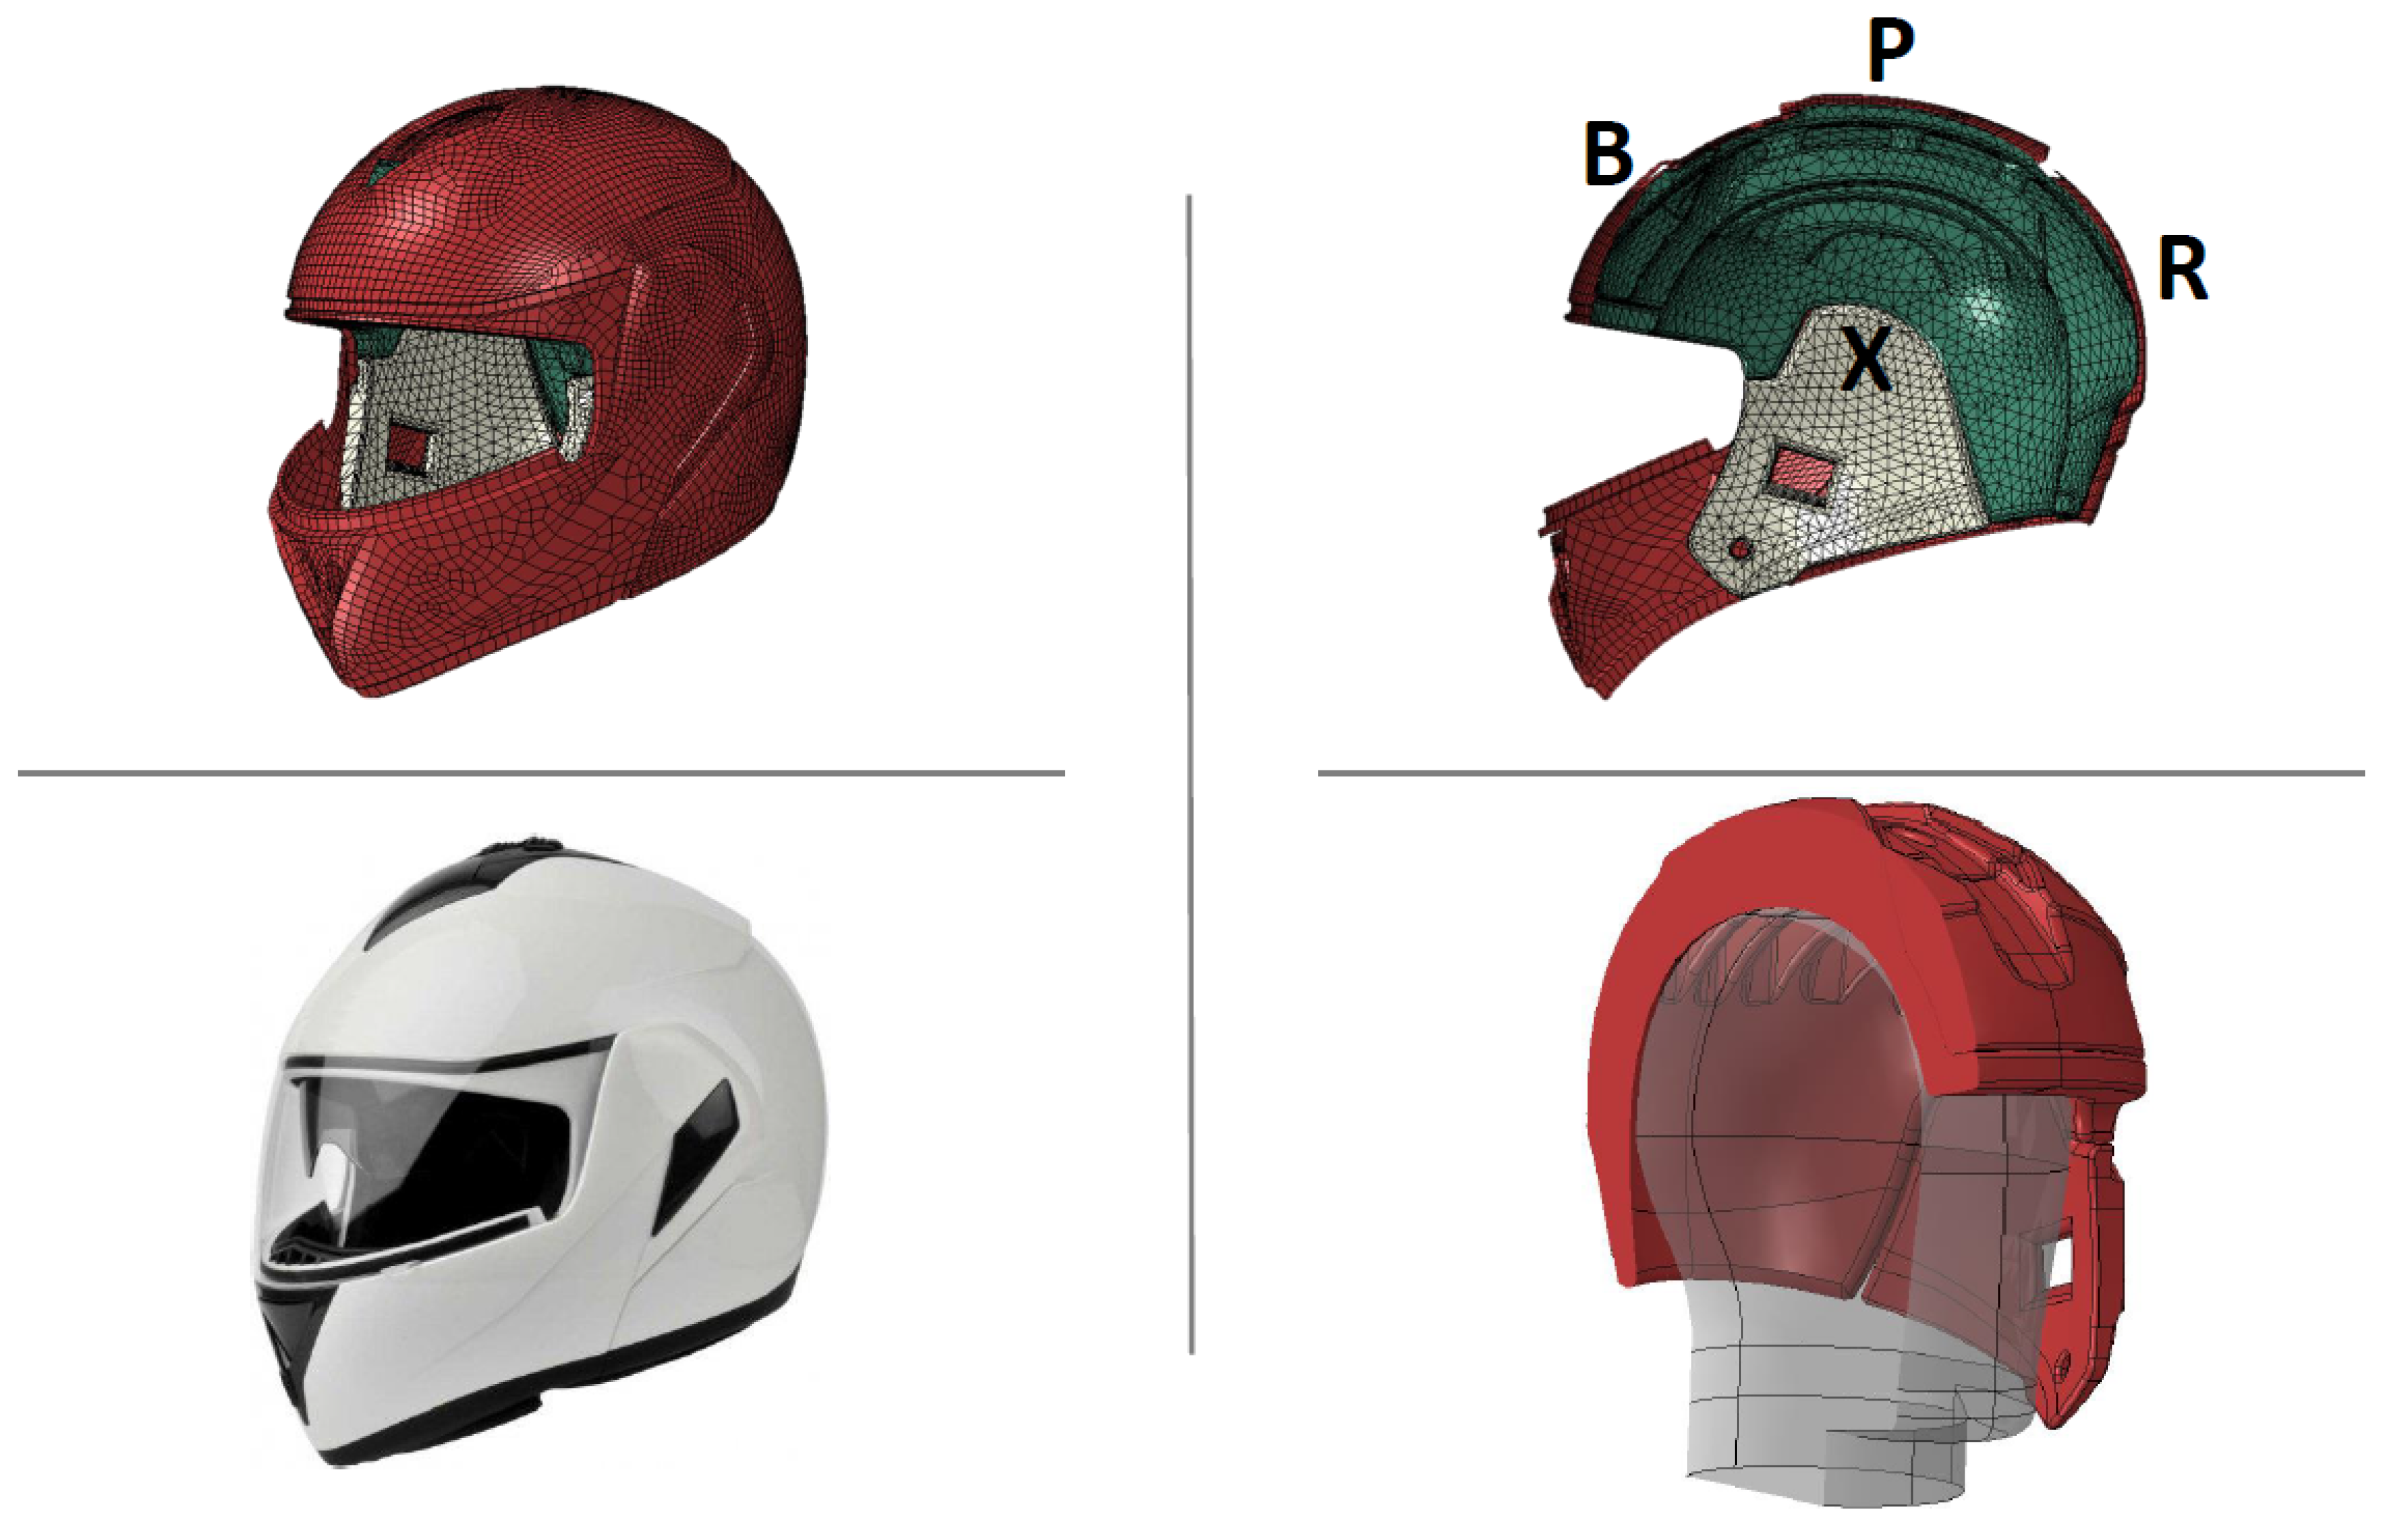
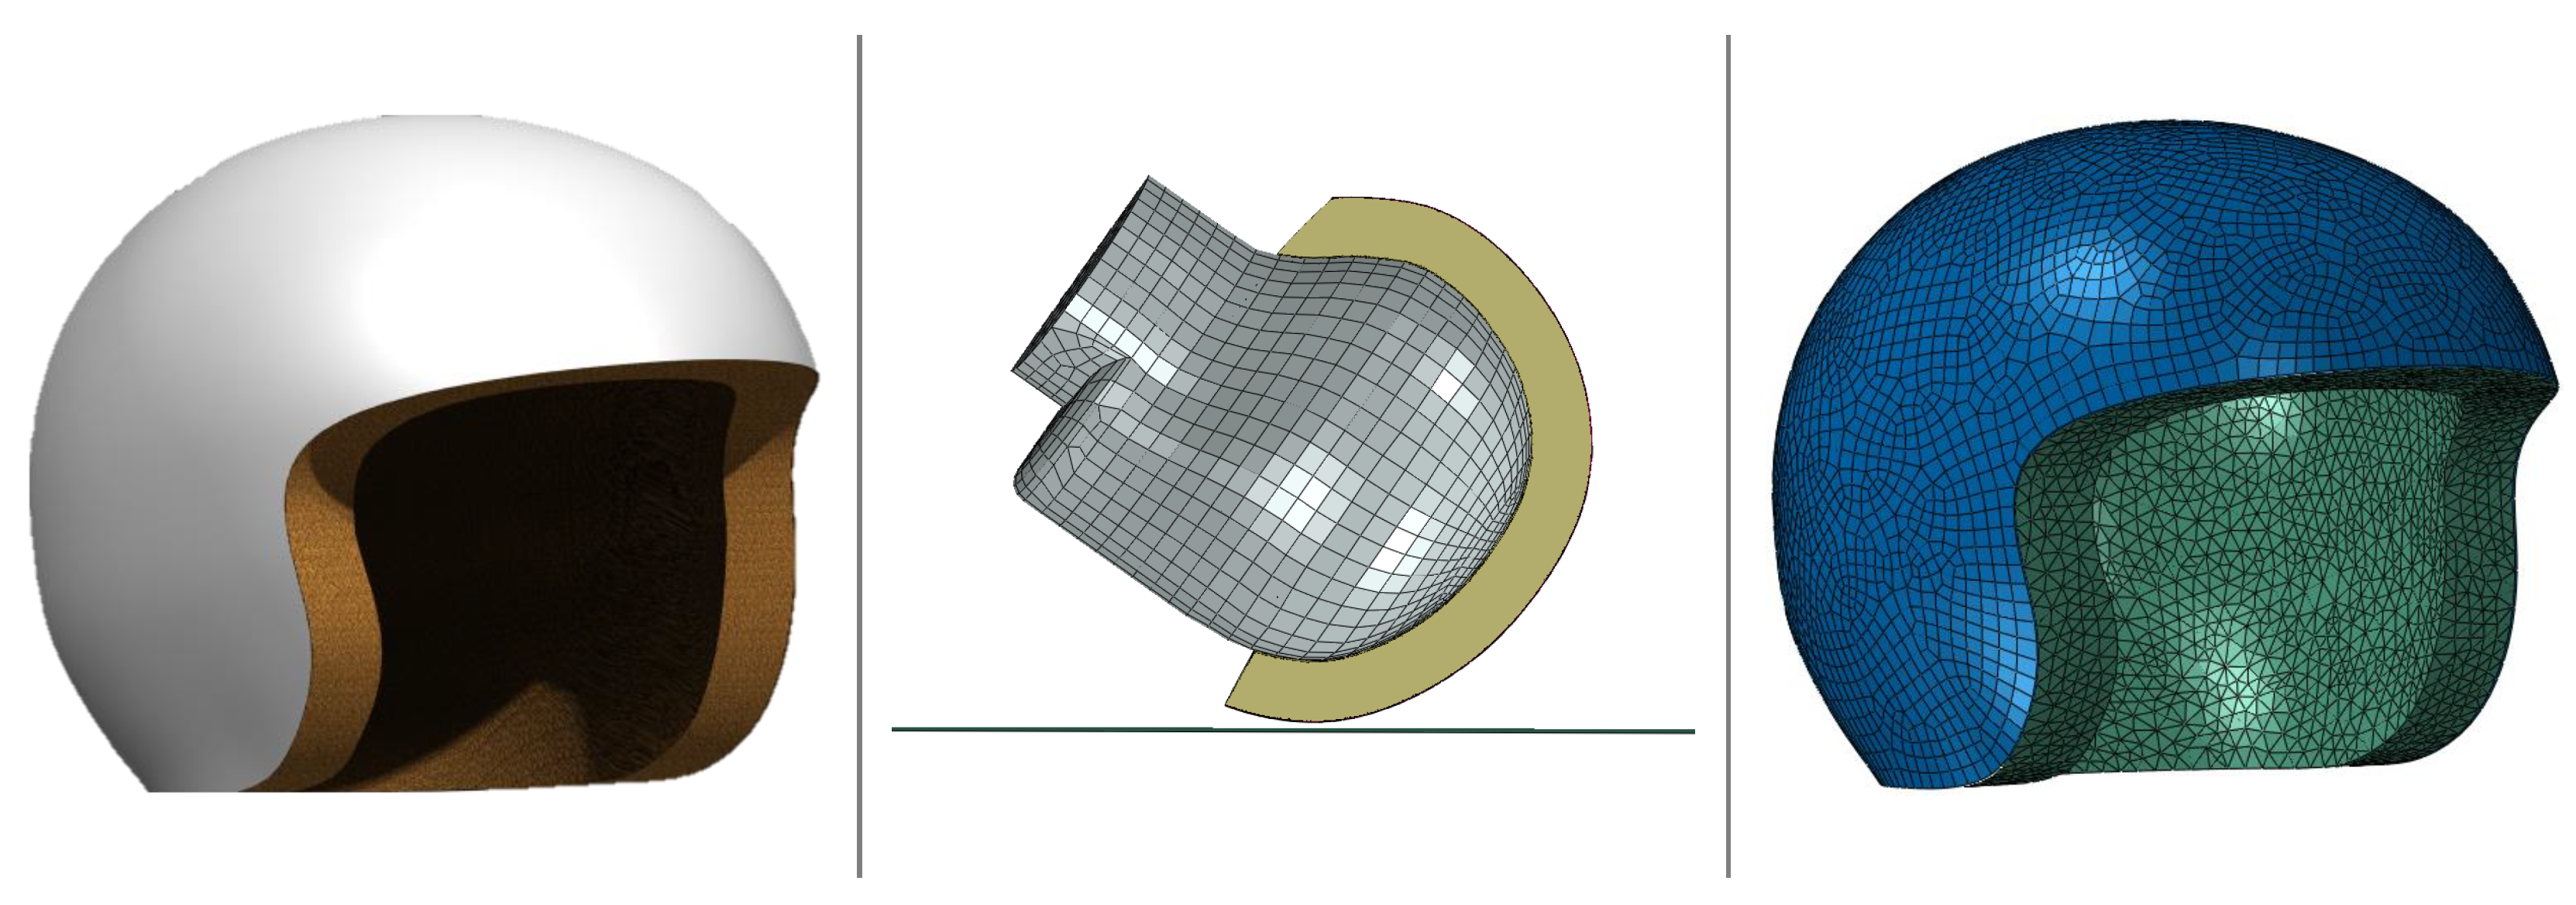
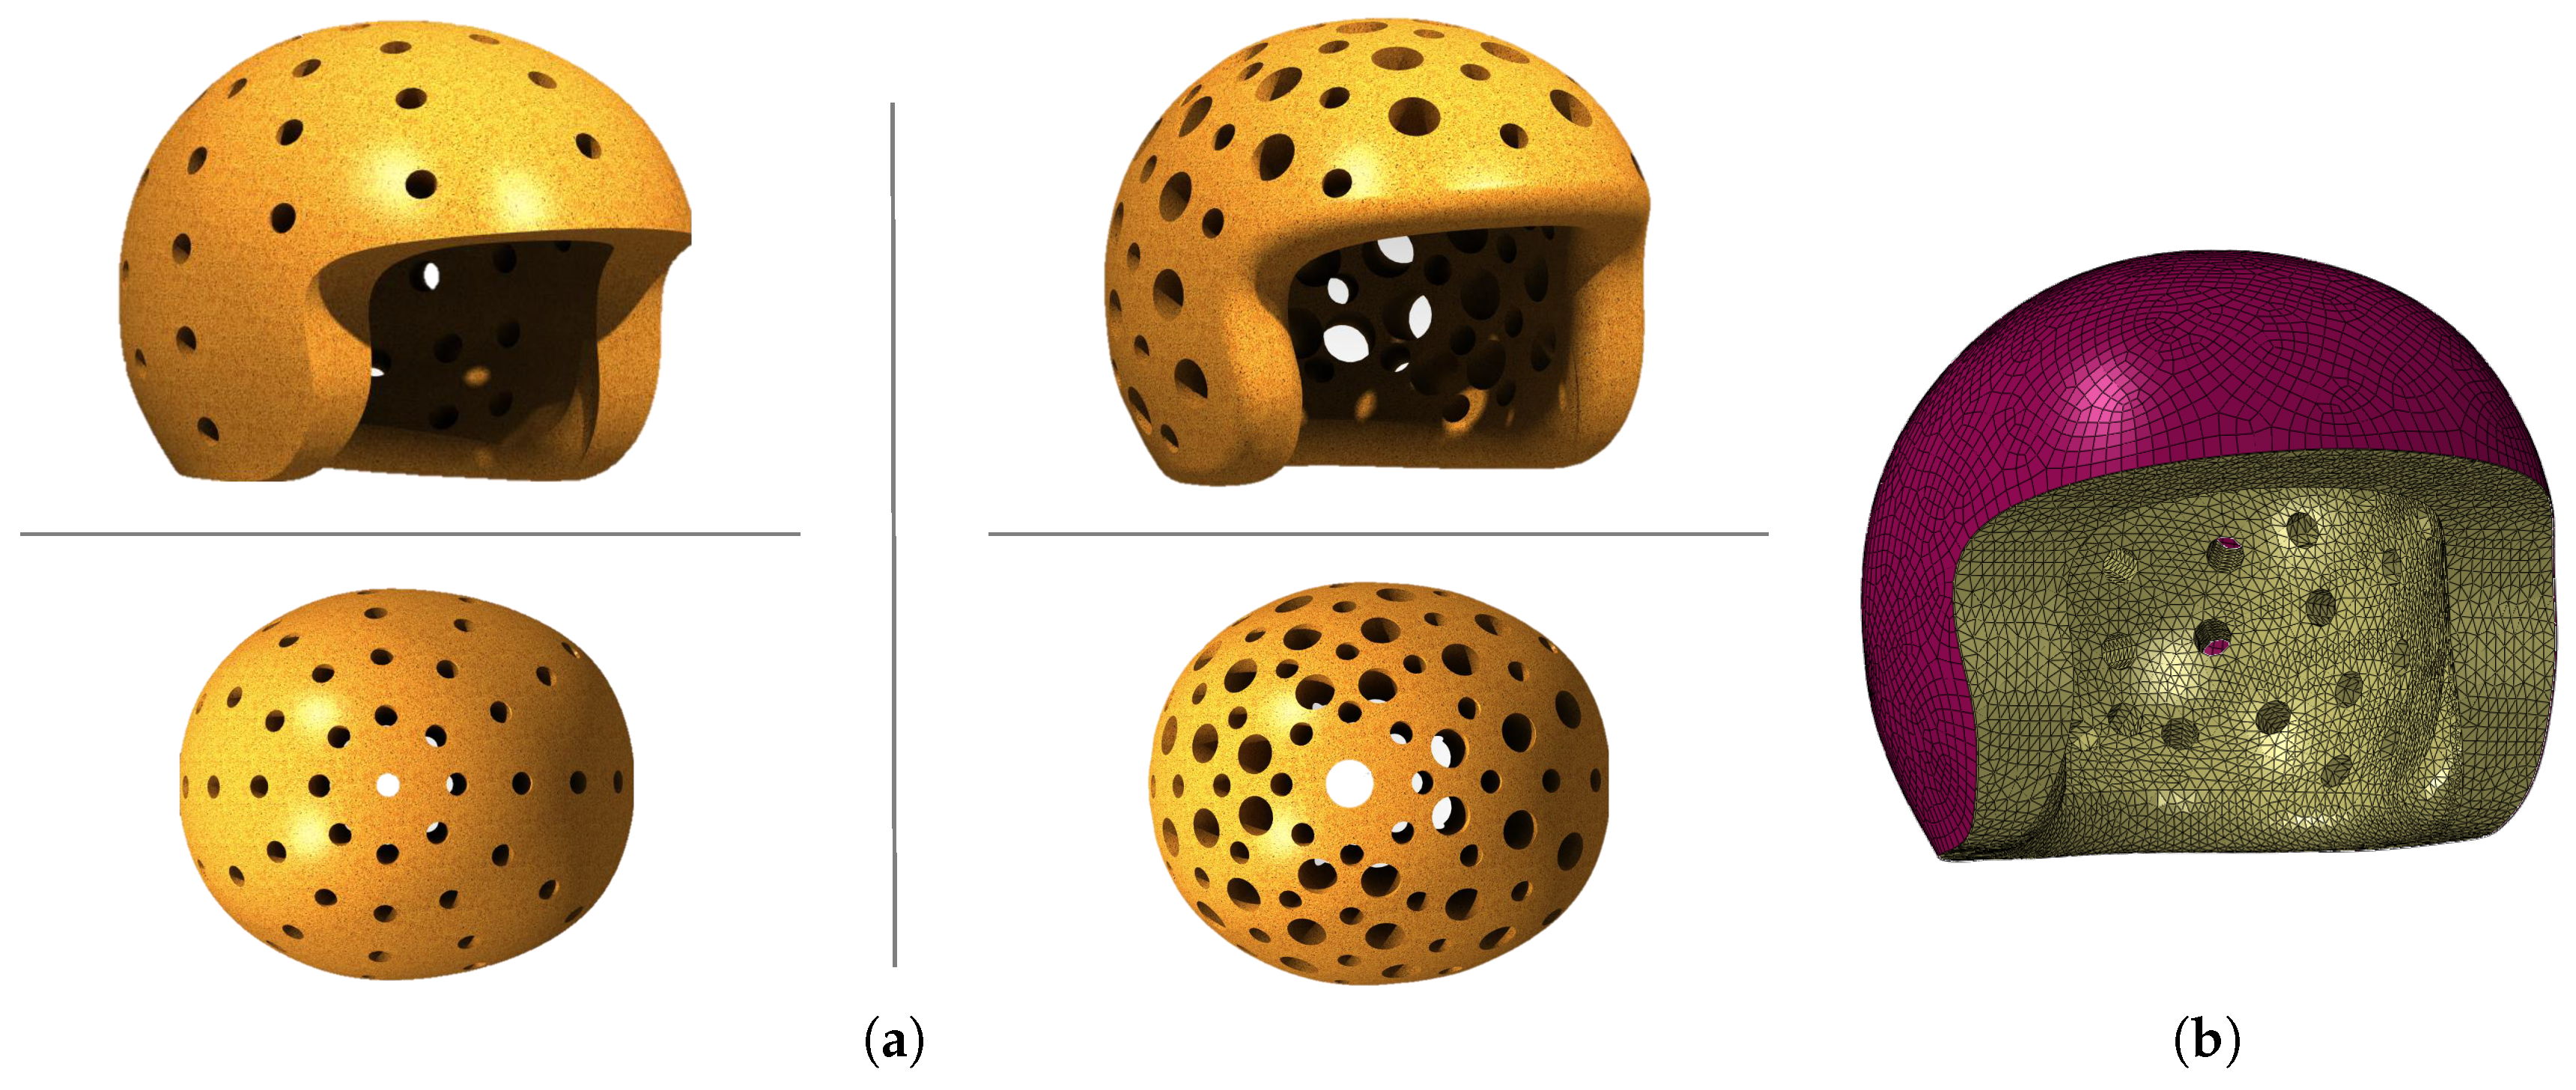
Summing up, a validated FE model of a commercially available helmet approved by the ECE 22.05 standard is tested with different liner materials (
Figure 1). This helmet fully meets the ECE 22.05 regulation [
50], the U.S. Regulation DOT [
51] and the Brazilian Regulation NBR-7471 [
52].
The developed FE helmet model includes the shell and liner. The latter is divided into three sub-parts. The liners thickness varies from 20 mm to 50 mm. The thickness of the green liner in
Figure 1 varies mostly between 40 and 50 mm, being only thinner at the low rear region. This represents a considerable thickness and a high EPS volume. The white liner thickness varies from 20 to 40 mm, being also thinner at the low rear. The outer shell made of ABS has a thickness of 3 mm.
The liners were meshed with four-node linear tetrahedral elements. The shell was modelled with four-node linear shell elements with enhanced hourglass control. The headform and anvils were modelled as rigid bodies. According to ECE 22.05 regulation, for a M size helmet, a 5.6 kg headform must be used [
50]. The developed FE headform model is shown in
Figure 1 and its principal inertial moments are
= 370 kg·cm
,
= 440 kg·cm
and
= 300 kg·cm
.
To simulate the interactions between the headform and the liner and the interactions between the anvil and the shell, a surface-to-surface type of contact with friction coefficients of 0.55 and 0.5 were used, respectively [
53].
Since the main objective of this work is to evaluate the applicability of cork agglomerates in helmet liners, the geometries were preserved and different validated material models (in [
4]) were used. In other words, the same helmet is used, changing only the liner material and keeping the same geometry. The same impacts used to validate the helmet with EPS liner were now simulated with cork agglomerates. Thus, the four impacts required by the ECE 22.05 standard are simulated for each one of the solutions.
According to the ECE 22.05 standard, the helmet-headform system is dropped, without any restriction, against an anvil with a velocity of 7.5 m/s. Thus, the anvil is fully constrained, and an impact velocity of 7.5 m/s was prescribed to the helmet-headform model for all impact configurations (B, P, R, and X impact points). The Abaqus Explicit solver was used to simulate the impacts, with the large deformation option activated.
2.1.2. Material Modelling
Agglomerated cork is primarily modelled with the hyperfoam model. This is an isotropic and nonlinear model typically used to characterize elastomeric foams that present hyperelastic behavior. It is valid for cellular solids, whose porosity permits very large volumetric changes [
54]. It is also intended for finite-strain applications where it can deform elastically to large strains, up to 90% strain in compression. In addition, agglomerated cork has a Poisson’s ratio of approximately zero, which means that a typical hyperelastic model is not suitable.
Hyperfoam is defined by a strain energy potential, also known as strain energy density function, which defines the strain energy stored in the material per unit of reference volume as function of the strain in the material:
where
N is an integer (the polynomial order),
are the principal stretches,
J is the elastic volume ratio (
),
are the shear moduli,
and
are curve-fitting material parameters. The latter are related to the material compressibility, where the initial bulk modulus,
, is given by the following expression:
For each term in the energy function, the coefficient
determines the degree of compressibility. The coefficient
is related to Poisson’s ratio,
, by the expressions:
Thus, if
is the same for all terms, there is a single effective Poisson’s ratio,
. The coefficients
are related to the initial shear modulus,
, by:
The principal stretches,
, are related to the principal nominal strains,
, by:
The hyperfoam model can be combined with another material model that provides a mechanism to include permanent energy dissipation and stress softening effects in elastomeric foams. To correctly model the permanent energy dissipation and stress softening effects in agglomerated cork, the Mullins effect model is used together with the hyperfoam material model. In other words, this material model is used to include the damage present in elastomeric foams, modelling energy absorption in foam components subjected to dynamic loading, under deformation rates that are high when compared to the characteristic foam time relaxation. In such cases, it is acceptable to assume that the foam material is damaged permanently, and the stress softening is interpreted as being due to damage at the microscopic level [
54]. The energy dissipation effects are introduced by an augmented strain energy density function of the form:
where
(
i = 1, 2, 3) represent the principal mechanical stretches and
is the strain energy potential for the primary foam behavior described by Equation (
1). The function
is a continuous function of the damage variable,
, and related to the damage function [
54]. The damage variable,
, varies continuously during the deformation and always satisfies
, with
on the points of the primary curve (described by the hyperfoam model). When the damage function
satisfies the condition
, the deformation state of the material relies on the curve representing the primary foam behavior,
and the augmented energy function reduces to the strain energy potential for the primary foam behavior and thus, the material model responsible for mimicking the mechanical behavior is only the hyperfoam. With Mullins effect, the stresses are computed by:
where
is the stress corresponding to the primary foam behavior at the current deformation level
. Thus, the stress is obtained by simply scaling the stress of the primary foam behavior with the damage variable,
. From any given strain level, the model predicts unloading/reloading along a single curve (that is different, in general, from the primary behavior) that passes through the origin of the stress-strain plot. The model also predicts energy dissipation under purely volumetric deformation [
54]. The damage variable,
, varies with the deformation according to:
where
is the maximum value of
at a material point during its deformation history;
r,
and
m are material parameters (without direct physical interpretations) and
is the error function. While the parameters
r and
are dimensionless, the parameter
m has the dimensions of energy. The parameter
m controls whether the damage occurs at low strain levels;
r and
control the amount of damage.
When
, corresponding to a point on the primary curve,
1. On the other hand, upon removal of deformation, when
0, the damage variable,
attains its minimum value,
, given by:
For all intermediate values of
,
varies monotonically between 1 and
. The recoverable part of the energy is obtained by subtracting the dissipated energy from the augmented energy as:
where the residual value of the augmented energy function,
, represents the energy dissipated due to damage in the material, upon complete unloading. The damage energy accumulates with progressive deformation along the primary curve and remains constant during unloading. During unloading, the recoverable part of the strain energy is released. The latter becomes zero when the material point is completely unloaded. Upon further reloading from a completely unloaded state, the recoverable part of the strain energy increases from zero. When the maximum strain that was attained earlier is exceeded upon reloading, further accumulation of damage energy occurs.
On the other hand, EPS foam was modelled as a nonlinear plastic material, with the elastic part as linear isotropic elasticity. To simulate the plastic behavior, the crushable foam material model was employed. This model is intended for the analysis of crushable foams that are typically used as energy absorption structures. In addition, this model is typically used for foam materials that deform by developing permanent deformation.
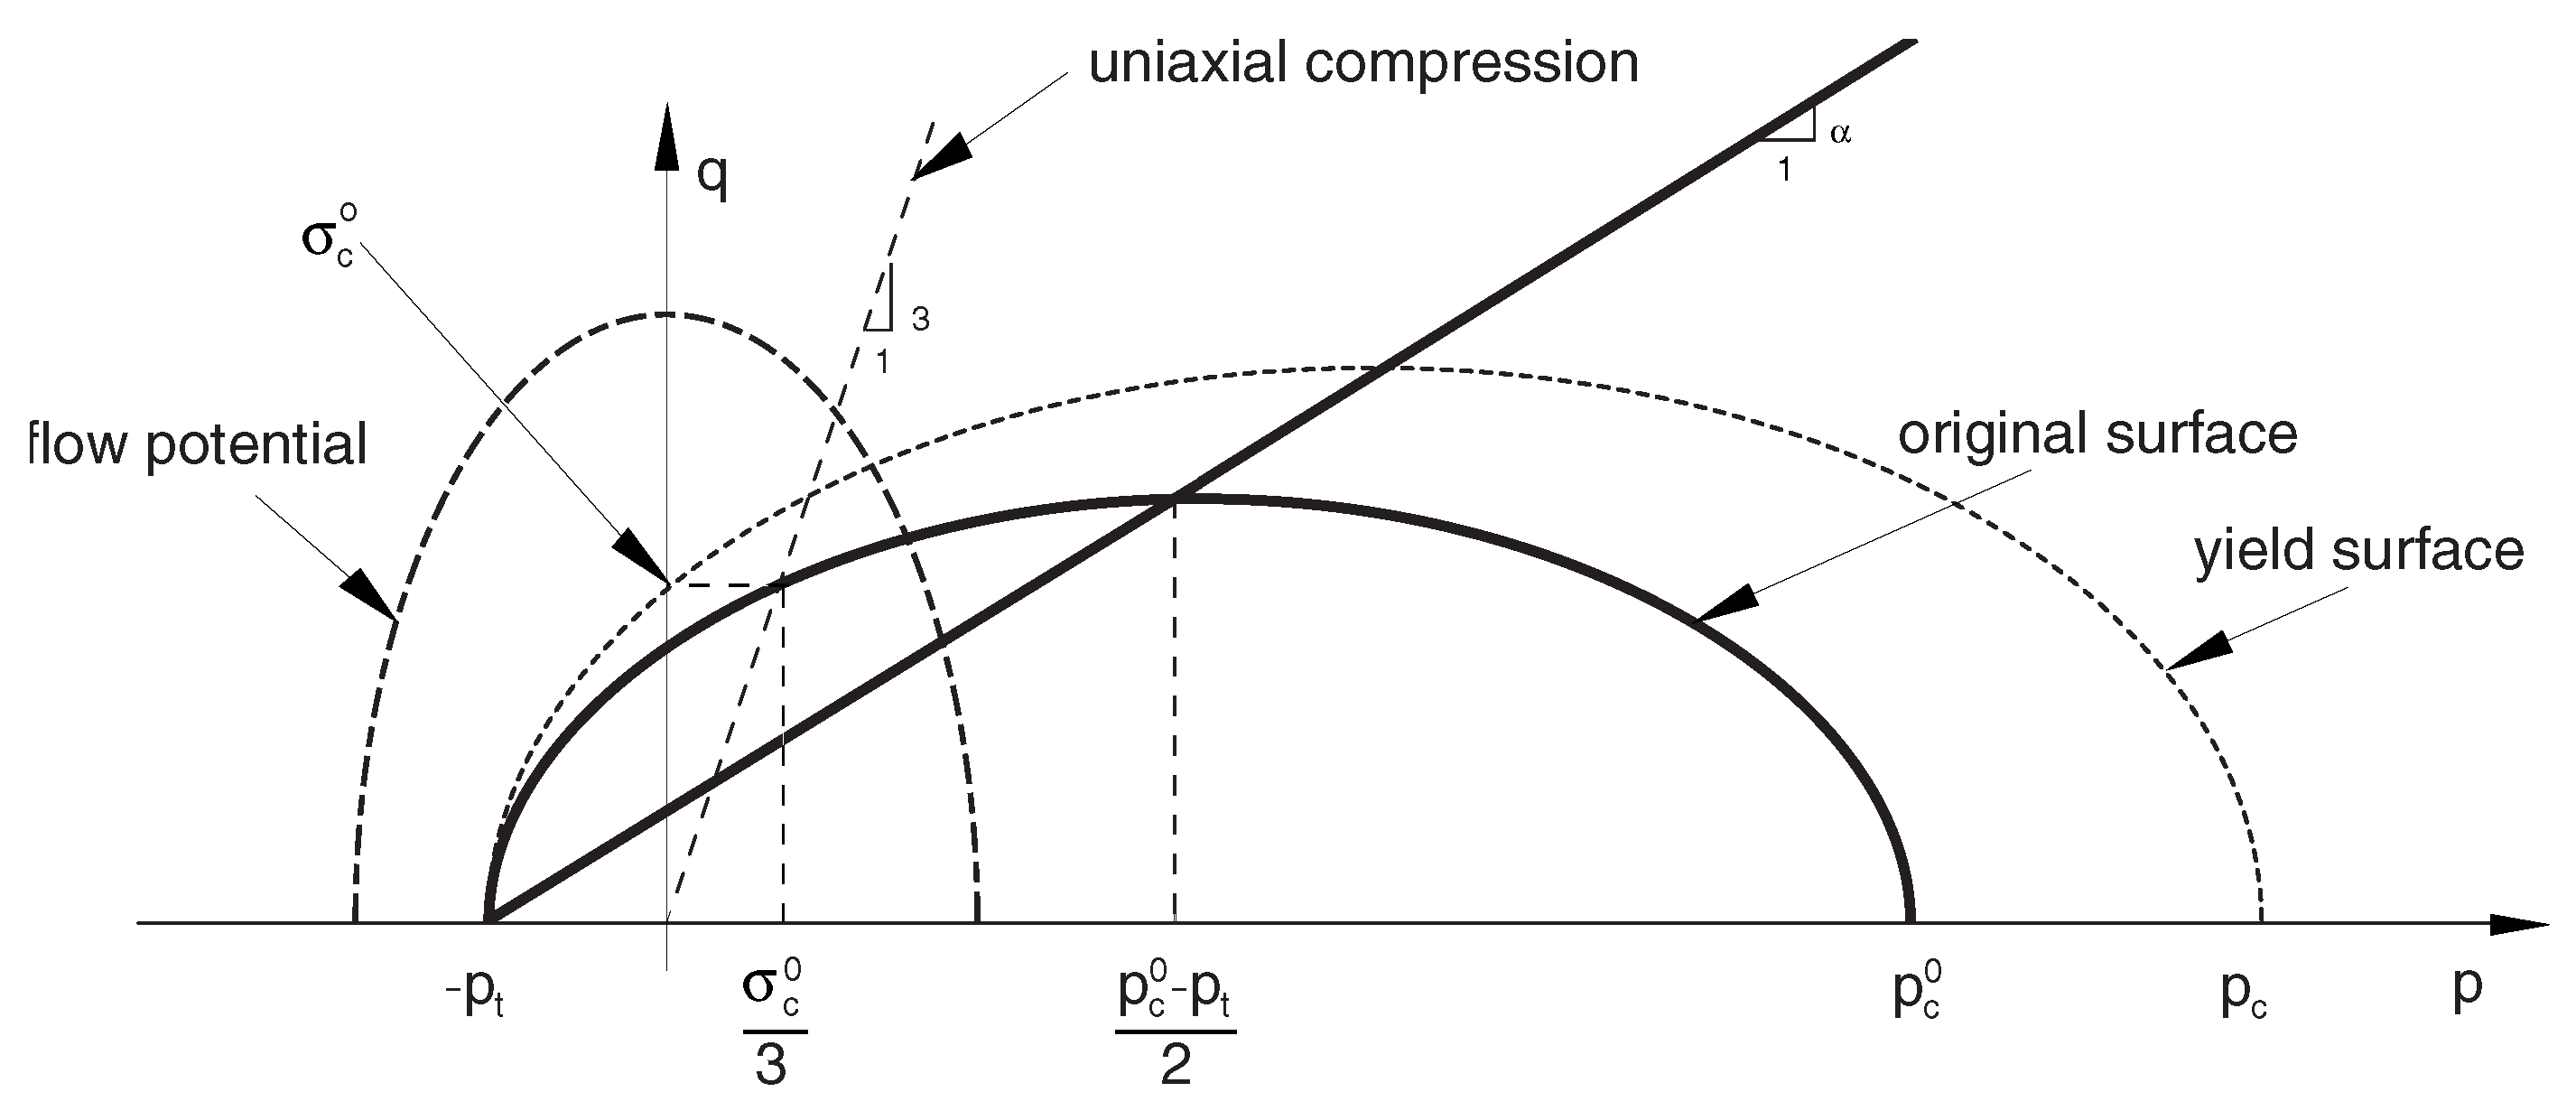
The yield surface is a von Mises circle in the deviatoric stress plane and an ellipse in the meridional (
p-
q) stress plane [
54]. The crushable foam model with volumetric hardening uses a yield surface with an elliptical dependence of deviatoric stress on pressure. A point on the yield ellipse in the meridional plane that represents hydrostatic tension loading is fixed and the evolution of the yield surface is driven by the volumetric compacting plastic strain [
54]. Thus, it assumes that the evolution of the yield surface is controlled by the volumetric compacting plastic strain experienced by the material. The yield surface for the volumetric hardening model is defined as:
| is the pressure; |
| is the von Mises stress; |
| is the deviatoric stress and I is the identity matrix; |
| is the size of the (vertical) q-axis of the yield ellipse; |
| is the size of the (horizontal) p-axis of the yield ellipse; |
| is the shape factor of the yield ellipse; |
| is the center of the yield ellipse on the p-axis; |
| is the yield stress in hydrostatic compression (always positive); |
| is the strength of the material in hydrostatic tension. |
The yield surface represents the von Mises circle in the deviatoric stress plane and is an ellipse on the meridional stress plane, as depicted in
Figure 2.
The yield surface evolves with a constant
and thus,
can be computed using the initial yield stress in uniaxial compression,
, the initial yield stress in hydrostatic compression,
(the initial value of
), and the yield strength in hydrostatic tension,
, by:
For a valid yield surface, the choice of strength ratios must be such that k has a value between 0 and 3 and is positive. To define the shape of the yield surface, values are provided to k and as input for the material model and thus, the necessary , and are defined.
The values for the strength ratios here used are based on the ones determined by Mills et al. [
53]. The foam hardening curve (yield stress vs. uniaxial plastic strain) for EPS is the same used as input data in [
4]. More details about material testing and modelling, including validation, can be found in [
4].
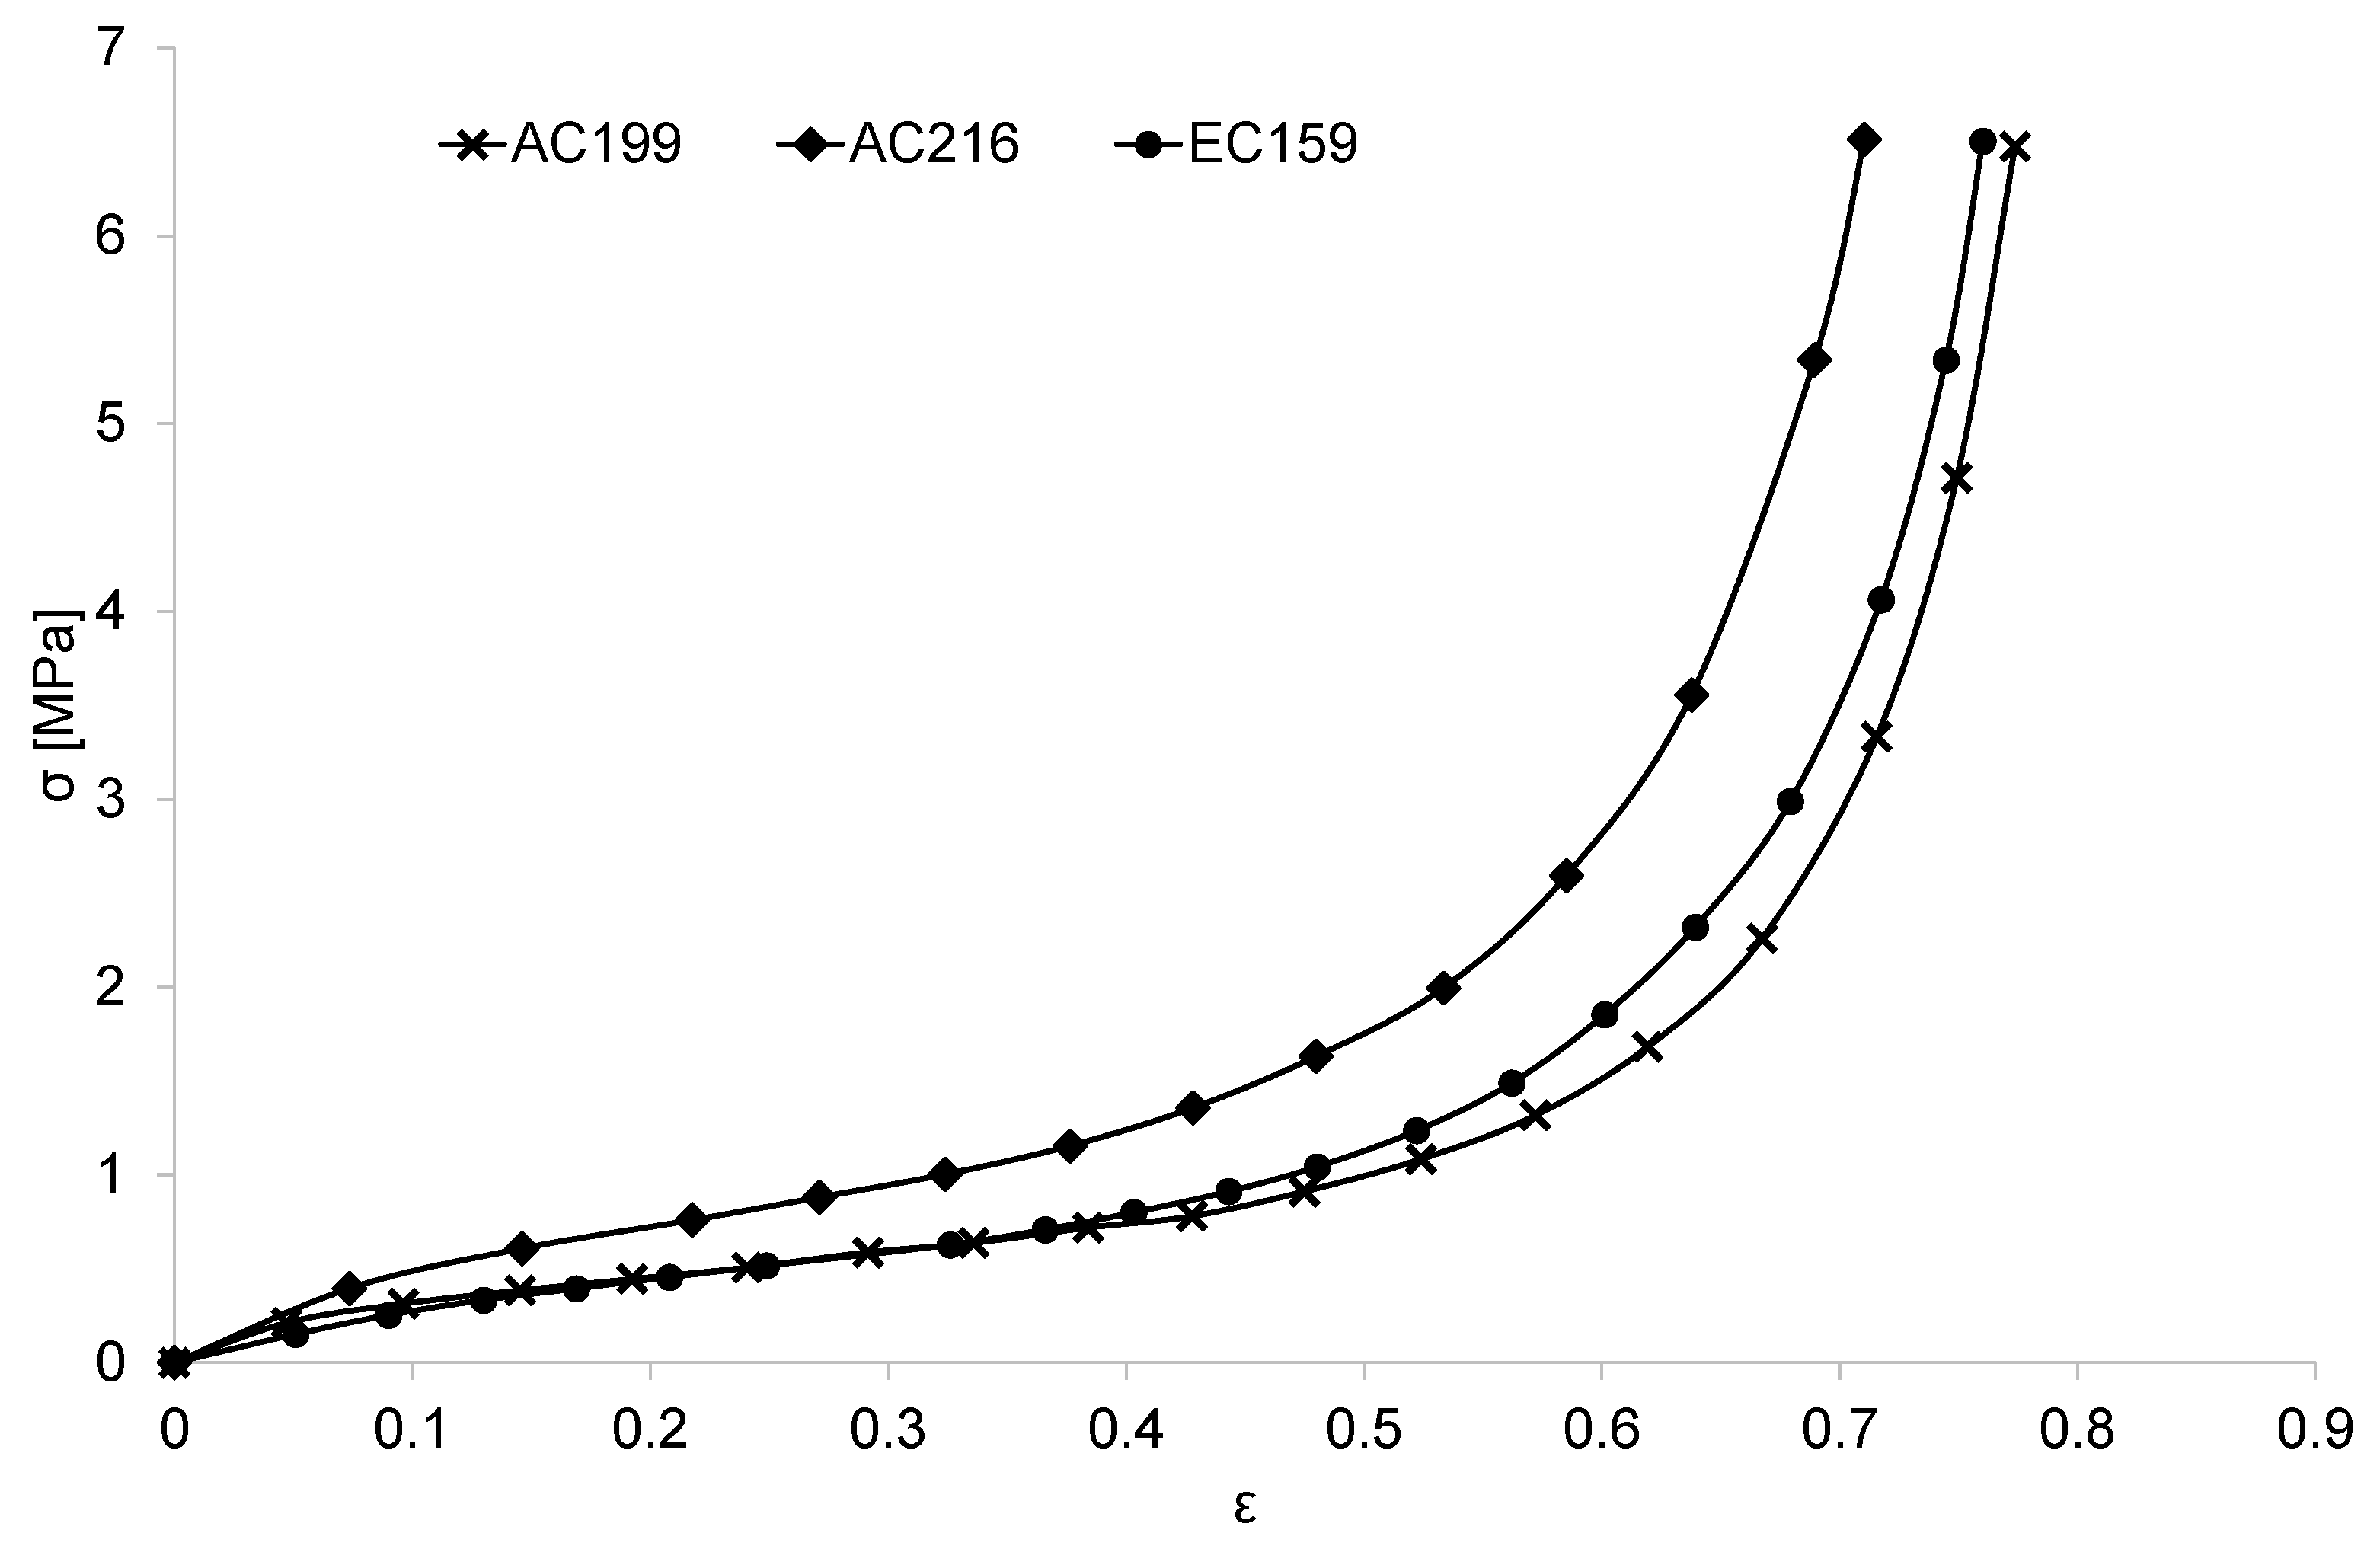
Figure 3 depicts the cork agglomerates response under quasi-static loading, which were used as input data in the hyperfoam model. Scaling factors were included to account with strain rate effects. The strain energy potential order,
N, used in hyperfoam material model was 3. This was concluded as the best value to model agglomerated cork. These and other important material properties used as input in the models are given in
Table 1.
To simulate ABS mechanical behavior, an isotropic linear-elastic material model was considered. The material properties used to model ABS and based on previous studies, are given in
Table 1.
Several cork agglomerates were tested in [
4] under quasi-static and dynamic loading rates, including two different types, the expanded cork (EC) also known as black agglomerate and the agglomerated cork (AC) also known as white cork. The cork agglomerates AC199, AC216 and EC159, previously tested and validated in [
4] were the most promising ones regarding this type of application. Thus, these three were selected as most promising ones to surpass EPS liners.
2.1.3. Comparison between EPS Liners and Agglomerated Cork Liners
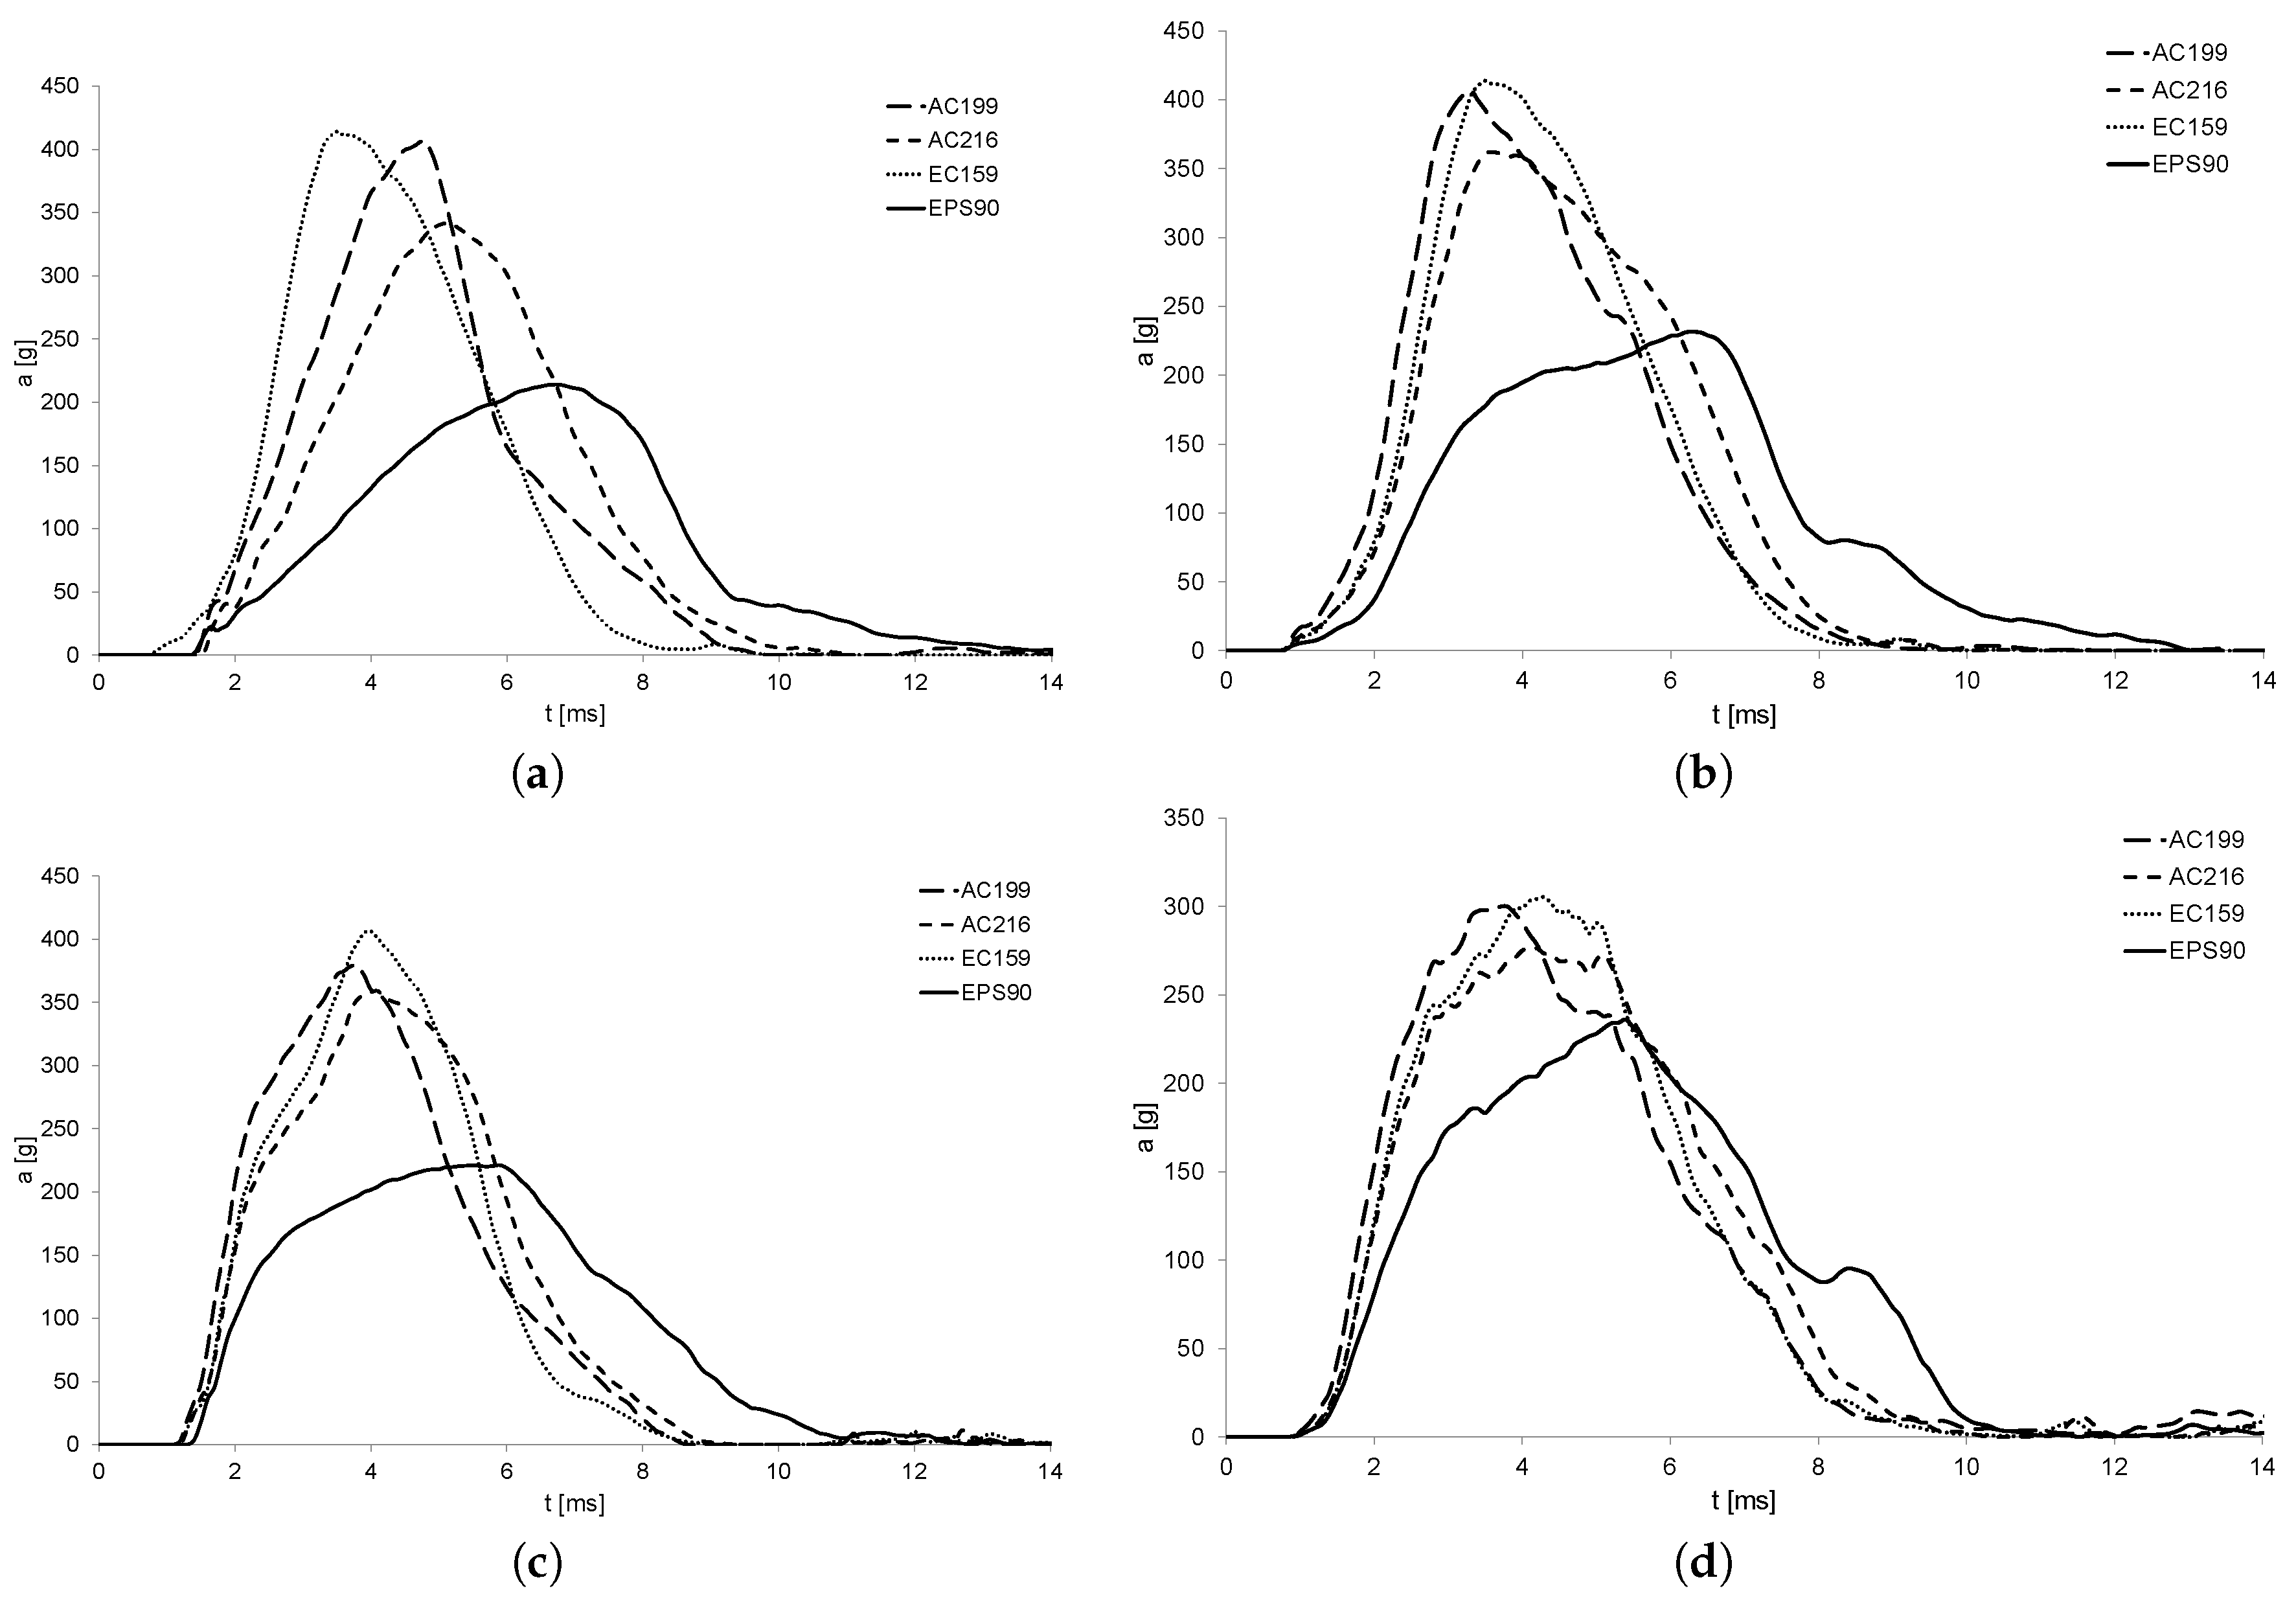
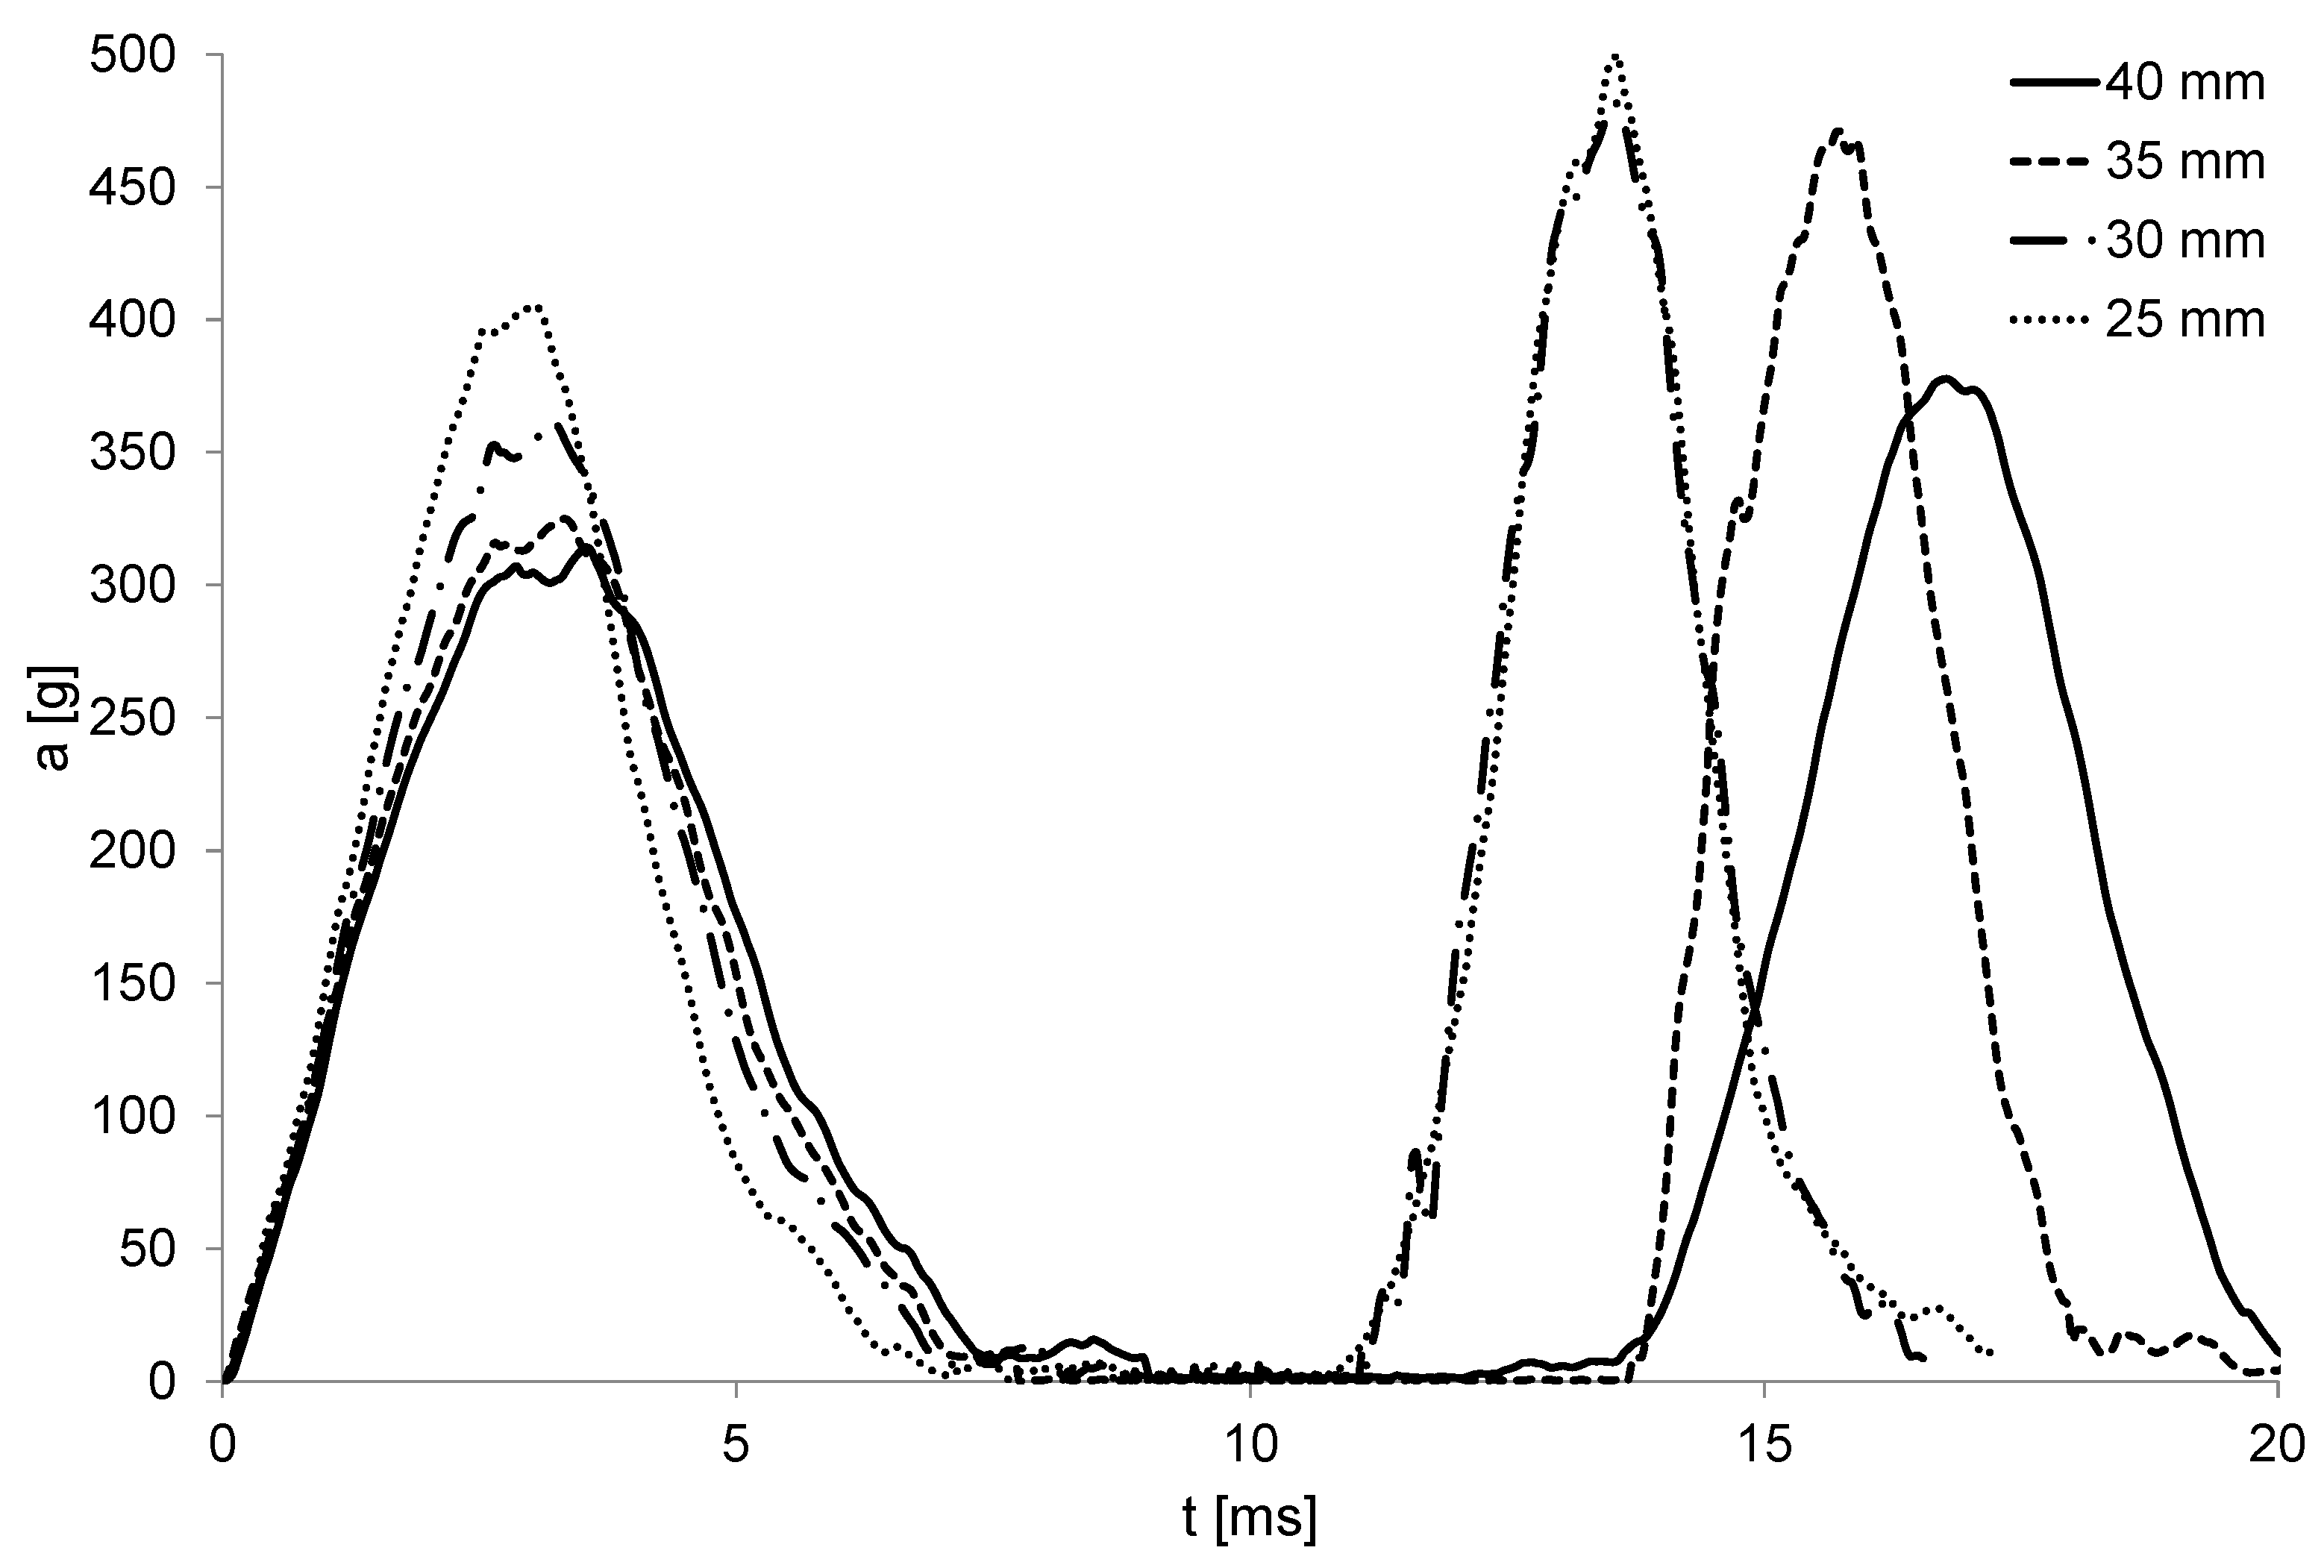
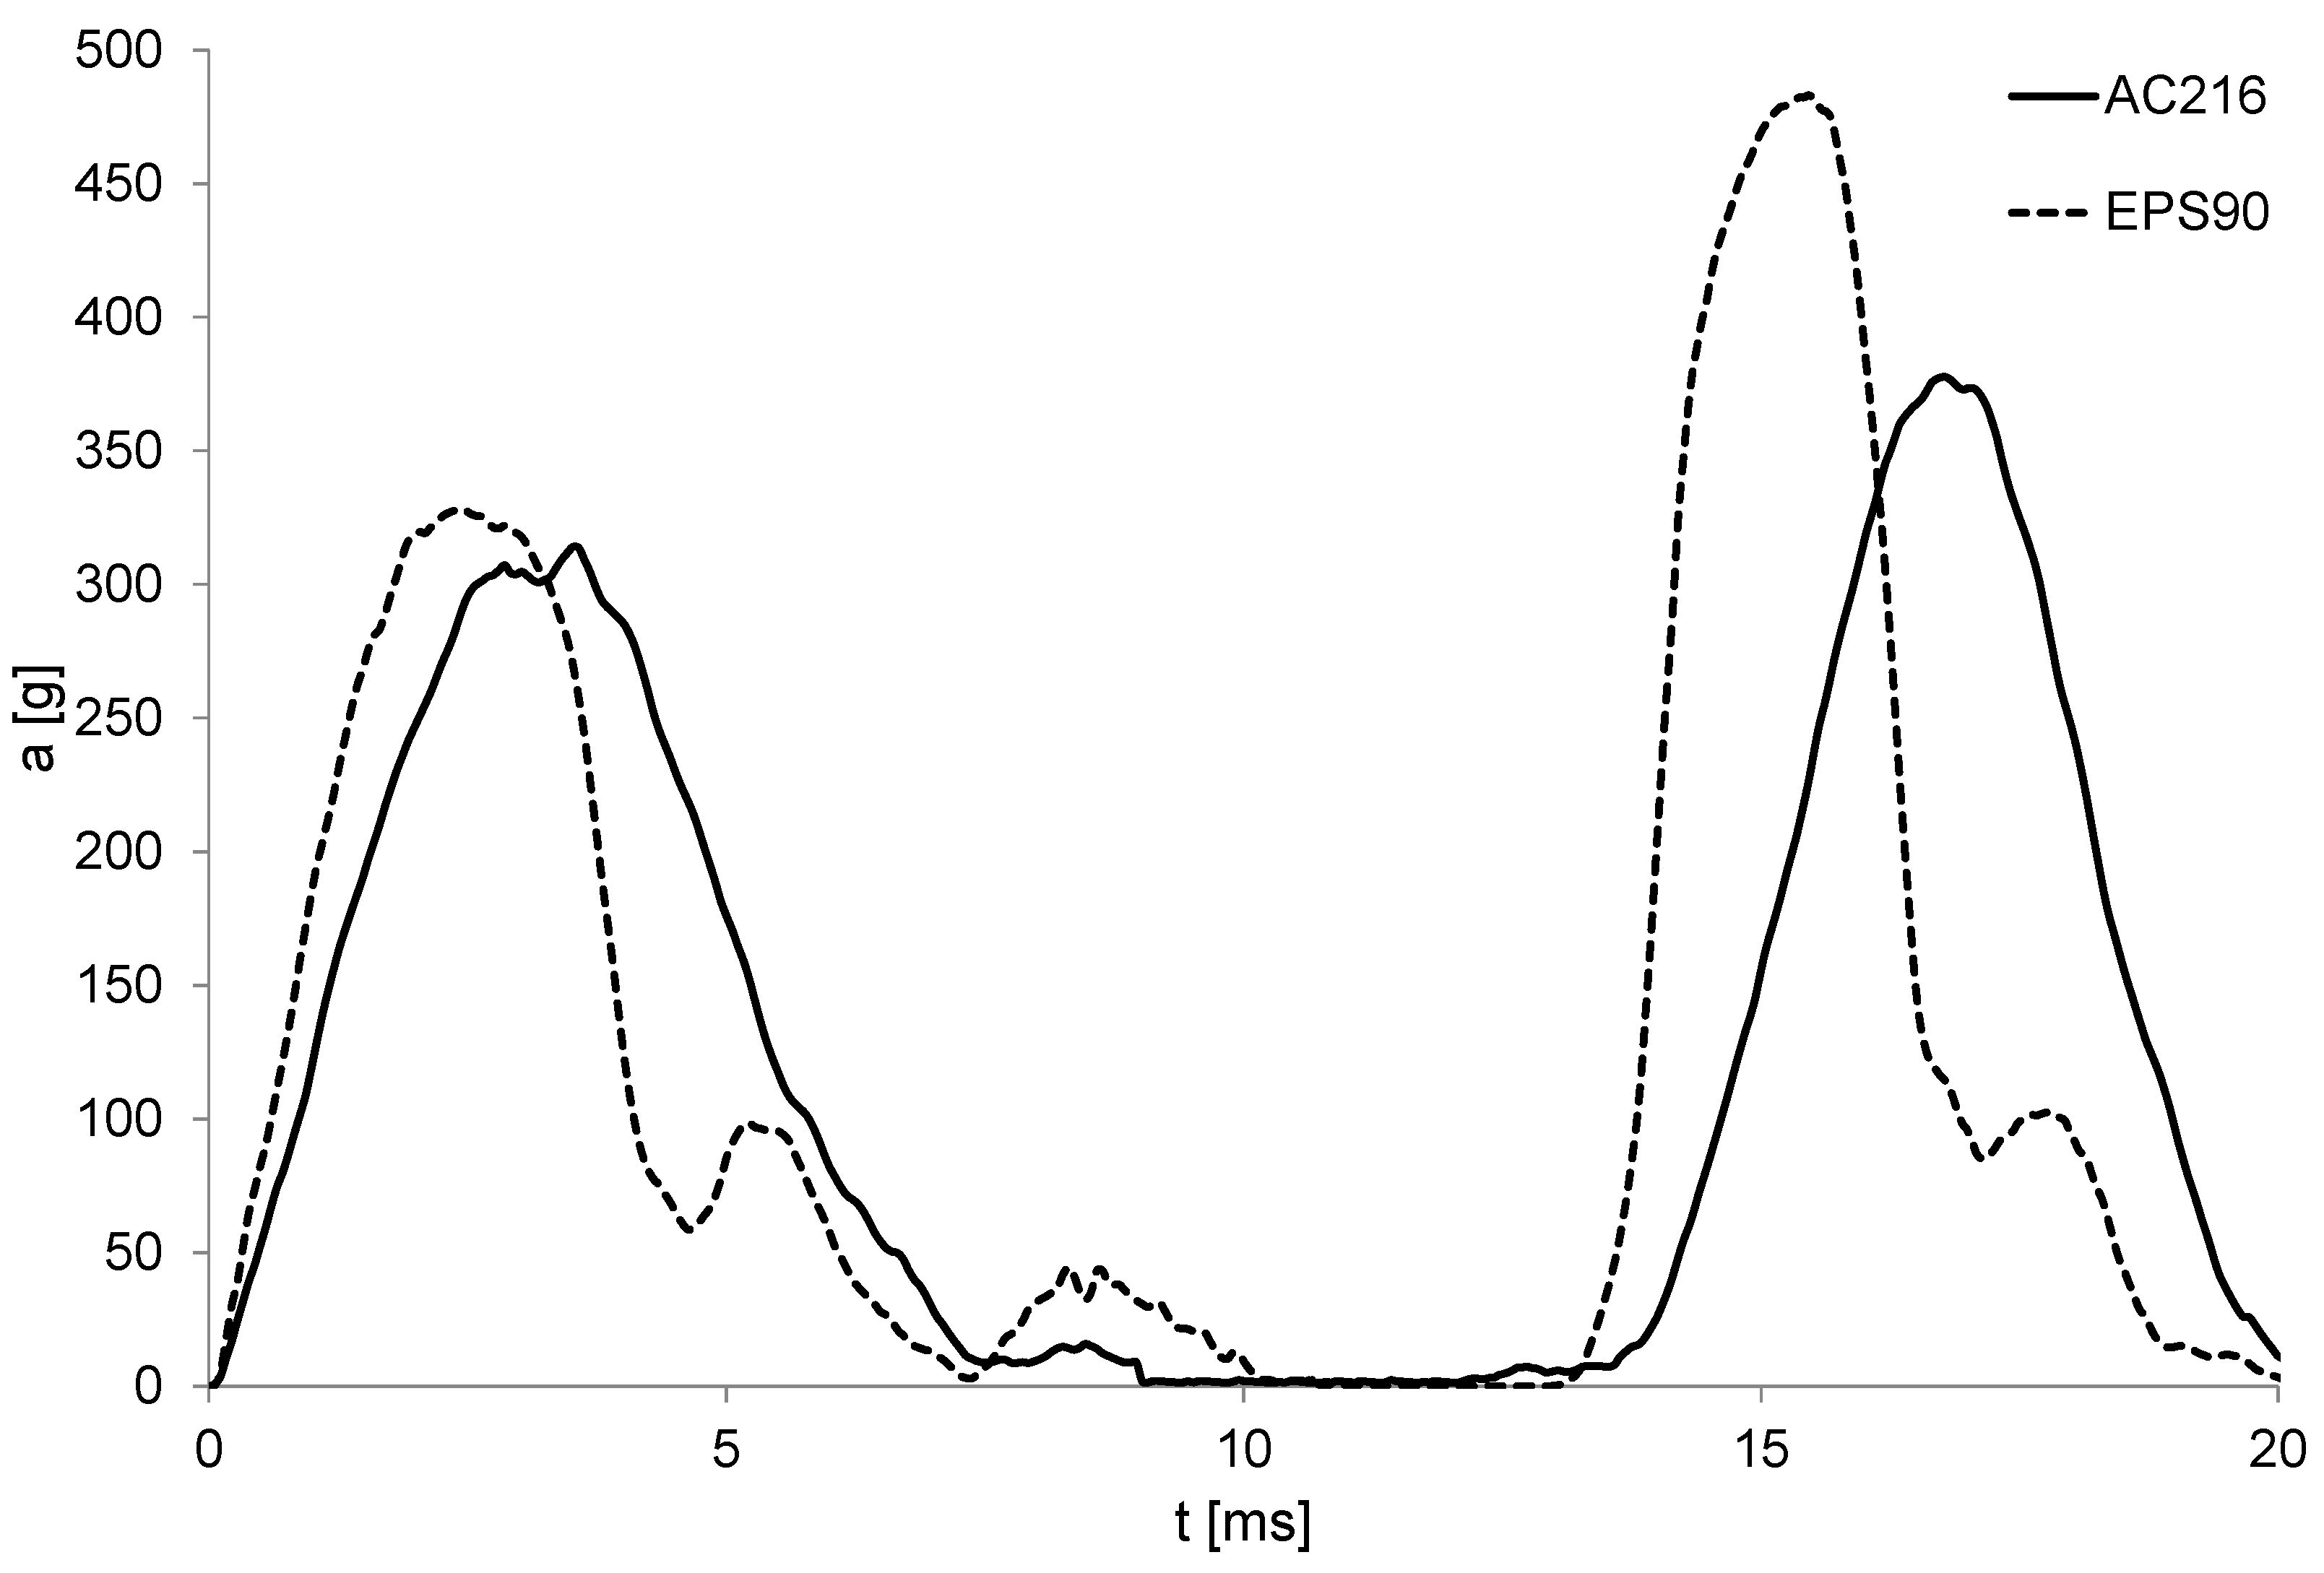
Figure 4 shows the results obtained for each material in terms of acceleration measured in the headform. Clearly, the EPS performed better in all the four impacts. Nevertheless, the results obtained for impact point X reveal a closer response between cork agglomerates and EPS than for other impact points.
One cork agglomerate that stood out from the others for all the four impacts was AC216. This AC had a clear better performance than the other agglomerates. In all the four impacts, AC216 had wider acceleration-time curves with lower peak accelerations. In [
4], AC216 was also the better cork agglomerate in the impact tests, showing lower peak accelerations. Additionally, AC216 was the best material regarding the response to a second impact, even better than EPS90.
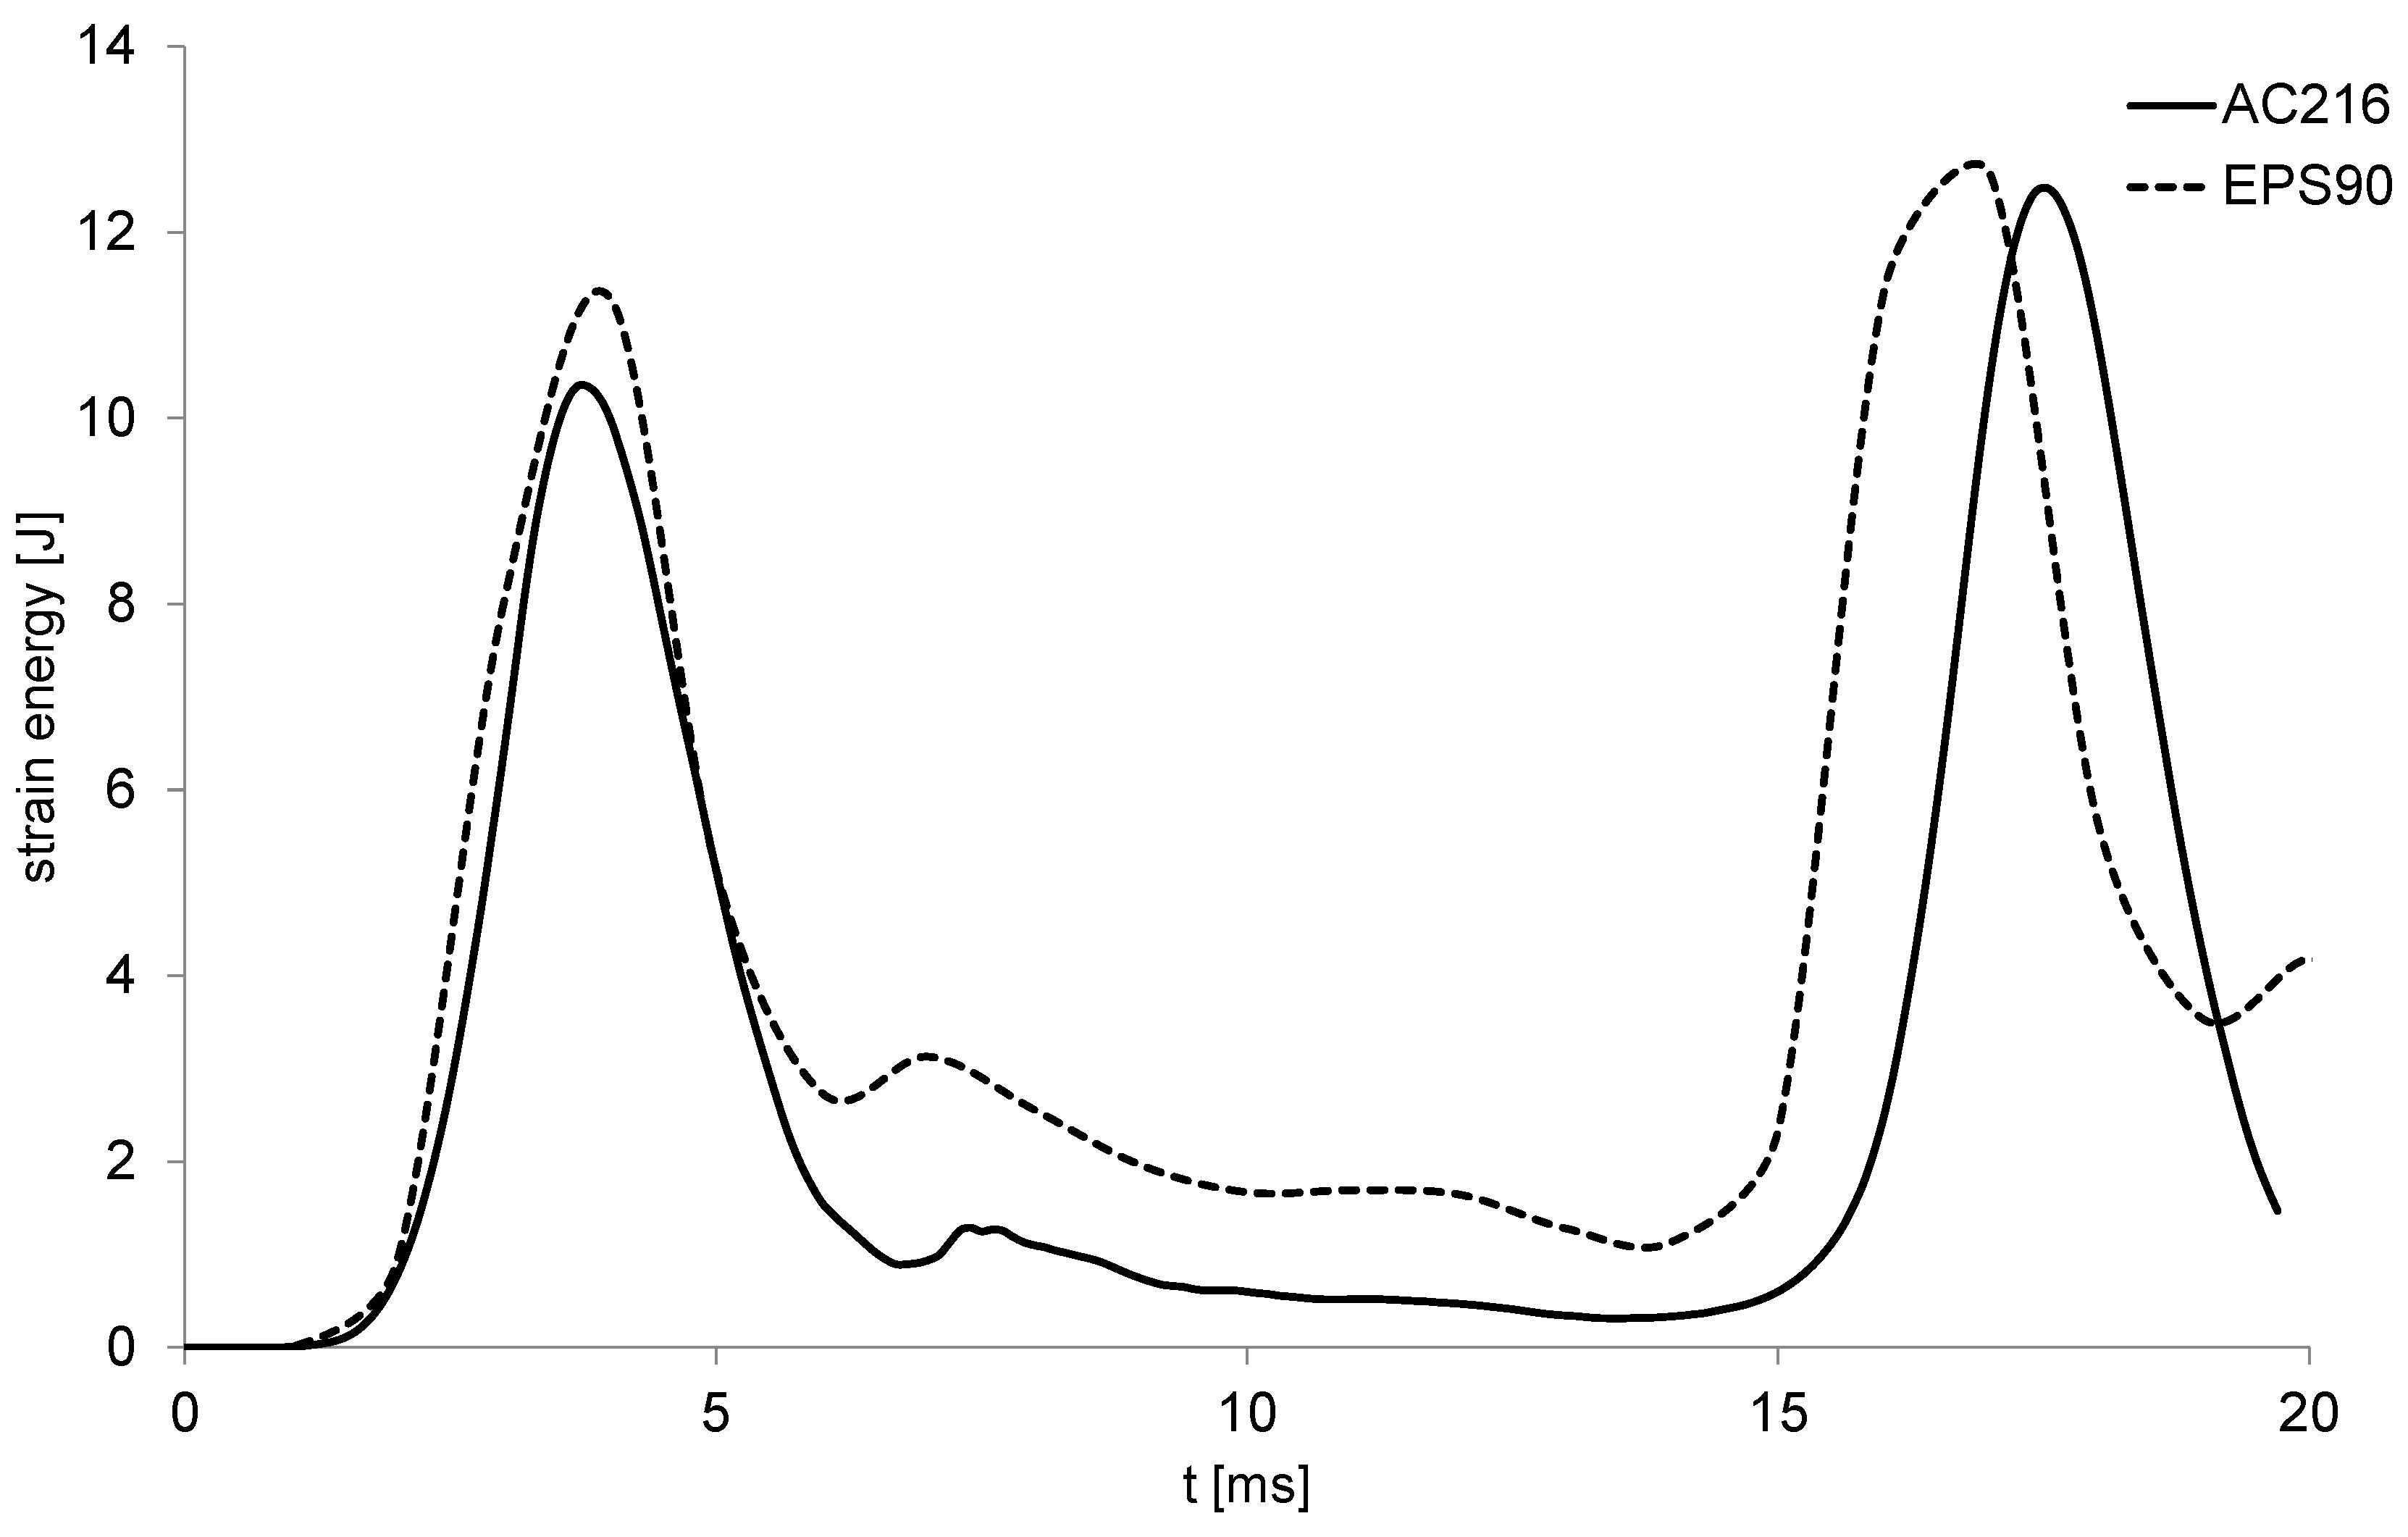
Although EPS90 had clearly a better response in all the impacts, from what was seen in the double impacts performed by Fernandes et al. [
4], AC216 has a greater capacity to withstand impact energy. Thus, it is believed that the helmet used in this analysis has a liner with a thickness higher than necessary for AC216. Actually, the better results with the cork liners were obtained for impact X, which is the region of the helmet where the liner is thinner (between 35–40 mm at the impact point). The larger area of the helmet has a thickness of 50 mm, which decreases in the areas next to the edges, especially at the rear end. This means a high volume and in the case of AC216, it means more mass, since it is the densest material. Thus, the kinetic energy is greater in the case of AC216.
Therefore, it is believed that a thinner liner made of AC216 will perform better, even when subjected to multi-impacts. Nevertheless, it is important to retain the fact that AC216 reaches the densification phase sooner than EPS90. The AC216 enters this region for nominal strains higher than 0.6 (
Figure 3), as shown by Jardin et al. [
14] and Fernandes et al. [
4].
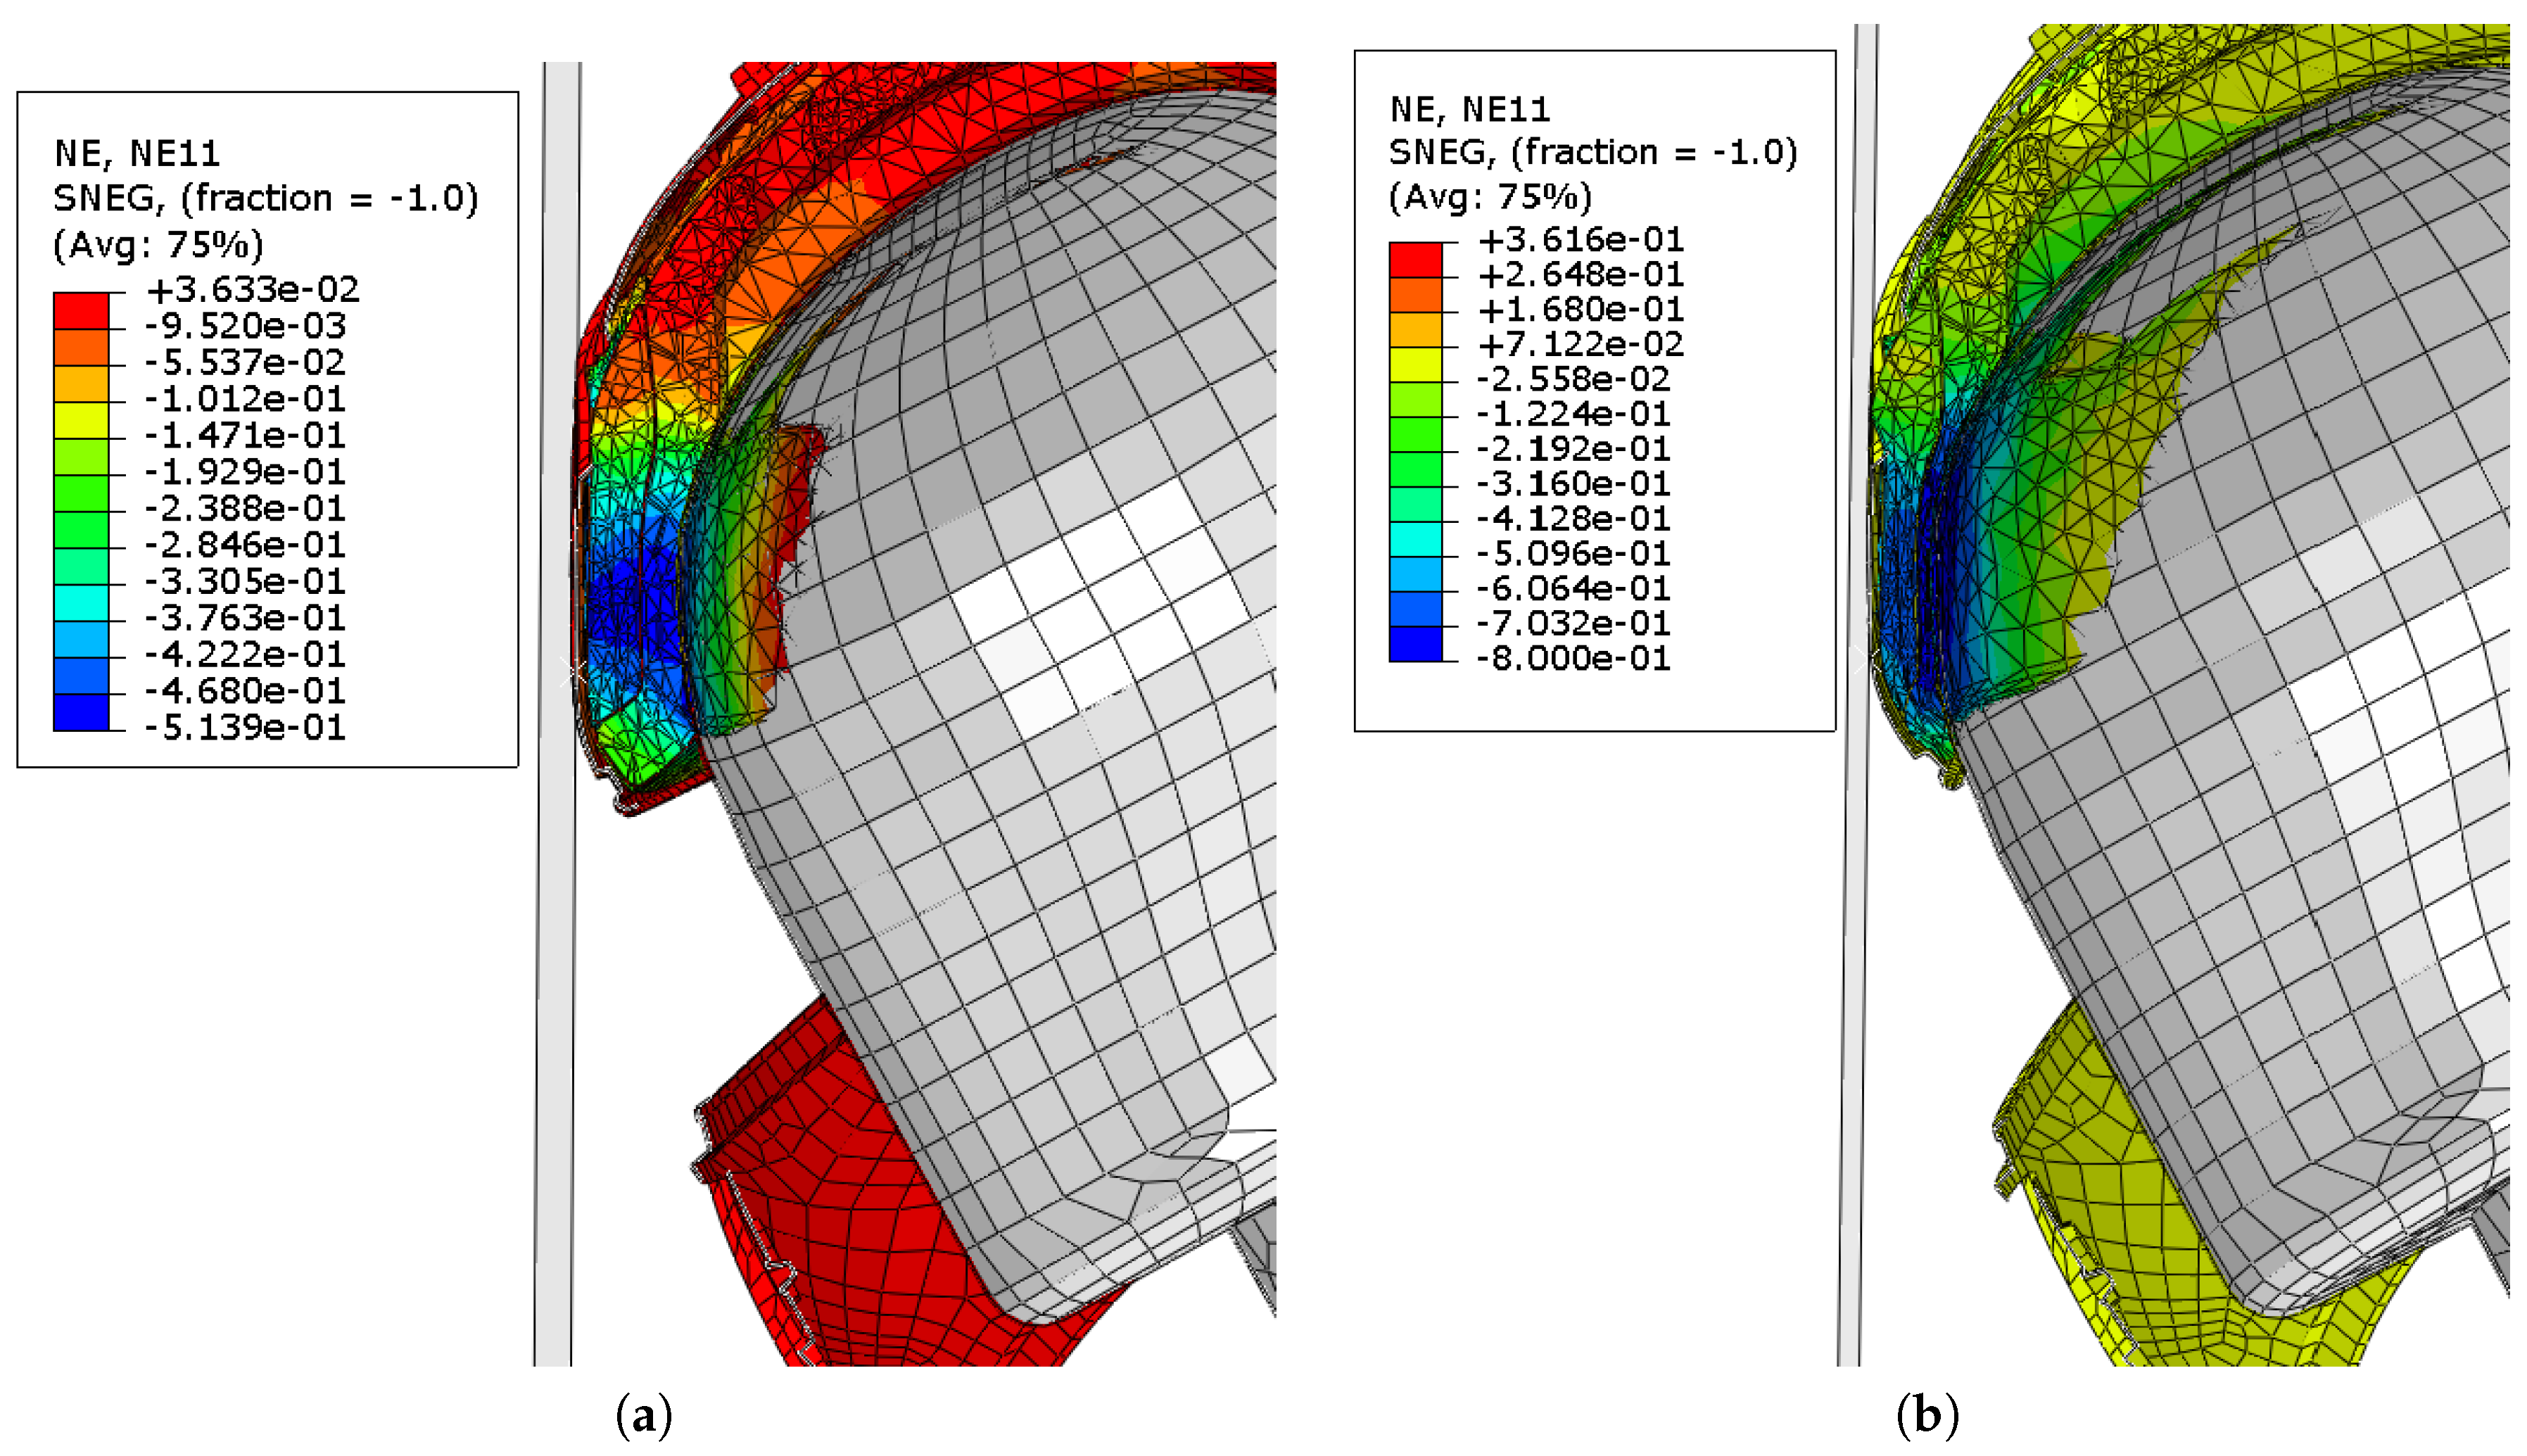
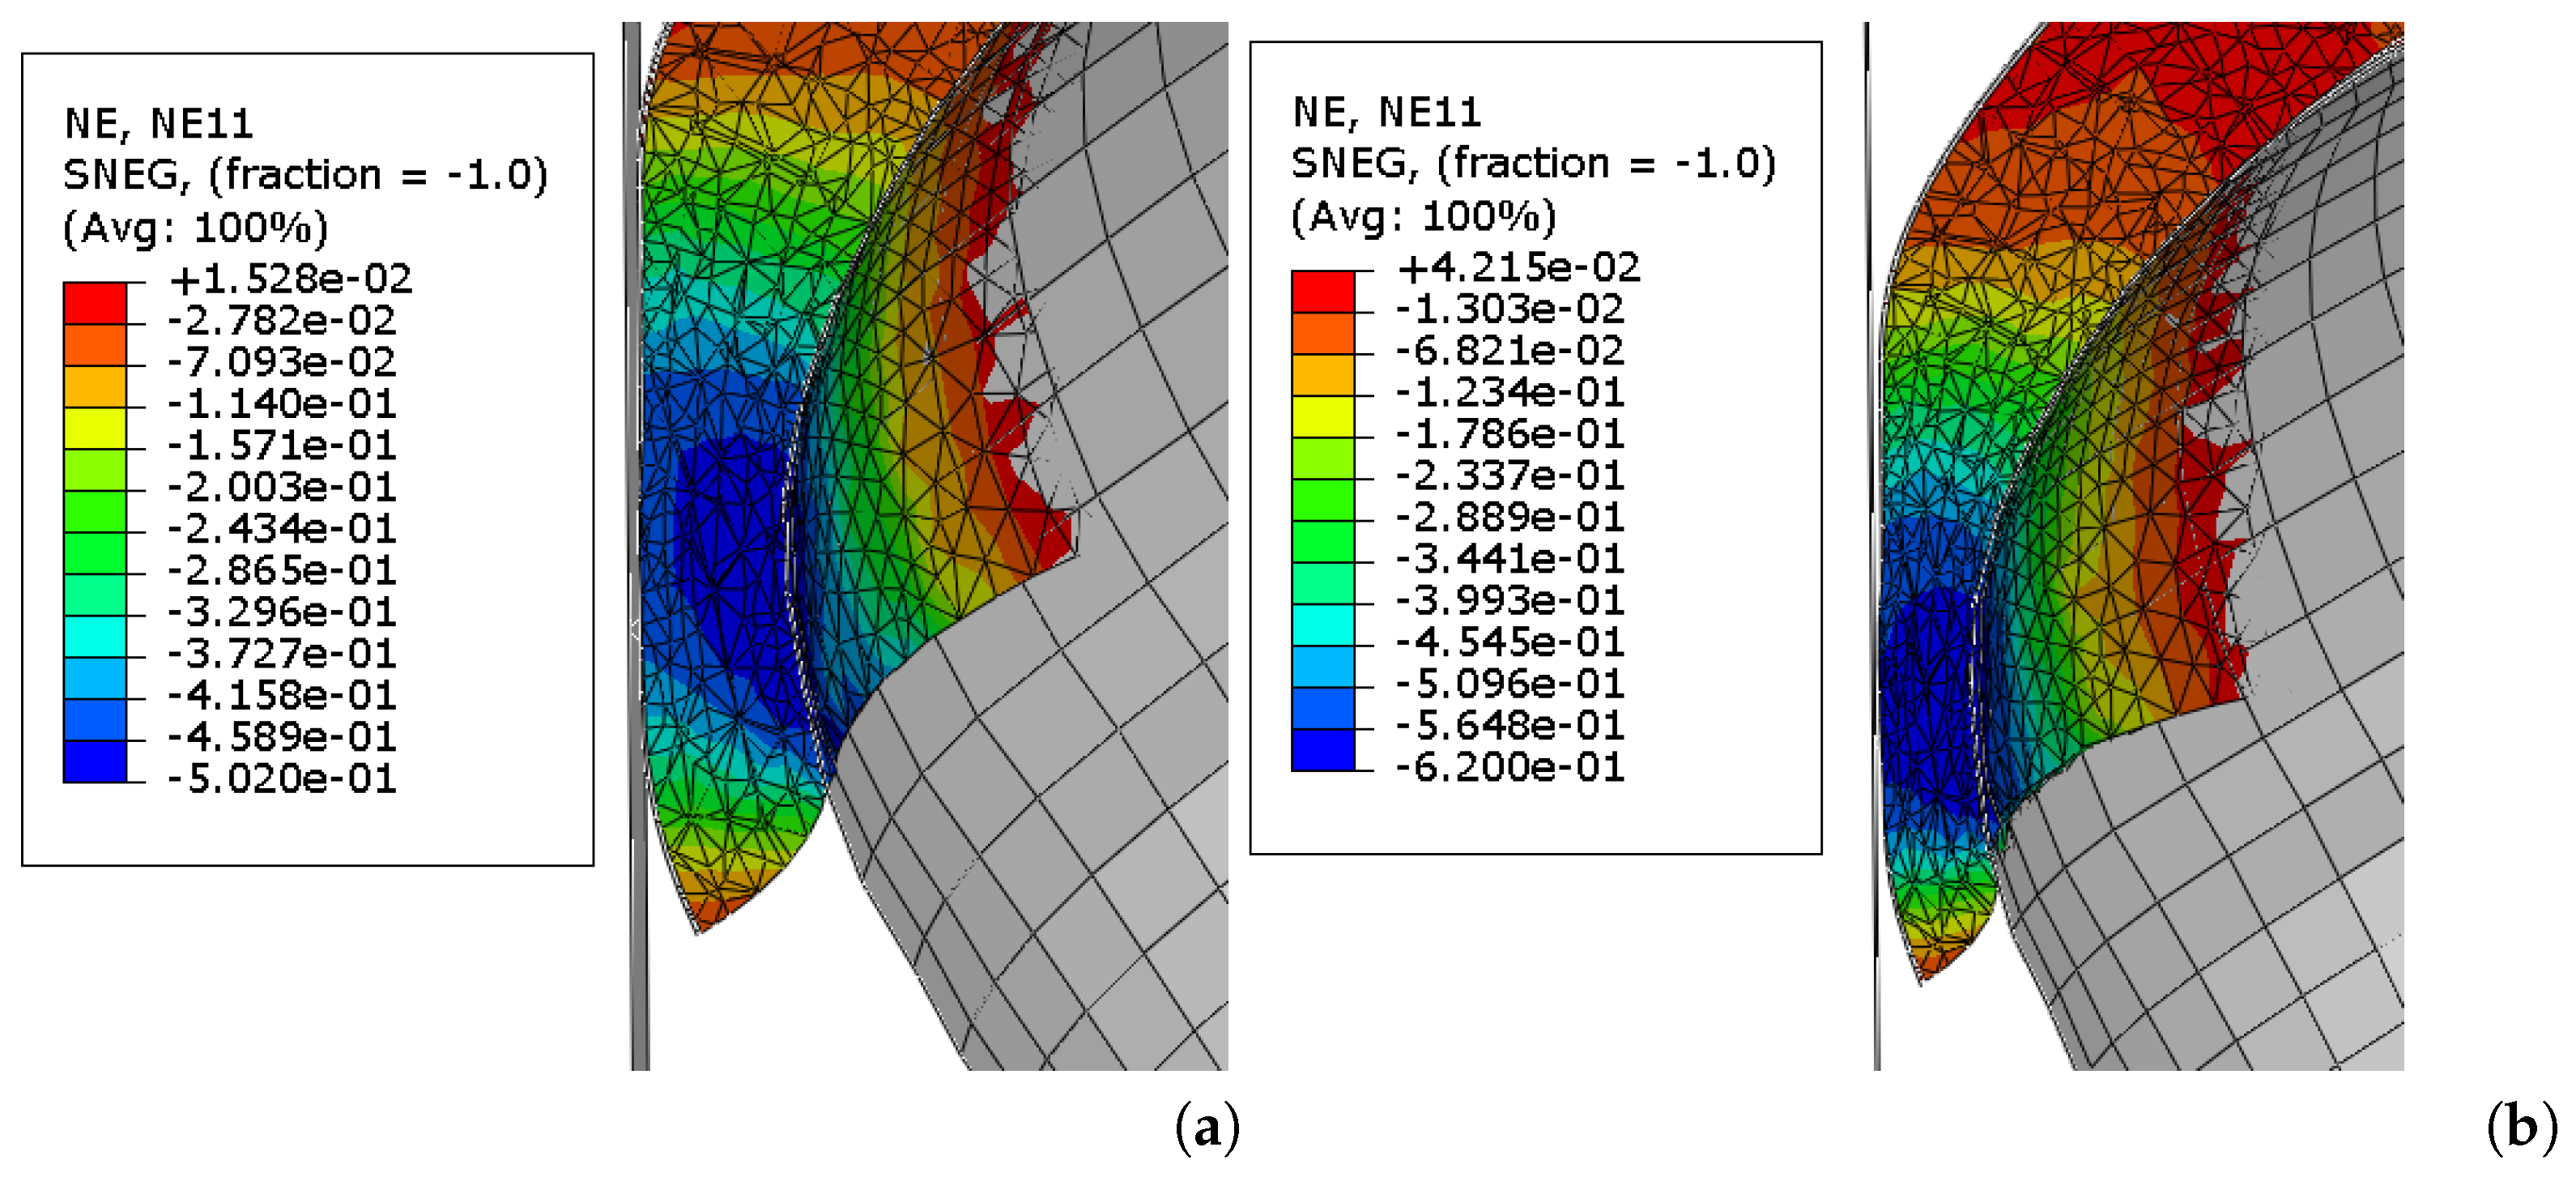
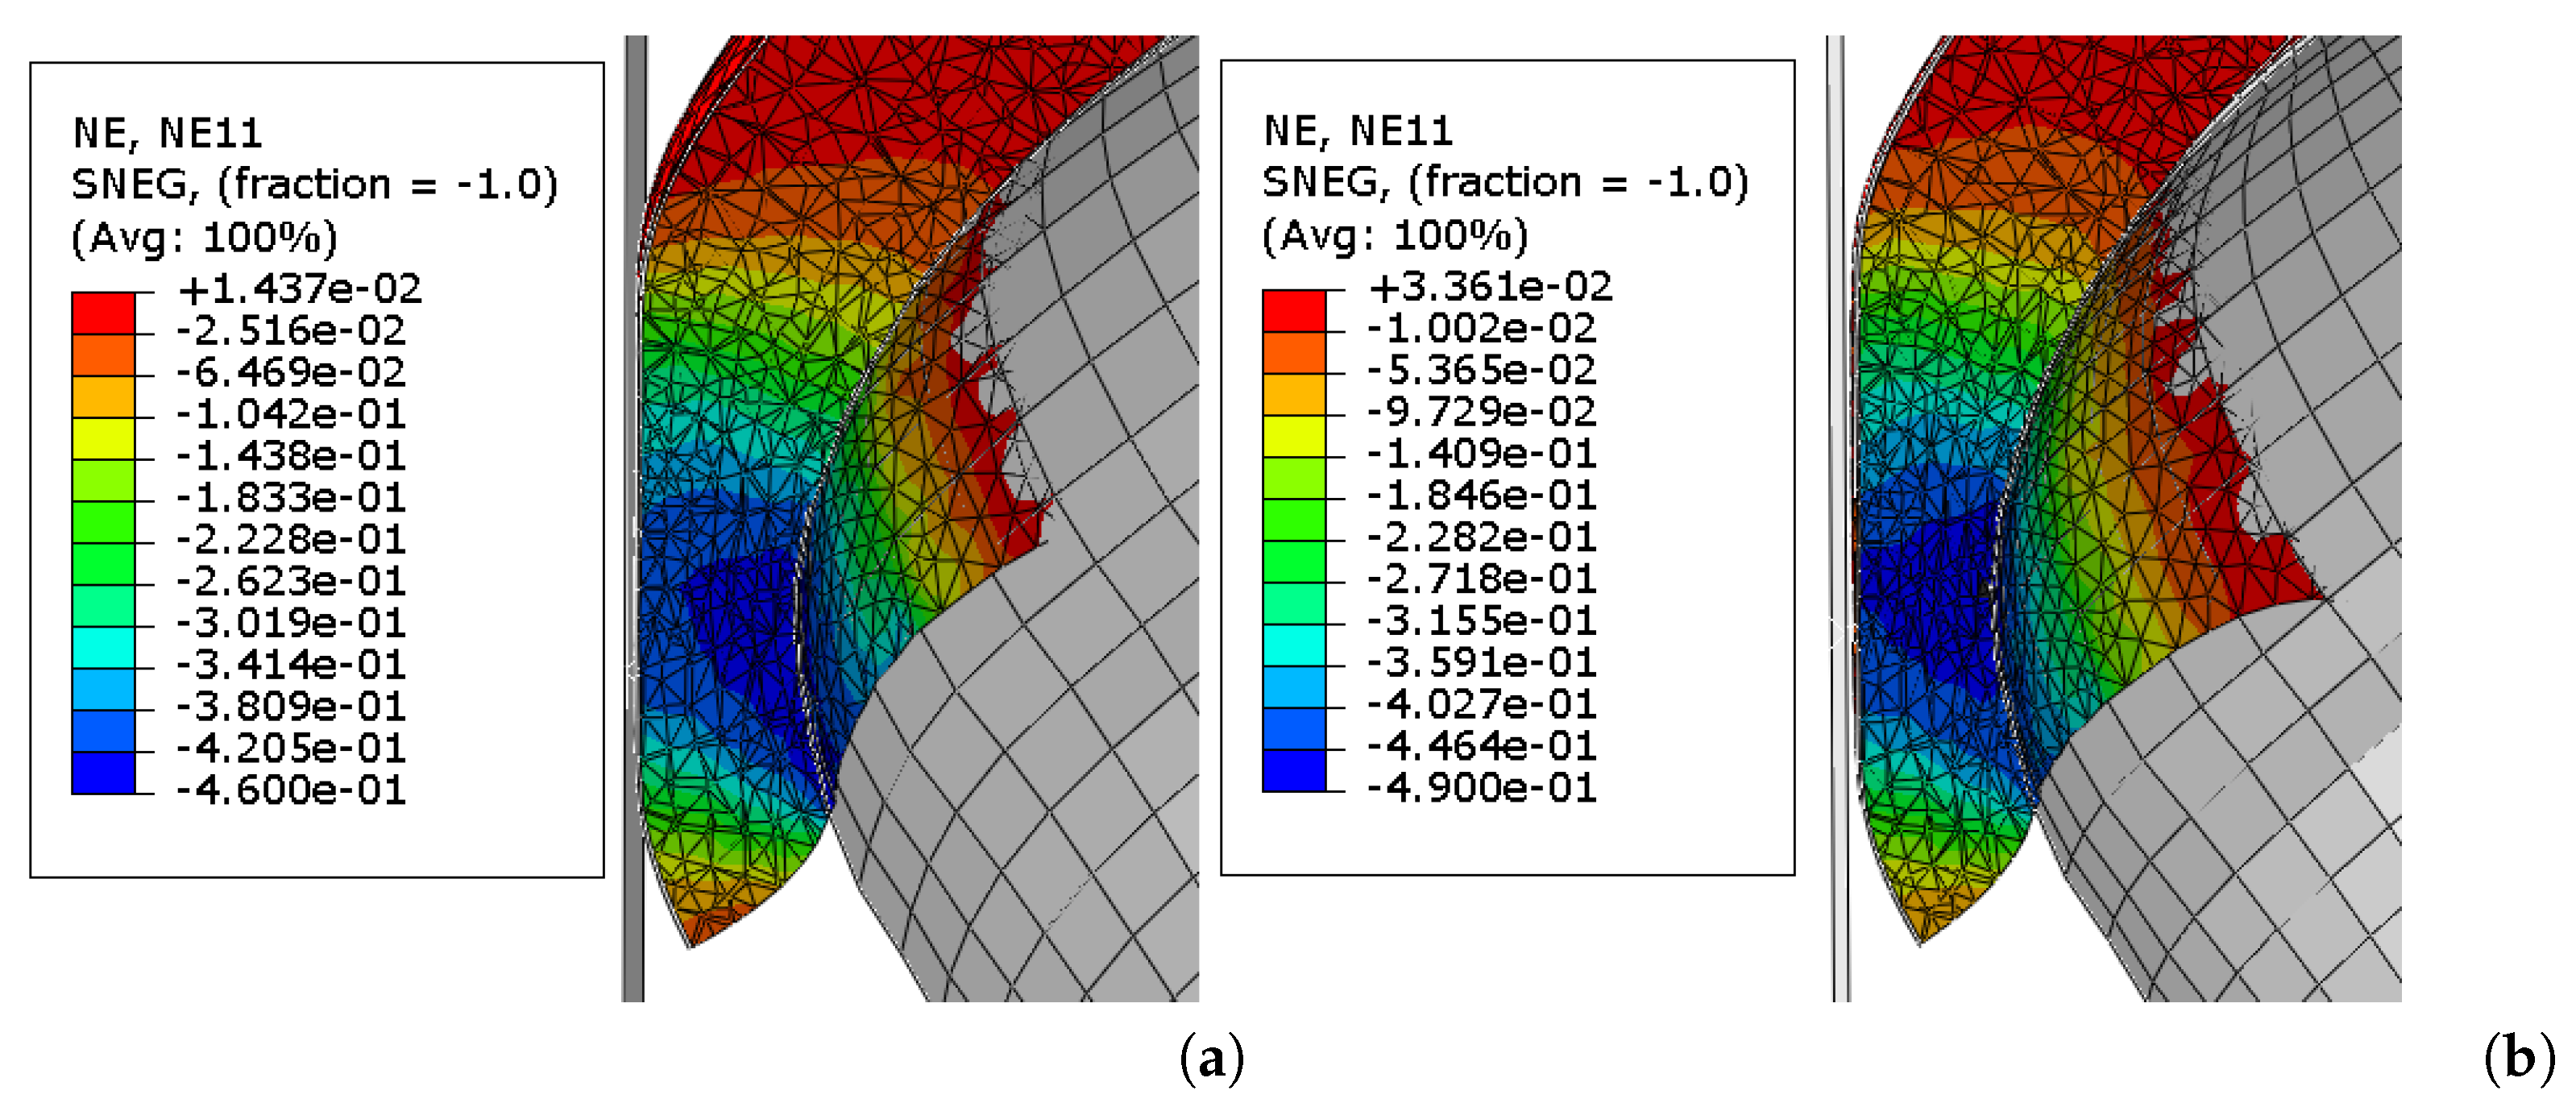
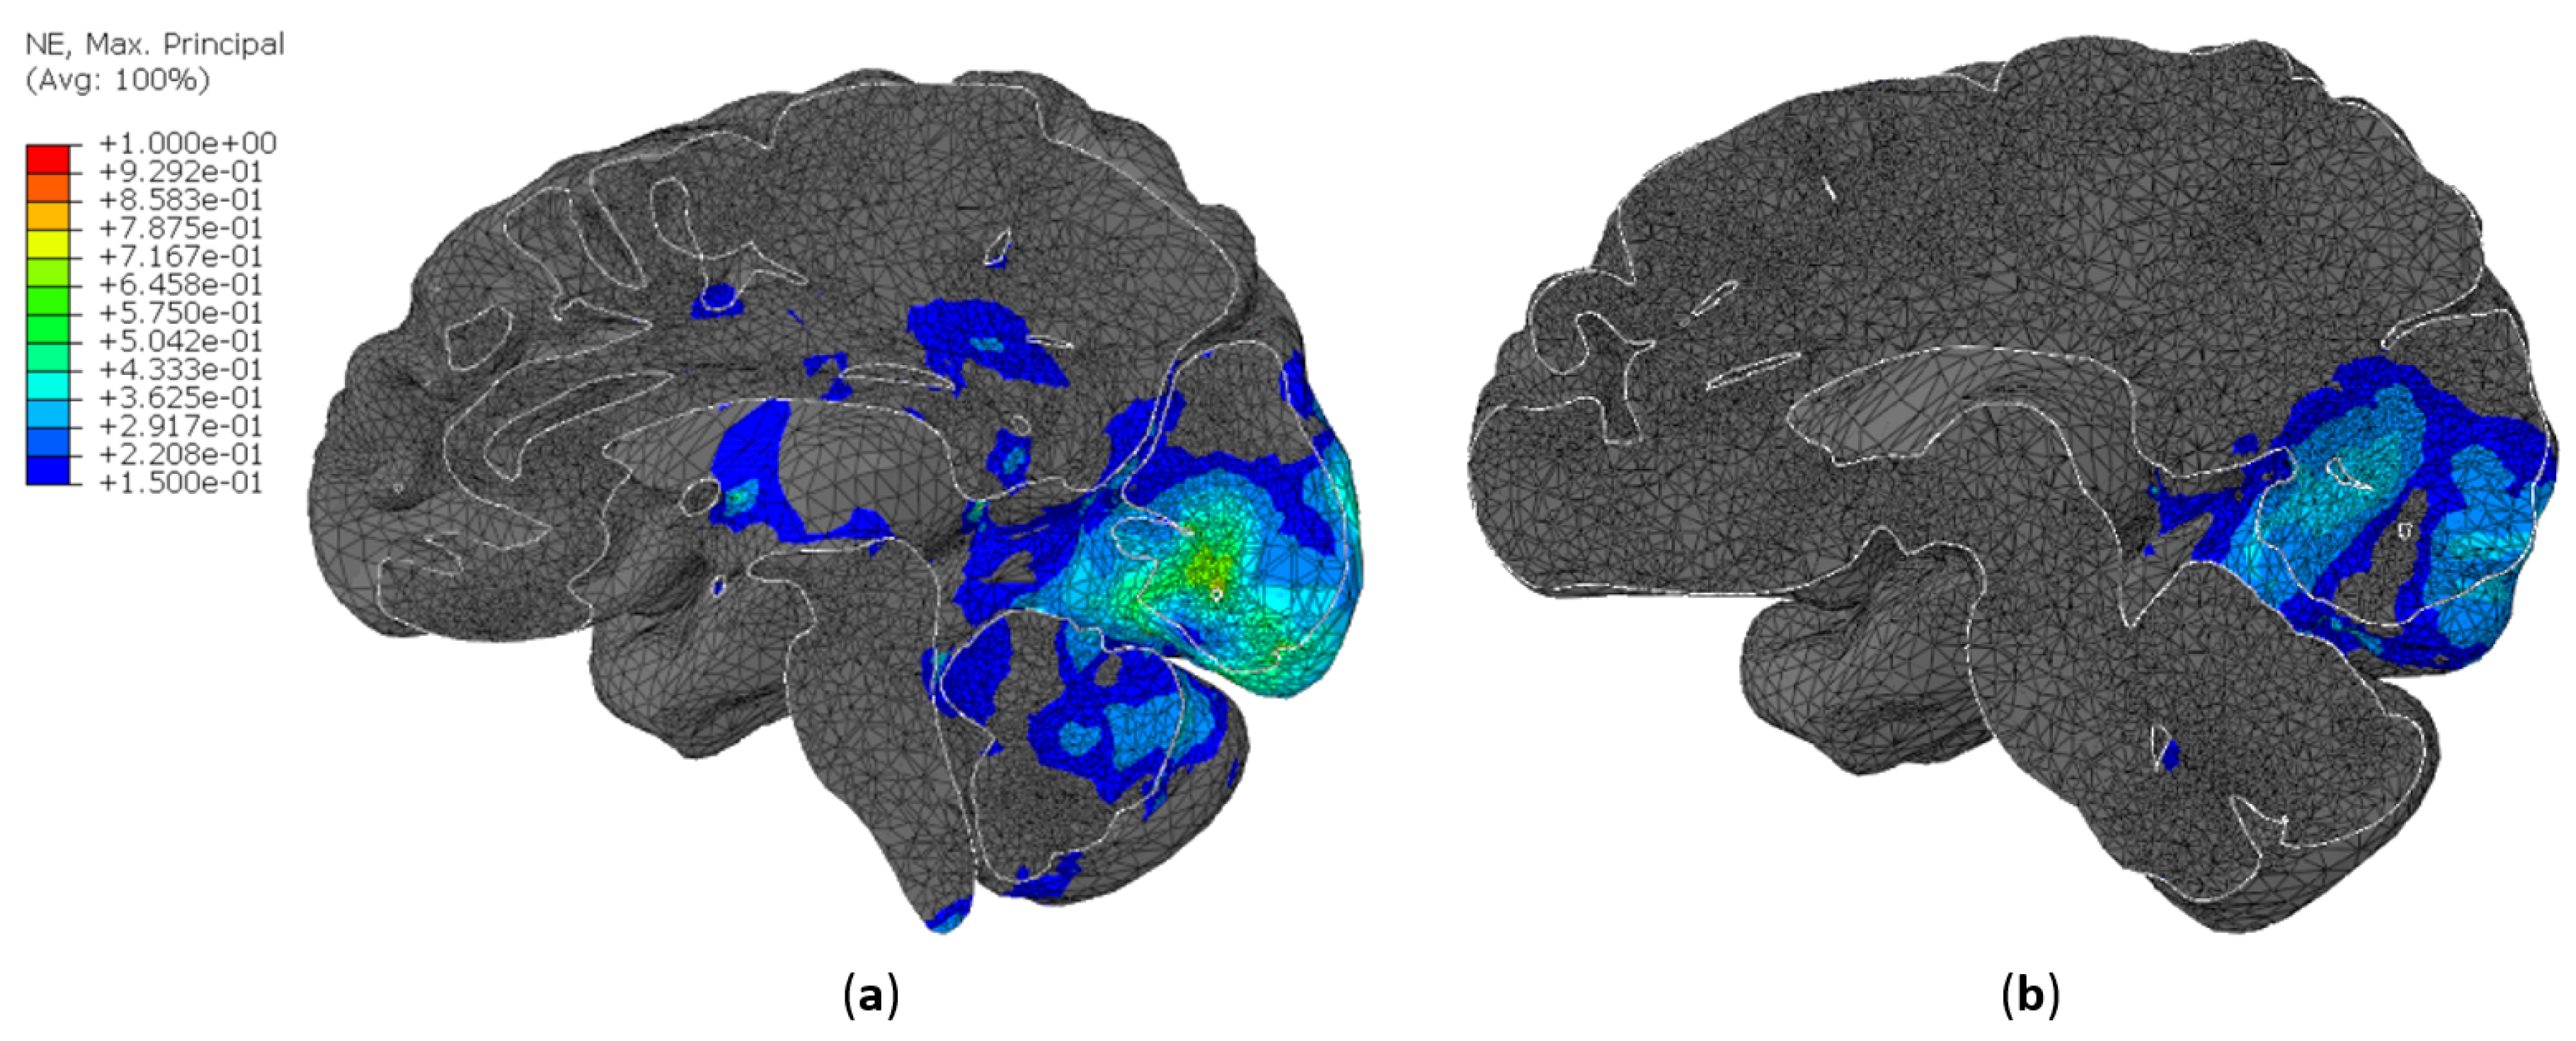
Figure 5 shows the nominal strain at the moment of maximum deformation in the frontal impact (B), for both AC216 and EPS90. At the center of the impacted region, the EPS liner, reached a maximum deformation of 76.9%, which is permanent. On the other hand, with the cork liner, a maximum deformation of 51.6% was found, which is recoverable. At the end of the unloading, this value dropped to 5.6%.
The results from the impact tests required by the ECE 22.05 standard and the ones from the impact tests performed in [
4] revealed AC216 as the best cork agglomerate for this application. Although this preliminary analysis of a helmet model with cork liners was performed only with the headform, without a FEHM, this was useful to select one agglomerate for further analyses.
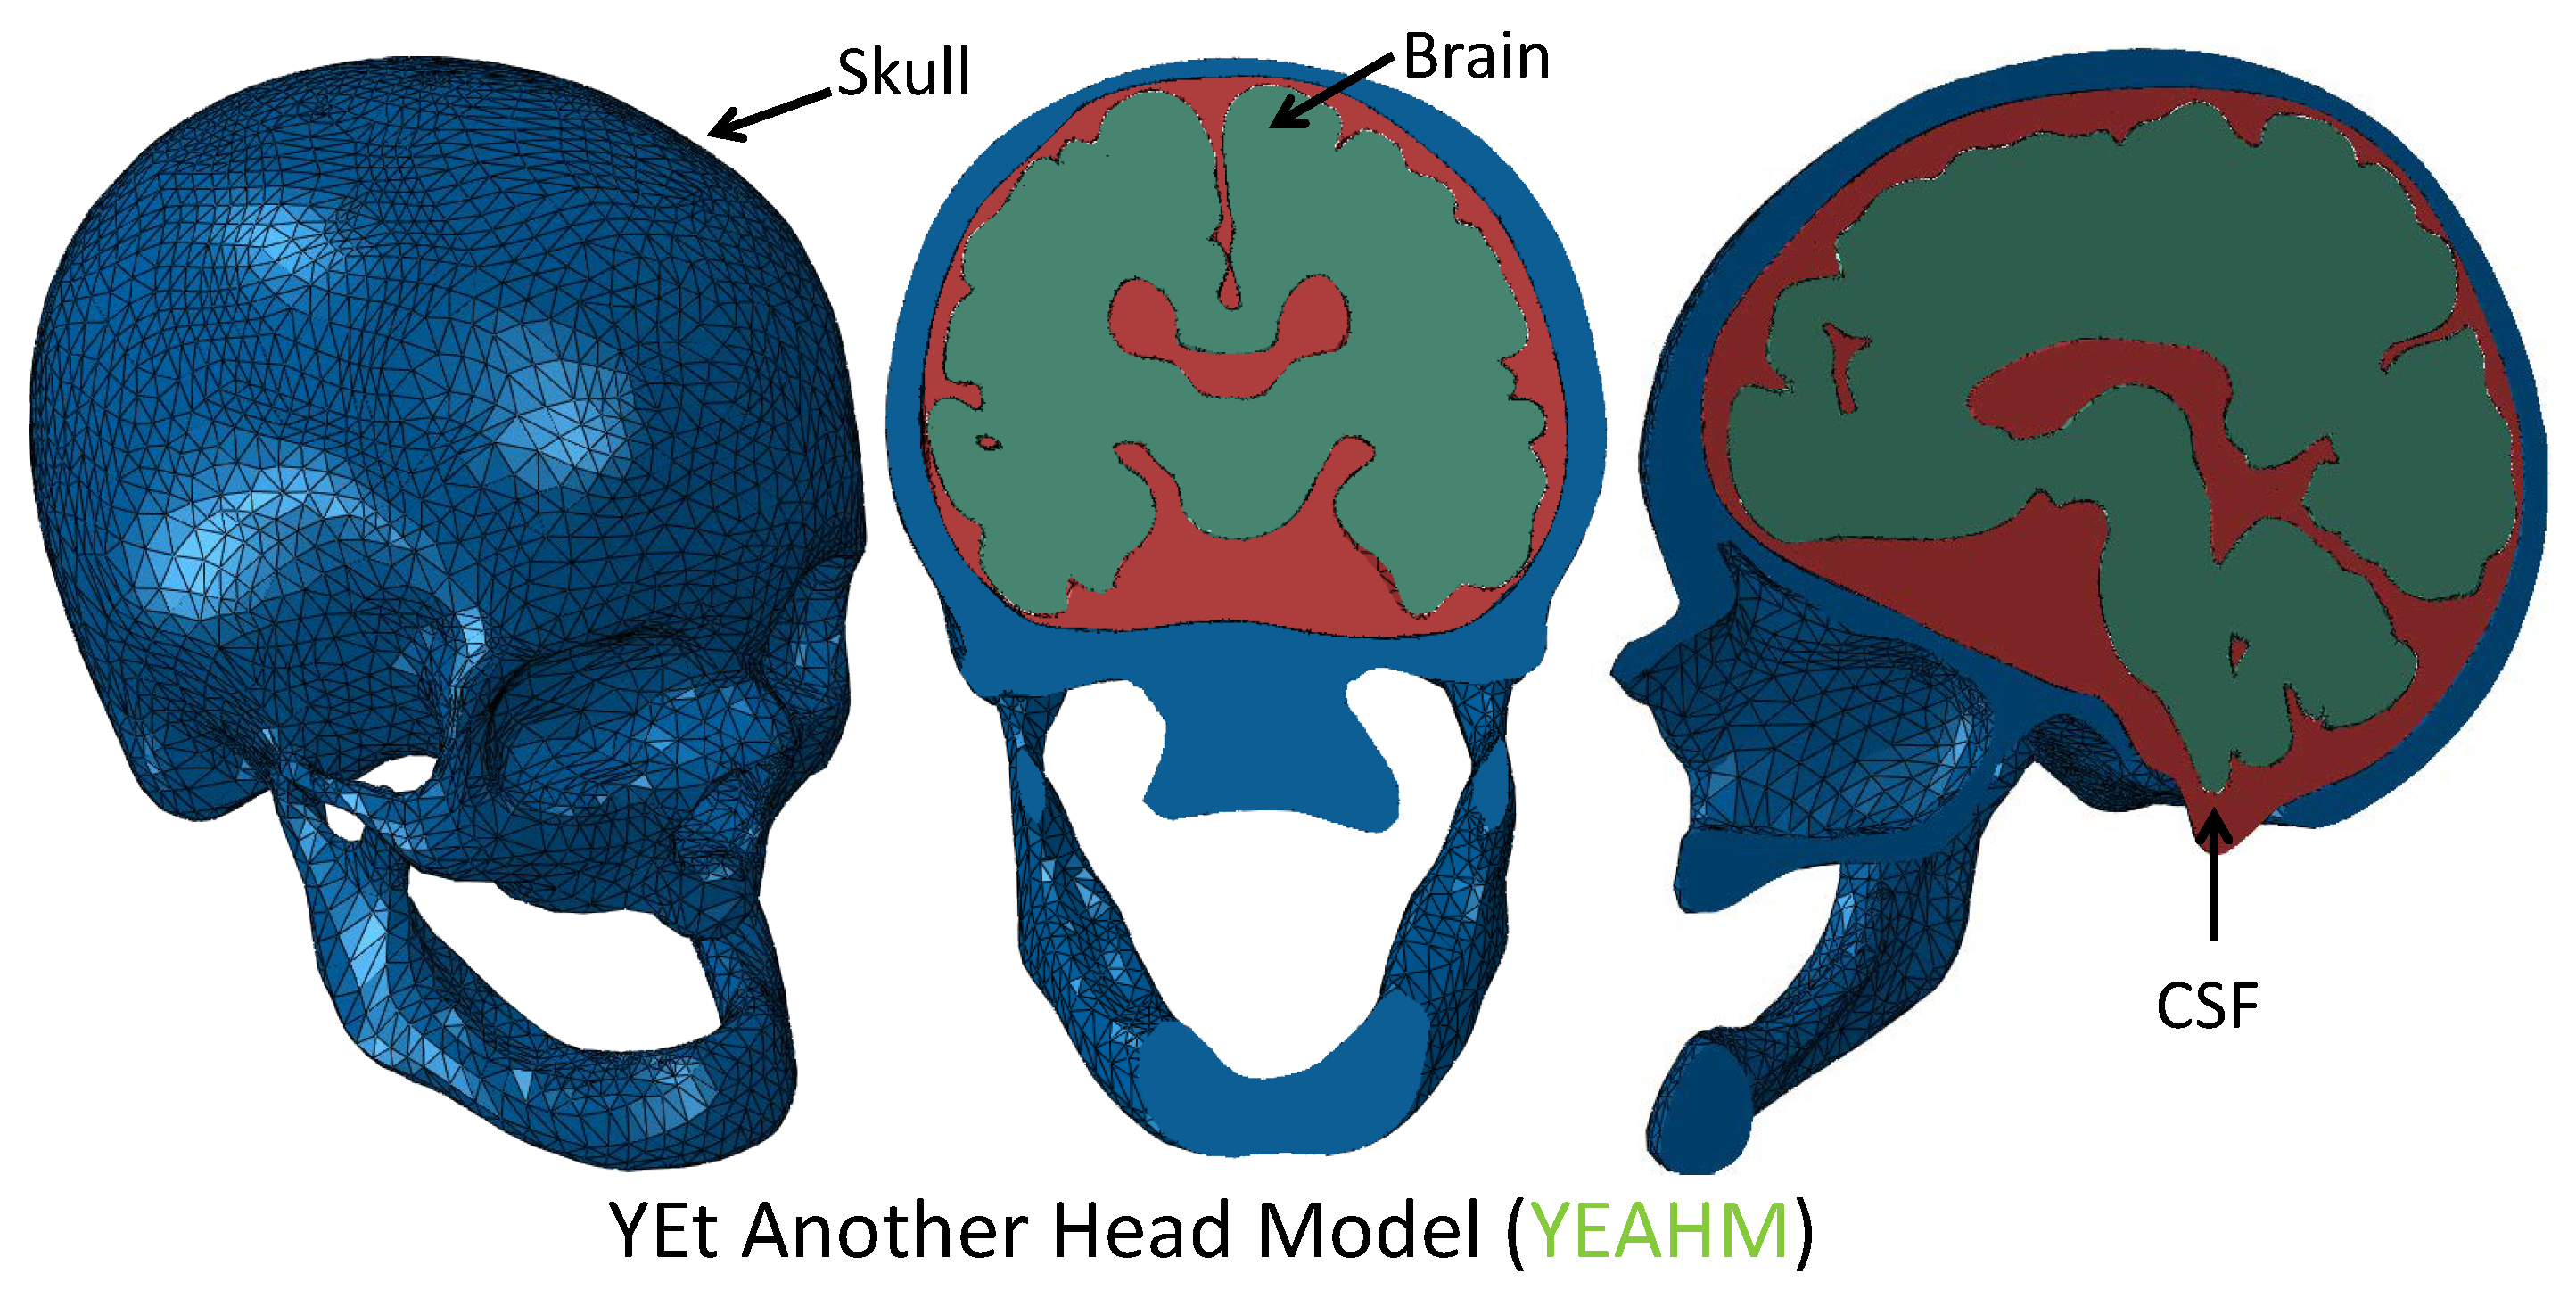
With this helmet, it was concluded that a thinner helmet made of AC216 might perform better. Therefore, a new helmet model composed of thinner liners is developed to further compare of AC216 and EPS90 liners. A simple geometry is adopted to make a generic model as possible, widening the helmet applications/types. This same model will be optimized according to its response under multi-impact loading and further analysis with YEAHM.


