Design and Optimization of Cooling Plate for Battery Module of an Electric Vehicle

Abstract
:1. Introduction
2. Thermal Analysis of a Single Battery
3. Design of Standard Battery Module
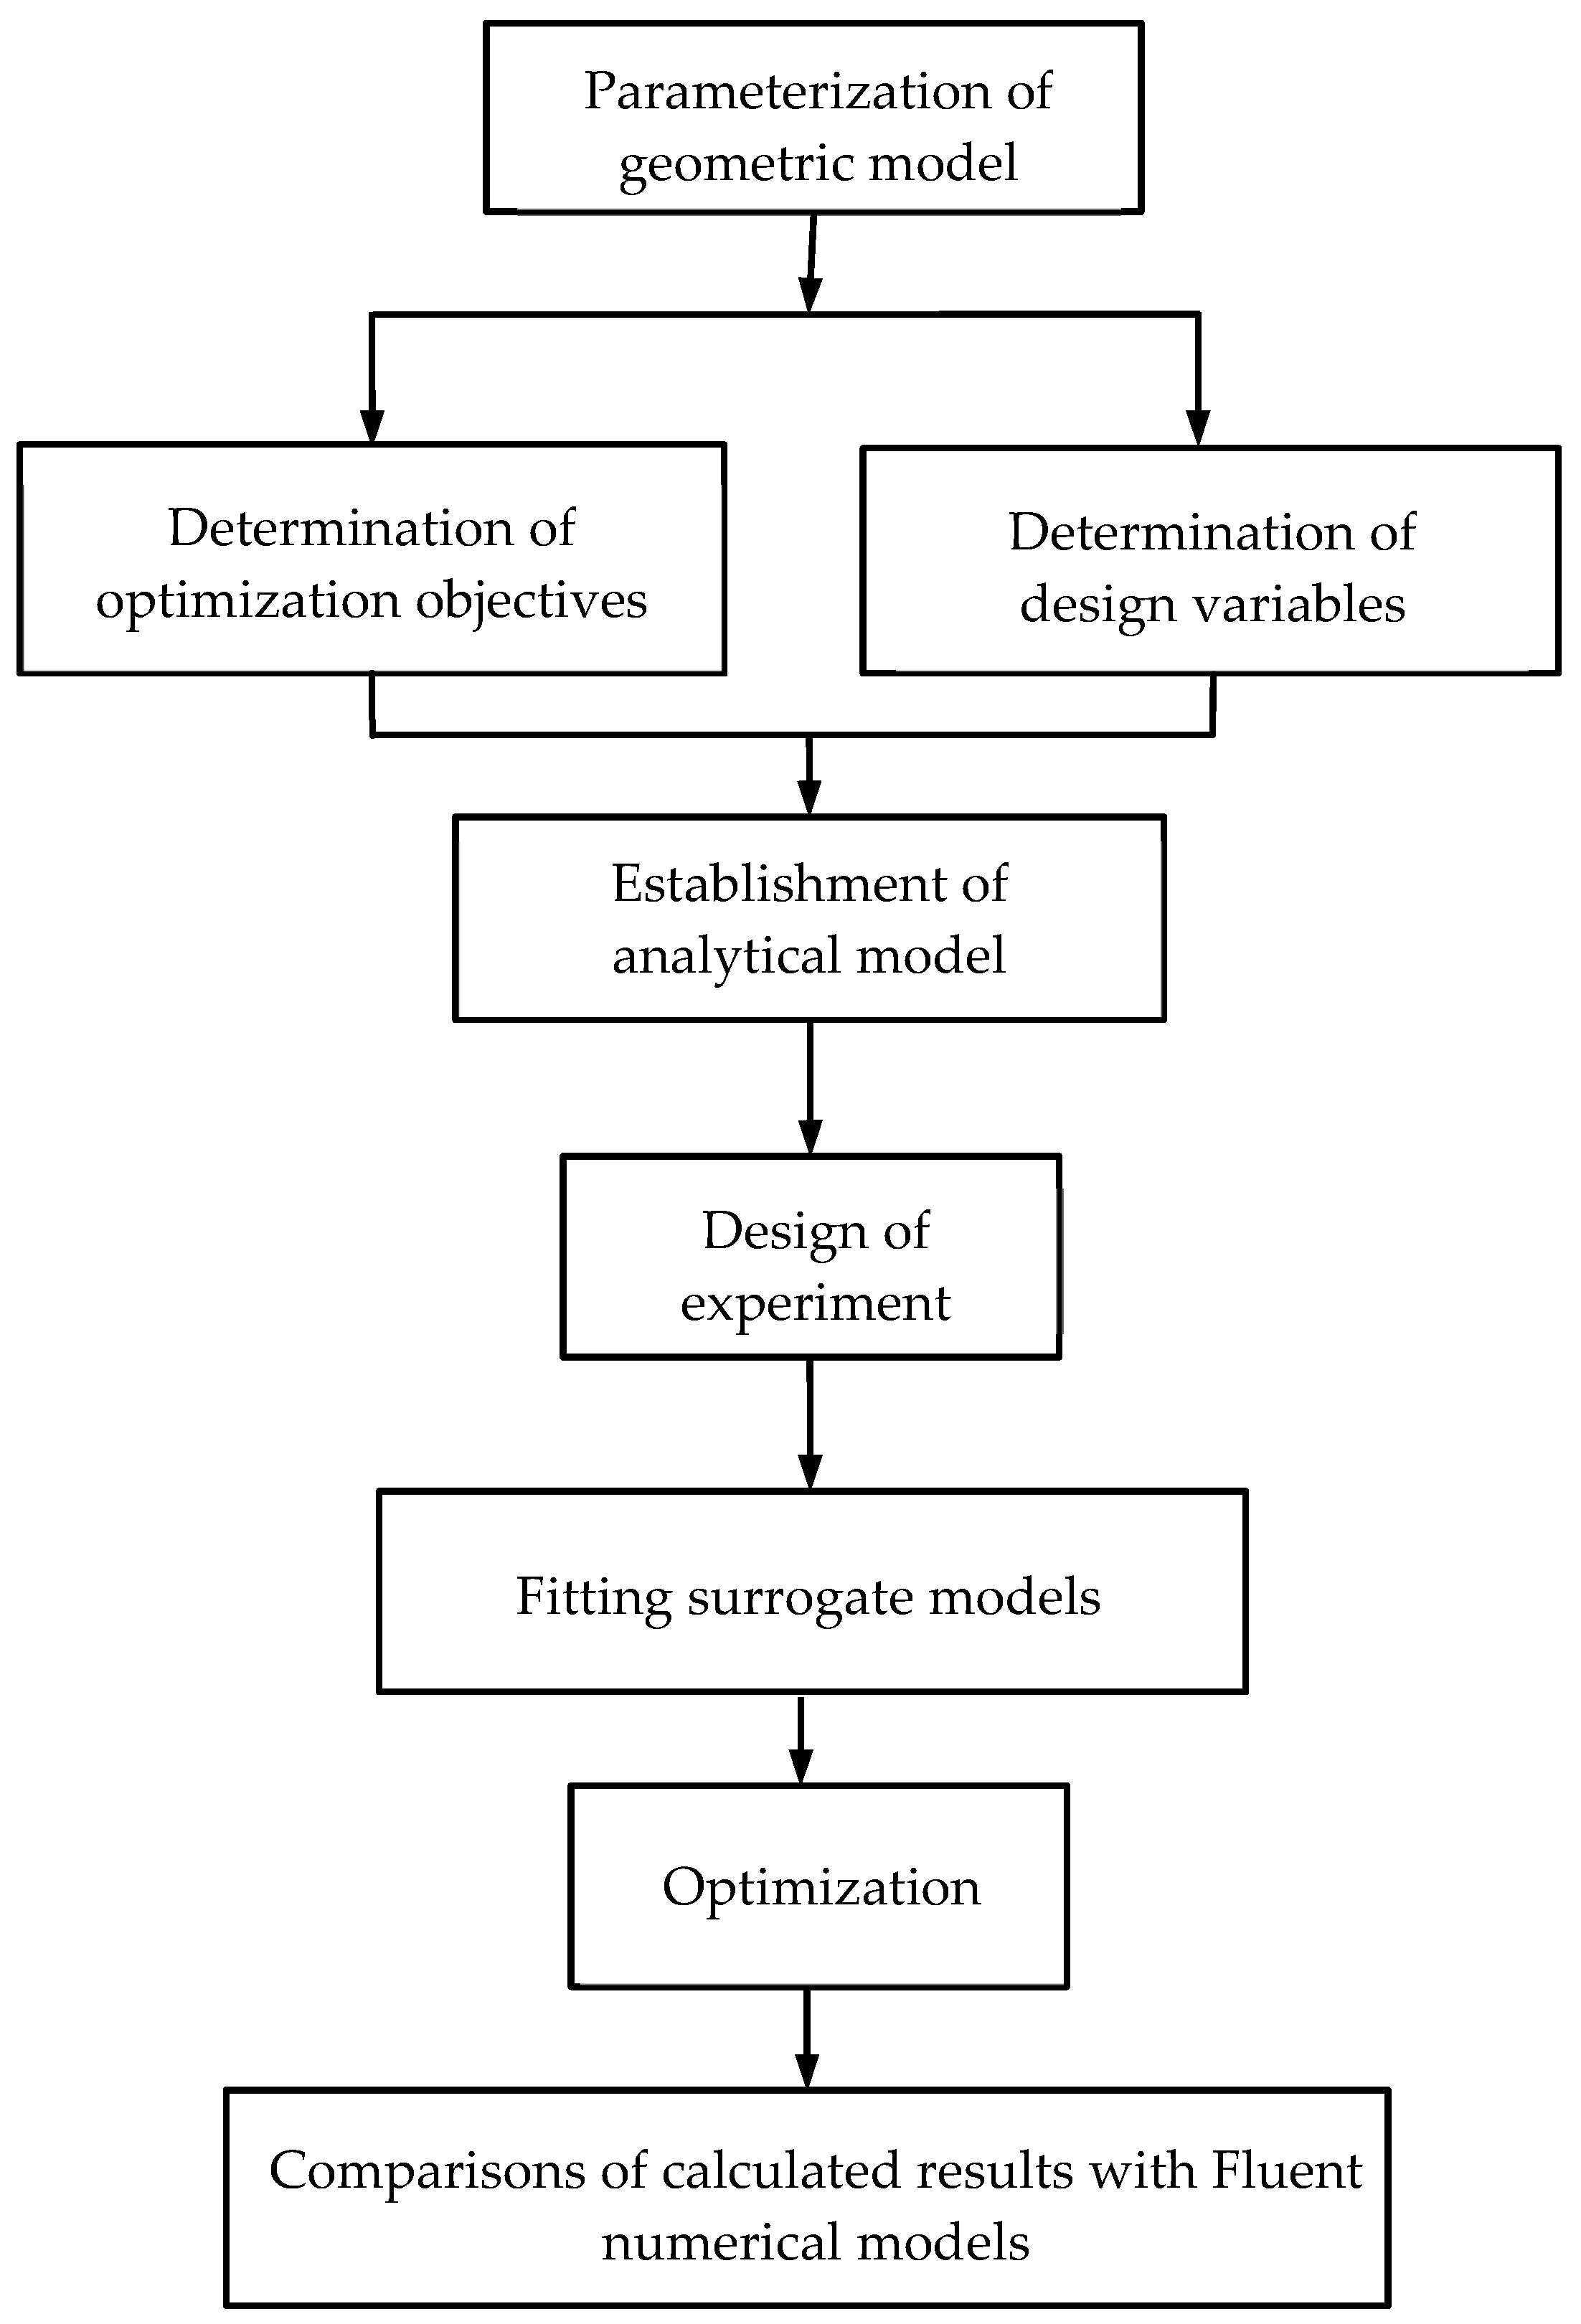
4. Surrogate Model-Based Optimization
5. Conclusions
Author Contributions
Funding
Conflicts of Interest
Nomenclature
| A | Factor in orthogonal experimental design, cross section |
| B | Factor in orthogonal experimental design, battery spacing |
| C | Factor in orthogonal experimental design, number of channels |
| Cp | Specific heat capacity, J kg−1 K−1 |
| Temperature difference for coolant, °C | |
| H | Geometric parameters at the inlet of the cooling plate |
| L | Channel distance in the cooling plate |
| m | Mass, kg |
| Flow rate of the coolant at the entrance, kg s−1 | |
| N | Number of batteries |
| P | Pressure, Pa |
| Qg | Generated heat |
| q | Heat generation rate of batteries, W m−3 |
| Heat flux on the cooling plate surface | |
| R | Total internal resistance, Ω |
| Internal resistance, Ω | |
| Polarization internal resistance, Ω | |
| SMx, SMy, SMz | Body forces |
| T | Temperature, °C |
| t | Time, s |
| U | Working voltage of the battery, V |
| U0 | Open circuit voltage of the battery, V |
| U298.15 | Open circuit voltage of the battery in the temperature of 298.15 K, V |
| u | Flow velocity vector |
| u | Velocity in x direction, m s−1 |
| V | Volume of the battery, m3 |
| v | Velocity in y direction, m s−1 |
| w | Velocity in z direction, m s−1 |
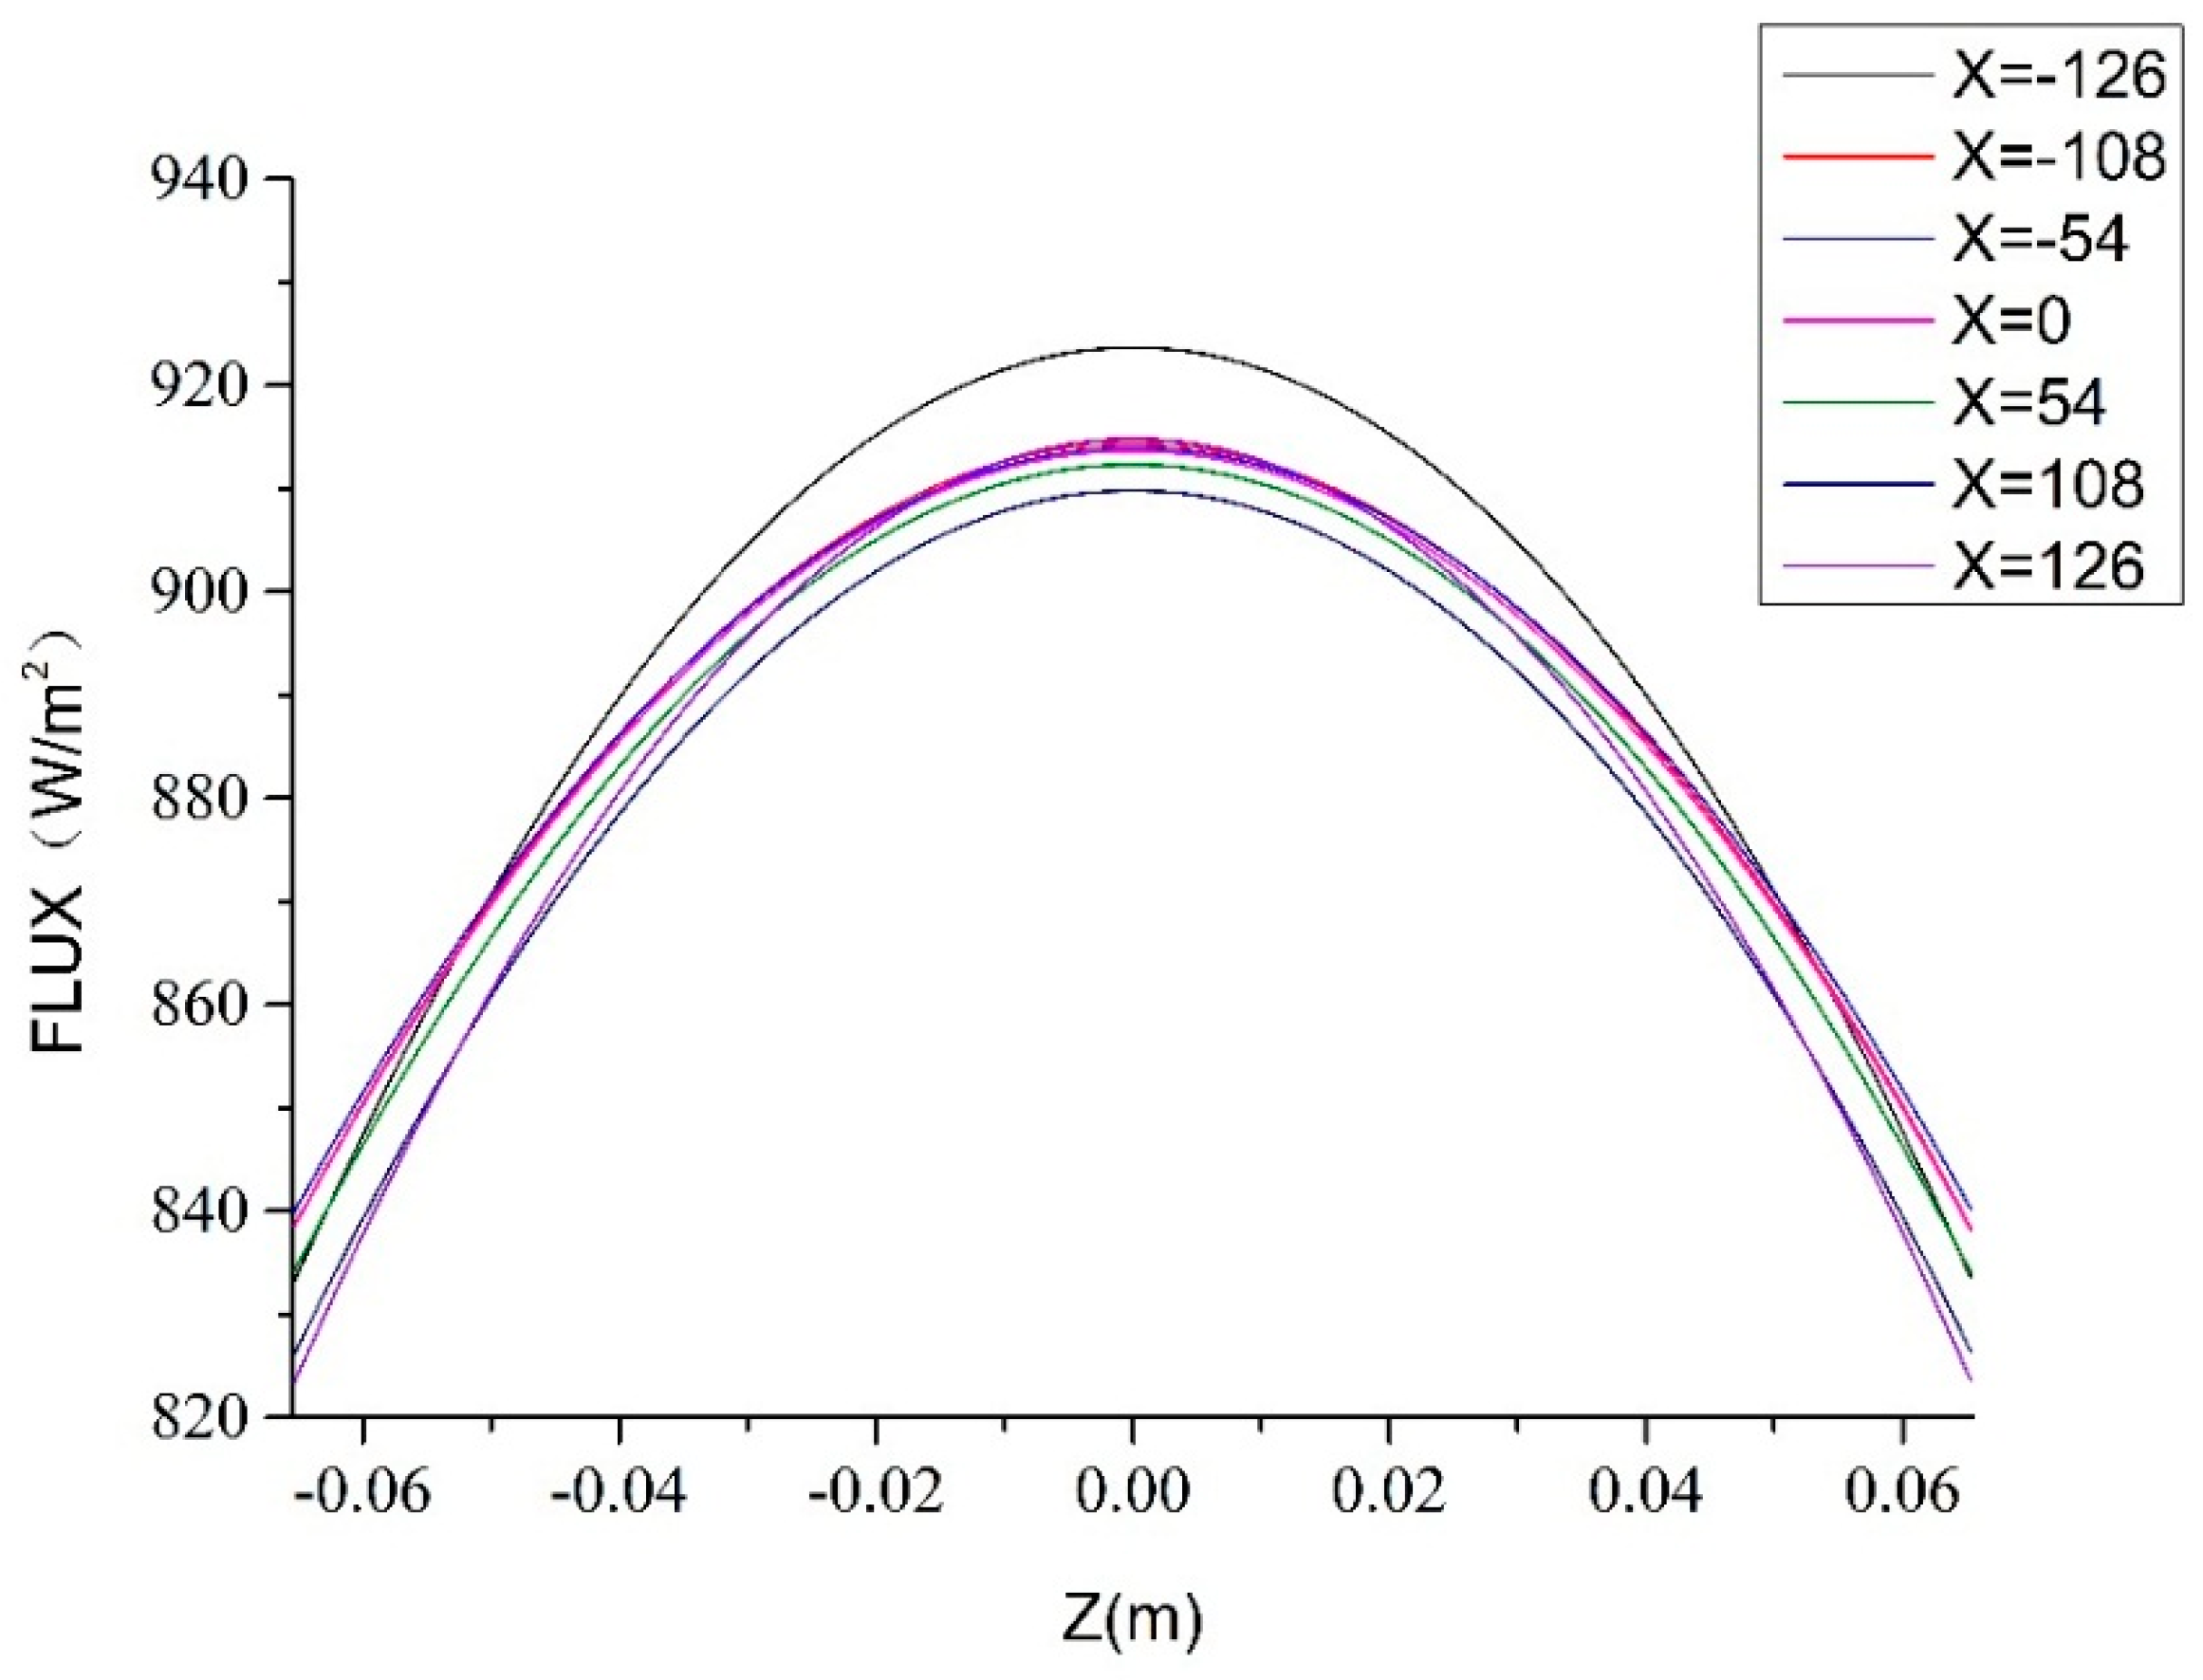
| Z | Coordinate Z direction, mm |
Greek symbols
| Heat generated per unit time of the cell, Ws−1 | |
| ρ | Fluid density, kg m−3 |
| Fluid viscosity, Pa s |
Subscripts
| c | Cell |
| x | x direction |
| y | y direction |
| z | z direction |
Abbreviations
| EV | Electric vehicles |
| PCM | Phase change material |
| UDF | User defined functions |
References
- Tarascon, J.M.; Armand, M.B. Issues and Challenges Facing Rechargeable Lithium Batteries. Nature 2001, 414, 359–367. [Google Scholar] [CrossRef] [PubMed]
- Kennedy, B.; Patterson, D.; Camilleri, S. Use of lithium-ion batteries in electric vehicles. J. Power Sources 2000, 90, 156–162. [Google Scholar] [CrossRef]
- Wakihara, M. Recent developments in lithium ion batteries. Mater. Sci. Eng. R Rep. 2001, 33, 109–134. [Google Scholar] [CrossRef]
- Tamura, K.; Horiba, T. Large-scale development of lithium batteries for electric vehicles and electric power storage applications. J. Power Sources 1999, 81–82, 156–161. [Google Scholar] [CrossRef]
- Panchal, S.; Dincer, I.; Agelin-Chaab, M.; Fraser, R.; Fowler, M. Transient electrochemical heat transfer modeling and experimental validation of a large sized LiFePO4/graphite battery. Int. J. Heat Mass Transf. 2017, 109, 1239–1251. [Google Scholar] [CrossRef]
- Zolot, M.D.; Kelly, K.; Keyser, M.; Mihalic, M.; Pesaran, A. Thermal Evaluation of the Honda Insight Battery Pack: Preprint. In Proceedings of the 36th Intersociety Energy Conversion Engineering Conference (IECECí01), Savannah, GA, USA, 29 July–2 August 2001. [Google Scholar]
- Kelly, K.J.; Mihalic, M.; Zolot, M. Battery usage and thermal performance of the Toyota Prius and Honda Insight during chassis dynamometer testing. In Proceedings of the Seventeenth Annual Battery Conference on Applications and Advances, Long Beach, CA, USA, 18 January 2002; pp. 247–252. [Google Scholar]
- Pesaran, A.A.; Burch, S.D.; Keyser, M. An Approach for Designing Thermal Management Systems for Electric and Hybrid Vehicle Battery Packs. In Proceedings of the Fourth Vehicle Thermal Management Systems Conference and Exhibition, London, UK, 24–27 May 1999. [Google Scholar]
- Park, H. A design of air flow configuration for cooling lithium ion battery in hybrid electric vehicles. J. Power Sources 2013, 239, 30–36. [Google Scholar] [CrossRef]
- Park, S.; Jung, D. Battery cell arrangement and heat transfer fluid effects on the parasitic power consumption and the cell temperature distribution in a hybrid electric vehicle. J. Power Sources 2013, 227, 191–198. [Google Scholar] [CrossRef]
- Kizilel, R.; Lateef, A.; Sabbah, R.; Farid, M.M.; Selman, J.R.; Alhallaj, S. Passive control of temperature excursion and uniformity in high-energy Li-ion battery packs at high current and ambient temperature. J. Power Sources 2015, 183, 370–375. [Google Scholar] [CrossRef]
- Javani, N.; Dincer, I.; Naterer, G.F.; Rohrauer, G.L. Modeling of passive thermal management for electric vehicle battery packs with PCM between cells. Appl. Therm. Eng. 2014, 73, 307–316. [Google Scholar] [CrossRef]
- Sabbah, R.; Kizilel, R.; Selman, J.R.; Al-Hallaj, S. Active (air-cooled) vs. passive (phase change material) thermal management of high power lithium-ion packs: Limitation of temperature rise and uniformity of temperature distribution. J. Power Sources 2008, 182, 630–638. [Google Scholar] [CrossRef]
- Jin, L.W.; Lee, P.S.; Kong, X.X.; Fan, Y.; Chou, S.K. Ultra-thin minichannel LCP for EV battery thermal management. Appl. Energy 2014, 113, 1786–1794. [Google Scholar] [CrossRef]
- Zhao, J.; Rao, Z.; Li, Y. Thermal performance of mini-channel liquid cooled cylinder based battery thermal management for cylindrical lithium-ion power battery. Energy Convers. Manag. 2015, 103, 157–165. [Google Scholar] [CrossRef]
- Basu, S.; Hariharan, K.S.; Kolake, S.M.; Song, T.; Sohn, D.K.; Yeo, T. Coupled electrochemical thermal modeling of a novel Li-ion battery pack thermal management system. Appl. Energy 2016, 181, 1–13. [Google Scholar] [CrossRef]
- Patil, M.; Panchal, S.; Kim, N.; Lee, M.Y. Cooling Performance Characteristics of 20 Ah Lithium-Ion Pouch Cell with Cold Plates along Both Surfaces. Energies 2018, 11, 2550. [Google Scholar] [CrossRef]
- Panchal, S.; Khasow, R.; Dincer, I.; Agelin-Chaab, M.; Fowler, M. Thermal design and simulation of mini-channel cold plate for water cooled large sized prismatic lithium-ion battery. Appl. Therm. Eng. 2017, 122, 80–90. [Google Scholar] [CrossRef]
- Wang, C.; Zhang, G.; Meng, L.; Li, X.; Situ, W.; Lv, Y.; Rao, M. Liquid cooling based on thermal silica plate for battery thermal management system. Int. J. Energy Res. 2017, 41, 2468–2479. [Google Scholar] [CrossRef]
- Wang, C.; Zhang, G.; Li, X.; Huang, J.; Wang, Z.; Lv, Y.; Meng, L.; Situ, W.; Rao, M. Experimental examination of large capacity liFePO\r, 4\r, battery pack at high temperature and rapid discharge using novel liquid cooling strategy. Int. J. Energy Res. 2018, 42, 1172–1182. [Google Scholar] [CrossRef]
- Saw, L.H.; Ye, Y.; Tay, A.A.O.; Chong, W.T.; Kuan, S.H.; Yew, M.C. Computational fluid dynamic and thermal analysis of Lithium-ion battery pack with air cooling. Appl. Energy 2016, 177, 783–792. [Google Scholar] [CrossRef]
- Zhang, W.; Chen, X.; Yang, H.; Liang, H.; Wei, Y. Forced convection for flow across two tandem cylinders with rounded corners in a channel. Int. J. Heat Mass Transf. 2019, 130, 1053–1069. [Google Scholar] [CrossRef]
- Zhang, S.; Li, X.; Hu, B.; Liu, Y.; Zhu, Z. Numerical investigation of attached cavitating flow in thermo-sensitive fluid with special emphasis on thermal effect and shedding dynamics. Int. J. Hydrog. Energy 2019, 44, 3170–3184. [Google Scholar] [CrossRef]
- Wei, Y.; Yang, H.; Dou, H.S.; Lin, Z.; Wang, Z.; Qian, Y. A novel two-dimensional coupled lattice Boltzmann model for thermal incompressible flows. Appl. Math. Comput. 2018, 339, 556–567. [Google Scholar] [CrossRef]
- Ge, Z.J. Research on Air-cooled Heat Dissipation System for Lithium Iron Phosphate Battery Pack of Electric Vehicle. Master’s Thesis, South China University of Technology, Guangzhou, China, 2016. [Google Scholar]
- Bernardi, D.; Pawlikowski, E.; Newman, J. A General Energy Balance for Battery Systems. J. Electrochem. Soc. 1985, 132, 5–12. [Google Scholar] [CrossRef]
- ANSYS Fluent 18.0; ANSYS, Inc.: Canonsburg, PA, USA, 2017; Available online: https://www.ansys.com/products/fluids/ansys-fluent (accessed on 17 February 2019).
- Myers, R.H.; Montgomery, D.C.; Anderson-Cook, C.M. Response Surface Methodology: Process and Product Optimization Using Designed Experiments, 4th ed.; Wiley: Hoboken, NJ, USA, 2016. [Google Scholar]
- Li, W.; Xiao, M.; Peng, X.; Garg, A.; Gao, L. A Surrogate Thermal Modeling and Parametric Optimization of Battery pack with Air Cooling for EVs. Appl. Therm. Eng. 2019, 147, 90–100. [Google Scholar] [CrossRef]
- Montgomery, D.C. Introduction to Statistical Quality Control, 7th ed.; Wiley: Hoboken, NJ, USA, 2012. [Google Scholar]
- Rangappa, R.; Rajoo, S. Effect of thermo-physical properties of cooling mass on hybrid cooling for lithium-ion battery pack using design of experiments. Int. J. Energy Environ. Eng. 2018. [Google Scholar] [CrossRef]
- Fang, K.T.; Lin, D.K.J.; Winker, P.; Zhang, Y. Uniform Design: Theory and Application. Technometrics 2000, 42, 237–248. [Google Scholar] [CrossRef]
- Yang, D.C.; Jang, I.S.; Jang, M.H.; Park, C.N.; Park, C.J.; Choi, J. Optimization of additive compositions for anode in Ni-MH secondary battery using the response surface method. Met. Mater. Int. 2009, 15, 421–425. [Google Scholar] [CrossRef]
- Buhmann, M.D. Radial basis functions. Acta Numer. 2000, 9, 1–38. [Google Scholar] [CrossRef]
- Stein, M.L. Interpolation of Spatial Data: Some Theory for Kriging; Springer: New York, NY, USA, 1999. [Google Scholar]


| Parameters | Values | |
|---|---|---|
| Nominal voltage | (V) | 3.2 |
| Nominal capacity | (Ah) | 10 |
| Internal resistance | (mΩ) | ≈10 |
| Charging current | (A) | ≤ 10 |
| Continuous discharge current | (A) | ≤ 20 |
| Maximum discharge current | (A) | 50 |
| Upper cut-off voltage | (V) | 3.65 ± 0.05 |
| Lower cut-off voltage | (V) | 2.5 |
| Cycle life | (/) | ≥ 2000 |
| Weight | (g) | 275 ± 5 |
| Dimension | (mm) | 131 × 65 × 16 |
| Name | Density | Specific Heat Capacity | Thermal Conductivity | Viscosity |
|---|---|---|---|---|
| Cell | 1958.7 | 733 | 0.9/2.7/2.7 | - |
| Air | 1.185 | 1005 | 0.0263 | 0.0000184 |
| Properties | Density (kg/m3) | Specific Heat Capacity (J/kg·K) | Thermal Conductivity (W/m·K) | Dynamic Viscosity (kg/m·s) |
|---|---|---|---|---|
| Silica gel pad | 3050 | 0.832 | 3 | - |
| Mixed solution | 1071.11 | 3300 | 0.384 | 0.00339 |
| Factors | A (Cross Section, mm) | B (Battery Spacing, mm) | C (Number of Channels) | |
|---|---|---|---|---|
| Levels | ||||
| 1 | 1 × 3 | 2 | 5 | |
| 2 | 1 × 4 | 3 | 6 | |
| 3 | 1 × 5 | 4 | 7 | |
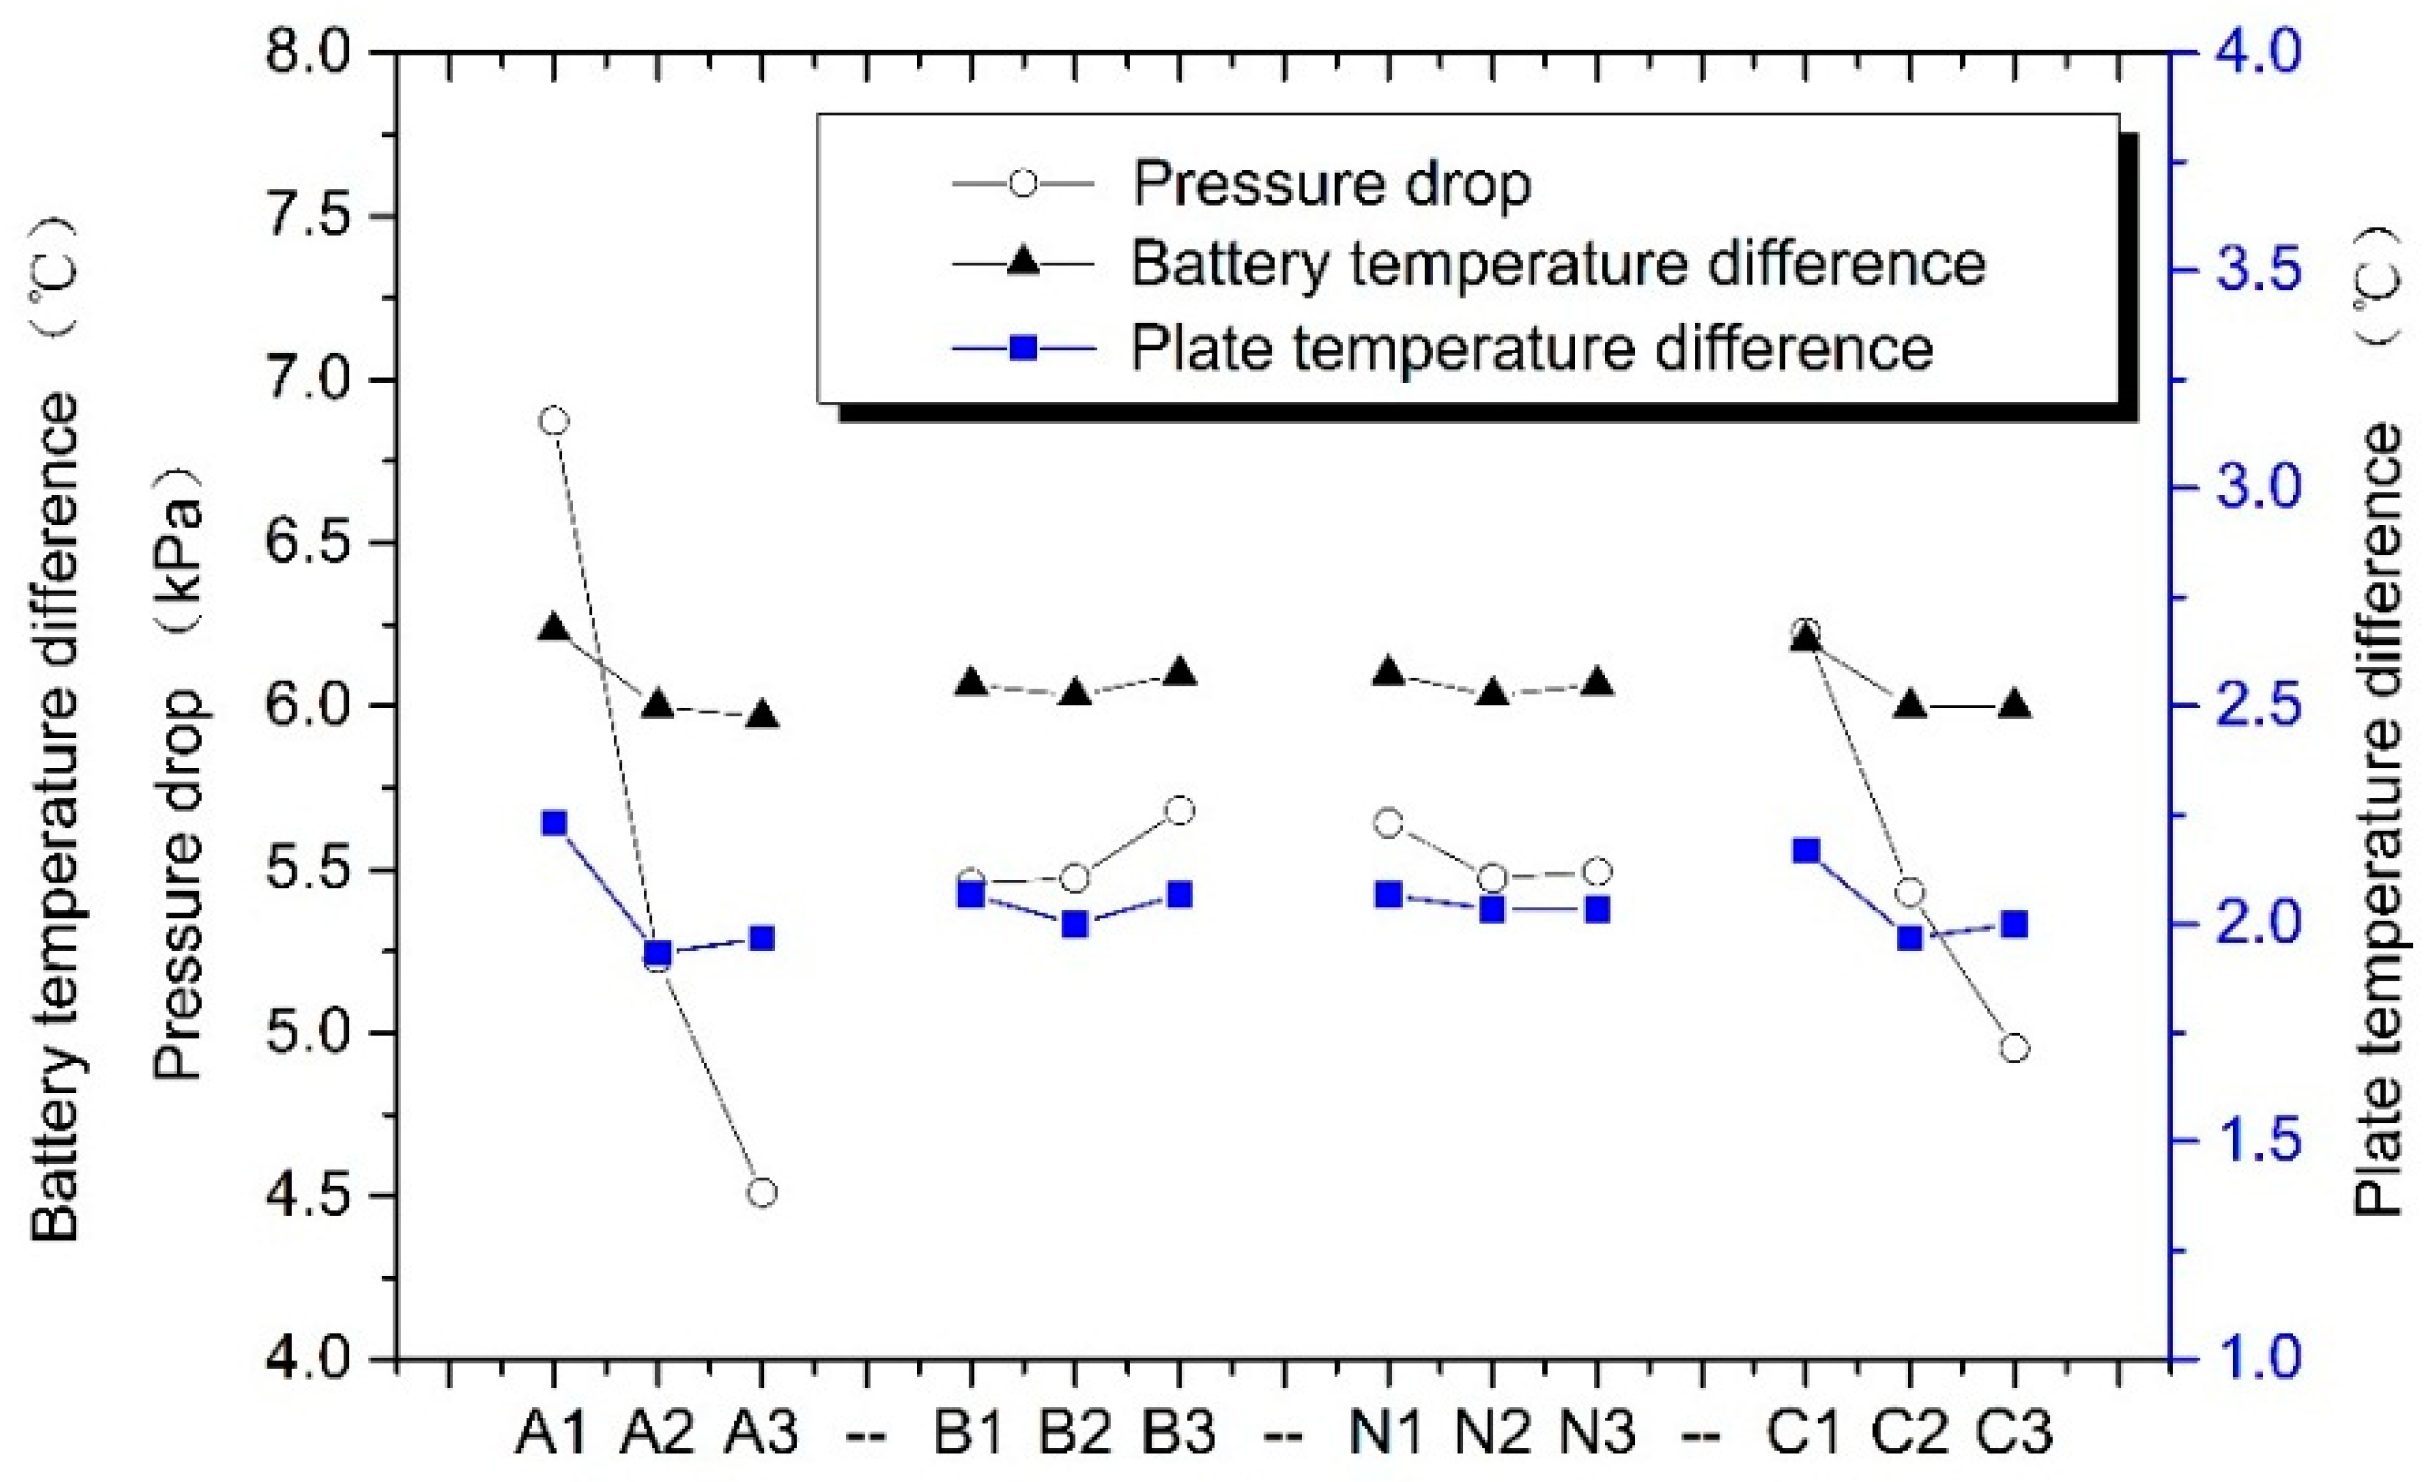
| Test Number | A | B | N | C | Pressure Drop, kPa | Battery Temperature Difference, °C | Plate Temperature Difference, °C |
|---|---|---|---|---|---|---|---|
| 1 | 1 | 1 | 1 | 1 | 7.59 | 6.4 | 2.4 |
| 2 | 1 | 2 | 2 | 2 | 6.64 | 6.1 | 2.1 |
| 3 | 1 | 3 | 3 | 3 | 6.39 | 6.2 | 2.2 |
| 4 | 2 | 1 | 2 | 3 | 4.50 | 5.9 | 1.9 |
| 5 | 2 | 2 | 3 | 1 | 5.81 | 6.1 | 2.0 |
| 6 | 2 | 3 | 1 | 2 | 5.37 | 6.0 | 1.9 |
| 7 | 3 | 1 | 3 | 2 | 4.28 | 5.9 | 1.9 |
| 8 | 3 | 2 | 1 | 3 | 3.97 | 5.9 | 1.9 |
| 9 | 3 | 3 | 2 | 1 | 5.28 | 6.1 | 2.1 |
| Evaluation Indexes | A | B | N | C | |
|---|---|---|---|---|---|
| Plate temperature difference | 1 | 2.233 | 2.067 | 2.067 | 2.167 |
| 2 | 1.933 | 2.000 | 2.033 | 1.967 | |
| 3 | 1.967 | 2.067 | 2.033 | 2.000 | |
| Battery temperature difference | 1 | 6.233 | 6.067 | 6.100 | 6.200 |
| 2 | 6.000 | 6.033 | 6.033 | 6.000 | |
| 3 | 5.967 | 6.100 | 6.067 | 6.000 | |
| Pressure drop | 1 | 6.873 | 5.457 | 5.643 | 6.227 |
| 2 | 5.227 | 5.473 | 5.473 | 5.430 | |
| 3 | 4.510 | 5.680 | 5.493 | 4.953 |
| Evaluation Indexes | A | B | N | C |
|---|---|---|---|---|
| Pressure drop | 2.363 | 0.223 | 0.170 | 1.274 |
| Battery temperature difference | 0.266 | 0.067 | 0.067 | 0.200 |
| Plate temperature difference | 0.300 | 0.067 | 0.034 | 0.200 |
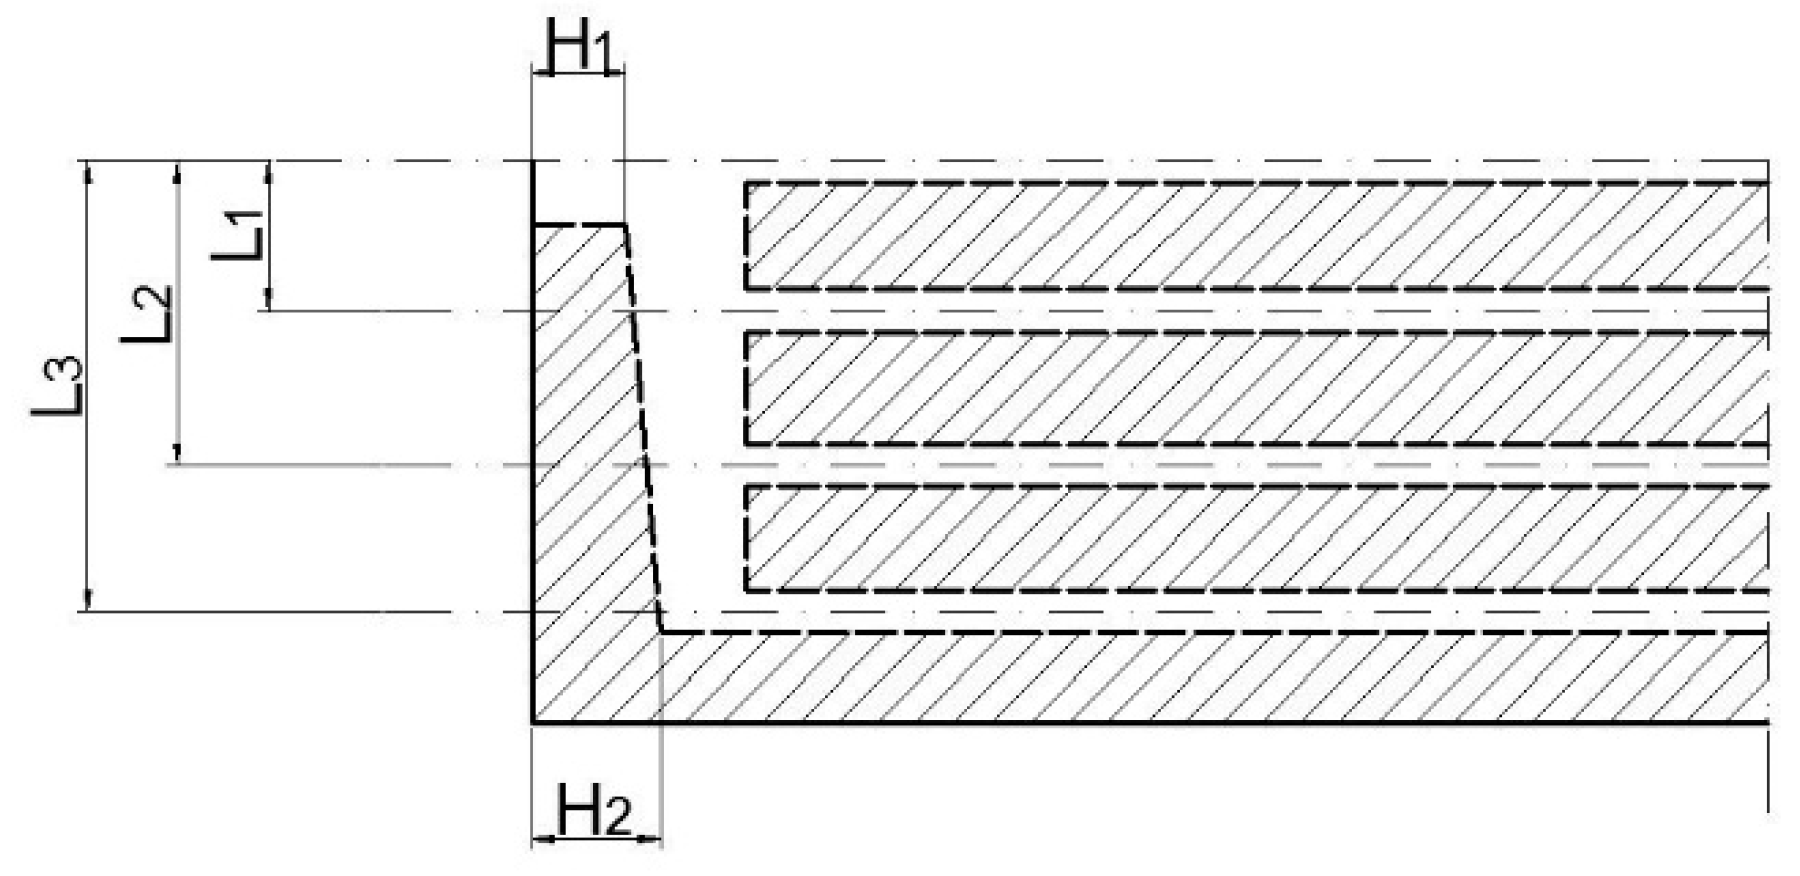
| Parameters (mm) | L1 | L2 | L3 | H1 | H2 |
|---|---|---|---|---|---|
| Initial value | 17.5 | 35.5 | 52.5 | 15 | 15 |
| Upper limit value | 25 | 43 | 60 | 15 | 17.5 |
| Lower limit value | 10 | 28 | 45 | 12.5 | 15 |
| Candidate Point | H1 (mm) | H2 (mm) | L1 (mm) | L2 (mm) | L3 (mm) | Pressure Drop (Pa) | Maximum Temperature (°C) |
|---|---|---|---|---|---|---|---|
| 1 | 12.861 | 15.089 | 10.995 | 41.832 | 55.503 | 3217.6 | 26.99 |
| 2 | 12.846 | 15.792 | 12.106 | 38.232 | 57.340 | 3226.1 | 26.99 |
| 3 | 13.356 | 16.041 | 11.201 | 36.216 | 59.964 | 3238.3 | 26.98 |
| Parameter | H1 | H2 | L1 | L2 | L3 |
|---|---|---|---|---|---|
| Value(mm) | 12.50 | 15.00 | 11.00 | 42.00 | 55.50 |
© 2019 by the authors. Licensee MDPI, Basel, Switzerland. This article is an open access article distributed under the terms and conditions of the Creative Commons Attribution (CC BY) license (http://creativecommons.org/licenses/by/4.0/).
Share and Cite
Ye, B.; Rubel, M.R.H.; Li, H. Design and Optimization of Cooling Plate for Battery Module of an Electric Vehicle. Appl. Sci. 2019, 9, 754. https://doi.org/10.3390/app9040754
Ye B, Rubel MRH, Li H. Design and Optimization of Cooling Plate for Battery Module of an Electric Vehicle. Applied Sciences. 2019; 9(4):754. https://doi.org/10.3390/app9040754
Chicago/Turabian StyleYe, Ben, Md Rashedul Haque Rubel, and Hongjun Li. 2019. "Design and Optimization of Cooling Plate for Battery Module of an Electric Vehicle" Applied Sciences 9, no. 4: 754. https://doi.org/10.3390/app9040754
APA StyleYe, B., Rubel, M. R. H., & Li, H. (2019). Design and Optimization of Cooling Plate for Battery Module of an Electric Vehicle. Applied Sciences, 9(4), 754. https://doi.org/10.3390/app9040754