Simultaneous Determination of Pyrethroid, Organophosphate and Carbamate Metabolites in Human Urine by Gas Chromatography–Mass Spectrometry (GCMS)


Abstract
:1. Introduction
2. Materials and Methods
2.1. Chemicals and Materials
2.2. Equipment
2.2.1. Regular Equipment
2.2.2. GCMS Operating Condition
2.3. Internal Standard Solution
2.4. Sample Extraction
2.4.1. Acid Hydrolysis
2.4.2. Liquid–Liquid Extraction (LLE)
2.4.3. Derivatization
2.5. Calibration and Preparation Procedures
2.6. Storage of Sample Solutions
2.7. Method Validation
2.7.1. Efficiency of Extraction (Method Accuracy)
2.7.2. Method Precision
3. Results and Discussion
3.1. Separation on GCMS Chromatogram, Limit of Detection (LOD), and Limit of Quantification (LOQ)
3.2. Calibration Procedure
3.3. Accuracy of the Method and Sample Extraction Efficiency
3.4. Precision of the Method
3.5. Testing Result of Genuine Urine Samples
3.6. Comparison with Other Assay Methods
4. Conclusions
Author Contributions
Funding
Acknowledgments
Conflicts of Interest
References
- Glynne-Jones. Pyrethrum; The Royal Society of Chemistry: London, UK, 2001; pp. 195–198. [Google Scholar]
- Yu, C.J.; Du, C.J.; Chiou, H.C.; Chung, M.Y.; Yang, W.; Chen, Y.S.; Fuh, M.R.; Chien, L.C.; Hwang, B.; Chen, M.L. Increased risk of attention-deficit/hyperactivity disorder associated with exposure to organophosphate pesticide in Taiwanese children. Andrology 2016, 4, 695–705. [Google Scholar] [CrossRef] [PubMed] [Green Version]
- Howard, P.H. Handbook of Environmental Fate and Exposure Data for Organic Chemicals, 2nd ed.; Howard, P.H., Ed.; Lewis Publishers: Boca Raton, FL, USA, 1989; Volumn 3. [Google Scholar]
- Timchalk, C. Organophosphorus Insecticide Pharmacokinetics. In Hayes’ Handbook of Pesticide Toxicology (Third Edition), 2nd ed.; Academic Press: Cambridge, MA, USA, 2010; Chapter 66. [Google Scholar]
- Michael Eddleston, N.A.B.; Eyer, P.; Dawsonb, A.H. Management of acute organophosphorus pesticide poisoning. Lancet 2008, 371, 597–607. [Google Scholar] [CrossRef] [Green Version]
- WHO. Evaluation of Five Organophosphate Insecticides and Herbicides; Iarc Monog Eval Carc; World Health Organization: Geneva, Switzerland, 2017; pp. 1–2. [Google Scholar]
- IPCS. The WHO Recommended Classification of Pesticides by Hazard and Guidelines to Classification; World Health Organization: Geneva, Switzerland, 2009; pp. 1–11. [Google Scholar]
- Lenga, G.; Gries, W.; Selim, S. Biomarker of pyrethrum exposure. Toxicol. Lett. 2006, 162, 195–201. [Google Scholar] [CrossRef] [PubMed]
- Permethrin Facts (Reregistration Eligibility Decision (RED) Fact Sheet). Available online: https://archive.epa.gov/pesticides/reregistration/web/html/permethrin_fs.html (accessed on 6 November 2018).
- Martin-Reina, J.; Duarte, J.A.; Cerrillos, L.; Bautista, J.D.; Moreno, I. Insecticide Reproductive Toxicity Profile: Organophosphate, Carbamate and Pyrethroids. J. Toxins 2017, 4, 1–7. [Google Scholar]
- Muñoz-Quezada, M.T. Predictors of exposure to organophosphate pesticides in schoolchildren in the Province of Talca, Chile. Environ. Int. 2012, 47, 28–36. [Google Scholar] [CrossRef] [PubMed] [Green Version]
- Oulhote, Y.; Bouchard, M.F. Urinary metabolites of organophosphate and pyrethroid pesticides and behavioral problems in canadian children. Environ. Health Perspect. 2013, 121, 1378–1384. [Google Scholar] [CrossRef] [PubMed]
- Petropoulou, S.E.; Gikas, E.; Tsarbopoulos, A.; Siskos, P.A. Gas chromatographic–tandem mass spectrometric method for the quantitation of carbofuran, carbaryl and their main metabolites in applicators’ urine. J. Chromatogr. A 2006, 1108, 99–110. [Google Scholar] [CrossRef] [PubMed]
- Scollon, E.J.; Starr, J.M.; Godin, S.J.; DeVito, M.J.; Hughes, M.F. In Vitro Metabolism of Pyrethroid Pesticides by Rat and Human Hepatic Microsomes and Cytochrome P450 Isoforms. Drug Metab. Dispos. 2009, 37, 221–228. [Google Scholar] [CrossRef] [PubMed]
- Crow, J.A.; Borazjani, A.; Potter, P.M.; Ross, M.K. Hydrolysis of pyrethroids by human and rat tissues: Examination of intestinal, liver and serum carboxylesterases. Toxicol. Appl. Pharm. 2007, 221, 1–12. [Google Scholar] [CrossRef] [PubMed] [Green Version]
- Ahn, K.C.; Kim, He.; McCoy, M.R.; Gee, S.J.; Hammock, B.D. Immunoassays and Biosensors for Monitoring Environmental and Human Exposure to Pyrethroid Insecticides. J. Agric. Food Chem. 2011, 59, 2792–2802. [Google Scholar] [CrossRef] [PubMed] [Green Version]
- Olsson, A.O.; Baker, S.E.; Nguyen, J.V.; Romanoff, L.C.; Udunka, S.O.; Walker, R.D.; Flemmen, K.L.; Barr, D.B. A Liquid Chromatography-Tandem Mass Spectrometry Multiresidue Method for Quantification of Specific Metabolites of Organophosphorus Pesticides, Synthetic Pyrethroids, Selected Herbicides, and DEET in Human Urine. Anal. Chem. 2004, 76, 2453–2461. [Google Scholar] [CrossRef] [PubMed]
- Angerer, J.; Ritter, A. Determination of metabolites of pyrethroids in human urine using solid-phase extraction and gas chromatography–mass spectrometry. J. Chromatogr. B 1997, 695, 217–226. [Google Scholar] [CrossRef]
- Bravo, R.; Driskell, W.J.; Whitehead, R.D., Jr.; Needham, L.L.; Barr, D.B. Quantitation of Dialkyl Phosphate Metabolites of Organophosphate Pesticides in Human Urine Using GC-MS-MS with Isotopic Internal Standards. J. Anal. Toxicol. 2002, 26, 245–252. [Google Scholar] [CrossRef] [PubMed] [Green Version]
- Guo, X.Y.; Sun, L.S.; Huang, M.Y.; Xu, W.L.; Wang, Y.; Wang, N. Simultaneous determination of eight metabolites of organophosphate and pyrethroid pesticides in urine. J. Environ. Sci. Health B 2017, 52, 1–9. [Google Scholar] [CrossRef] [PubMed]
- Hung, C.C.; Huang, F.J.; Yang, Y.Q.; Hsieh, C.J.; Tseng, C.C.; Yiin, L.M. Pesticides in indoor and outdoor residential dust: A pilot study in a rural county of Taiwan. Environ. Sci. Pollut. Res. 2018, 23, 23349–23356. [Google Scholar] [CrossRef] [PubMed]
- Arrebola, F.J.; Martínez-Vidal, J.L.; Fernández-Gutiérrez, A.; Akhtar, M.H. Monitoring of pyrethroid metabolites in human urine using solid-phase extraction followed by gas chromatography-tandem mass spectrometry. Anal. Chim. Acta 1999, 401, 45–54. [Google Scholar] [CrossRef]
- De Alwis, G.K.H.; Needham, L.L.; Barr, D.B. Determination of Dialkyl Phosphate Metabolites of Organophosphorus Pesticides in Human Urine by Automated Solid-Phase Extraction, Derivatization, and Gas Chromatography-Mass Spectrometry. J. Anal. Toxicol. 2008, 32, 721–727. [Google Scholar] [CrossRef] [Green Version]
- Schettgen, T.; Koch, H.M.; Drexler, H.; Angerer, J. New gas chromatographic–mass spectrometric method for the determination of urinary pyrethroid metabolites in environmental medicine. J. Chromatogr. B 2002, 778, 121–130. [Google Scholar] [CrossRef]
- Leng, G.; Gries, W. Simultaneous determination of pyrethroid and pyrethrin metabolites in human urine by gas chromatography–high resolution mass spectrometry. J. Chromatogr. B 2005, 814, 285–294. [Google Scholar] [CrossRef] [PubMed]
- le Grand, R.; Dulaurent, S.; Gaulier, J.M.; Saint-Marcoux, F.; Moesch, C.; Lachâtre, G. Simultaneous determination of five synthetic pyrethroid metabolites in urine by liquid chromatography-tandem mass spectrometry: Application to 39 persons without known exposure to pyrethroids. Toxicol. Lett. 2012, 210, 248–253. [Google Scholar] [CrossRef] [PubMed]
- Sinha, S.N.; Reddy, B.V.; Vasudev, K.; Rao, M.V.V.; Ahmed, M.N.; Ashu, S.; Kumari, A.; Bhatnagar, V. Analysis of dialkyl urine metabolites of organophosphate pesticides by a liquid chromatography mass spectrometry technique. Anal. Methods 2014, 6, 1825–1834. [Google Scholar] [CrossRef]
- INSQ. Analytical Method for the Determination of Pyrethroid Metabolites in Urine by GC-MS, Condensed Version for CHMS, Analytical Chemistry for Environmental Sciences, Quebec, Canada, 08.25.2009; Institut national de santé publique: Quebec, Canada, 2009; p. e426. [Google Scholar]
- Davis, M.D.; Wade, E.L.; Restrepo, P.R.; Roman-Esteva, W.; Bravo, R.; Kuklenyik, P.; Calafat, A.M. Semi-automated solid phase extraction method for the mass spectrometric quantification of 12 specific metabolites of organophosphorus pesticides, synthetic pyrethroids, and select herbicides in human urine. J. Chromatogr. B 2013, 929, 18–26. [Google Scholar] [CrossRef] [PubMed]

| Metabolite | Parent Insecticide | Classification |
|---|---|---|
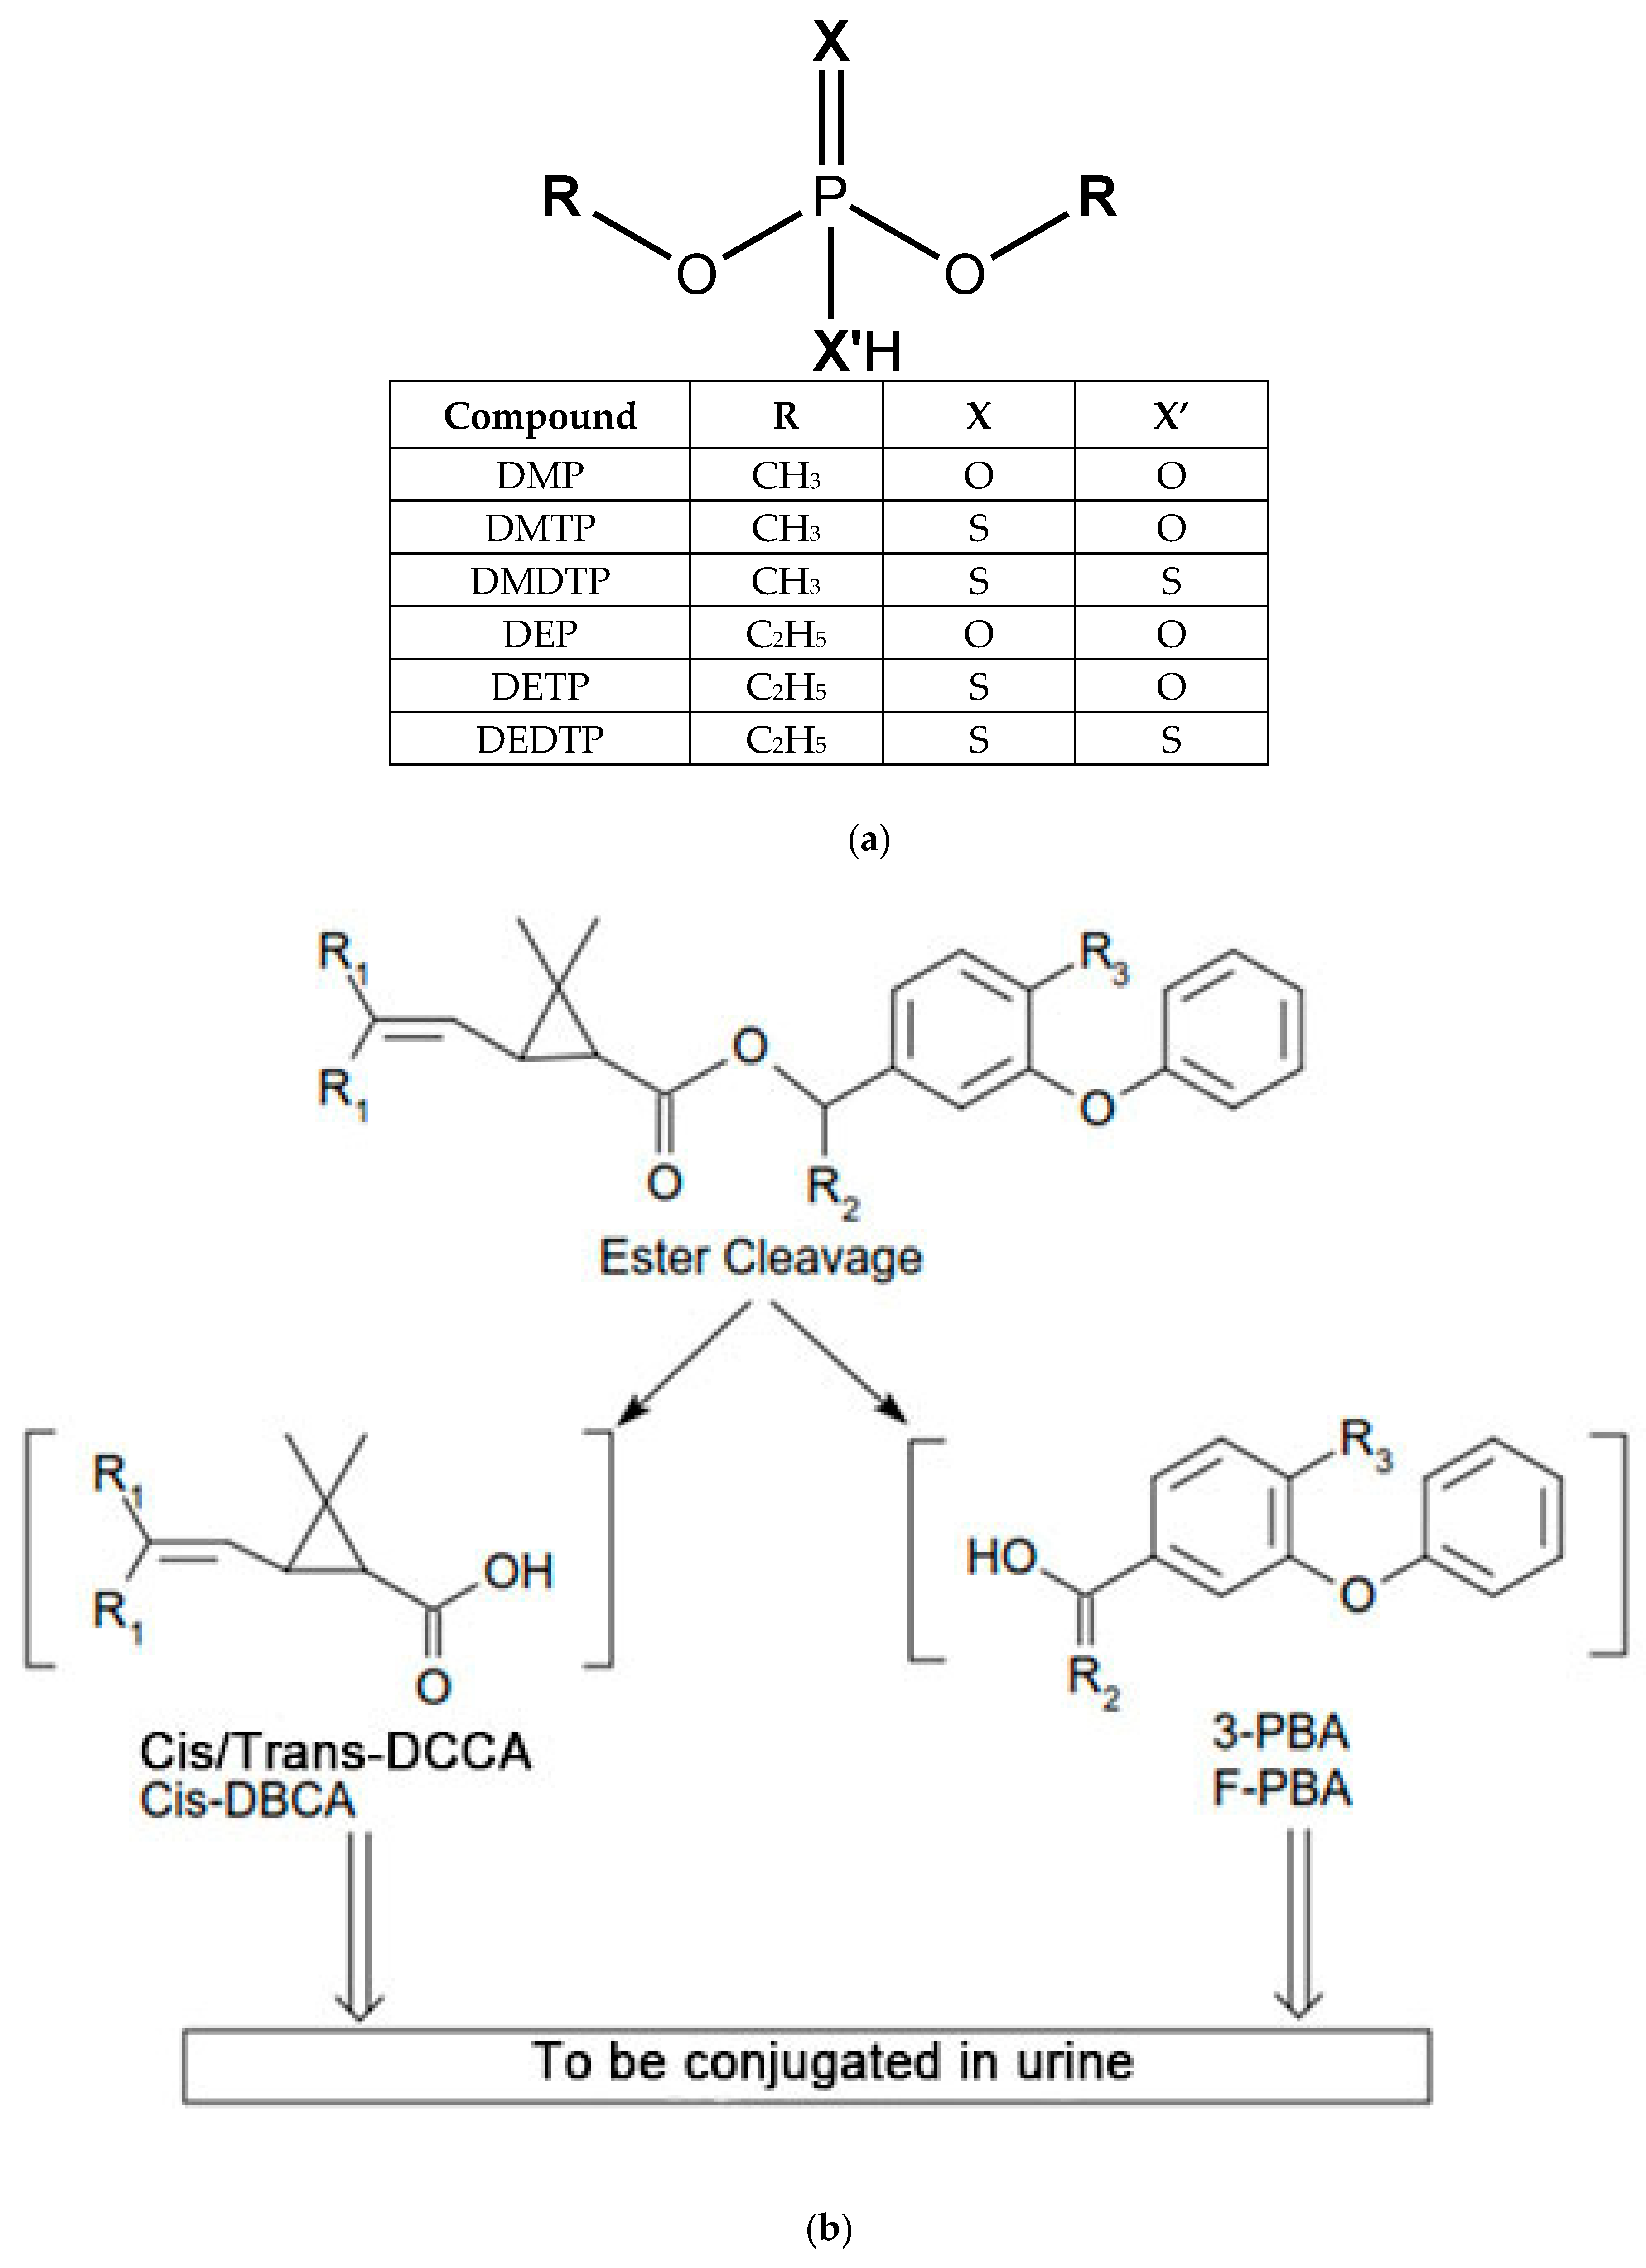
| 3-PBA a | Cyhalothrin, cypermethrin, deltamethrin, ethonfenprox, esfenvalerate, fenpropathrin, permethrin, phenothrin | PYR |
| cis/trans-DCCA b | Cypermethrin, cyfluthrin, permethrin | PYR |
| cis-DBCA c | Deltamethrin | PYR |
| trans-CDCA d | Allethrin, imiprothrin, phenothrin, prallethrin, resmethrin, tetramethrin | PYR |
| FPBA e | Cyfluthrin | PYR |
| DMP f | Azinphos methyl, chlorpyrifos methyl, dichlorvos (DDVP), dicrotophos, dimethoate, fenitrothion, fenthion, methyl parathion, oxydemeton-methyl, phosmet, pirimiphos-methy, temephos, naled, tetrachlorviphos, trichlorfon | OP |
| DMTP g | Azinphos methyl, chlorpyrifos methyl, dimethoate, isazaphos-methyl, fenitrothion, fenthion, methyl parathion, oxydemeton-methyl, phosmet, pirimiphos-methy, temephos, | OP |
| DMDTP h | Azinphos methyl, dimethoate, malathion, phosmet, | OP |
| DEP i | chlorethoxyphos, chlorpyrifos, coumaphos, diazinon, disulfoton, ethion, malathion, parathion, phorate, sulfotepp, terbufos, | OP |
| DETP j | Chlorethoxyphos, chlorpyrifos, coumaphos, diazinon, disulfoton, ethion, parathion, phorate, sulfotepp, terbufos, | OP |
| DEDTP k | Disulfoton, ethion, phorate, terbufos, | OP |
| 7-phenol l | Carbofuran | CI |
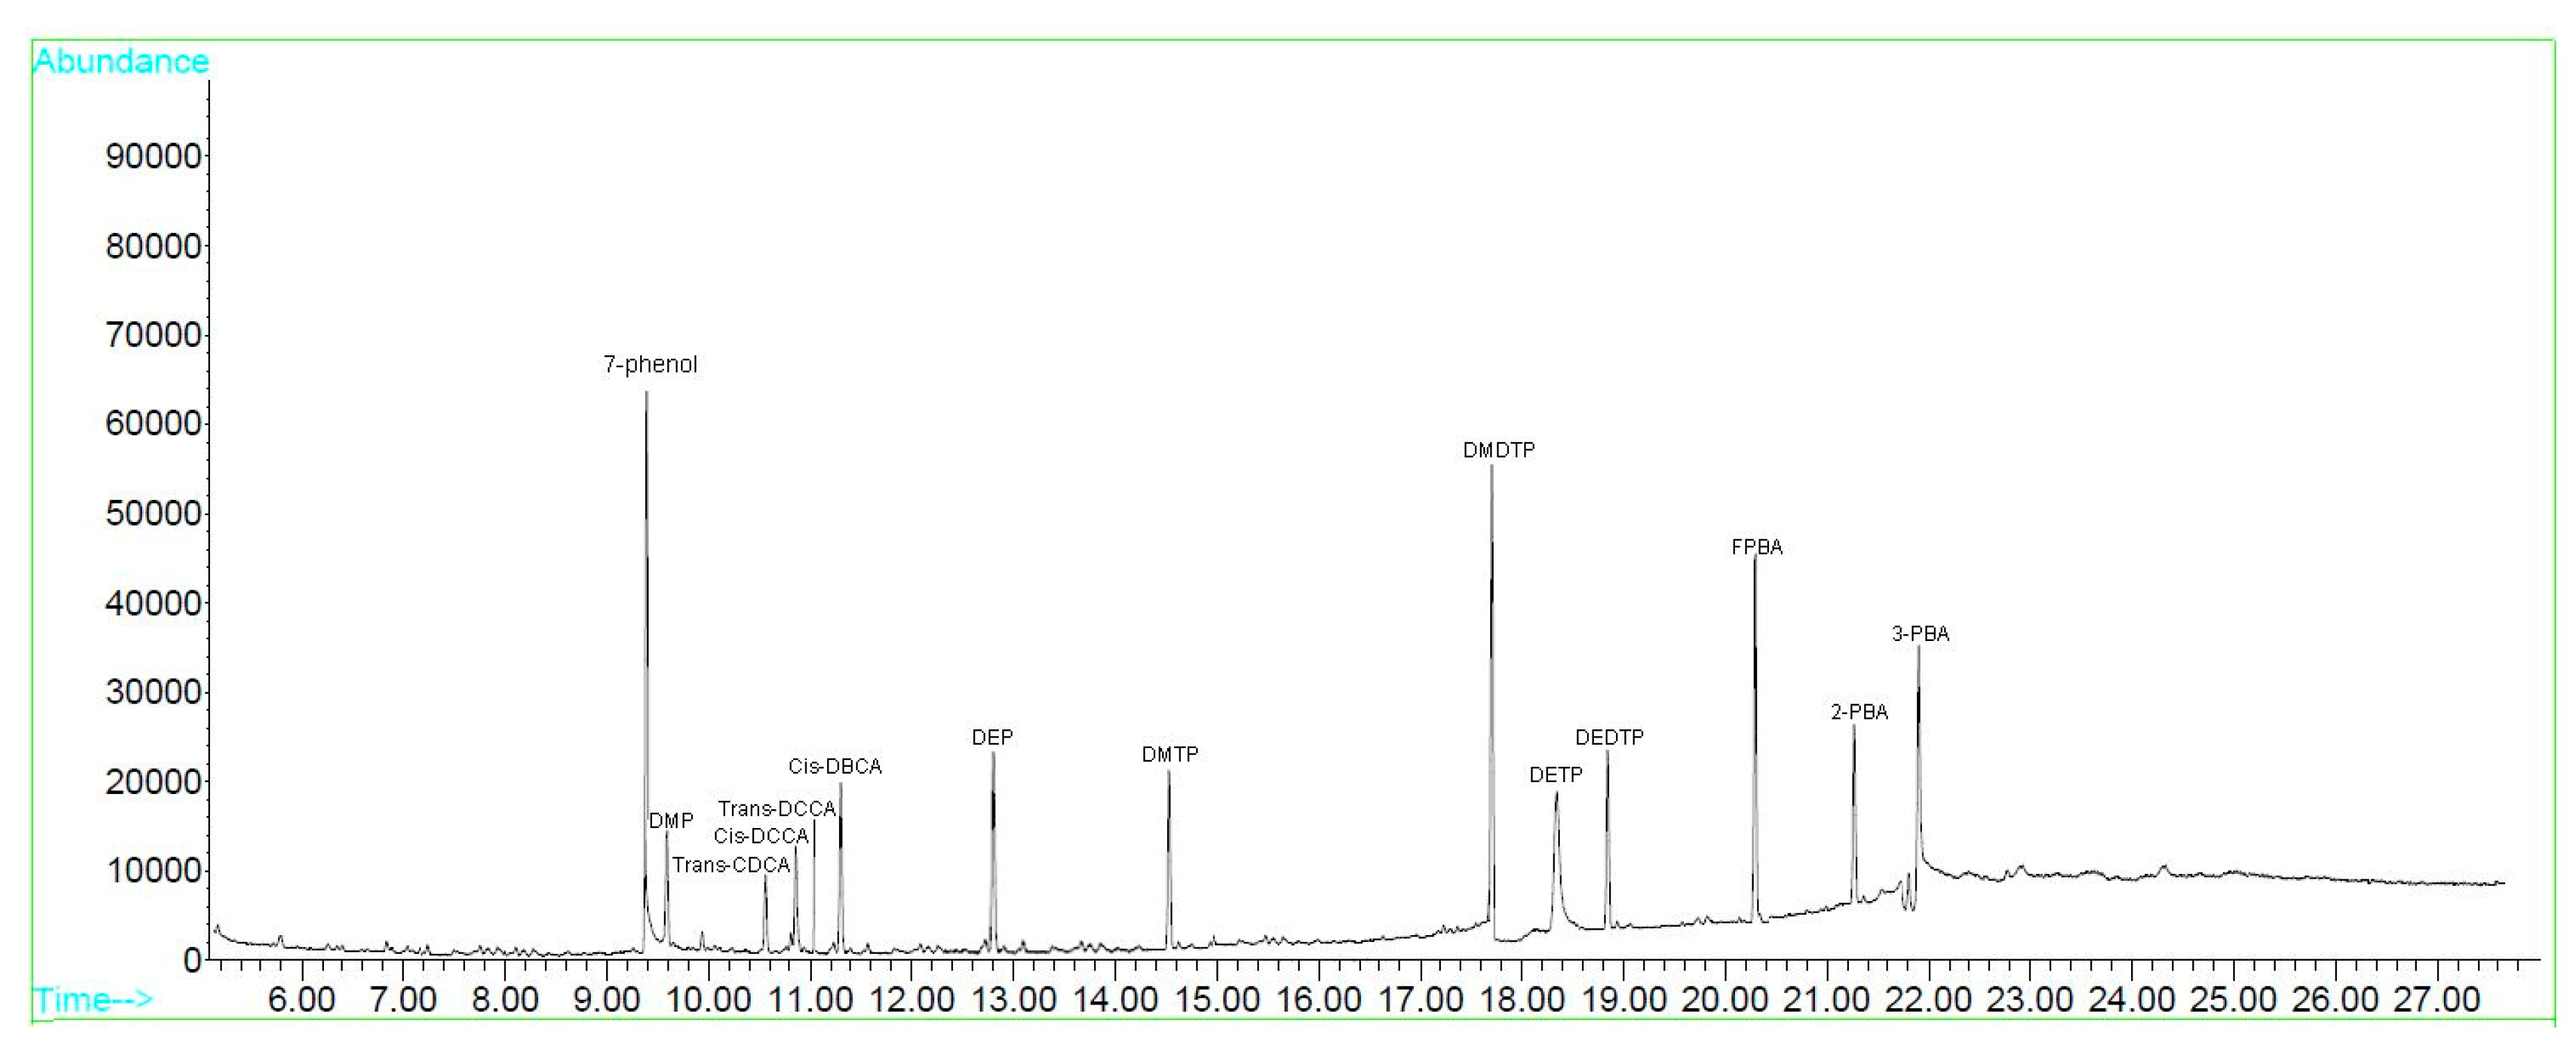
| Metabolite | RT (min) | DI (m/z) | LOD (μg/L) | LOQ (μg/L) |
|---|---|---|---|---|
| 7-phenol | 9.34 | 245.0 | 0.050 | 0.2 |
| DMP | 9.63 | 306.1 | 0.050 | 0.2 |
| DEP | 12.81 | 334.7 | 0.100 | 0.3 |
| DMTP | 14.54 | 322.2 | 0.050 | 0.2 |
| DMDTP | 16.73 | 338.2 | 0.100 | 0.3 |
| DETP | 17.38 | 350.4 | 0.100 | 0.3 |
| DEDTP | 19.21 | 366.0 | 0.050 | 0.2 |
| trans-CDCA | 10.63 | 331.0 | 0.050 | 0.2 |
| cis-DCCA | 10.86 | 323.0 | 0.025 | 0.1 |
| trans-DCCA | 11.08 | 323.0 | 0.025 | 0.1 |
| cis-DBCA | 11.15 | 368.9 | 0.025 | 0.1 |
| FPBA | 20.37 | 364.0 | 0.025 | 0.1 |
| 2-PBA | 21.28 | 364.0 | 0.025 | 0.1 |
| 3-PBA | 21.92 | 382.0 | 0.025 | 0.1 |
| Metabolite | Group A L | Group B L | - | Group A H | Group B H | - | ||||
|---|---|---|---|---|---|---|---|---|---|---|
| RR (%) | RSD (%) | RR (%) | RSD (%) | RE (%) | RR (%) | RSD (%) | RR (%) | RSD (%) | RE (%) | |
| 3-PBA | 94.5 | 5.3 | 96.2 | 2.6 | 1.77 | 93.6 | 5.2 | 95.4 | 2.7 | 1.89 |
| cis-DCCA | 93.3 | 6.1 | 96.0 | 3.1 | 2.81 | 94.4 | 2.1 | 97.4 | 1.7 | 3.08 |
| trans-DCCA | 94.5 | 3.2 | 97.2 | 2.4 | 2.78 | 95.3 | 2.5 | 97.7 | 2.6 | 2.46 |
| cis-DBCA | 90.7 | 4.2 | 94.2 | 4.3 | 3.72 | 91.5 | 2.6 | 96.2 | 3.6 | 4.89 |
| trans-CDCA | 92.5 | 3.4 | 95.5 | 2.7 | 3.14 | 92.1 | 4.6 | 95.9 | 1.8 | 3.96 |
| FPBA | 89.3 | 6.5 | 93.9 | 3.7 | 4.90 | 92.3 | 4.3 | 93.2 | 5.3 | 0.97 |
| DMP | 92.5 | 3.4 | 101.5 | 4.3 | 8.87 | 94.5 | 3.9 | 97.4 | 3.3 | 2.98 |
| DMTP | 90.6 | 4.3 | 96.5 | 4.1 | 6.11 | 91.3 | 5.4 | 95.2 | 4.2 | 4.10 |
| DMDTP | 94.4 | 4.3 | 103.3 | 2.5 | 8.62 | 93.9 | 2.6 | 97.7 | 2.4 | 3.89 |
| DEP | 92.8 | 3.8 | 97.6 | 3.9 | 4.92 | 95.5 | 5.4 | 97.3 | 1.1 | 1.85 |
| DETP | 93.4 | 2.5 | 94.2 | 1.1 | 0.85 | 93.6 | 4.3 | 94.1 | 2.1 | 0.53 |
| DEDTP | 90.2 | 3.3 | 94.4 | 2.4 | 4.45 | 94.4 | 3.5. | 98.5 | 2.3 | 4.16 |
| 7-phenol | 92.6 | 3.1 | 96.2 | 3.5 | 3.74 | 92.7 | 3.9 | 97.5 | 3.1 | 4.92 |
| 2-PBA | 91.5 | 4.6 | 92.5 | 3.3 | 1.08 | 92.4 | 4.1 | 92.1 | 3.2 | 0.33 |
| Average | 92.34 | 4.14 | 96.37 | 3.14 | 4.13 | 93.39 | 3.92 | 96.11 | 2.81 | 2.86 |
| Metabolite | Within-Day RSD (%) | Between-Day RSD (%) | |||||
|---|---|---|---|---|---|---|---|
| Group CL | Group CM | Group CH | Group D | Group EL | Group EM | Group EH | |
| 3-PBA | 2.6 | 3.9 | 4.6 | 4.5 | 2.9 | 3.2 | 3.1 |
| cis-DCCA | 4.7 | 3.4 | 2.3 | 3.7 | 3.5 | 3.6 | 2.6 |
| trans-DCCA | 4.6 | 4.5 | 3.5 | 4.8 | 4.2 | 3.2 | 3.1 |
| cis-DBCA | 4.1 | 2.8 | 2.6 | 3.6 | 2.8 | 2.4 | 2.5 |
| trans-CDCA | 3.8 | 3.3 | 3.7 | 2.8 | 3.4 | 3.7 | 3.7 |
| FPBA | 4.8 | 2.6 | 3.3 | 3.6 | 4.5 | 5.3 | 3.8 |
| DMP | 3.9 | 4.1 | 5.1 | 3.2 | 3.8 | 4.1 | 2.6 |
| DMTP | 5.2 | 3.4 | 3.5 | 3.3 | 2.3 | 3.4 | 3.3 |
| DMDTP | 4.7 | 4.1 | 1.6 | 2.2 | 4.6 | 4.2 | 3.1 |
| DEP | 4.5 | 3.3 | 3.5 | 2.3 | 3.3 | 3.1 | 2.4 |
| DETP | 4.4 | 2.7 | 1.3 | 1.6 | 1.8 | 2.9 | 3.1 |
| DEDTP | 3.6 | 1.2 | 2.4 | 2.8 | 2.9 | 2.3 | 1.7 |
| 7-phenol | 1.7 | 2.3 | 1.8 | 3.9 | 1.0 | 1.7 | 1.9 |
| Average | 4.05 | 3.20 | 3.02 | 3.25 | 3.15 | 3.32 | 2.84 |
| Metabolites | DF (%) | Mean ± SD (μg/L) | Median (μg/L) | Maximum (μg/L) |
|---|---|---|---|---|
| 3-PBA | 36.5 | 11.34 ± 1.15 | 8.52 | 23.61 |
| cis-DCCA | 61.3 | 5.66 ± 2.41 | 2.71 | 71.30 |
| trans-DCCA | 68.5 | 17.33 ± 5.12 | 10.19 | 34.60 |
| cis-DBCA | 72.6 | 16.91 ± 4.12 | 4.41 | 24.52 |
| trans-CDCA | 57.4 | 14.74 ± 3.33 | 7.24 | 21.69 |
| FPBA | 81.3 | 5.12 ± 2.54 | 1.25 | 27.87 |
| DMP | 14.5 | 7.41 ± 5.51 | 4.23 | 10.91 |
| DMTP | 13.2 | 4.39 ± 1.16 | 2.11 | 5.24 |
| DMDTP | 14.1 | 5.33 ± 1.07 | 1.36 | 6.94 |
| DEP | 6.6 | 2.14 ± 3.45 | 2.45 | 7.17 |
| DETP | 8.8 | 6.26 ± 2.21 | 4.47 | 8.23 |
| DEDTP | 3.3 | 3.33 ± 1.77 | 1.21 | 7.11 |
| 7-phenol | 24.5 | 7.65 ± 2.36 | 3.39 | 34.49 |
| 2-PBA | 100 | 97.14 ± 1.26 | 95.26 | 104.32 |
| Type | No. of Metabolites | Detected Assay | LOD (μg/L) | Year & Source |
|---|---|---|---|---|
| OP | 6 | SPE & GCMS | 0.1~0.15 | 2008 [23] |
| OP | 6 | LLE & LC/MS/MS | 0.004~0.1 | 2014 [27] |
| PYR | 5 | SPE & GCMS | 0.006~0.01 | 2009 [28] |
| PYR | 5 | LLE & LC/MS/MS | 0.015 | 2012 [26] |
| CI | 4 | SPE & GC/MS/MS | 0.04 | 2006 [13] |
| OP & PYR | OP = 5, PYR = 5 | SPE & LC/MS/MS | <0.05 | 2013 [29] |
| OP & PYR | OP = 5, PYR = 3 | SPE & GC/MS/MS | 0.008~0.83 | 2017 [20] |
| CI, OP & PYRs | CI = 1, OP = 6, PYR = 7 | LLE & GCMS | 0.025~0.1 | This study |
© 2019 by the authors. Licensee MDPI, Basel, Switzerland. This article is an open access article distributed under the terms and conditions of the Creative Commons Attribution (CC BY) license (http://creativecommons.org/licenses/by/4.0/).
Share and Cite
Hung, C.-C.; Simaremare, S.R.S.; Hsieh, C.-J.; Yiin, L.-M. Simultaneous Determination of Pyrethroid, Organophosphate and Carbamate Metabolites in Human Urine by Gas Chromatography–Mass Spectrometry (GCMS). Appl. Sci. 2019, 9, 879. https://doi.org/10.3390/app9050879
Hung C-C, Simaremare SRS, Hsieh C-J, Yiin L-M. Simultaneous Determination of Pyrethroid, Organophosphate and Carbamate Metabolites in Human Urine by Gas Chromatography–Mass Spectrometry (GCMS). Applied Sciences. 2019; 9(5):879. https://doi.org/10.3390/app9050879
Chicago/Turabian StyleHung, Chien-Che, Sailent Rizki Sari Simaremare, Chia-Jung Hsieh, and Lih-Ming Yiin. 2019. "Simultaneous Determination of Pyrethroid, Organophosphate and Carbamate Metabolites in Human Urine by Gas Chromatography–Mass Spectrometry (GCMS)" Applied Sciences 9, no. 5: 879. https://doi.org/10.3390/app9050879
APA StyleHung, C.-C., Simaremare, S. R. S., Hsieh, C.-J., & Yiin, L.-M. (2019). Simultaneous Determination of Pyrethroid, Organophosphate and Carbamate Metabolites in Human Urine by Gas Chromatography–Mass Spectrometry (GCMS). Applied Sciences, 9(5), 879. https://doi.org/10.3390/app9050879