Abstract
Free Space Optics (FSO) Communication has attracted the attention of the researchers in the last decade due to its high data rate, security, and low cost. Relay-assisted techniques are used to divide the distance to shorter hops in order to mitigate the effects of turbulence, weather attenuation, pointing error, and geometric loss. Choosing an active relay per time slot has been proven to enhance the performance of the system and decrease the loading effect on the system when compared to all active relays. This paper investigates the best relay that can be selected according to the source to relay (S-R) channel coefficient, relay to destination (R-D) channel coefficient, and source to destination (S-D) channel coefficient. A comprehensive comparison is applied to the three following cases: (a) Broadcast phase from source to relay to select the best (Proactive-Relay); (b) Broadcast phase from relay to destination after broadcasting to all relays then select (Reactive-relays); and, (c) Direct link from source-to-best relay-to-destination to conclude which method is better for different scenarios, such as turbulence regime, number of relays, different pointing error effect, and severity of S-R as compared to R-D and vice versa. The selection methods regard to four aspects: (1) Number of relays (two or three relays); (2) Distance between Source-Relay and Relay-Destination (D = 400–600 m, 500–500 m, and 600–400 m); (3) The different turbulence of Log-normal channel and Gamma-Gamma channel (with a refractive index coefficient( = 0.5 × 10⁻¹⁴, 2 × 10⁻¹⁴ and 5 × 10⁻¹⁴)); and finally, (4) Beam waist (pointing error).
1. Introduction
We regard Free Space Optics (FSO) as a strong candidate to integrate with and complete the future technologies, such as 5G wireless networks. FSO technology is used widely in various indoor fields (e.g., data centers), space (e.g., intersatellite and deep space communication), (e.g., underwater sensing), terrestrial (e.g., mobile networks), and underwater systems [1].
FSO is an optical communication innovation, where the transmission of information is through spreading light in free space to permit an optical network. FSO operates as an optical fiber network but with different media. In FSO systems, the optical beams have free space or air medium, while the optical fiber network has cores that pass-through glass fiber. The FSO framework comprises an optical transceiver at the two ends to provide full duplex (bidirectional) ability. The existence of FSO communication goes back to the eighth century, however now it is more applicable. A full duplex (bidirectional) connectivity can help to accomplish more than 10 Gbps of data rate while using FSO technology, which is one of a line of sight (LOS) innovation [2].
On-off Keying (OOK) is a binary level modulation scheme where sending logic “1” is a presence of light and sending a logic “0” represents the absence of light. OOK has relatively poor energy efficiency, however it is still the most commonly used intensity modulation technique due to its implementation simplicity and low cost, while in a coherent FSO system the information is encoded on the optical carrier amplitude and phase and it still requires high speed digital signal processing integrated complex and expensive circuits [3].
A previous work was carried out on the multiple potential relays of cooperative communication. One of the studies is the outage probability of multi-hop free-space optical communication over strong turbulence channels [4]. Another work has investigated serial and parallel relaying that operates in amplify-and-forward (AF) or decode-and-forward (DF) modes [5]. Besides, some researchers discovered that the worst outage performance was achieved when increasing pointing error and total link distance [6].
The study of FSO has proved to be better for the last-mile solution and cost-effective backup of fiber optics, where it is easy to install. FSO has many drawbacks, such as the degradation of signal quality due to atmospheric turbulence, weather attenuation, pointing error, and geometric losses [3,7].
In [8], the authors investigate whether using a plenoptic sensor can find the best channel, even in the strong turbulence, and whether the target image can be received correctly. The relay selected techniques help FSO communication to overcome atmospheric turbulence and path loss challenges through hops. M. I. Petkovic et al. derived a novel closed-form outage probability and average bit error rate (ABER) expressions of mixed dual-hop radio frequency (RF)/FSO relaying system with the semi-blind AF relaying [9].
The authors of [10] have derived the ABER of two steps blind detection system while using a relay. The authors have also advised that the middle of the channel is the best location for the relay.
The investigation of the performance of the best relay selection of source-relay-destination (S-R-D) for FSO communications over atmospheric turbulence while using bit error rate (BER) and outage probability is discussed in [11].
With reference to existing literature, the main contribution of this paper is a case study of the three relay selection schemes, which are S-D, S-R-D, and R-D for the BER performance of OOK of FSO communications using the intensity modulation and direct detection (IM/DD) technique. However, the concept of best relay selection can also be applied to coherent modulation and demodulation. This paper concentrates on IM/DD due to its simplicity and low cost. A different number of relays and different distances between source-relay and relay-destination are considered. Moreover, different turbulence schemes are considered as the weak-moderate turbulence, which is modelled by log-normal channels, and strong turbulence, which is modelled by the Gamma-Gamma channels. In addition, the pointing error effect on the link is considered for the different beam waist effect. The obtained results show that there is no optimum technique under different conditions, since the optimum technique depends on several factors, such as the number of relays, different distances, turbulence, and pointing error effects.
2. System Model
The system consists of a source (S), relays (R), and a destination (D) working over the Log-normal channel and the Gamma-Gamma channel. We deem a relay-assisted FSO communication system, in which the transmitter transmits the signal from a point source, propagates that through an active relay from M parallel relays, before reaching the destination. An active relay will work in a time slot and the destination node will only receive the signal from the relay and will not receive anything from the source.
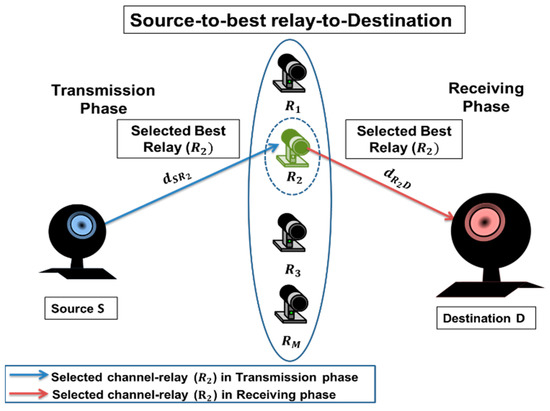
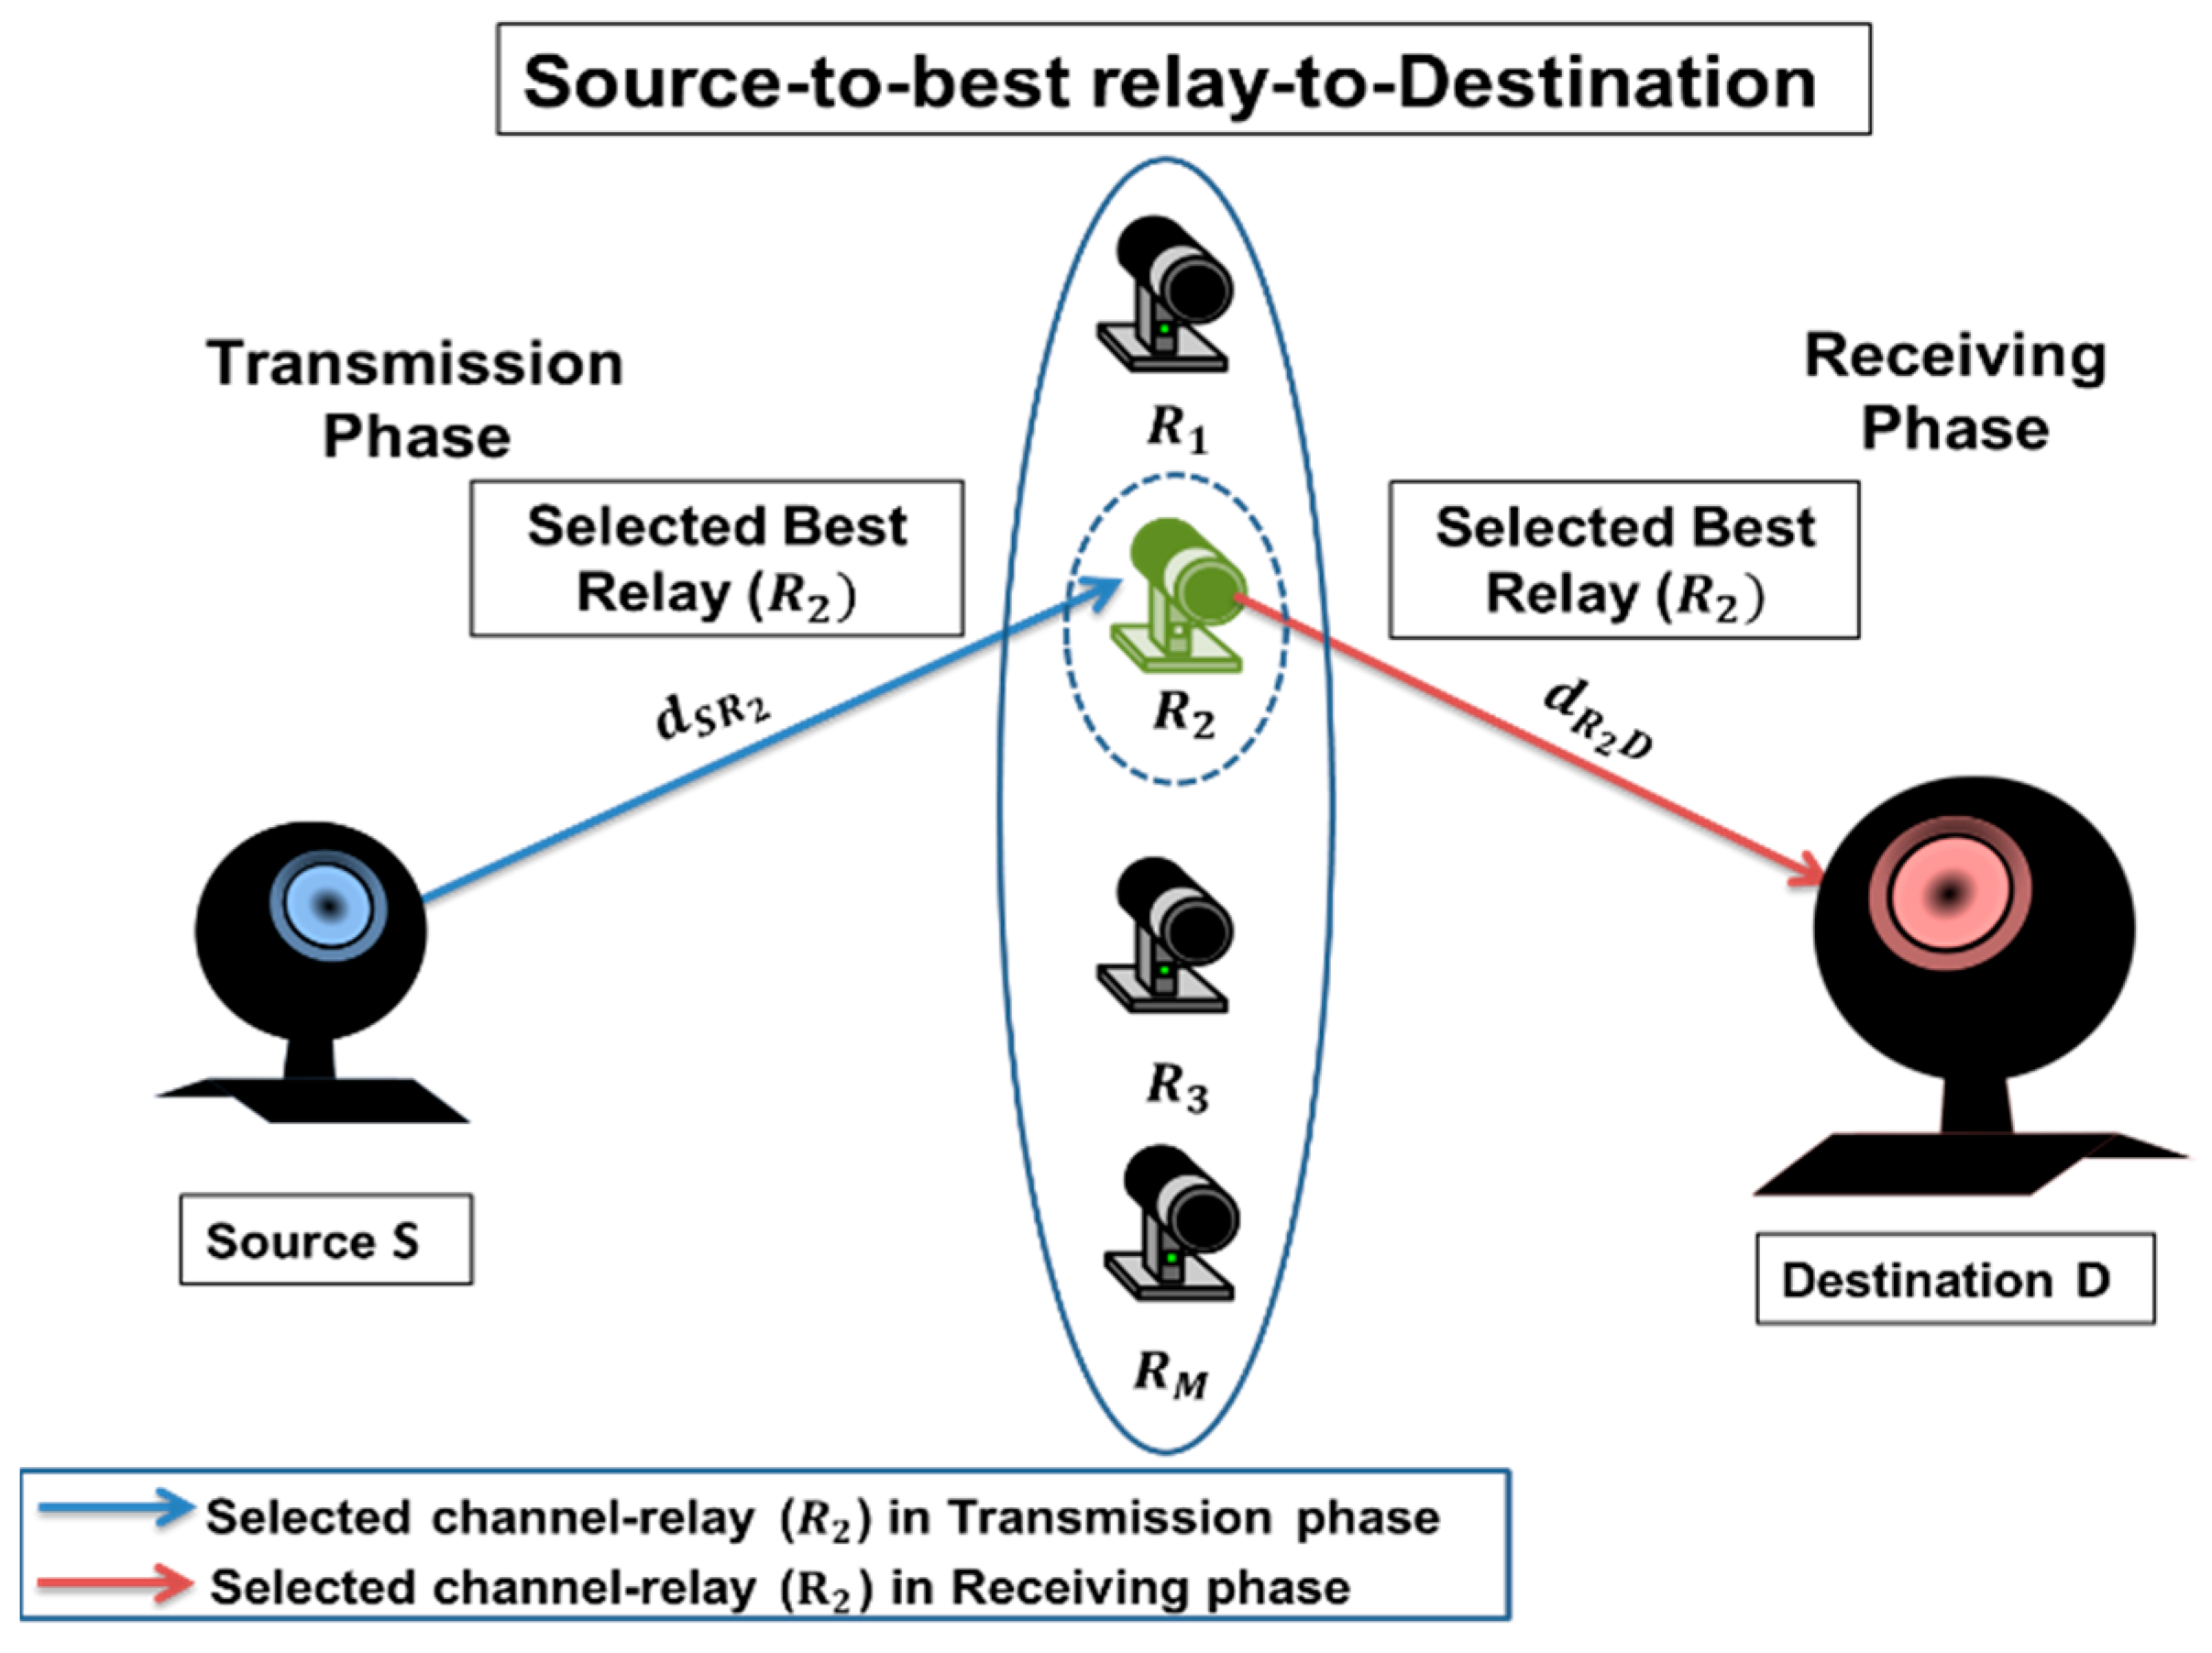
Figure 1.
Source-relay-destination scheme.
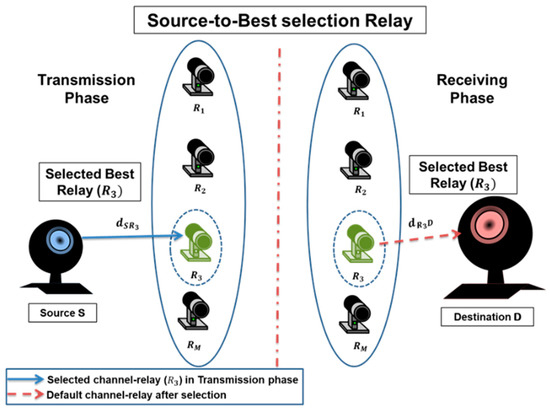
Figure 2.
Source-relay scheme.

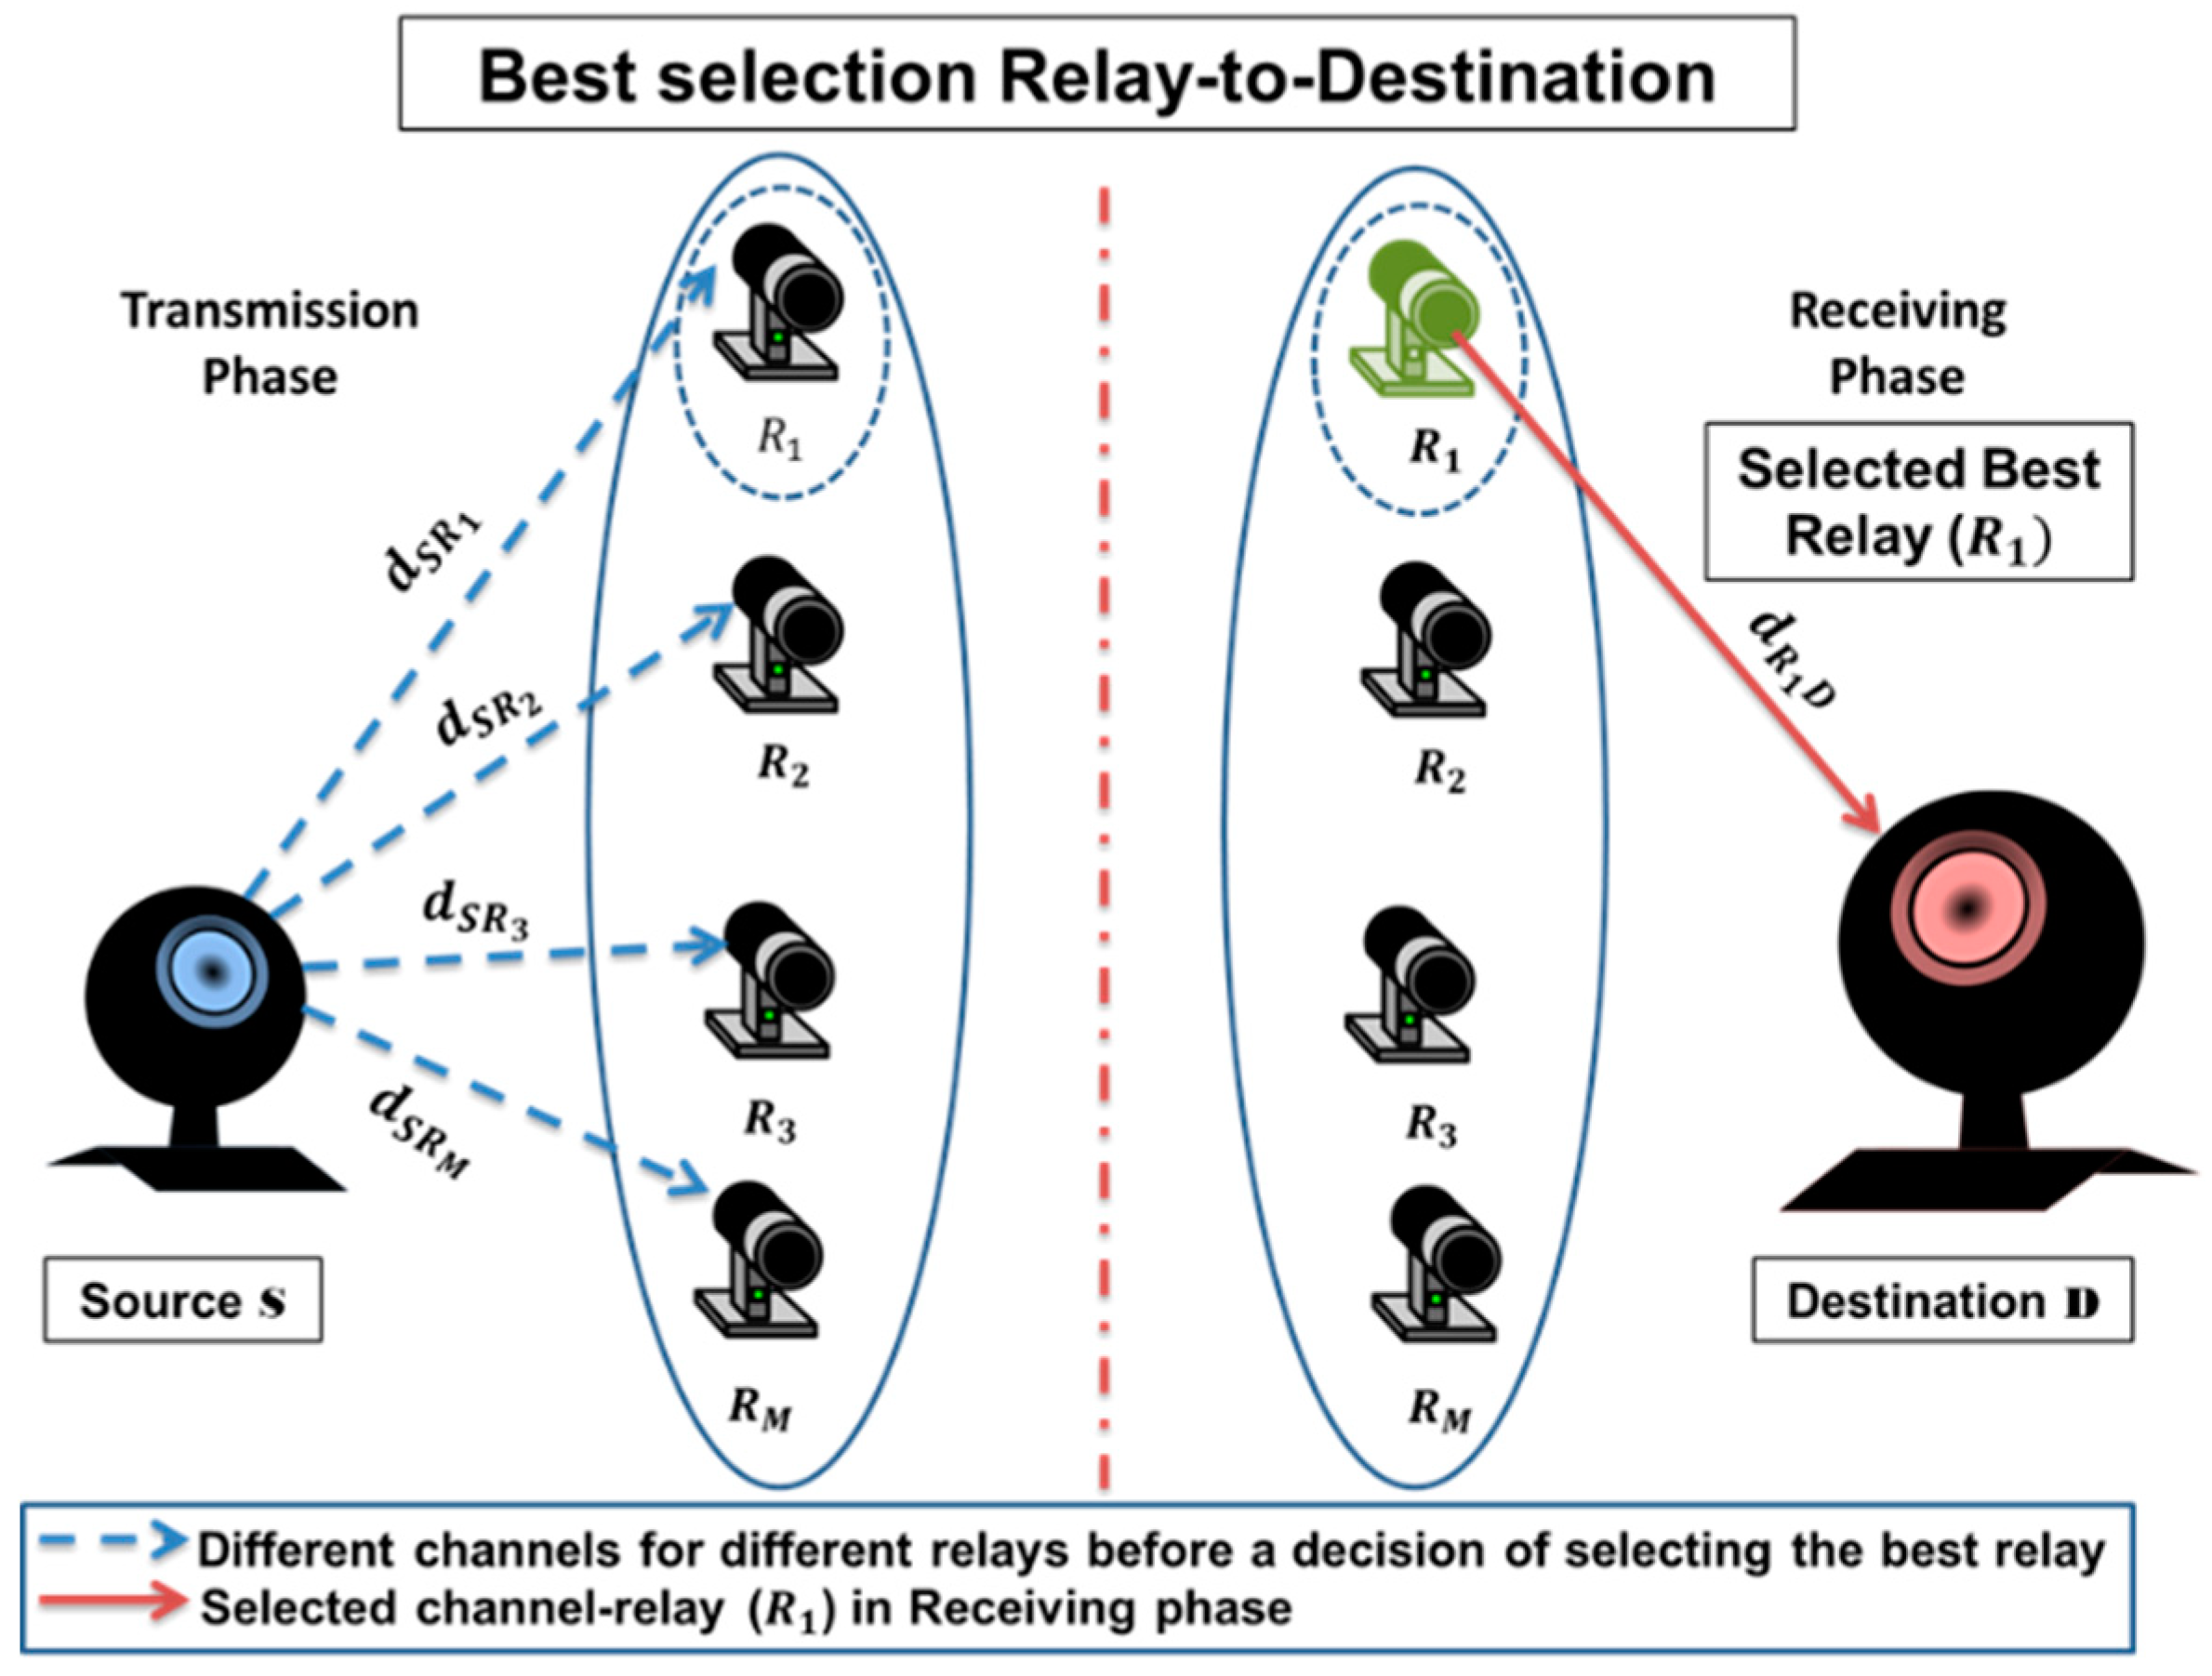
Figure 3.
Relay-destination scheme.
In the S-R-D scenario, there is a number of FSO M parallel relays in the communication system. We only choose one relay as the best selection to detect a transmitted data and forward the data to the destination, as depicted in Figure 1. The best relay selection is selected by [12]
where and are the channel fading coefficients between S and the M relay, , and between and D, respectively [11].
The nodes of relays are assumed to be located, where and denote the distances of S- and -D links, where i = 1, 2,..., M [11].
In our three schemes, we assume that all relays have full channel knowledge. In scheme (1), the user transmits data from the source directed towards the relays. Subsequently, one relay decodes-and-forward the signal and then retransmits it to the final destination. The best relay should have the highest end-to-end signal-to-noise ratio (SNR)
In the Source-Relay scheme, there is a number of FSO parallel relays, M, in the communication system. The best relay selection is determined in a left-hand side (transmission phase) when the data is transmitted from source to the best relay. Afterwards, this relay will complete the journey with retransmitting data to the final destination, as depicted in Figure 2. The best relay selection, is selected by
In the relay-destination scheme, there is a number of FSO parallel relays, M, in the communication system. The best relay selection is decided in a right-hand side (receiving phase). A pilot signal is transmitted from the source to all the relays at the same time. Subsequently, all of the relays beyond the destination choose which channel is the best to get the selected relay to pass the signal through this channel to the final destination, as depicted in Figure 3. The best relay that has the best channel coefficient is selected to complete the data to the receiver. The R-D is selected by
The normalized channel coefficient, , of the considered system can be formulated as [11]
where and are the channel fading coefficient due to atmospheric turbulence and the misalignment error, respectively.
The path loss, can be obtained by combining the weather attenuation with the geometric losses, as [11]
where d is the link distance for a hop, is the weather-dependent attenuation coefficient, and are the receiver and transmitter aperture diameters (in m), respectively, and is the optical beam divergence angle (in mrad).
The general model of misalignment fading is proposed in [13], as
where r is the radial displacement which is modelled by Rayleigh distribution. The equivalent beam width (in m), is defined as [13]
where is the beam waist.
Where,
Notice that is the fraction of the collected power at r = 0, where erf(·) is the error function [14].
The radial displacement, can be modelled as [13]
where is the jitter variance at the receiver.
2.1. Log-Normal (LN) Channels
The probability density function (PDF) of the LN channels is given by [13]
where erfc(·) denotes the error complementary function in [14] and denotes the normalized path loss coefficient, as given by
where is the path loss for the first-hop.
where is the refractive index structure parameter, k = (2π/λ) is the wave number, λ is the wavelength of the transmitter, and is the variance of an independent and identically distributed Gaussian random variables.
is the ratio between the equivalent beam width at the receiver and the pointing error displacement standard deviation at the receiver, as in [14].
The channel fading coefficient, is given by
being an independent and identically distributed (i.i.d.) Gaussian random variable (RV) with a mean and a variance . To ensure that the fading channel does not attenuate or amplify the average power, the fading coefficients are normalized [15].
2.2. Gamma-Gamma (G-G) Channels
The PDF of G-G channels, is given by [16]
where [.] is the Meijers G-function in [14], Γ(.) is the Gamma function, and and are the effective number of large-scale and small-scale eddies of scattering environment, respectively. Their values for plane wave are given by [11,17]:
Hence, a plane wave propagation is assumed and the Rytov variance, , as a function of distance is as in [11,17].
3. The Average Bit Error Rate (ABER) Analysis
3.1. LN Channels
The ABER at the receiving node over LN channels can be derived as [11]
where S is the order of the approximation, is the average SNR of transmitter, , and are the weights and the roots of the generalized La guerre polynomial, respectively [11].
The cumulative distribution function (CDF) of the lognormal channel, while taking into consideration the pointing error effect, is substituted by signal to noise ratio threshold, where, with a signal to noise ratio above this threshold, no outage will happen and the signal can be decoded with an arbitrarily low error probability, is derived in [11], as
An approximated ABER expression of the best relay selection for LN channels can be calculated by substituting the CDF for S-R-D scheme, as given in [11]
In the case of S-R scheme, multiple links exist and only one link is chosen according to the channel coefficient, so a diversity of order N will exist only on the first hop. According to this reason, an approximated ABER for S-R scheme is investigated as
While for the case of R-D scheme, in the second hop multiple links exist and only one link is chosen according to the channel coefficient. According to this reason, an approximated ABER for the R-D scheme is investigated as
3.2. G-G Channels
The CDF of the G-G channel taking into consideration the pointing error effect is substituted by signal to noise ratio threshold and is derived in [18] as
where is the power margin.
The ABER over G-G channels at the receiving node can be derived by the same method that is derived in [11]
Substitute Equation (26) in Equation (27), the ABER over the G-G channels while considering the pointing error effect at the receiving node is derived as
The ABER over G-G channels for the S-R-D, S-R, and R-D schemes can be derived by directly substituting Equation (26) in Equations (23), (24) and (25), respectively.
4. Simulation Results
A target of 10−6 for the ABER is assumed and the FSO link distance is 1 km with different first-hop and second-hop link distances. Derived analytical results that were corroborated via Monte Carlo simulation are performed with 107 bits transmitted for each depicted SNR and the Gauss-Laguerre quadrature approximation order is . Table 1 shows the system parameters under investigation that are used in various FSO communication systems [13,19,20]. Using Table 2, the atmospheric turbulence conditions are calculated through Equations (13), (18), (19) and (20). Table 2 illustrates , a1, b1, and turbulence parameters for the first-hop and , a2, b2, and turbulence parameters for the second-hop [11].

Table 1.
SYSTEM Parameters.
Table 2.
ATMOSPHERIC CONDITIONS.
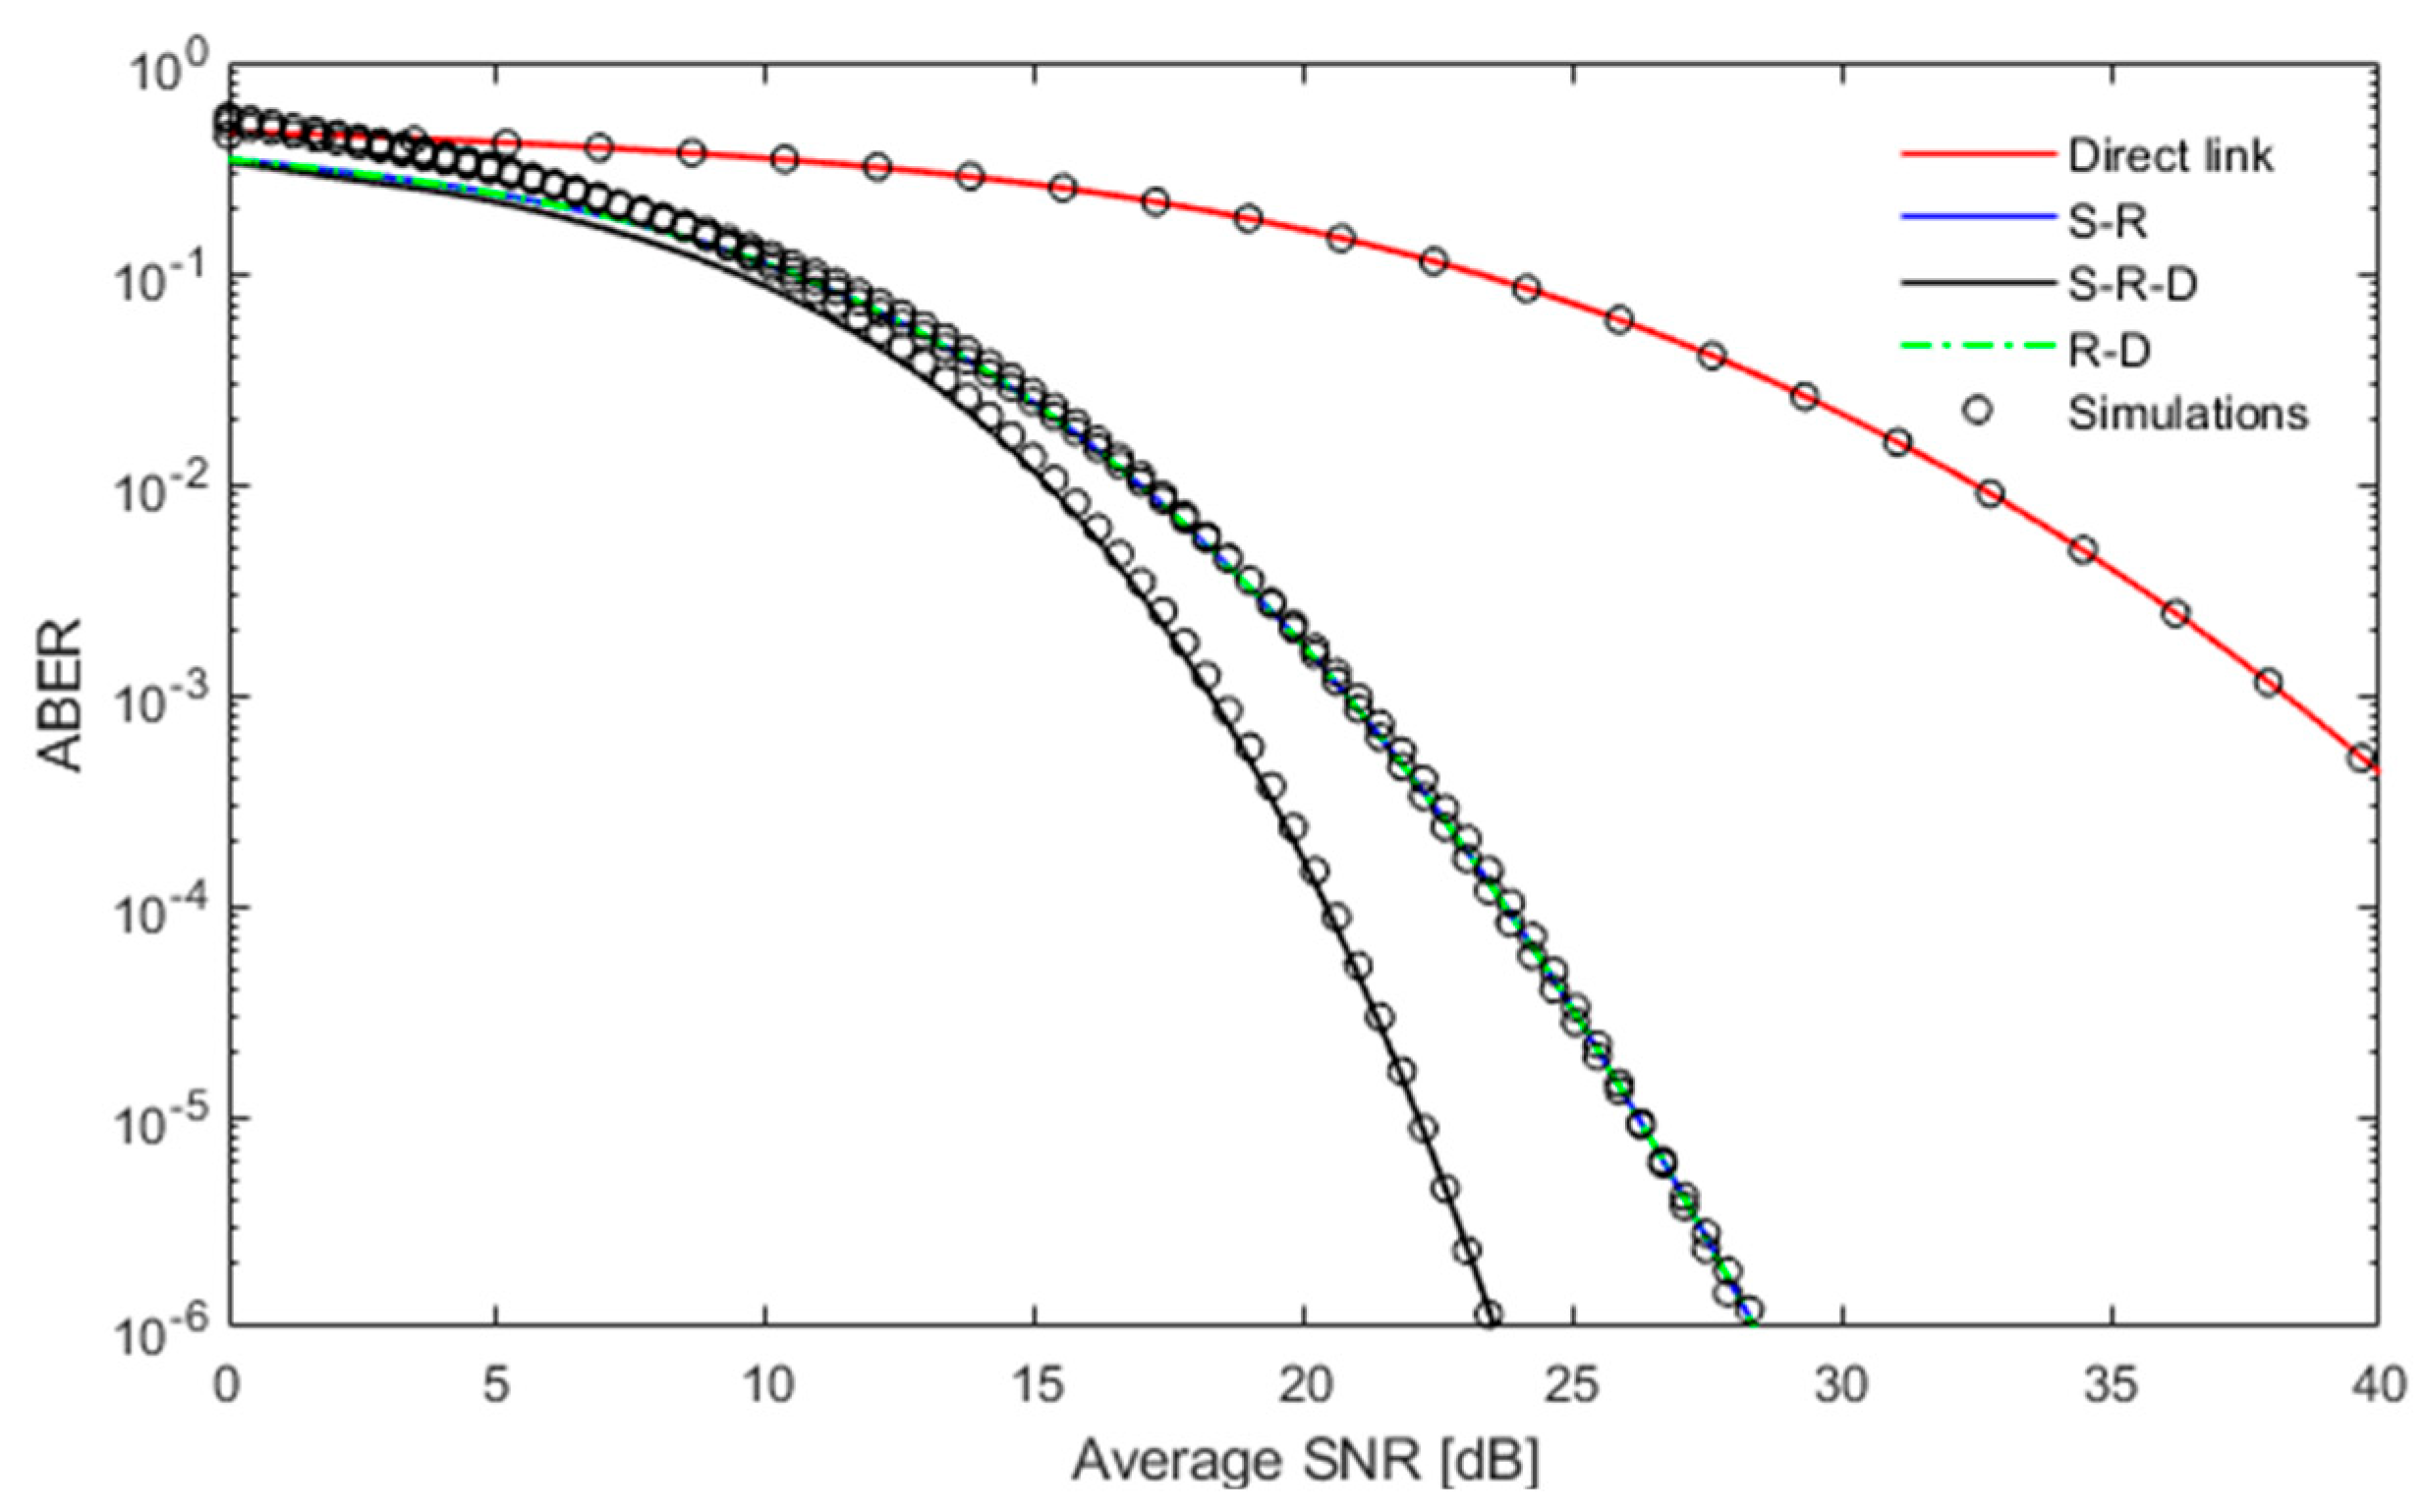
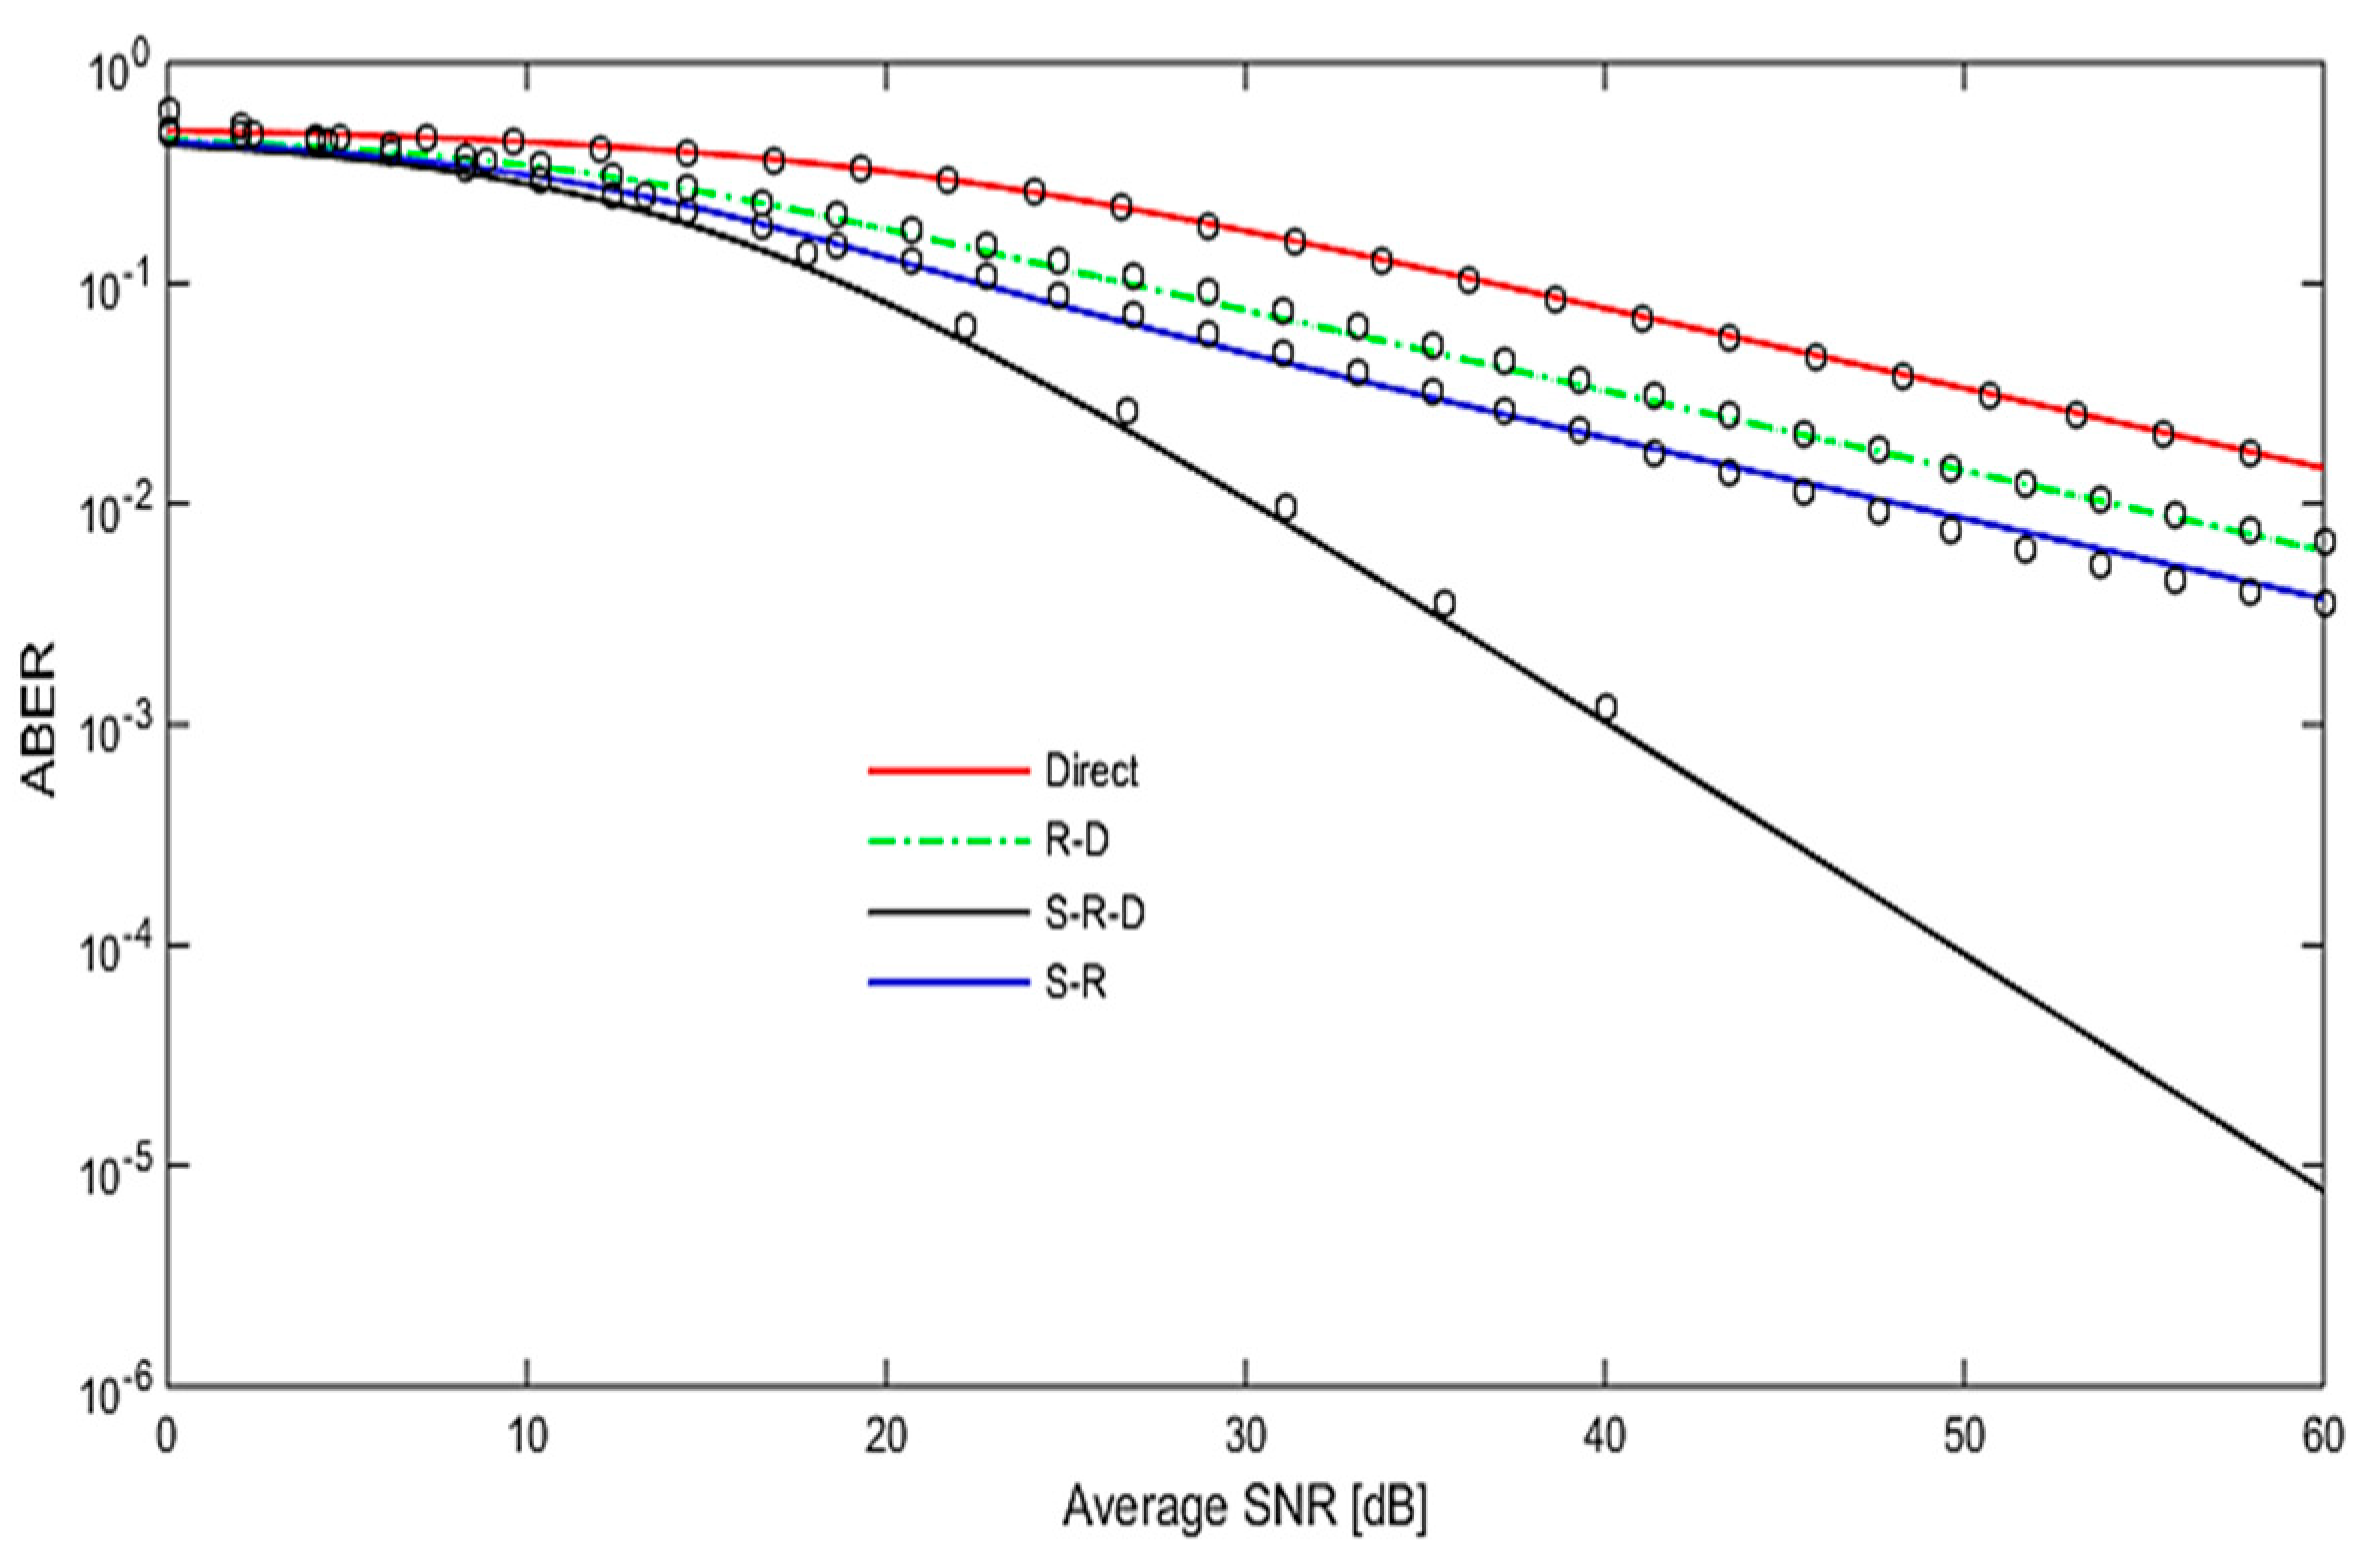
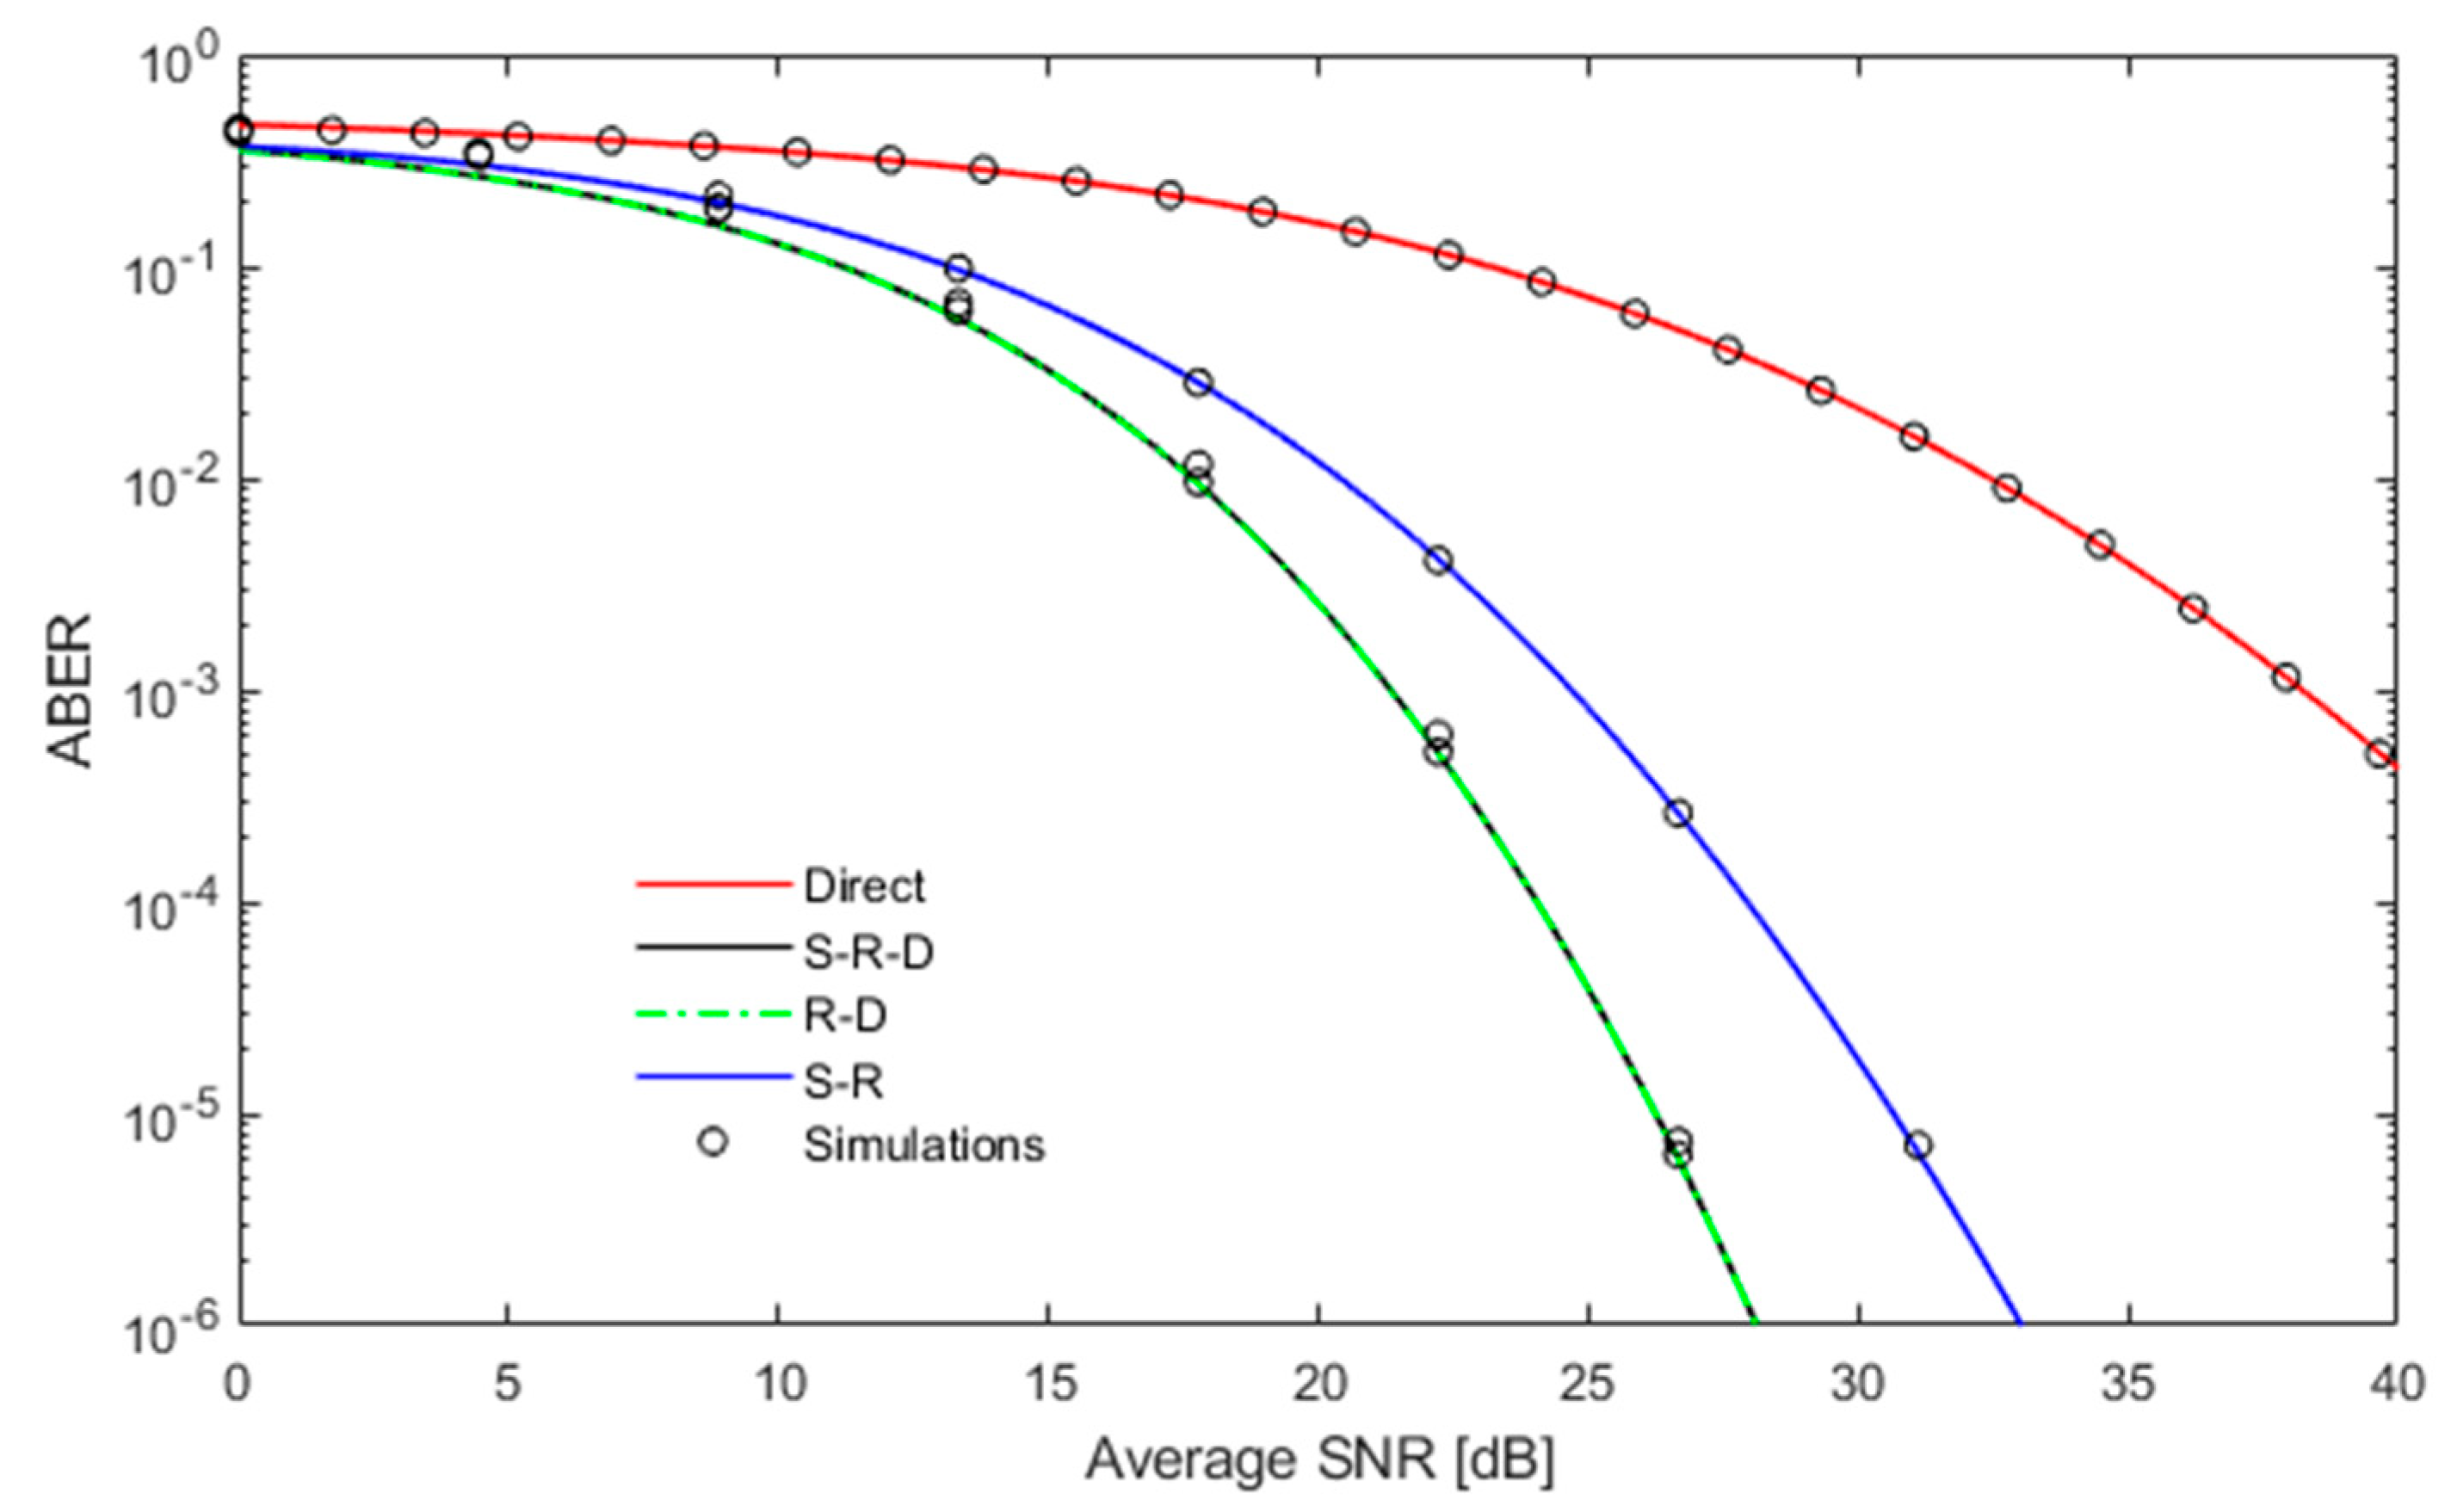
The simulation and analytical results that are shown in four when considering a relation between ABER and SNR over L-N channel for a weak turbulence with distance 400–600 m, the number of relays is 3 and the beam waist is 2 m. The following schemes R-D, S-R, and S-R-D are compared with the performance of the direct-link (DL) transmission. The results show the accuracy of the derived approximated ABER. It is worth noting that, for all three cases enhancing the ABER, performance needs to increase the transmitted power. By comparing the three scenarios in terms of power consumption, it shows that, to achieve an ABER of 10−6 bit/s, the R-D case gives the best performance for weak turbulence regime. It shows that the R-D scheme has a higher SNR gain than the S-R-D, S-R, and DL schemes by 0.4 dB, 3.6 dB, and 14.8 dB, respectively. While comparing the two other techniques, it is noticed that the direct link needs higher transmitted power than S-R and S-R-D by 11.2 dB, 14.4 dB, respectively.
It is clear that increasing the turbulence effect requires more SNR to achieve the same ABER. Whether it is weak, as in Figure 4, or moderate turbulence, as in Figure 5, the R-D proved to be better than S-R-D and S-R. Moreover, the R-D scheme has higher SNR gain than the S-R-D and S-R schemes by 0.4 dB and 8.9 dB, respectively. This SNR gain is due to the selection of the best relay depending on the long distance, R-D, which has the dominant effect.
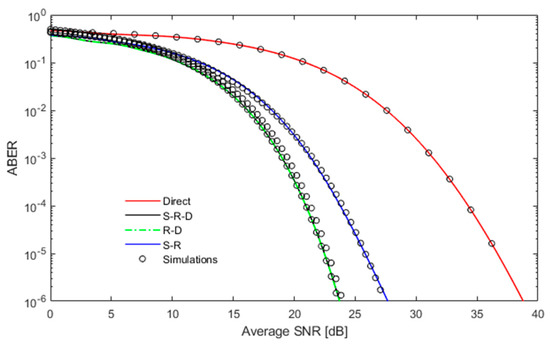
Figure 4.
Average bit error rate (ABER) vs. SNR of Free Space Optics (FSO) over L-N channel for weak turbulence with distance 400–600 m, and the number of relays = 3, and wz = 2 m.
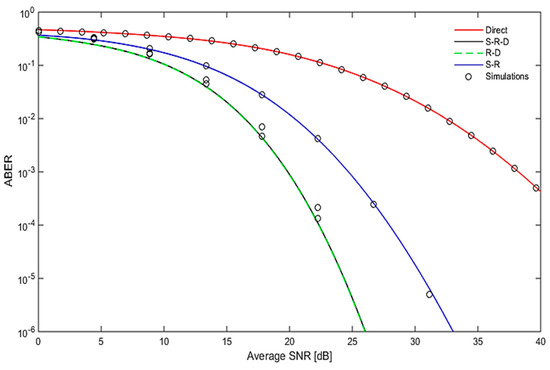
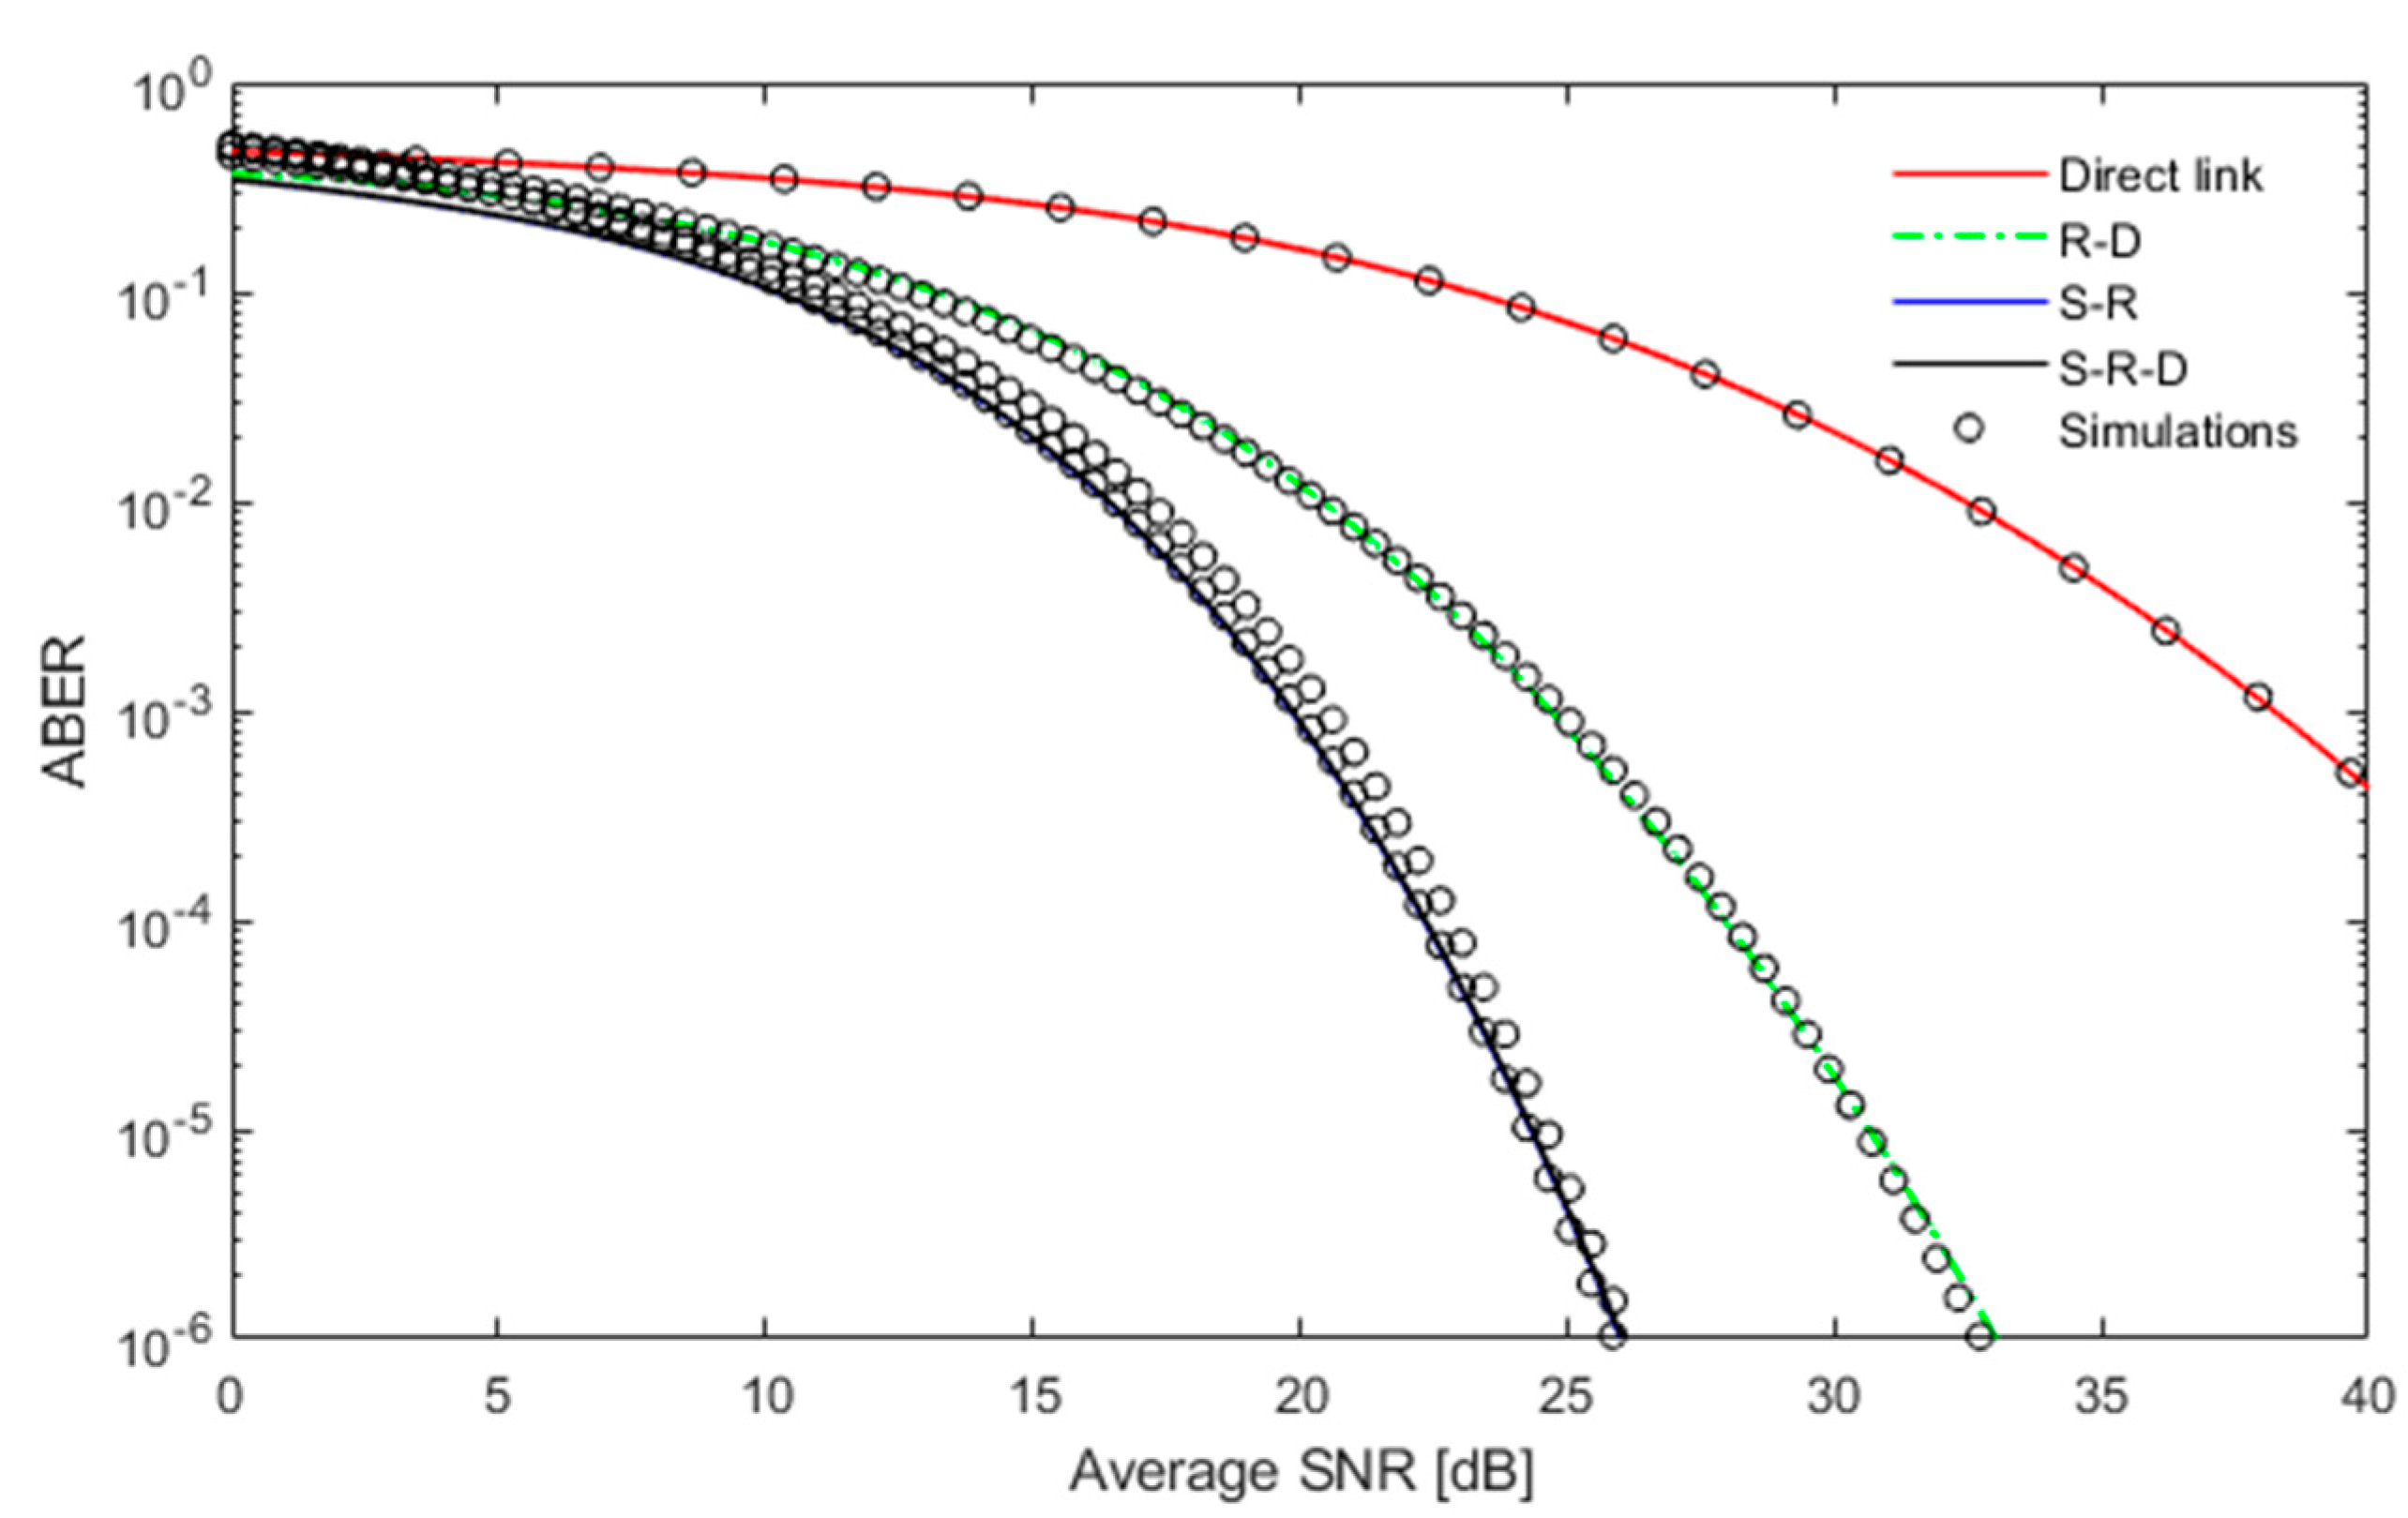
Figure 5.
ABER vs. SNR of FSO over L-N channel for moderate turbulence with distance 400–600 m, the number of relays = 3, and wz = 2 m.
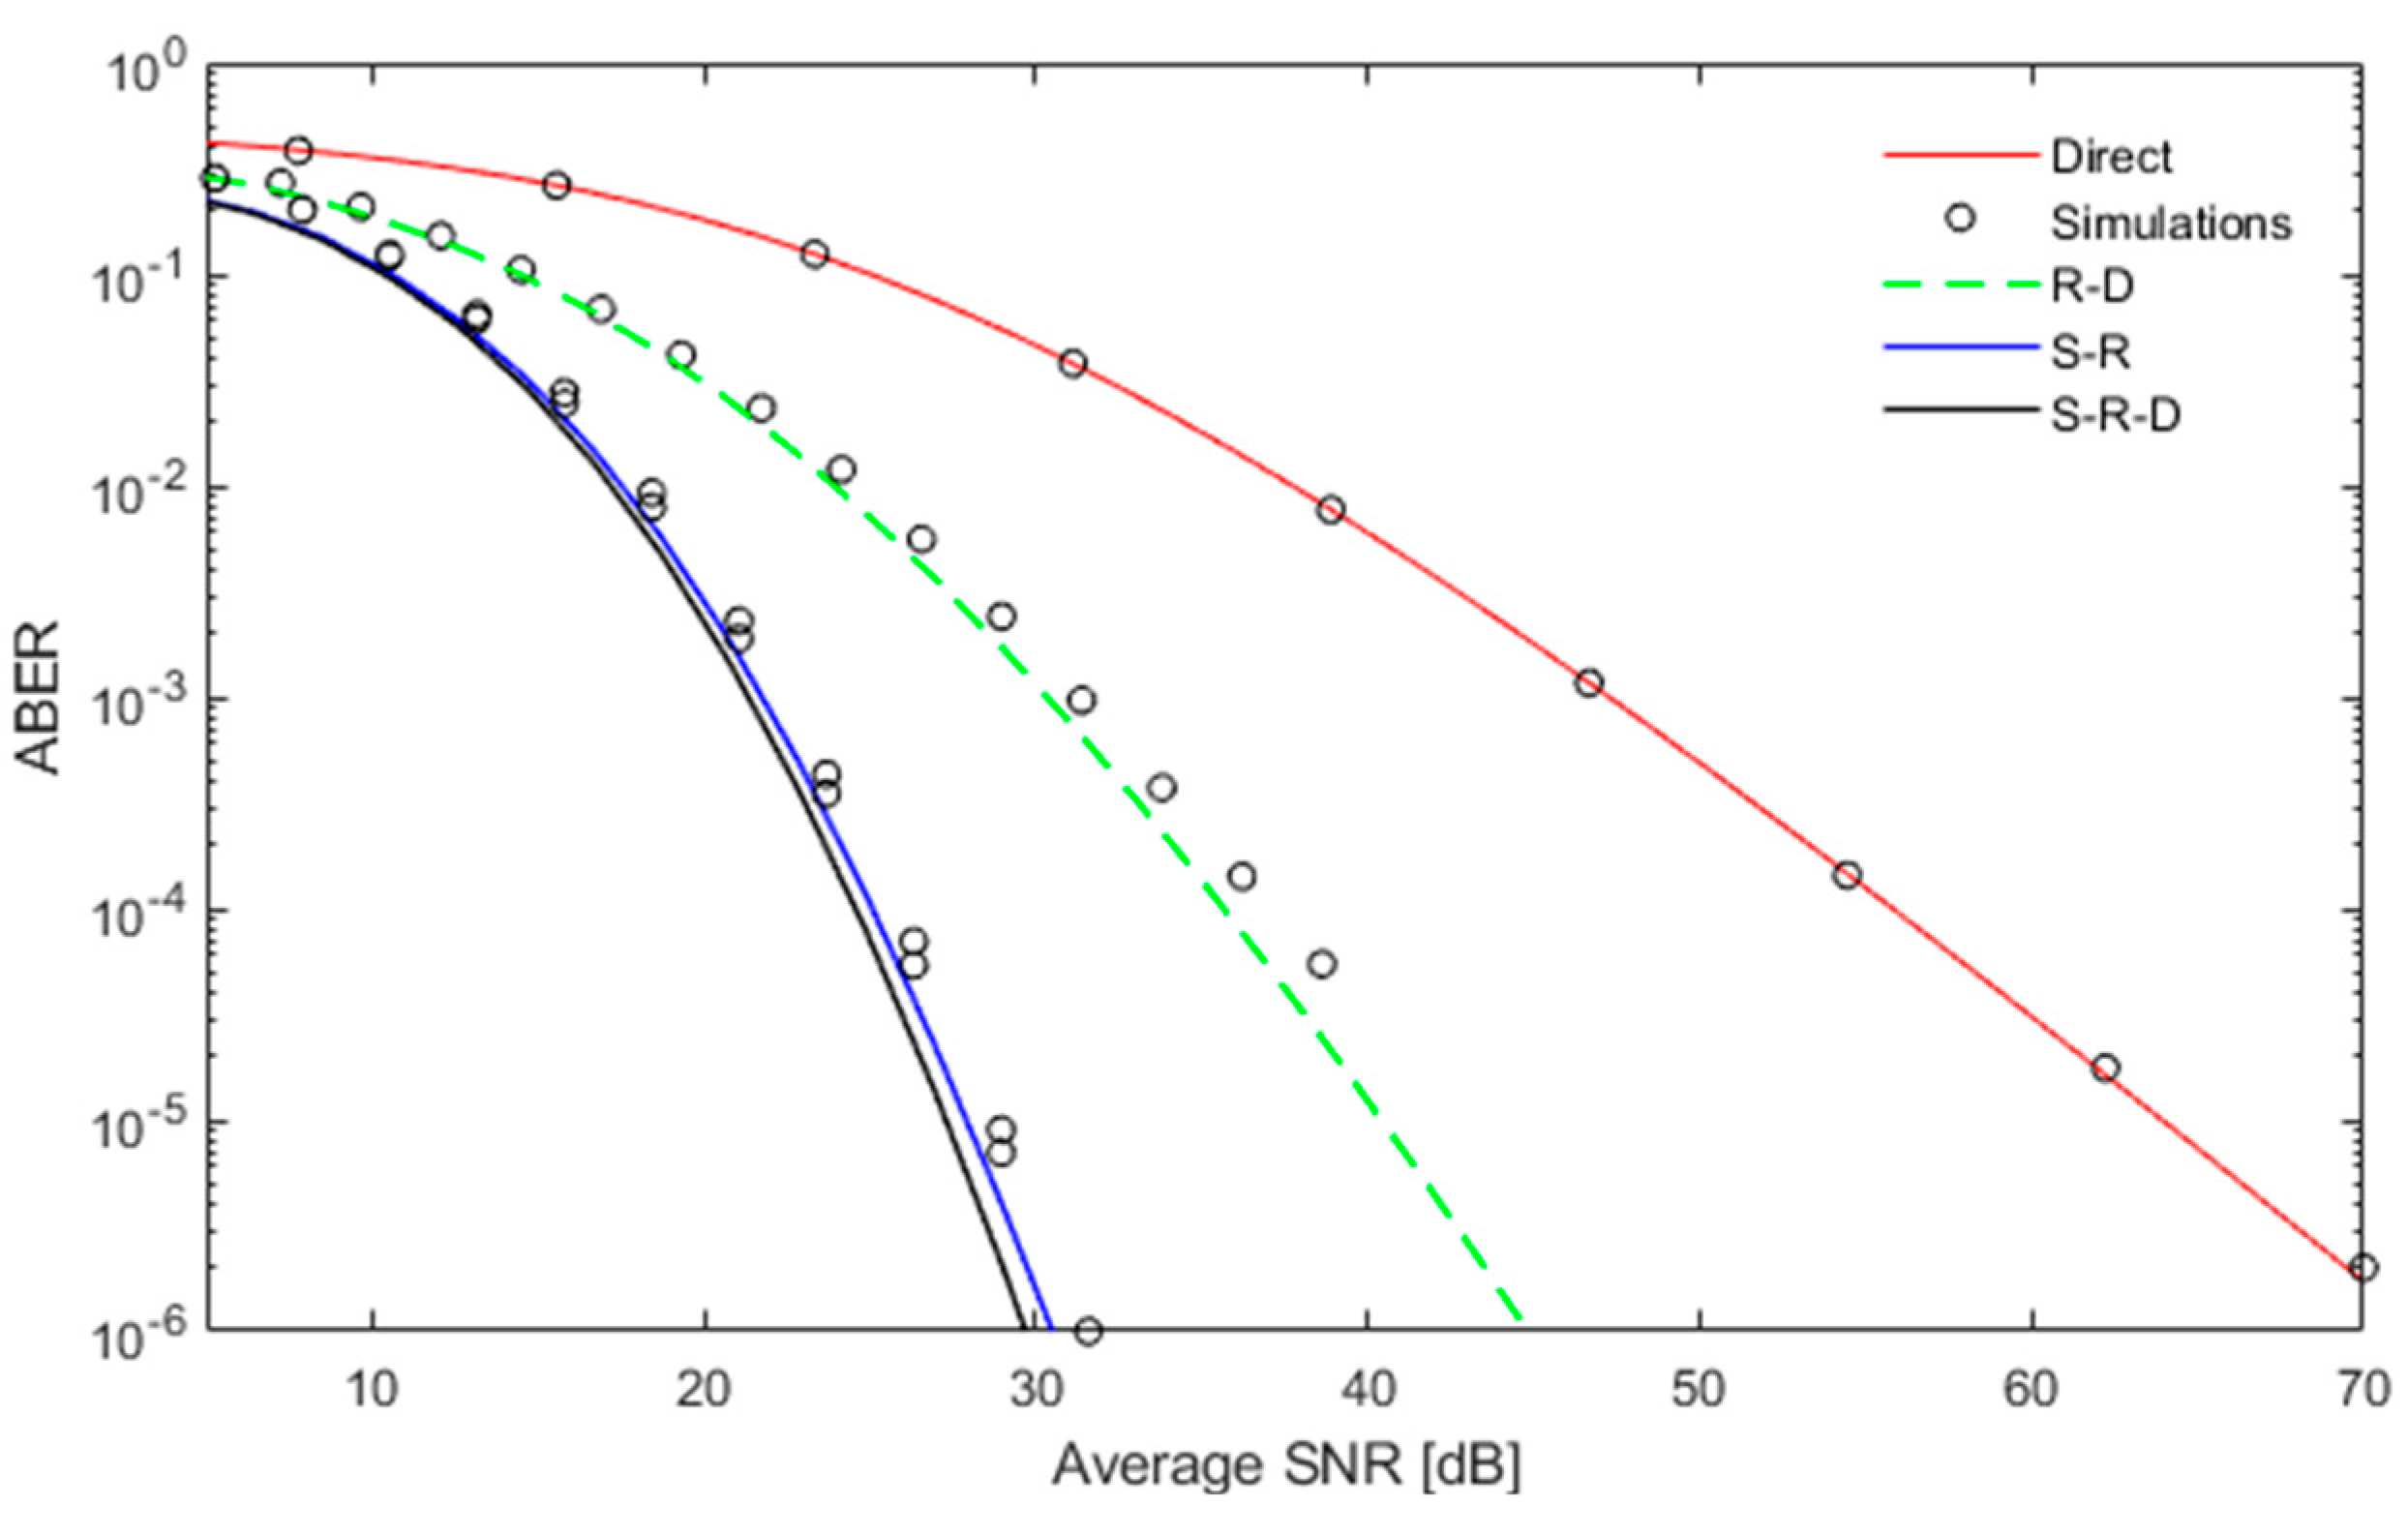
Using three relays and with link type 500–500 m, the ABER versus SNR for moderate turbulence is plotted in Figure 6. It is clear that S-R-D scheme has higher SNR gain than S-R and R-D schemes by 4.5 dB and 4.9 dB, respectively. This SNR gain is due to the selection of the best relay that happens depending on the long distance, S-R-D, which has the dominant effect.
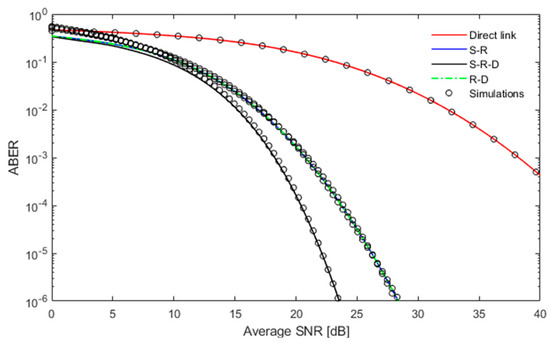
Figure 6.
ABER vs. SNR of FSO over L-N channel for moderate turbulence with distance 500–500 m, the number of relays = 3, and wz = 2 m.
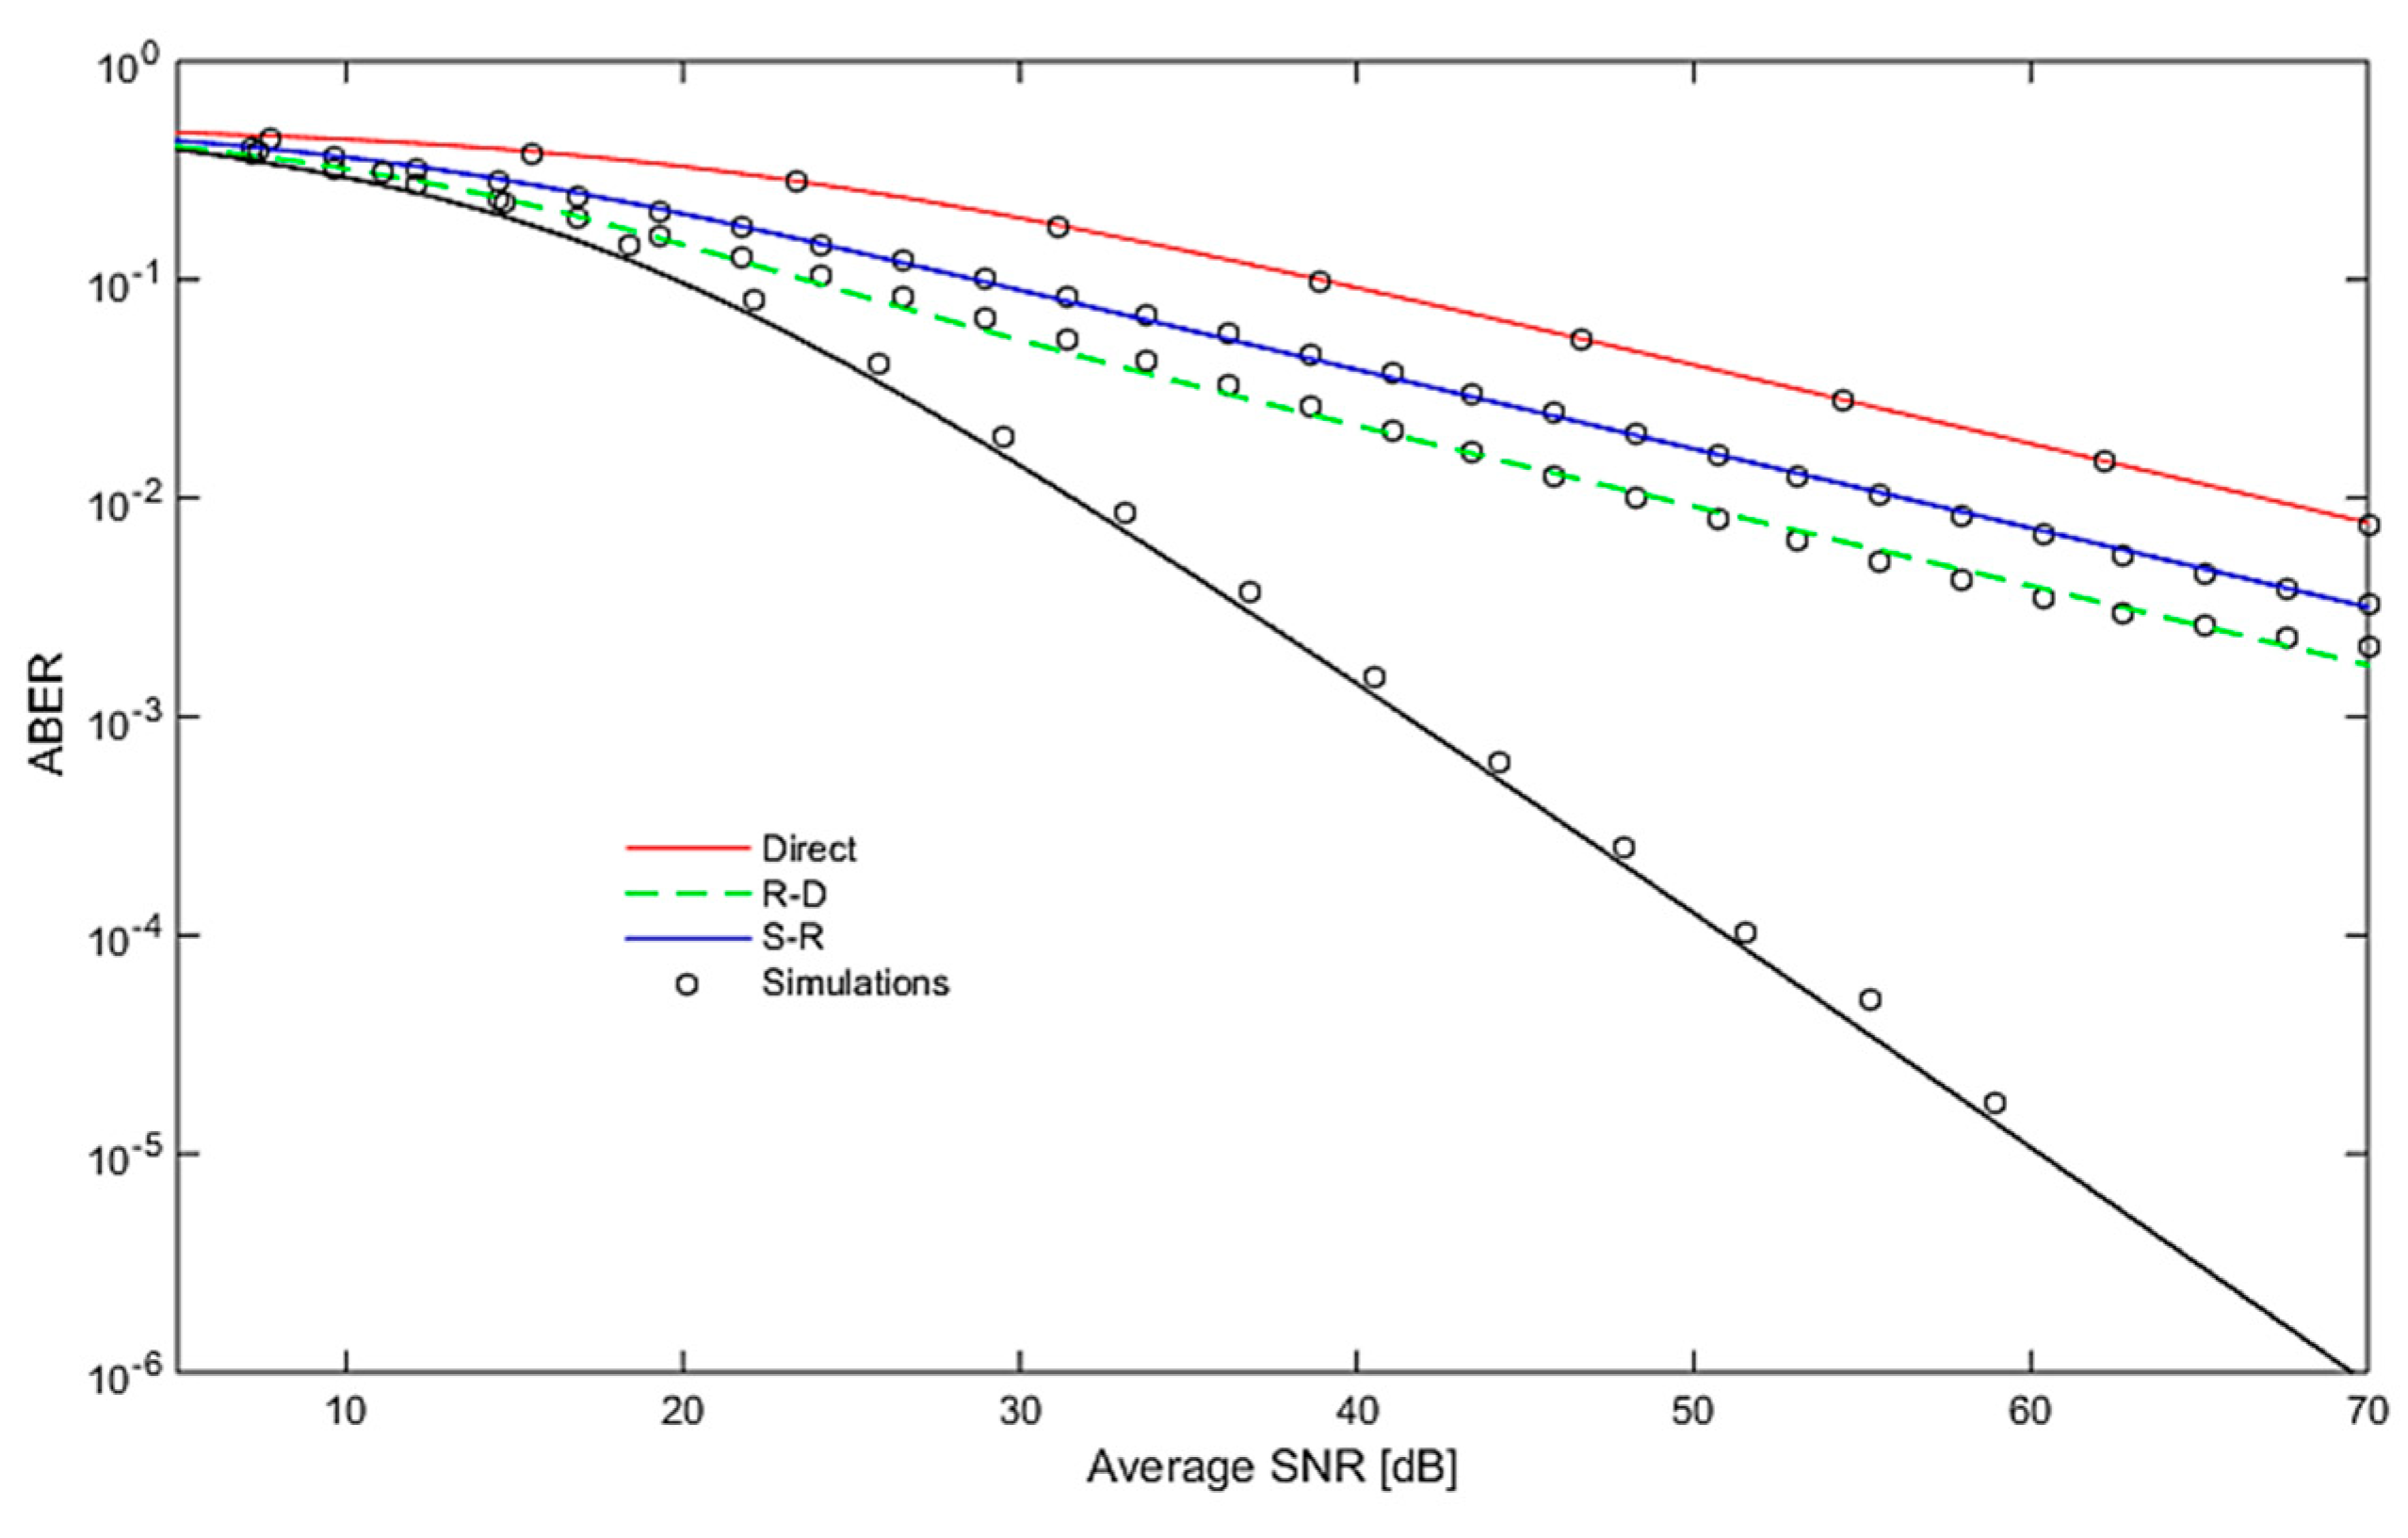
The first hop is affected by turbulence more than the second hop as the turbulence increases with the propagation distance assuming that all other parameters are fixed in the 600 m–400 m scheme, as depicted in Figure 7. The S-R scheme, which activates a relay per time slot according to the first hop channel effects, is the best scheme when compared with the other schemes, as it works to improve the first hop SNR gain, which has the dominant effect on the overall system. The obtained results show that the S-R scheme has higher SNR gain than the S-R-D and R-D schemes by 0.5 dB and 6.9 dB, respectively. This SNR gain is due to the selection of the best relay depending on the long distance, S-R, which has the dominant effect.

Figure 7.
ABER vs. SNR of FSO over L-N channel for moderate turbulence with distance 600–400 m, the number of relays = 3, and wz = 2 m.
Figure 8, Figure 9 and Figure 10 show the great effect of the pointing error on the link compared to the weak pointing error effect on Figure 5, Figure 6 and Figure 7. The S-R-D scheme is the best choice in case of high pointing error effect. It has higher SNR gain than R-D and S-R schemes for different hops distance. The utilization is as follows. If we have high pointing error as a result of vibration of building or wind, we use S-R-D, especially if we don’t have an automatic pointing control. This SNR gain is because the pointing error in this condition is higher than the effect of turbulence and the pointing error is not a function of distance. So, it has the same effect on the two hops.
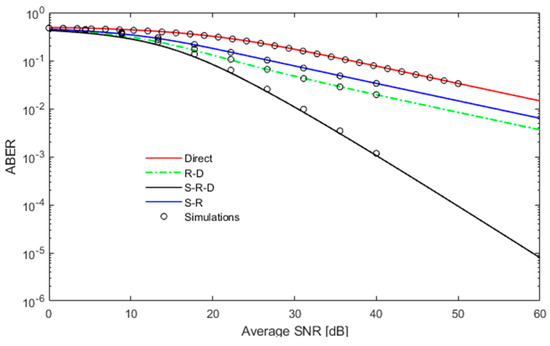
Figure 8.
ABER vs. SNR of FSO over L-N channel for moderate turbulence with distance 400–600 m, the number of relays = 3, and wz = 0.5 m.
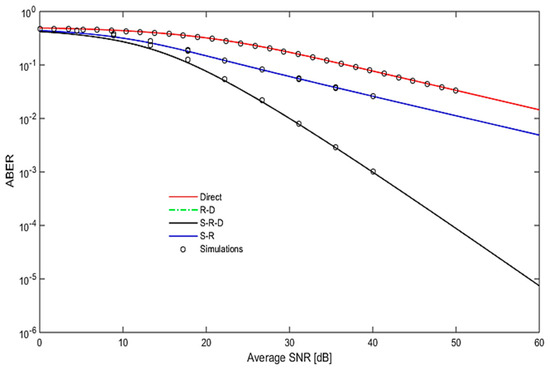
Figure 9.
ABER vs. SNR of FSO over the L-N channel for moderate turbulence with distance 500–500 m, the number of relays = 3, and wz = 0.5 m.
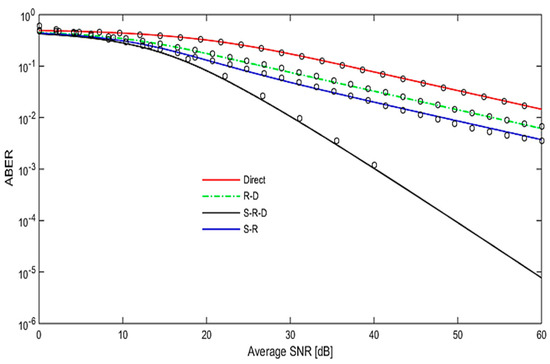
Figure 10.
ABER vs. SNR of FSO over L-N channel for moderate turbulence with distance 600–400 m, the number of relays = 3, and wz = 0.5 m.
Figure 8 shows that the S-R-D scheme has higher SNR gain than the R-D and S-R schemes by 2.8 dB and 6.9 dB, respectively, due to the high mitigation of pointing error effect by the S-R-D scheme. In Figure 9, it is noted that the S-R-D scheme has higher SNR gain than the R-D and S-R schemes by 5.7 dB and 5.7 dB, respectively, because the relay is in the middle of the total distance between the source and destination.
Figure 10 shows that the S-R-D scheme has higher SNR gain than the S-R and R-D schemes by 3.2 dB and 6.9 dB, respectively, over a strong turbulent channel.
Figure 11, Figure 12 and Figure 13 study the effect of strong turbulence with weak and strong pointing error.
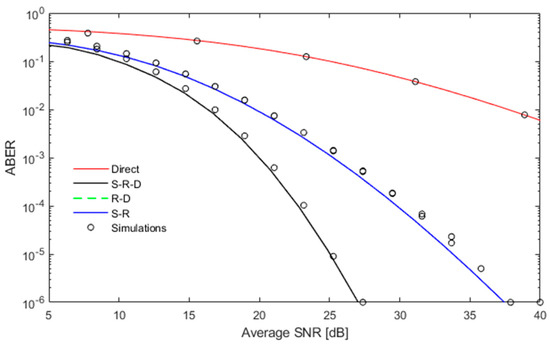
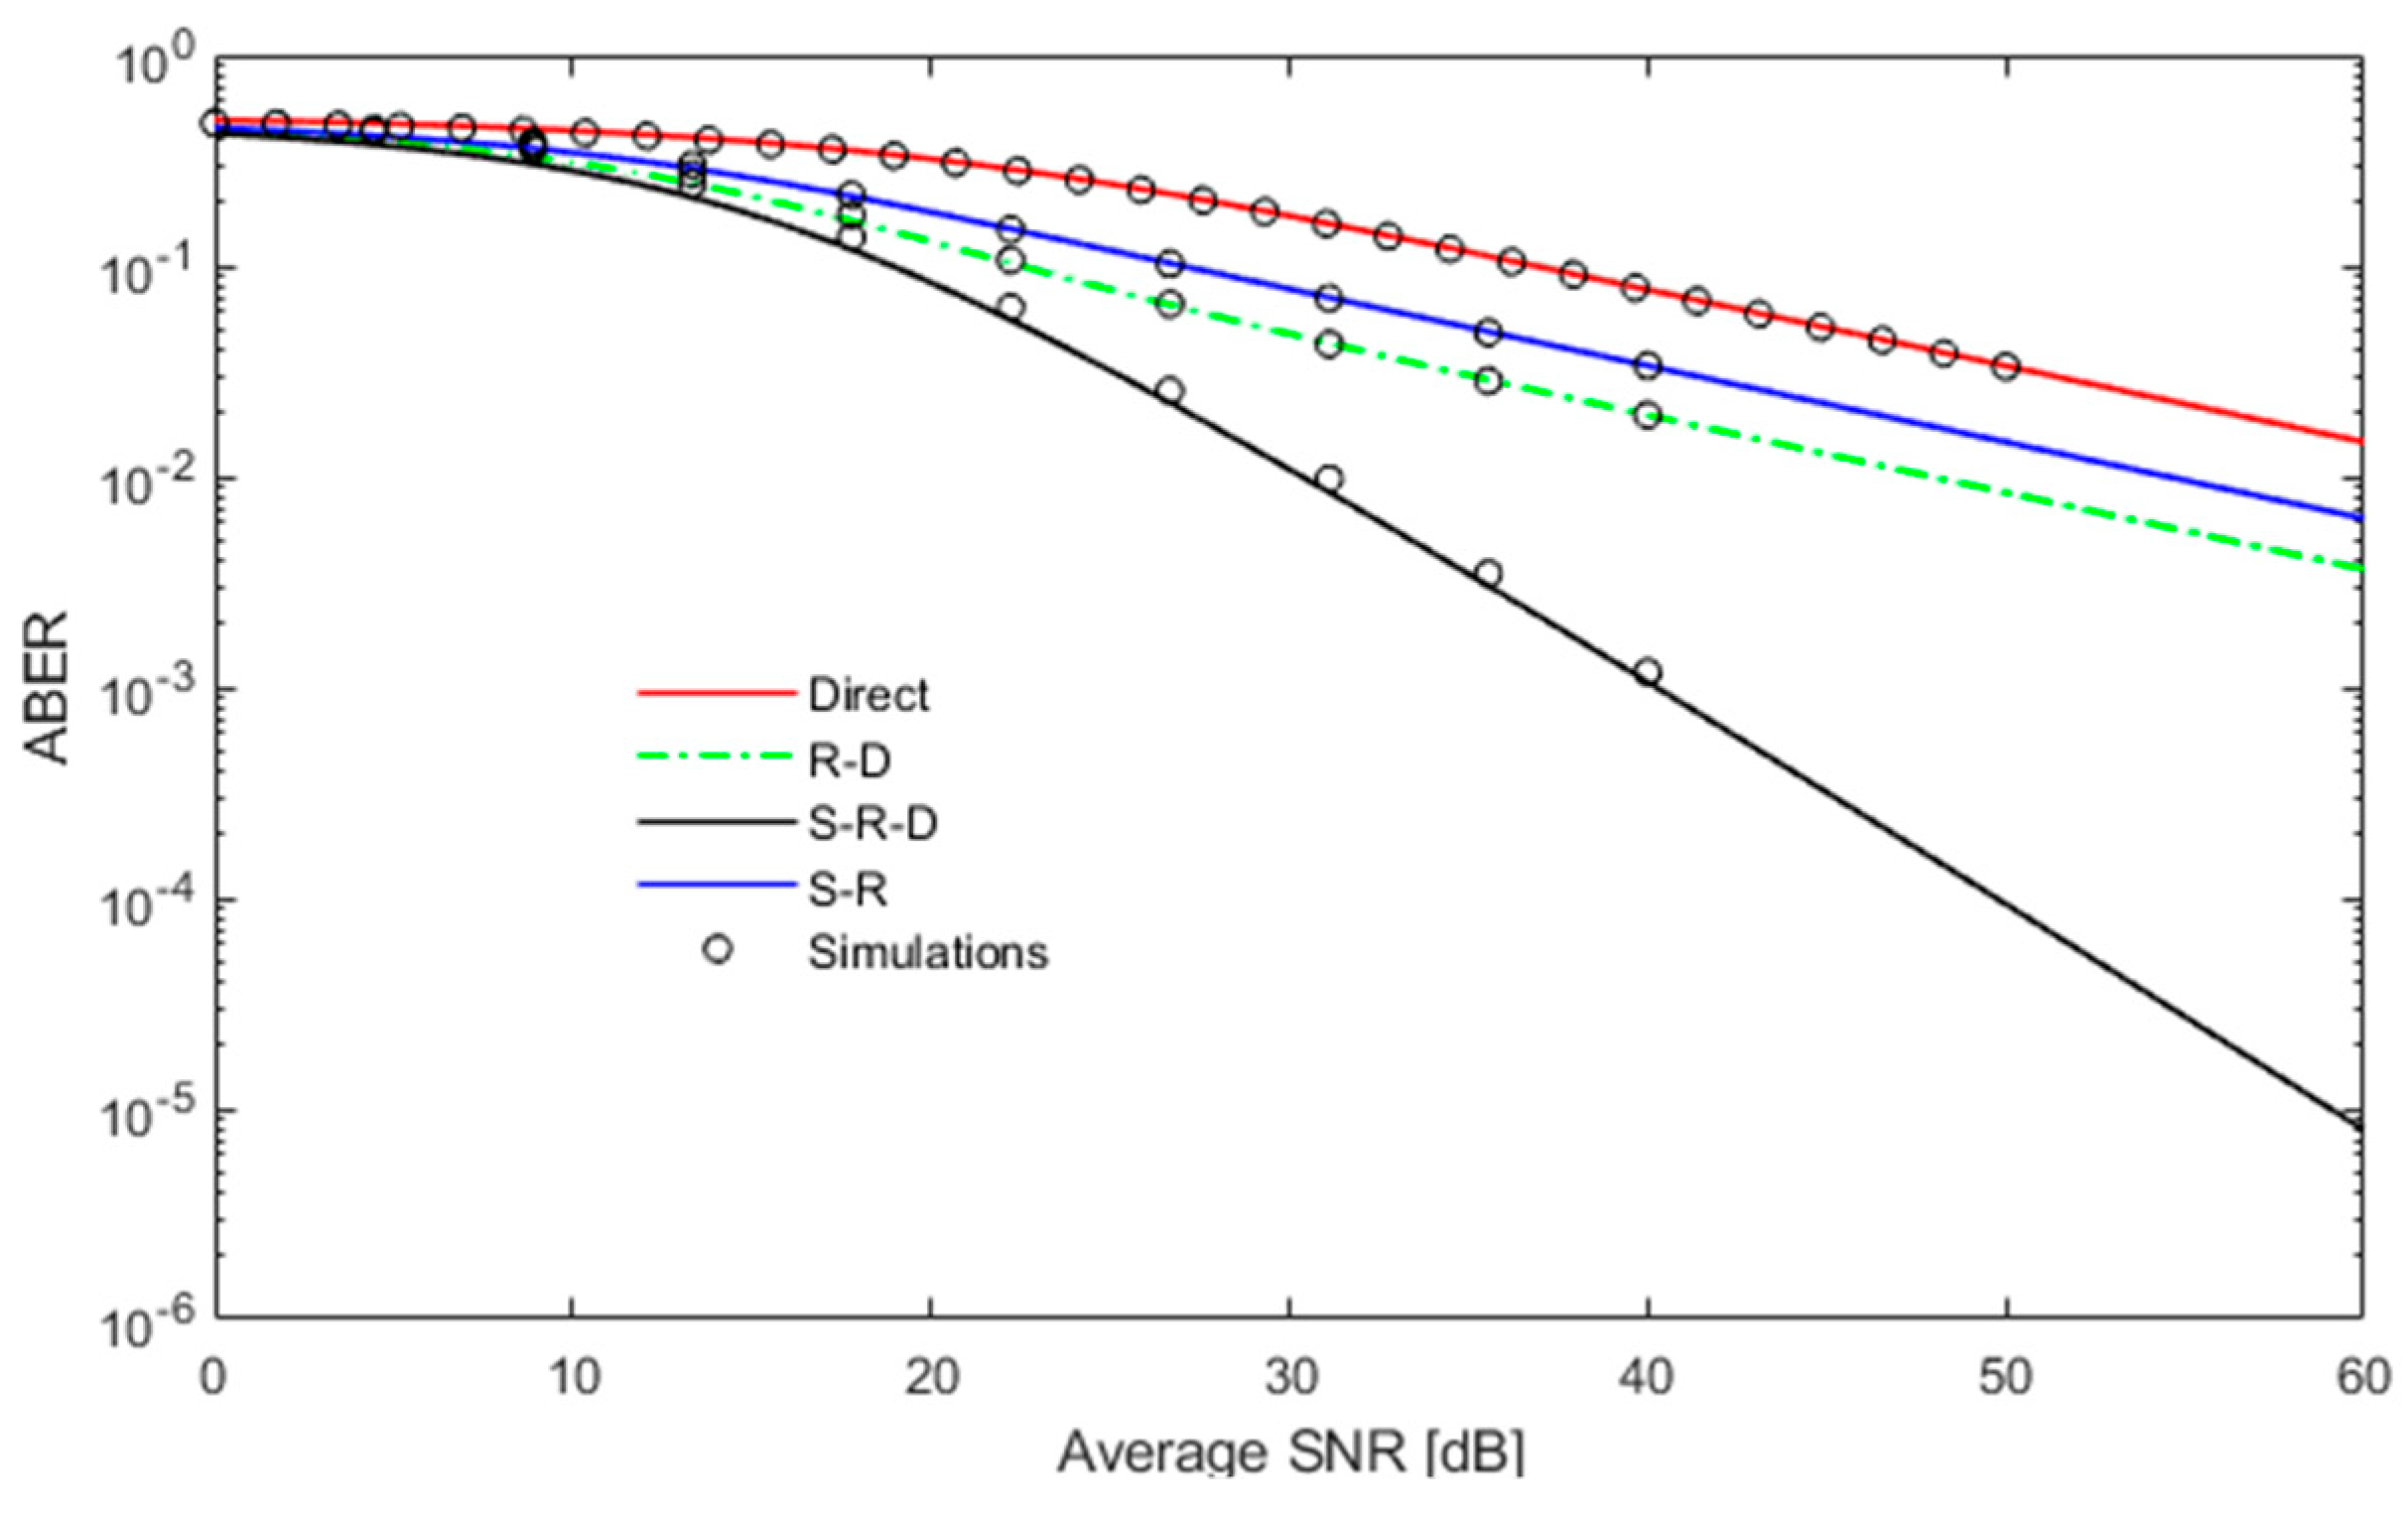
Figure 11.
ABER vs. SNR of FSO over G-G channel for strong turbulence with distance 500–500 m, the number of relays =3, and wz = 2 m.
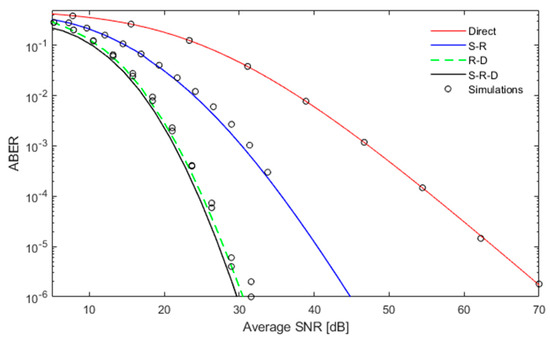
Figure 12.
ABER vs. SNR of FSO over the Gamma-Gamma (G-G) channel for strong turbulence with distance 400–600 m, the number of relays = 3 and wz = 2 m.
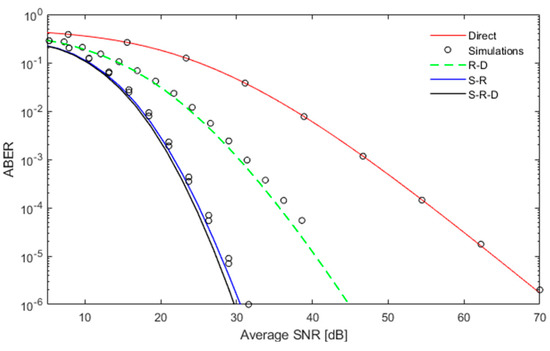
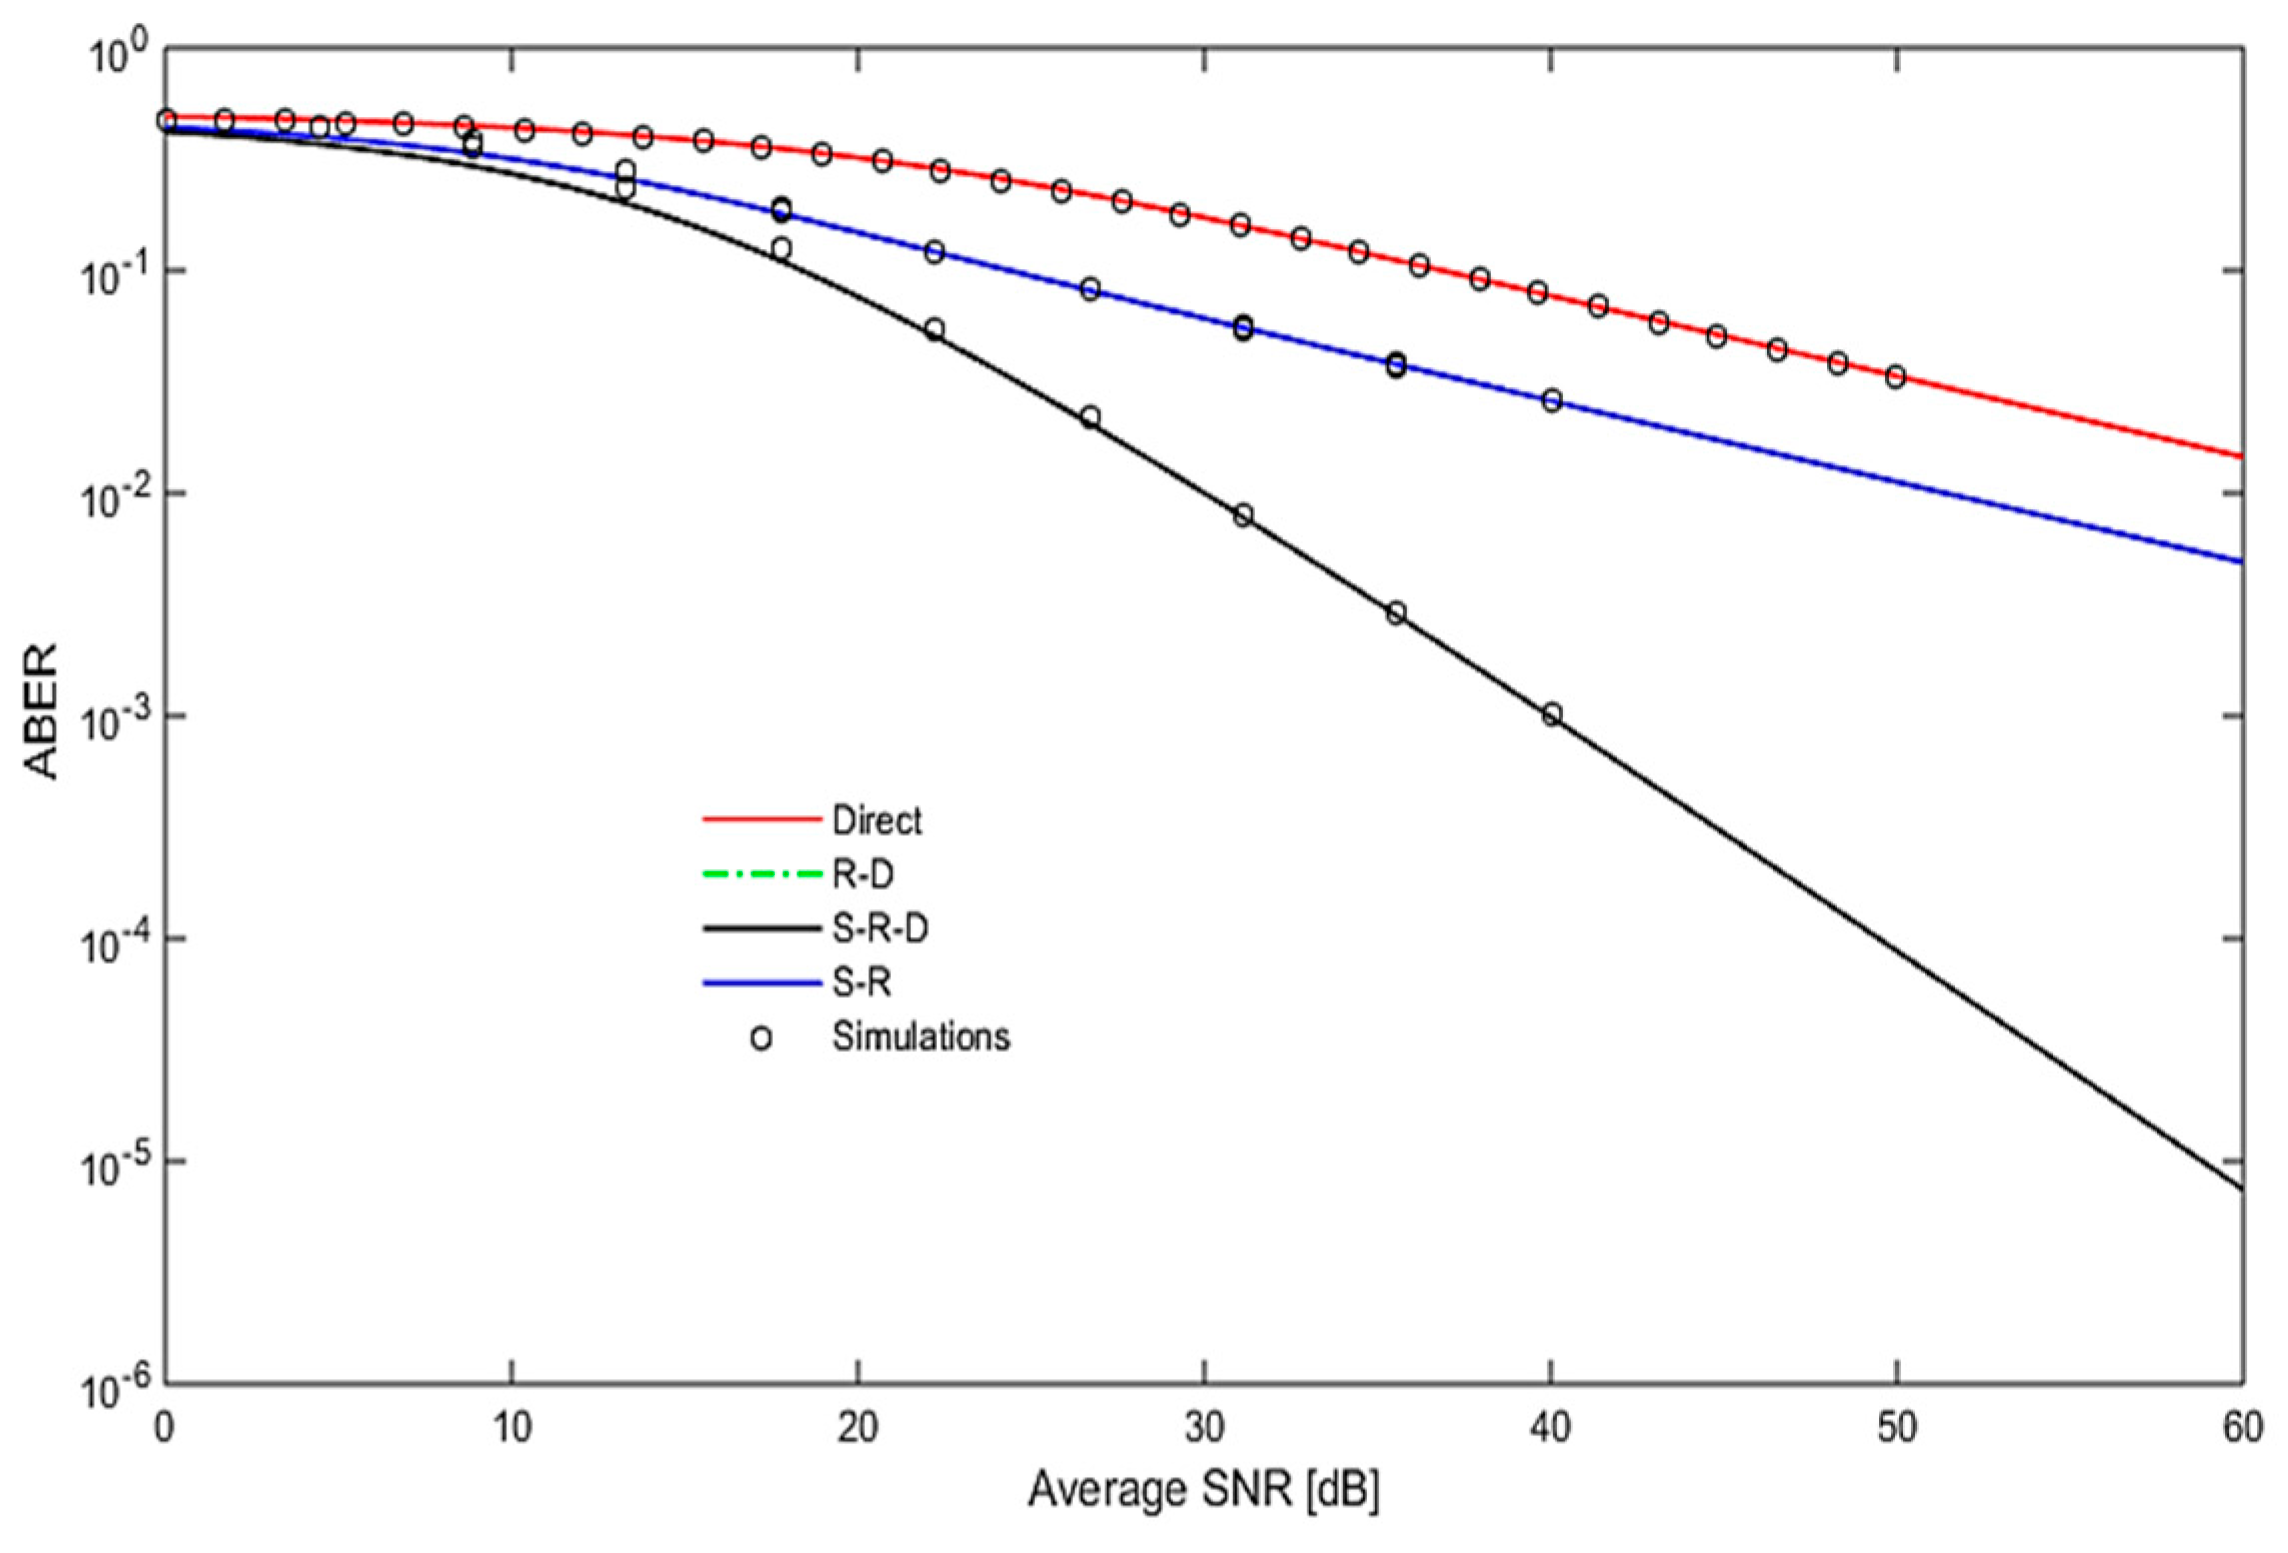
Figure 13.
ABER vs. SNR of FSO over the G-G channel for strong turbulence with distance 600–400 m, the number of relays = 3 and wz = 2 m.
When comparing Figure 6, considering moderate turbulence, with Figure 11, and accounting for strong turbulence, the obtained results show that S-R-D needs only more 3 dB to achieve the same ABER while R-D and S-R need 10 dB to achieve the same ABER. Moreover, Figure 11 shows that the S-R-D scheme has higher SNR gain than the R-D and S-R schemes by 11.3 dB. This is due to the high mitigation of the strong turbulence effect by the S-R-D scheme.
Figure 12 shows that both the S-R-D and R-D schemes have the same SNR gain and are higher and better than the S-R scheme by 15.56 dB. This SNR gain is due to the selection of the best relay depending on the long distance, S-R-D and R-D, which have the same dominant effect.
Like Figure 12, Figure 13 shows that both the S-R-D and S-R schemes have the same SNR gain and they are higher and better than R-D scheme by 13.44 dB. This SNR gain is due to the selection of the best relay depending on the long distance, S-R-D and S-R, which have the same dominant effect.
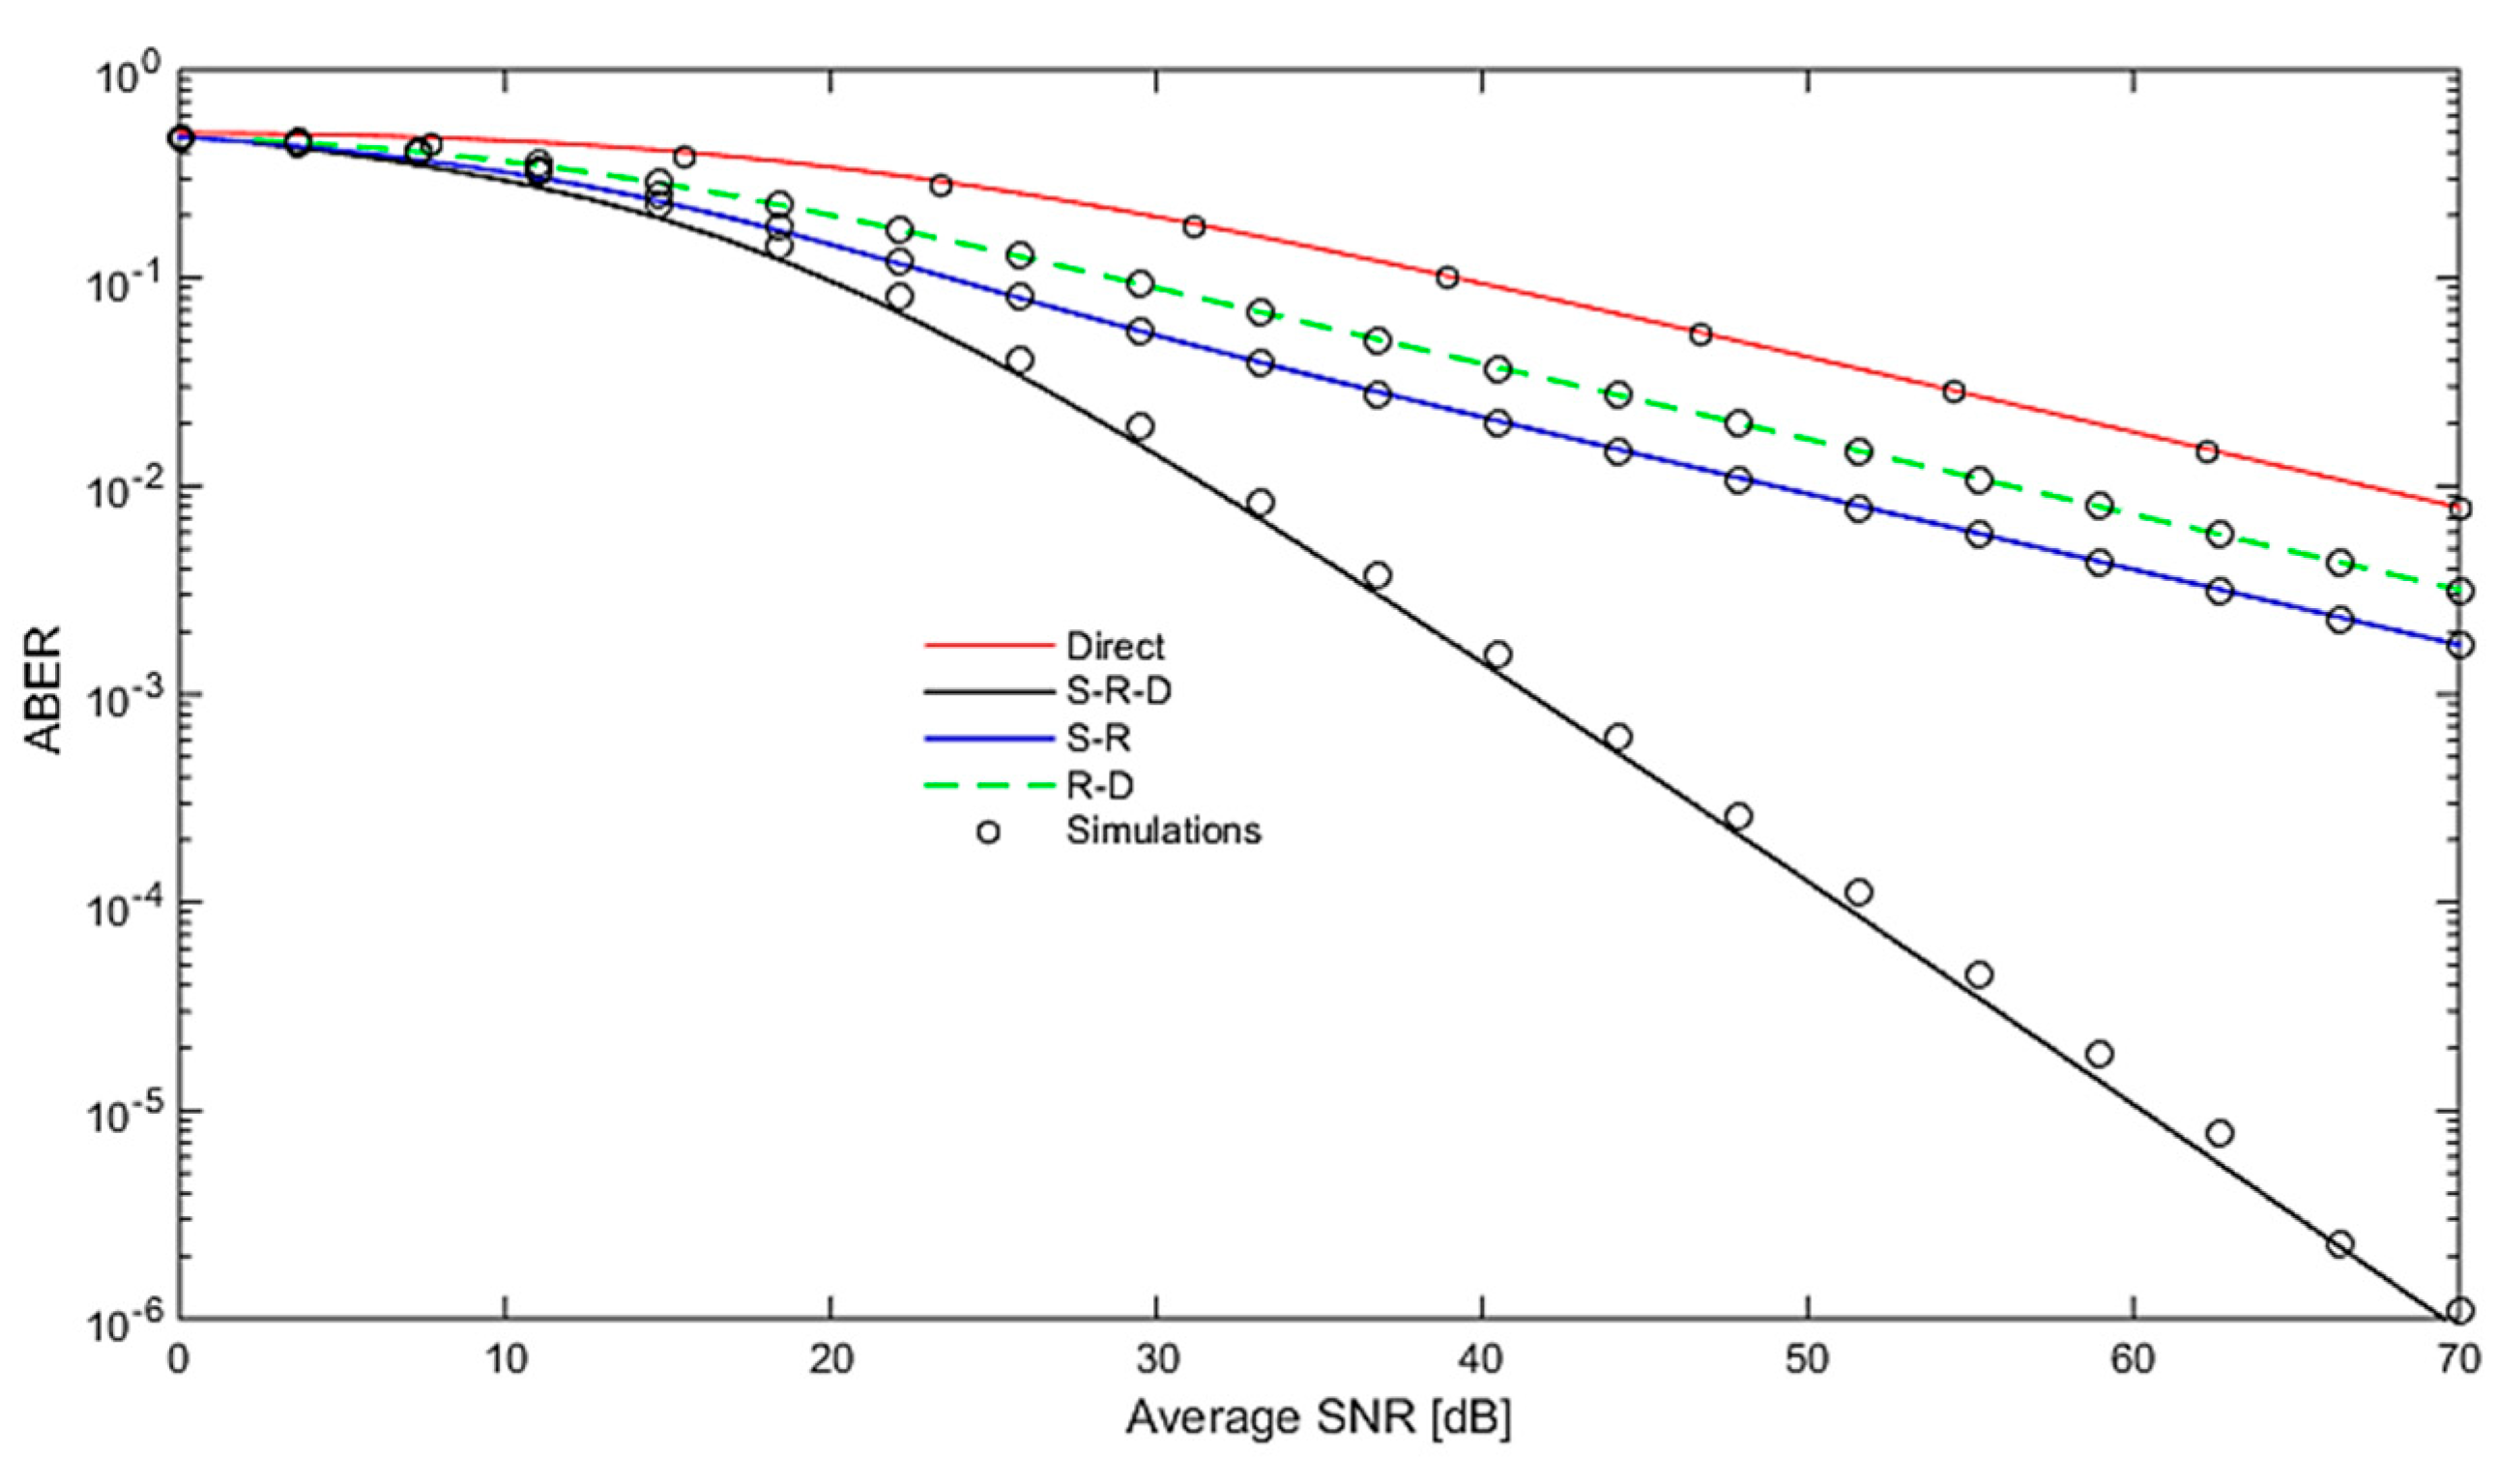
Figure 14 shows that the S-R-D scheme has higher SNR gain than R-D and S-R schemes by 5 dB and 9.9 dB, respectively, because of higher pointing error.
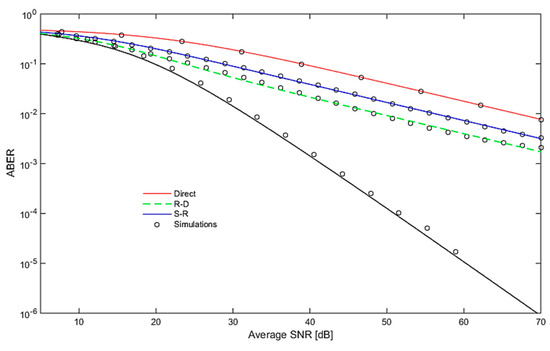
Figure 14.
ABER vs. SNR of FSO over G-G channel for strong turbulence with distance 400–600 m, the number of relays = 3, and wz = 0.5 m.
Figure 15 shows that the S-R-D scheme has higher SNR gain than the S-R and R-D schemes by 5 dB and 10.6 dB, respectively. This SNR gain of S-R-D as compared with S-R and R-D is due to the pointing error in this condition, which is higher than the effect of turbulence, and pointing error is not a function of distance, and hence it has the same effect on the two hops.
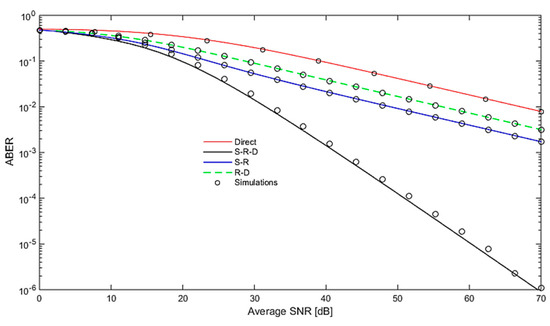
Figure 15.
ABER vs. SNR of FSO over the G-G channel for strong turbulence with distance 600–400 m, the number of relays = 3, and wz = 0.5 m.
Figure 16 displays the effect of moderate turbulence and weak pointing error. Clearly, the R-D scheme has higher SNR gain than S-R-D and S-R schemes by 0.8 dB and 5.3 dB, respectively.

Figure 16.
ABER vs. SNR of FSO over L-N channel for moderate turbulence with distance 400–600 m, the number of relays = 2, and wz = 2 m.
Unlike Figure 16, Figure 17 considers strong turbulence with strong pointing error for the best relay selection of two relays. The obtained results show that the S-R-D scheme has higher SNR gain when compared with the other two schemes.
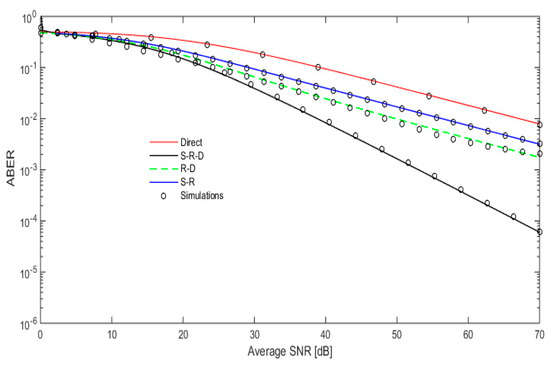
Figure 17.
ABER vs. SNR of FSO over the G-G channel for strong turbulence with distance 400–600 m, number of relays = 2 and wz = 0.5 m.
5. Conclusions
Free space optical communication system using cooperative relays has lots of advantages in the mitigation of both atmospheric turbulence and path loss effects, where the propagation distance increases these effects and the relays shorten the propagation distance. An active relay per time slot can be selected according to the channel condition to obtain a diversity advantage. This selection can be employed according to the channel coefficient of S-R, R-D, or S-R-D schemes. This paper discusses what scheme is suitable according to the channel conditions. The obtained results show that no optimum techniques can be considered for all channel conditions. The worth mentioned S-R-D scheme can outperform the two other schemes for equidistant distance by 4 and 10 dB for weak and strong turbulence, respectively. The R-D scheme can outperform the S-R one by more than 3 dB for distances of 400 m–600 m. Moreover, the S-R scheme can outperform the R-D one by 7 dB for moderate turbulence. The results conclude that, for equidistant relay between the source and relay, the S-R-D scheme is better, regardless of the severe effect of the channel. While, for a low pointing error effect or automatic pointing algorithms, the R-D scheme is better than the two other schemes when the relay is closer to the source and the S-R scheme is better than the two other schemes for a relay that is closer to the destination.
Author Contributions
Conceptualization, M.A.; Data curation, M.A.; Formal analysis, M.A.T. and M.H.A.; Investigation, M.A.T.; Supervision, M.A., M.F. and M.H.A.; Validation, M.A.T., M.A., M.F. and M.H.A.; Writing-original draft, M.A.T.; Writing-review & editing, M.A., M.F. and M.H.A.
Funding
This research received no external funding.
Conflicts of Interest
The authors declare no conflict of interest.
References
- Abdelbaset, S.H.; Jitender, S.D.; Dennis, R.A. Classification Framework for Free Space Optical Communication Links and Systems. J. IEEE Commun. Surv. Tutor. 2018. [Google Scholar] [CrossRef]
- Aditi, M.; Preeti, S. Free Space Optics: Current Applications and Future Challenges. Int. J. Opt. 2015, 2015, 945483. [Google Scholar] [CrossRef]
- Khalighi, M.A.; Uysal, M. Survey on Free Space Optical Communication: A Communication Theory Perspective. J. IEEE Commun. Surv. Tutor. 2014, 16, 2231–2258. [Google Scholar] [CrossRef]
- Tsiftsis, T.A.; Sandalidis, H.G.; Karagiannidis, G.K.; Sagias, N.C. Multihop Free-Space Optical Communications Over Strong Turbulence Channels. In Proceedings of the IEEE International Conference on Communications, Istanbul, Turkey, 11–15 June 2006; pp. 1–5. [Google Scholar] [CrossRef]
- Safari, M.; Uysal, M. Relay-Assisted Free-Space Optical Communication. J. IEEE Trans. Wirel. Commun. 2008, 7, 5441–5449. [Google Scholar] [CrossRef]
- Jiao, Y.; Wang, J.B.; Dang, X.; Chen, M.; Hu, W.; Huang, Y.-H. Performance Analysis of Multi-hop Free Space Optical Communications with Pointing Errors. In Proceedings of the 9th International Conference on Optical Communications and Networks (ICOCN 2010), Nanjing, China, 22 August 2010; pp. 1–4. [Google Scholar] [CrossRef]
- Ismail, T.; Leitgeb, E.; Plank, T. Free Space Optic and mmWave Communications: Technologies, Challenges and Applications. J. IEICE Trans. Commun. 2016, E99-B, 1243–1254. [Google Scholar] [CrossRef]
- Chensheng, W.; Jonathan, K.; Christopher, C.D. Imaging through strong turbulence with a light field approach. J. Opt. Soc. Am. 2016, 24, 11975–11986. [Google Scholar] [CrossRef]
- Petkovic, M.I.; Cvetkovic, A.M.; Djordjevic, G.T.; Karagiannidis, G.K. Partial Relay Selection with Outdated Channel State Estimation in Mixed RF/FSO Systems. J. Lightwave Technol. 2015, 33, 2860–2867. [Google Scholar] [CrossRef]
- Elbawab, M.; Abaza, M.; Aly, M.H. Blind Detection for Serial Relays in Free Space Optical Communication Systems. Appl. Sci. 2018, 8, 2074. [Google Scholar] [CrossRef]
- Abaza, M.; Mesleh, R.; Mansour, A.; Aggoune, E.-H.M. Relay Selection for Full-Duplex FSO Relays Over Turbulent Channels. In Proceedings of the 2016 IEEE International Symposium on Signal Processing and Information Technology (ISSPIT), Limassol, Cyprus, 12–14 December 2016; pp. 103–108. [Google Scholar] [CrossRef]
- Amin, O.; Mesleh, R.; Ikki, S.S.; Ahmed, M.H.; Dobre, O.A. Performance Analysis of Multiple Relays Cooperative Systems with Signal Space Diversity. J. IEEE Trans. Veh. Technol. 2015, 64, 3414–3425. [Google Scholar] [CrossRef]
- Farid, A.A.; Hranilovic, S. Outage Capacity Optimization for Free-Space Optical Links with Pointing Errors. J. Lightwave Technol. 2007, 25, 1702–1710. [Google Scholar] [CrossRef]
- Ryzhik, L.M.; Gradshteyn, L.S. Table of Integrals, Series, and Products; Academic Press: Cambridge, MA, USA, 2007. [Google Scholar]
- Abaza, M.R.; Mesleh, R.; Mansour, A.; Aggoune, E.M. The performance of space shift keying for free-space optical communications over turbulent channels. In Proceedings of the SPIE 9387, Broadband Access Communication Technologies IX, 93870V, San Francisco, CA, USA, 7–12 February 2015. [Google Scholar] [CrossRef]
- Feng, M.; Wang, J.-B.; Sheng, M.; Cao, L.-L.; Xie, X.-X.; Chen, M. Outage Performance for Parallel Relay-Assisted Free-Space Optical Communications in Strong Turbulence with Pointing Errors. In Proceedings of the 2011 International Conference on Wireless Communications and Signal Processing (WCSP), Nanjing, China, 9–11 November 2011; pp. 1–5. [Google Scholar] [CrossRef]
- Andrews, L.C.; Phillips, R.L.; Hopen, C.Y. Laser Beam Scintillation with Applications; SPIE Press: Bellingham, WA, USA, 2001, 2001. [Google Scholar] [CrossRef]
- Mona, A.; Parul, G.; Parul, P. Analysis of subcarrier intensity modulation-based optical wireless DF relaying over turbulence channels with path loss and pointing error impairments. J. IET Commun. 2014, 8, 3170–3178. [Google Scholar] [CrossRef]
- Chatzidiamantis, N.D.; Michalopoulos, D.S.; Kriezis, E.E.; Karagiannidis, G.K.; Schober, R. Relay Selection Protocols for Relay-Assisted Free-Space Optical Systems. IEEE/OSA J. Opt. Commun. Netw. 2013, 5, 92–103. [Google Scholar] [CrossRef]
- Soni, G.; Malhotra, J.S. Impact of Beam Divergence on the Performance of Free Space Optical System. Int. J. Sci. Res. Publ. 2012, 2, 1–5. [Google Scholar]


© 2019 by the authors. Licensee MDPI, Basel, Switzerland. This article is an open access article distributed under the terms and conditions of the Creative Commons Attribution (CC BY) license (http://creativecommons.org/licenses/by/4.0/).