Integrated Inundation Modeling of Flooded Water in Coastal Cities

Abstract
:1. Introduction
1.1. Backgrounds
1.2. Overview of Current Researches
1.3. Objectives
2. Methods
2.1. Applied Models
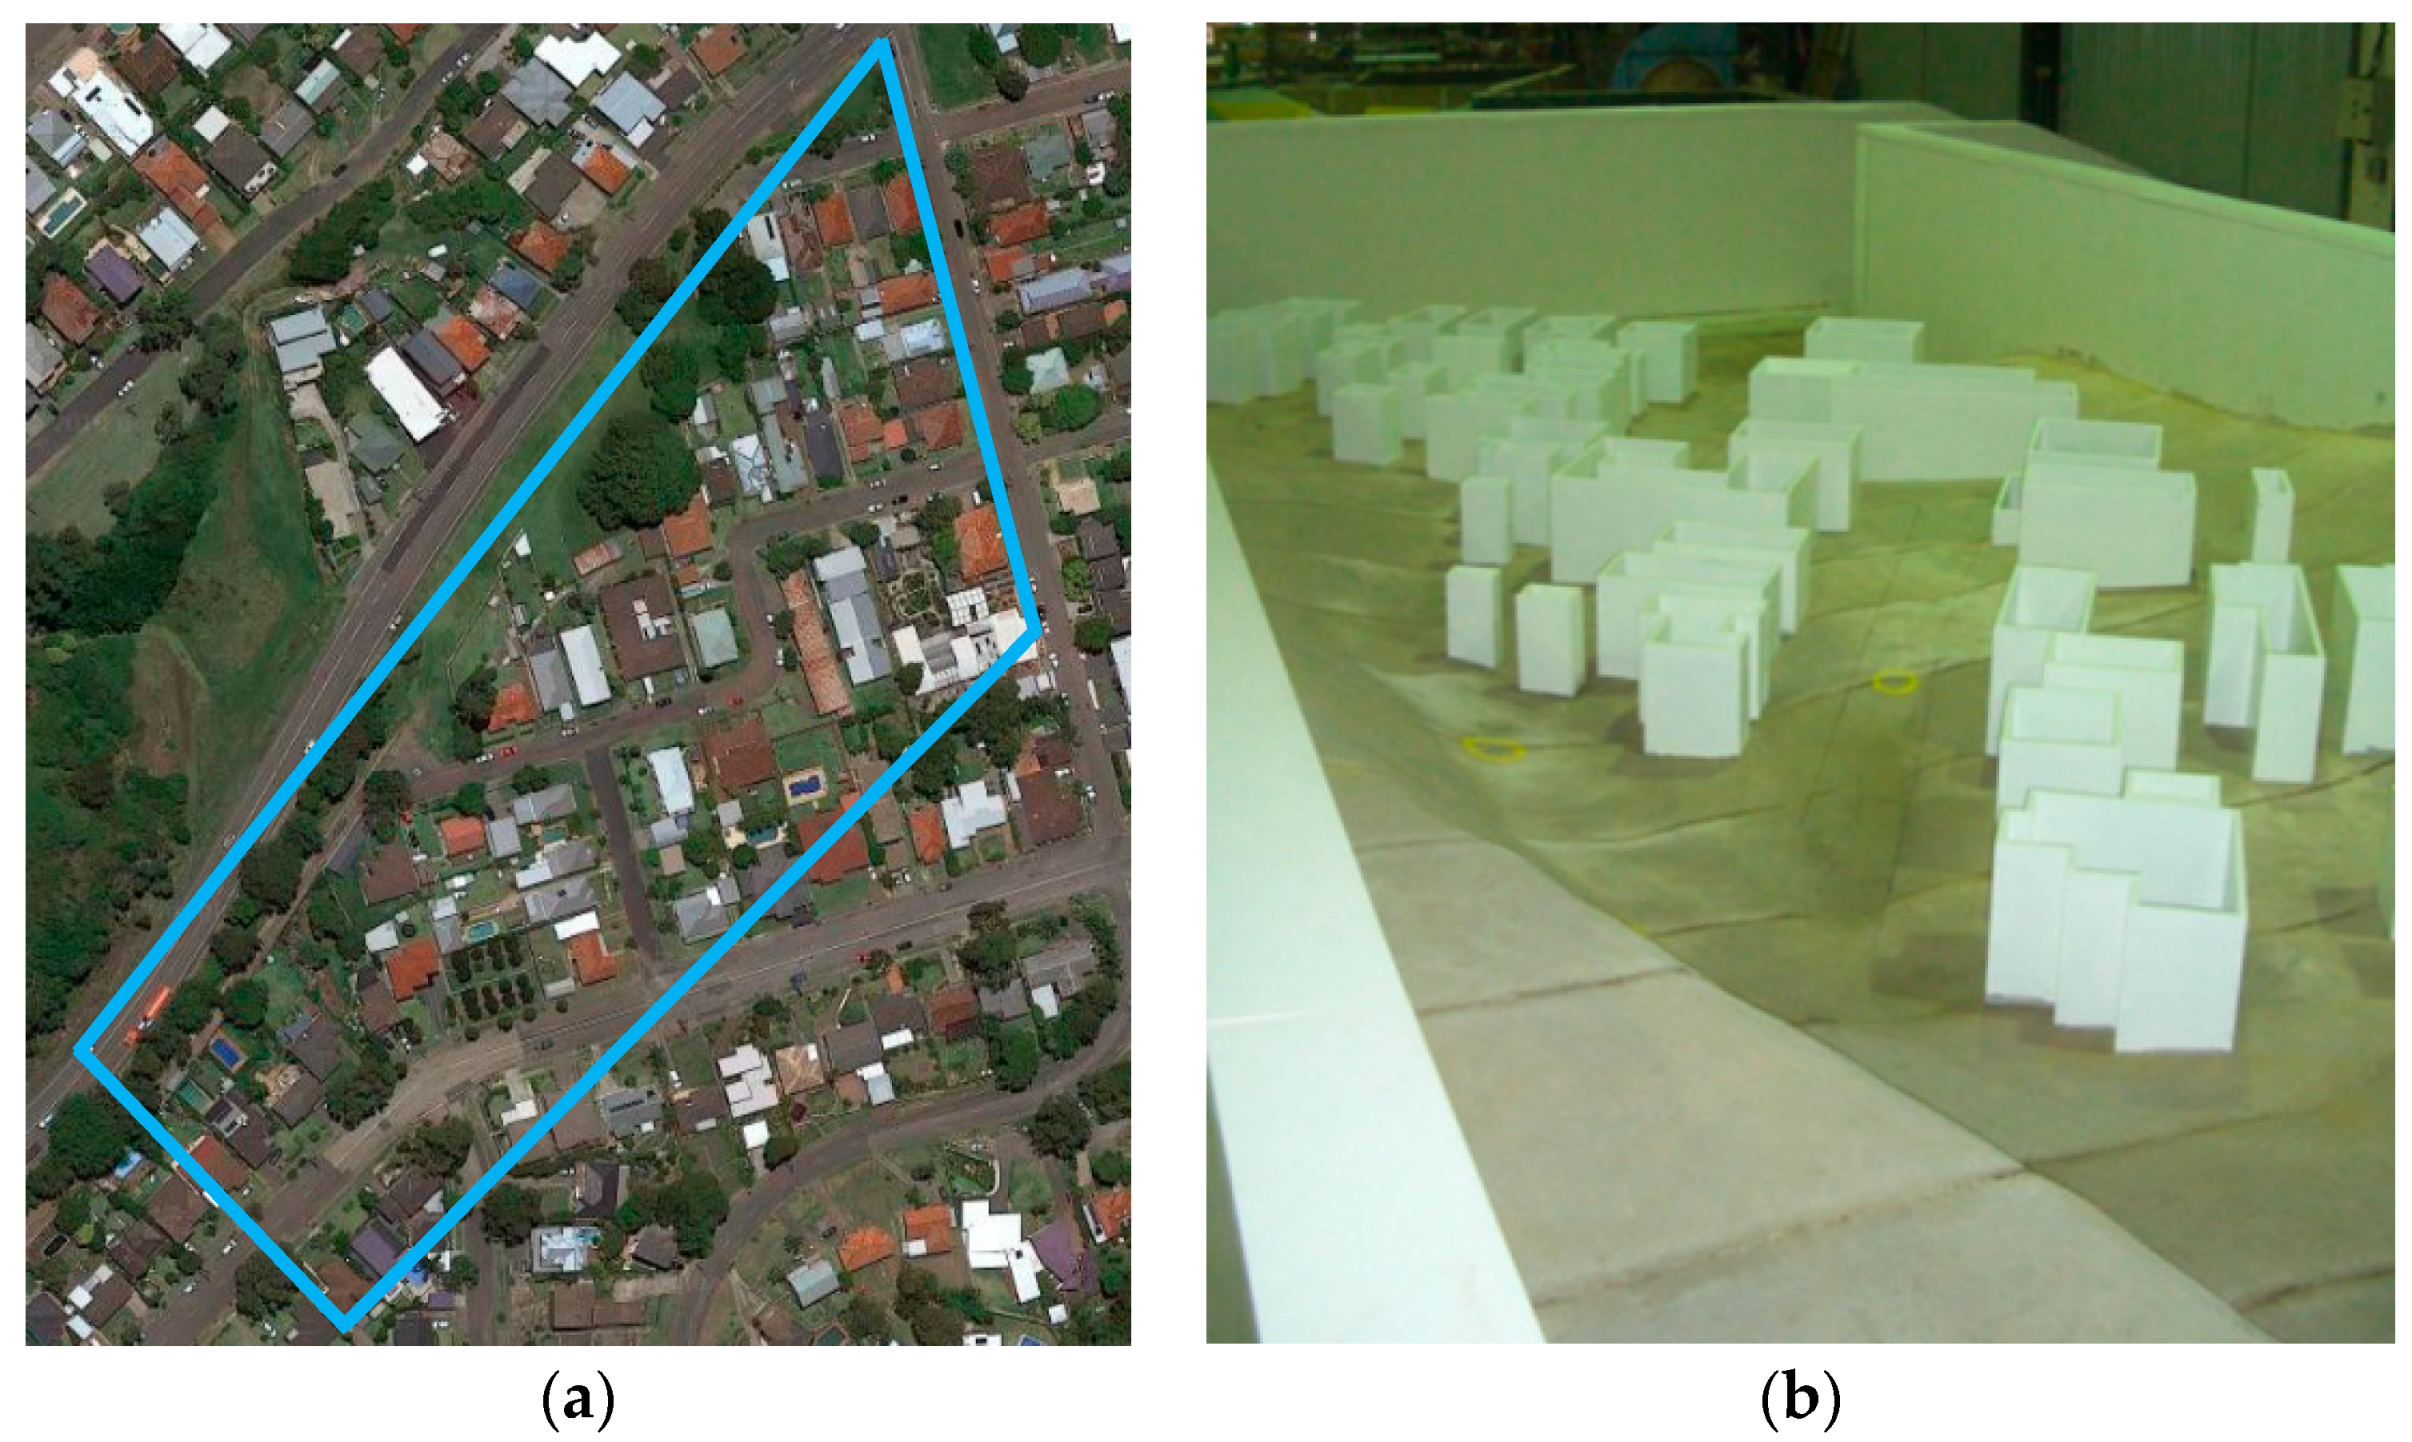
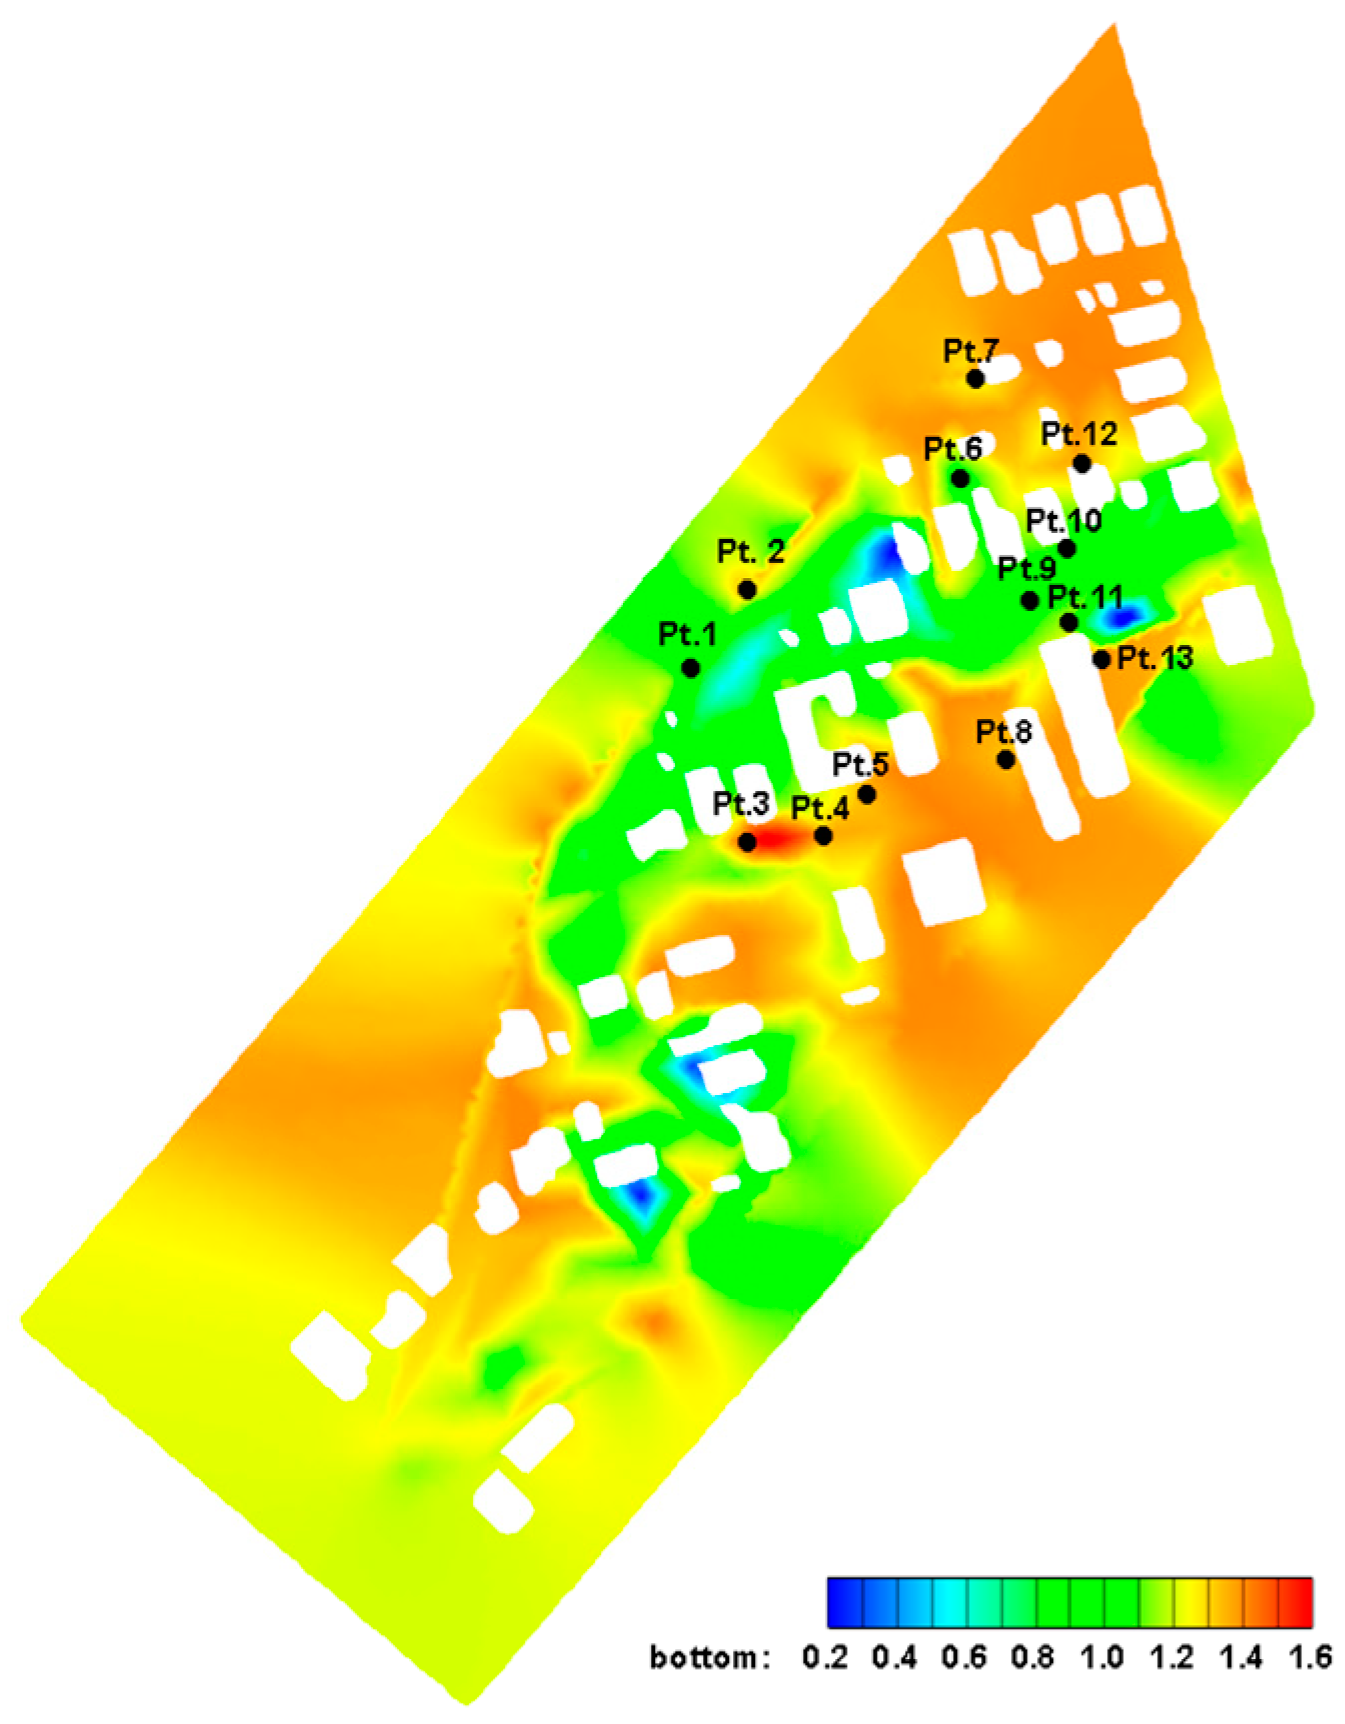
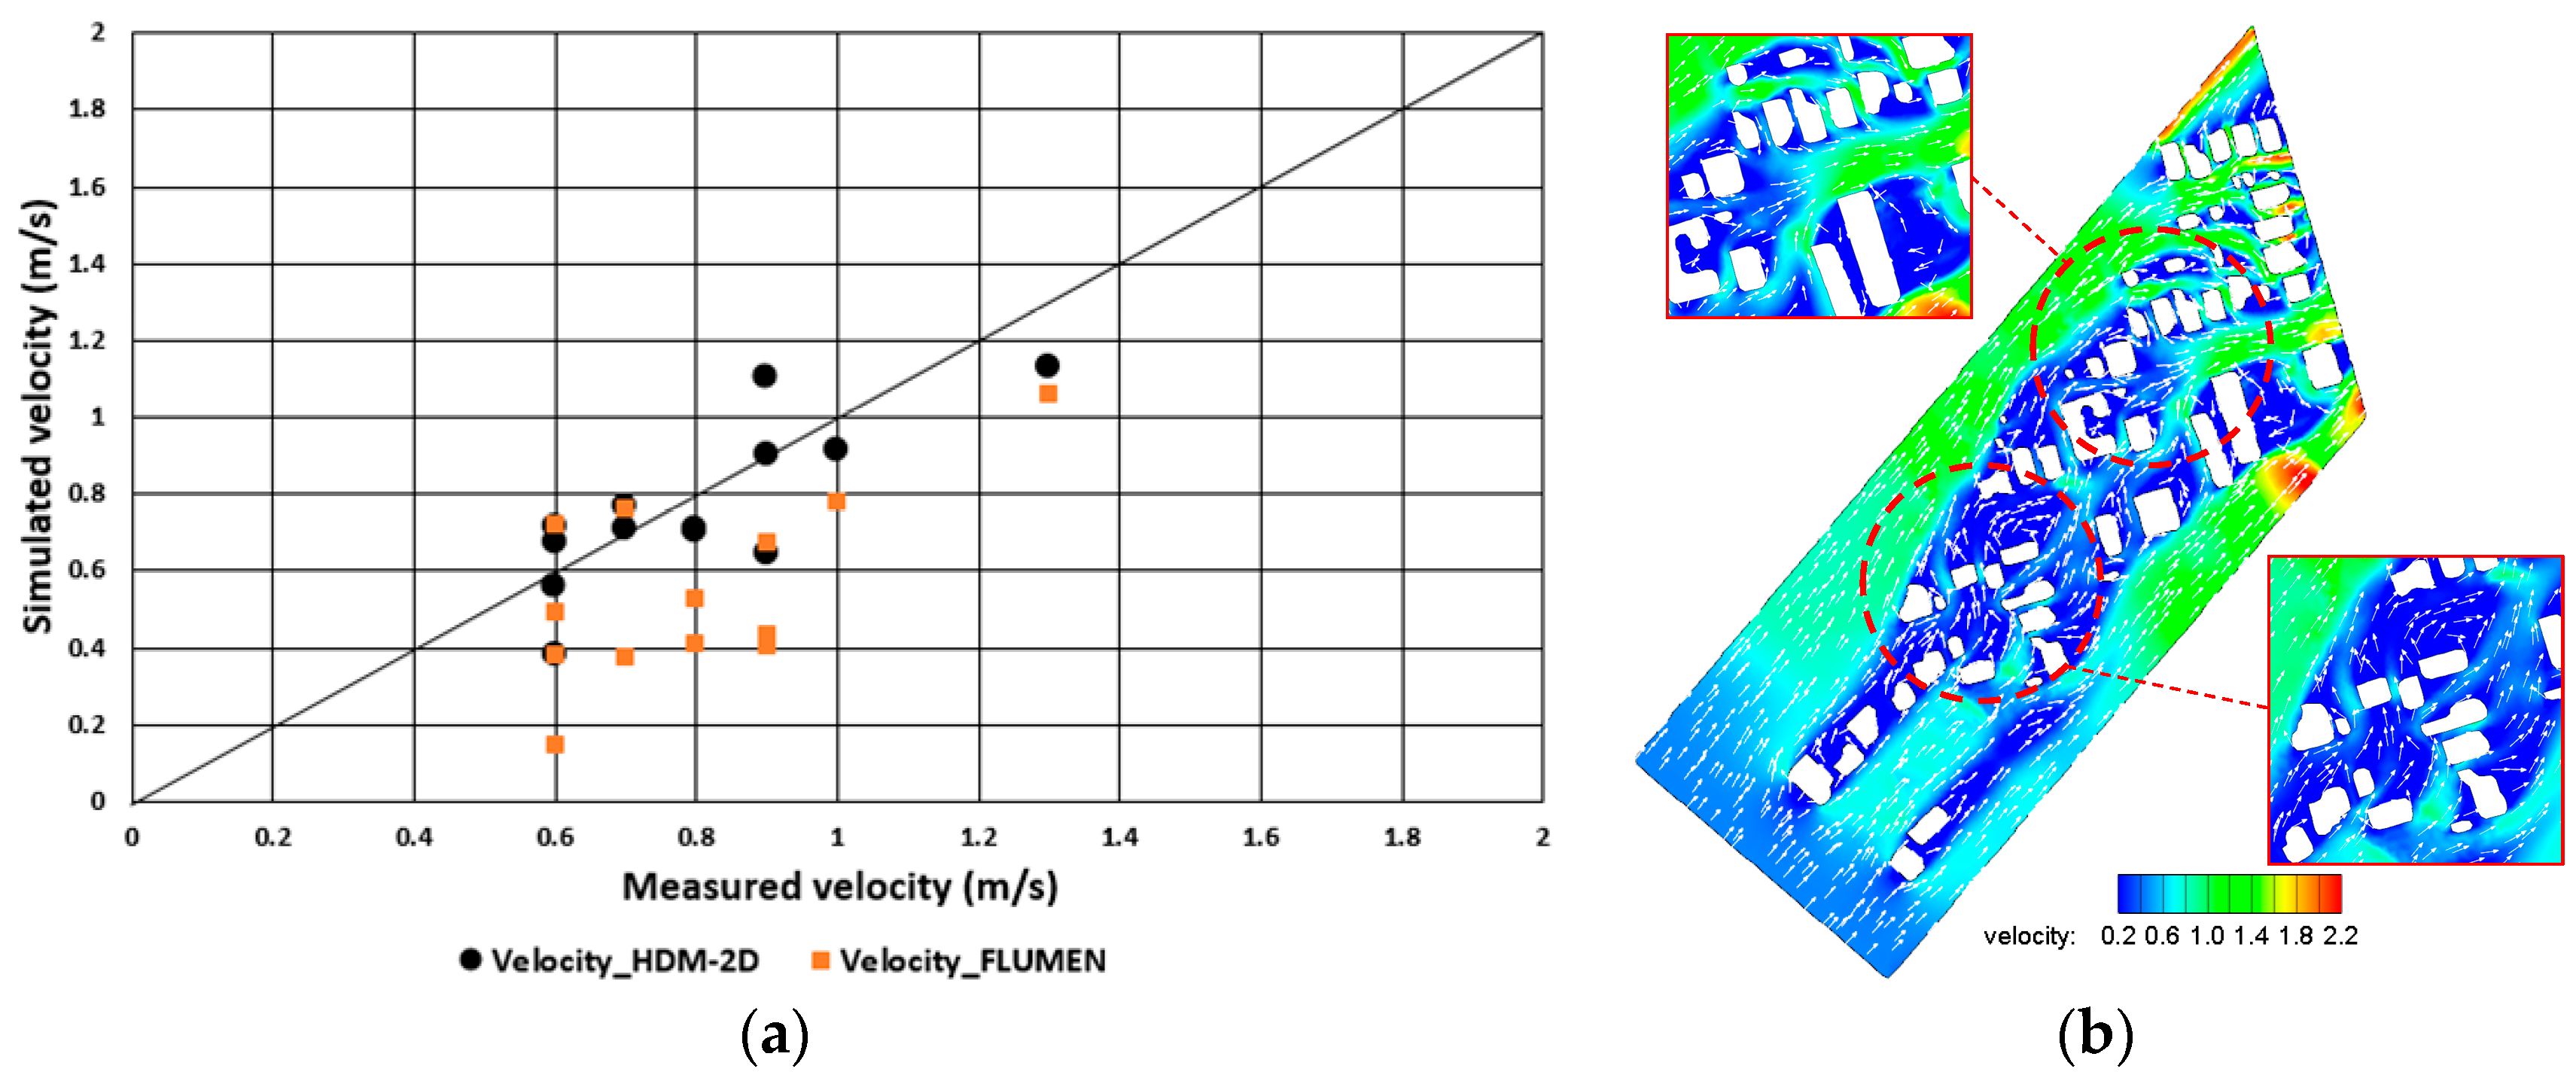
2.2. Verification of Models
2.3. Model Selection
3. Results
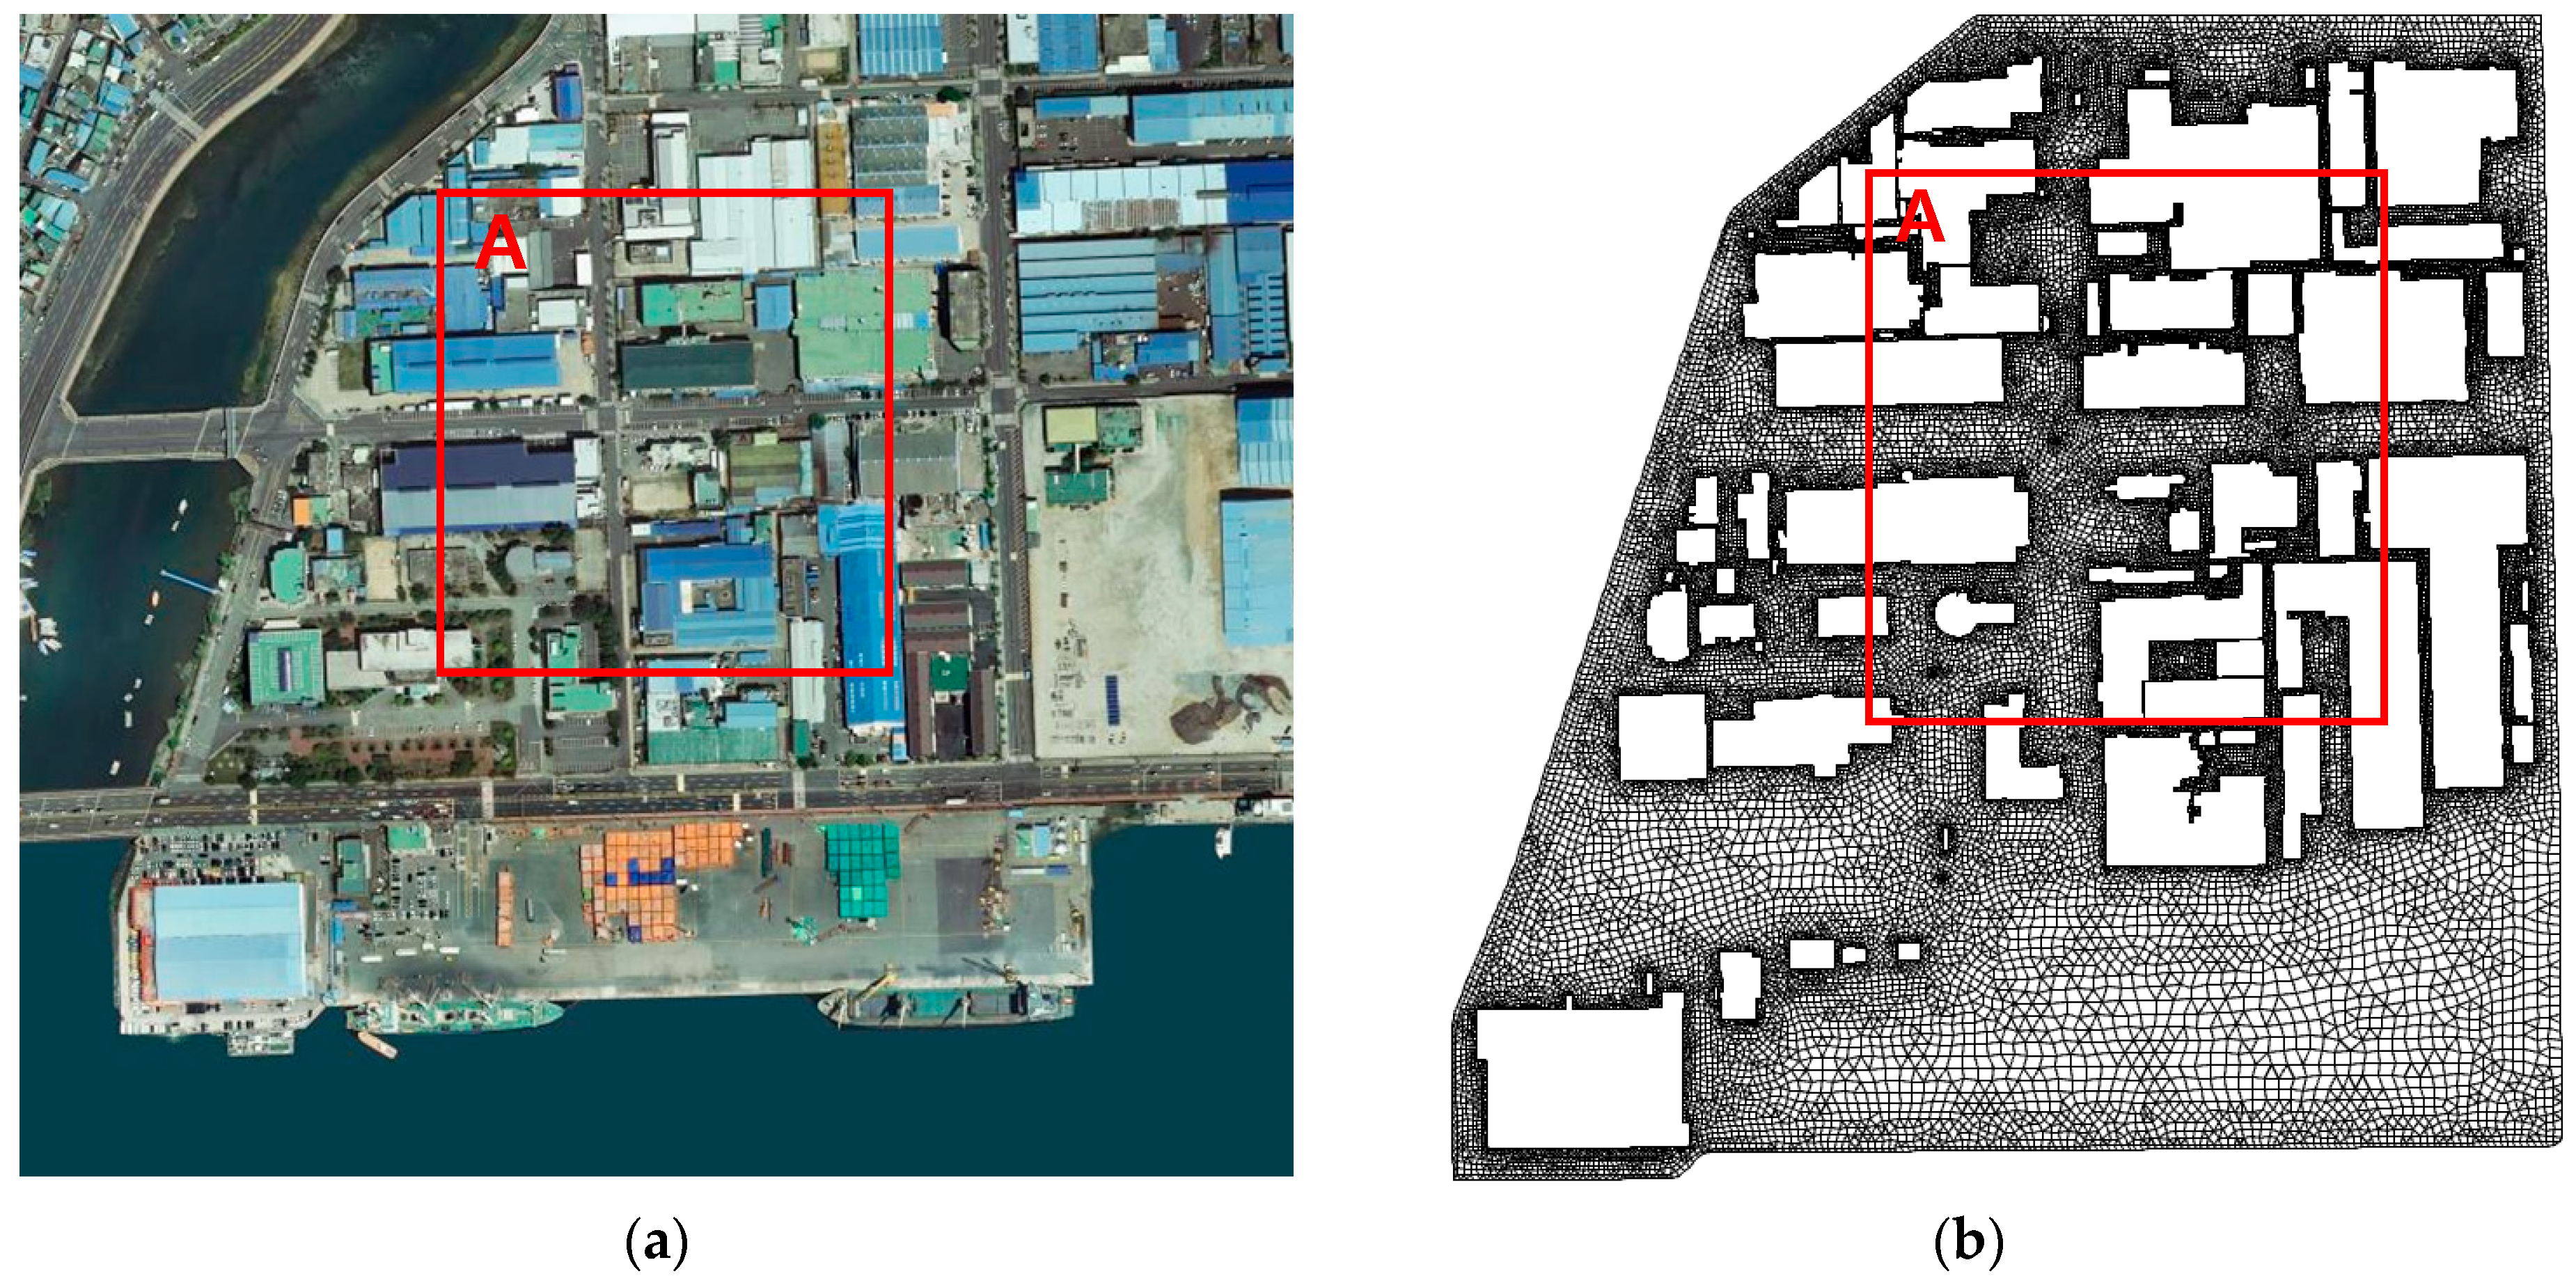
3.1. Study Area
3.2. Topograpgy Reproduction
3.3. Simulation Setups
3.4. Single and Comprehensive Inundation Modeling
4. Discussions
5. Summary and Conclusions
Author Contributions
Acknowledgments
Conflicts of Interest
References
- Davis, C.A. Floodplain Analysis Tools, User’s Documentation; US army Corps of Engineers, Hydrologic Engineering Center: Second Street Davis, CA, USA, 1992. [Google Scholar]
- Fan, Y.; Ao, T.; Yu, H.; Huang, G.; Li, X. A Coupled 1D–2D Hydrodynamic Model for Urban Flood Inundation. Adv. Meteorol. 2017, 2017, 2819308. [Google Scholar] [CrossRef]
- Horritt, M.S.; Bates, P.D. Evaluation of 1D and 2D numerical models for predicting river flood inundation. J. Hydrol. 2002, 326, 87–99. [Google Scholar] [CrossRef]
- Paz, A.R.; Meller, A.; Silva, G.B.L. Coupled 1D-2D hydraulic simulation of urban drainage system: Model development and preliminary results. In Proceedings of the 12th International Conference on Urban Drainage, Porto Ale-gre, Brazil, 11–16 September 2011. [Google Scholar]
- Adeogun, A.G.; Pathirana, A.; Daramola, M.O. 1D-2D hydrodynamic model coupling for inundation analysis of sewer overflow. J. Eng. Appl. Sci. 2012, 7, 356–362. [Google Scholar] [CrossRef]
- Adeogun, A.G.; Daramola, M.O.; Pathirana, A. Coupled 1D-2D hydrodynamic inundation model for sewer over-flow. Water Sci. 2015, 29, 146–155. [Google Scholar] [CrossRef]
- Leandro, J.; Martins, R. A methodology for linking 2D overland flow models with the sewer network model SWMM 5.1 based on dynamic link libraries. Water Sci. Technol. 2016, 73, 3017–3026. [Google Scholar] [CrossRef] [PubMed]
- Leandro, J.; Chen, A.S.; Djordjevic, S.; Savic, D.A. Comparison of 1D/1D and 1D/2D Coupled (Sewer/Surface) Hydraulic Models for Urban Flood Simulation. J. Hydraul. Eng. 2009, 135, 495–504. [Google Scholar] [CrossRef]
- Seyoum, S.D.; Vojinovic, Z.; Price, R.K.; Weesakul, S. Coupled 1D and Noninertia 2D Flood Inundation Model for Simulation of Urban Flooding. ASCE J. Hydraul. Eng. 2012, 138, 23–34. [Google Scholar] [CrossRef]
- Blazkova, S.; Beven, K. Flood frequency estimation by continuous simulation of subcatchment rainfalls and discharges with the aim of improving dam safety assessment in a large basin in the Czech Republic. J. Hydrol. 2004, 292, 153–172. [Google Scholar] [CrossRef]
- Ciarapica, L.; Todini, E. TOPKAPI: A model for the representation of the rainfall-runoff process at different scales. Hydrol. Proc. 2002, 16, 207–229. [Google Scholar] [CrossRef]
- De Michele, C.; Salvadori, G. On the derived flood frequency distribution: Analytical formulation and the influence of antecedent soil moisture condition. J. Hydrol. 2002, 262, 245–258. [Google Scholar] [CrossRef]
- Fiorentino, M.; Gioia, A.; Iacobellis, V.; Manfreda, S. Regional analysis of runoff thresholds behaviour in Southern Italy based on theoretically derived distributions. Adv. Geosci. 2011, 26, 139–144. [Google Scholar] [CrossRef] [Green Version]
- Gioia, A.; Manfreda, S.; Iacobellis, V.; Fiorentino, M. Performance of a theoretical model for the description of water balance and runoff dynamics in southern Italy. J. Hydrol. Eng. 2014, 19, 1113–1123. [Google Scholar] [CrossRef]
- Ray, T.; Stepinski, E.; Sebastian, A.; Bedient, P.B. Dynamic modeling of storm surge and inland flooding in a Texas coastal floodplain. J. Hydraul. Eng. 2011, 137, 1103–1110. [Google Scholar] [CrossRef]
- Chen, W.B.; Liu, W.C. Modeling flood inundation induced by river flow and storm surges over a river basin. Water 2014, 6, 3182–3199. [Google Scholar] [CrossRef]
- Song, C.G.; Ku, Y.H.; Kim, Y.D.; Park, Y.S. Stability analysis of riverfront facility on inundated floodplain based on flow characteristic. J. Flood Risk Manag. 2018, 11, 455–467. [Google Scholar] [CrossRef]
- Rhee, D.S.; Lyn, S.W.; Song, C.G. Numerical Computation of Rapid Flow over Steep Terrain Using Total Acceleration Method. J. Coast. Res. 2018, 85, 986–990. [Google Scholar] [CrossRef]
- Song, C.G.; Oh, T.K. Transient SU/PG modelling of dis-continuous wave propagation. Prog. Comput. Fluid Dyn. 2016, 16, 146–162. [Google Scholar] [CrossRef]
- Kim, H.J.; Rhee, D.S.; Song, C.G. Numerical Computation of Underground Inundation in Multiple Layers Using the Adaptive Transfer Method. Water 2018, 10, 85. [Google Scholar] [CrossRef]
- Kim, S.E.; Lee, S.E.; Kim, D.W.; Song, C.G. Stormwater Inundation Analysis in Small and Medium Cities for the Climate Change Using EPA-SWMM and HDM-2D. J. Coast. Res. 2018, 85, 991–995. [Google Scholar] [CrossRef]
- Park, I.H.; Seo, I.W.; Kim, Y.D.; Song, C.G. Flow and dispersion analysis of shallow water problems with Froude number variation. Environ. Earth Sci. 2016, 75, 120. [Google Scholar] [CrossRef]
- FLUMEN User Manual. Available online: https://www.fluvial.ch/manual.html (accessed on 2 February 2019).
- Bae, Y.H.; Koh, D.K.; Cho, Y.S. Numerical simulations of flood inundations with FLUMEN. J. Korea Water Resour. Assoc. 2005, 14, 355–364. (In Korean) [Google Scholar] [CrossRef]
- Smith, G.P.; Wasko, C.D.; Miller, B.M. Modelling the Influence of Buildings on Flood Flow; Water Research Laboratory, University of New South Wales: Sydney, NSW, Australia, 2012. [Google Scholar]
- Kawai, H.; Kin, D.S.; Kang, Y.k.; Tomita, T.; Hiraishi, T. Hindcasting of Storm Surge at Southeast Coast by Typhoon Maemi. J. Ocean Eng. Technol. 2005, 19, 12–18. [Google Scholar]


| # of Point | Measured Depth [25] (m) | HDM-2D Depth (m) | FLUMEN Depth (m) | Measured Velocity [25] (m/s) | HDM-2D Velocity (m/s) | FLUMEN Velocity (m/s) |
|---|---|---|---|---|---|---|
| 1 | 0.721 | 0.660 | 0.658 | 0.9 | 0.901 | 0.402 |
| 2 | 0.442 | 0.412 | 0.369 | 0.9 | 1.098 | 0.671 |
| 3 | 0.1 | 0.100 | 0.101 | 0.6 | 0.673 | 0.492 |
| 4 | 0.406 | 0.348 | 0.342 | 0.8 | 0.703 | 0.525 |
| 5 | 0.442 | 0.379 | 0.359 | 0.6 | 0.555 | 0.382 |
| 6 | 0.784 | 0.631 | 0.615 | 0.9 | 0.644 | 0.432 |
| 7 | 0.523 | 0.466 | 0.384 | 0.7 | 0.764 | 0.373 |
| 8 | 0.442 | 0.363 | 0.337 | 0.8 | 0.707 | 0.411 |
| 9 | 0.766 | 0.629 | 0.614 | 1.0 | 0.913 | 0.776 |
| 10 | 0.712 | 0.567 | 0.553 | 0.6 | 0.711 | 0.717 |
| 11 | 0.604 | 0.469 | 0.422 | 1.3 | 1.128 | 1.059 |
| 12 | 0.397 | 0.269 | 0.247 | 0.7 | 0.707 | 0.763 |
| 13 | 0.388 | 0.360 | 0.280 | 0.6 | 0.380 | 0.146 |
| Classification | Conditions | Case 1 | Case 2 | Case 3 | Case 4 | Case 5 |
|---|---|---|---|---|---|---|
| Inland flooding | 0.14 m3/s | o | - | - | - | o |
| River inundation | 3 m | - | o | - | o | o |
| Storm surge | 3 m | - | - | o | o | o |
| Attributes | Unit | Case 1 | Case 2 | Case 3 | Case 4 | Case 5 |
|---|---|---|---|---|---|---|
| Flooded area | % | 17.1 | 34.9 | 60.8 | 84 | 91.7 |
| Maximum flooding depth | m | 1.36 | 1.94 | 1.99 | 2.08 | 2.08 |
| Average flooding depth | m | 0.173 | 0.35 | 0.43 | 0.47 | 0.48 |
| Maximum flooding velocity | m/s | 2.71 | 2.84 | 2.75 | 2.76 | 2.76 |
| Average flooding velocity | m/s | 0.32 | 0.38 | 0.43 | 0.35 | 0.33 |
© 2019 by the authors. Licensee MDPI, Basel, Switzerland. This article is an open access article distributed under the terms and conditions of the Creative Commons Attribution (CC BY) license (http://creativecommons.org/licenses/by/4.0/).
Share and Cite
Shin, E.T.; Shin, J.; Rhee, D.S.; Kim, H.-J.; Song, C.G. Integrated Inundation Modeling of Flooded Water in Coastal Cities. Appl. Sci. 2019, 9, 1313. https://doi.org/10.3390/app9071313
Shin ET, Shin J, Rhee DS, Kim H-J, Song CG. Integrated Inundation Modeling of Flooded Water in Coastal Cities. Applied Sciences. 2019; 9(7):1313. https://doi.org/10.3390/app9071313
Chicago/Turabian StyleShin, Eun Taek, Jaehyun Shin, Dong Sop Rhee, Hyung-Jun Kim, and Chang Geun Song. 2019. "Integrated Inundation Modeling of Flooded Water in Coastal Cities" Applied Sciences 9, no. 7: 1313. https://doi.org/10.3390/app9071313