Abstract
To understand the activities of complex microbial communities in various natural environments and living organisms, we need to capture the compositional changes in their taxonomic abundance. Here, we propose a new computational framework to detect compositional changes in microorganisms, including minor bacteria. This framework is designed to statistically assess relative variations in taxonomic abundance. By using this approach, we detected compositional changes in the human gut microbiome that might be associated with short-term human dietary changes. Our approach can shed light on the compositional changes of minor microorganisms that are easily overlooked.
1. Introduction
A vast variety of microbial communities exist in various environments, such as the ocean, soil, and parts of living organisms [1,2,3,4]. However, the majority of the microorganisms in these environments remain uncultured. Recently, next-generation sequencing (NGS) technologies have opened the possibility of performing genetic analyses of these culture-independent microorganisms [5]. Bioinformatics approaches for NGS technologies can promote the understanding of complex microbial communities [6], but the roles of many microorganisms remain to be clarified. The knowledge of bacterial taxonomic composition changes in various environments is essential to understand the roles of their complex communities [7,8]. Therefore, further investigations of taxonomic compositional variation in microbial communities may highlight the potential roles of several microorganisms.
The human gut microbiome is a well-studied microbial community [9,10,11]. Some gut microbes support the breaking down of proteins, lipids, and carbohydrates into nutrients that humans can efficiently absorb through the gastrointestinal tract [12]. Additionally, several microbes residing in the intestinal tract produce valuable compounds, including vitamins and anti-inflammatory substances [13,14]. The existence of certain microbial species in the gut microbiome is related to disorders of the host [15,16]. Therefore, the human gut microbiome is also used as a biomarker in clinical practice [17]. Several gut microbial species maintain symbiotic relationships with their hosts, with respect to surrounding environmental changes [18]. The compositional differences in the microbiome may reflect the changes in their habitat environments. These differences in the human gut microbiome may be related to environmental factors, such as pH [19] and oxygen concentration [20], for each gastrointestinal tract position. For example, there is bias in the types of microbial species, depending on the position in the human gastrointestinal tract [21].
To detect these taxonomic differences in the types of microbial species, computational frameworks such as edgeR [22] or DESeq2 [23] are often used. These approaches were originally designed for differential gene expression analyses, assuming that most of the features do not change concerning the experimental conditions. However, the taxonomic abundance of microbial species can vary widely under the same conditions. Therefore, these methods based on many invariant factors cannot easily detect the differential taxonomic abundance changes in rare microbes. Furthermore, although the negative values generated by logarithmic transformation in DESeq2 may be set to zero values, this process may ignore many rare species and underestimate the diversity of microbial communities.
The microbiome includes many rare microorganisms (Operational taxonomic units; OTUs) with a composition ratio of 0.01% or less, but their variation tends to be overlooked due to the lack of appropriate approaches. In this study, we described microorganisms whose composition significantly changed after the diet intervention as outliers. We also defined features with a 0.01% or less compositional ratio as minor components and focused on their relative variations. To detect the compositional changes of complex microbial communities including minor microbial components, we developed a new computational framework called Bacterial Relative Variation Outliers (BRaVO), to evaluate the relative variation for each microbial component. This method detects OTUs with differential taxonomic abundances, based on the relative variation index among samples. BRaVO detects outliers with very low relative abundances. Our approach will shed light on the taxonomic abundance changes including minor components that were often ignored in previous methodologies, and help us understand such complex microbial communities.
2. Materials and Methods
2.1. Datasets
We generated 141 taxonomic abundance tables of the human gut microbiomes empirically measured by David et al., (2013) [24]. We obtained the abundance tables from the MG-RAST server [25] (https://www.mg-rast.org/) (accession number: mgp6248) by using an application programming interface script of MG-RAST-Tools (https://github.com/MG-RAST/MG-RAST-Tools). These count tables are taxonomically annotated at the species level, based on the 16S rRNA Gene Database, Greengenes [26] (http://greengenes.secondgenome.com/). To examine the effect of short-term dietary changes on human gut microorganisms, the authors studied the taxonomic abundance changes in two differential diets, plant-based and animal-based. The study volunteers consisted of 10 American people (six males and four females) between the ages of 21 and 33, whose body mass indices ranged from 19 to 32 kg/m. The experimental term was 15 days, with a 4 day normal eating (baseline) period, a 5 day animal/plant-based period, and then a 6 day washout period to assess microbial recovery. To detect the diet-induced taxonomic abundance changes across the study period, the authors performed high-throughput amplicon sequencing for the 16S ribosomal RNA (rRNA) gene and the internal transcribed spacer region for several bacteria (Lactococcus lactis, Pediococcus acidilactici, Staphylococcus, Streptococcus thermophilus) and fungi (Candida sp., Debaryomyces, Penicillium, Scopulariopsis), which may be associated with the animal-based diet. In this study, we downloaded their 16S rRNA gene-based taxonomic abundance data for a total of 9 days, which included the normal diet (baseline) period for 4 days followed by the animal/plant-based diet interval for 5 days. The data consist of a total of 141 taxonomic abundance tables, covering 71 plant-based and 70 animal-based samples.
2.2. Preprocessing of Taxonomic Abundance Data
To compare the taxonomic abundance among samples with different numbers of total short reads from NGS, the count-based taxonomic abundance table should be normalized. In EdgeR, the read count data is normalized using the “trimmed mean of M values” (TMM) method. TMM is designed to shift the log-fold-change of stable features, such as housekeeping genes (HKGs), to zero values. Recently, a robust normalization method using the geometric mean of pairwise ratios (GMPR) [27] has been proposed for taxonomic count tables. GMPR is a normalization method that modifies the calculation procedure of the relative log expression normalization (RLE) implemented in DESeq2 and EdgeR. These normalization methods may capture robust changes in taxonomic abundance among samples, but they are less sensitive to relative abundance changes for microbial species with low abundance. Robust normalizations can underestimate the compositional changes of minor components in the microbial community. As a simple normalization method, “Total Sum Scaling (TSS)” is often applied to the read-count based tables. TSS uses the total read count for each sample as the size factor. TSS normalization converts count-based taxonomic abundance data into compositional data. Compositional data reside in a simplex, and thus most of the statistical frameworks assuming a Euclidean space cannot be directly applied to the compositional data. To appropriately deal with such compositional data, our framework performed a centered log-ratio (CLR) transformation for the taxonomic compositional data in the microbiome. This preprocessing is used for non-parametric differential analysis in geological studies [28,29], as well as microbiome studies [30]. This transformation function clr(X) is defined for the compositional data X as follows:
where is the geometric mean of the composition x, and D is the number of features (e.g., OTUs). This function transforms the relative taxonomic abundance from the simplex to the real space, and allows us to treat the data in real space.
2.3. Dealing with Zero-Inflated Count Tables
To deal with zero-included count tables, our computational framework performed multiplicative replacement [31]. In a differential taxonomic abundance analysis, a common problem is that the taxonomic abundance tables include many zero values. Common microbial species (or OTUs) are not always observed among samples. This makes it difficult to calculate several normalization factors. For example, the geometric means in RLE do not generally assume features with many zero values. Therefore, features with zero values are often excluded before the calculation. However, excluding features with zero values may ignore the presence of minor components or reduce the number of comparable samples. As an alternative approach, a pseudo count is often added to a zero value [30]. Pseudo counting complicates the interpretation when comparing samples with different percentages of zero values. In the multiplicative replacement, the component in the composition data is replaced by , as follows:
where k is the number of zero components and c is the constant sum of the compositional data. In this study, is defined as follows:
where N is the total number of features (e.g., OTUs).
2.4. Detection of Outliers in Relative Abundance Variations
Differential gene expression analyses such as DESeq2 and edgeR assume some invariable features, like the HKG expression level. However, these assumptions are probably inappropriate in highly variable microbial communities. The variation of the microbial community can change constantly with unexpected factors such as inter-individual differences, and it would be unrealistic to assume many invariable components.
We developed a new computational framework called BRaVO, based on the relative variation for each component (Figure 1). The source code implementing this framework is available at https://github.com/omics-tools/BRaVO. Our approach relatively evaluates the compositional variation based on the abundance. However, the standard deviation (or variance) is an unsuitable statistic to compare features with different component ratios. For example, the variance values of predominant microbial species tend to be much higher than those of minority microbial species. Thus, our framework uses the magnitude of the coefficient of variation as a measure of the relative taxonomic abundance change. In this study, we refer to the magnitude as the relative variation (). given by the following expression:
where x is the CLR-transformed count data for each of the features (OTUs), n is the number of samples, and is the mean value of x. Our method finds significant outliers for relative taxonomic composition changes, based on the Z-score. Here, we performed robust Z-score calculations without assuming normality in the distribution of . A robust Z-score is defined by the following expression:
where is the magnitude of the coefficient of variation of each feature (OTU) and is the median in all features (OTUs) within the same experimental conditions. is the normalized interquartile range (; 25–75 percentile range) associated with the standard normal distribution. The standard normal distribution with a mean of 0 and a standard deviation of 1 is given by the following probability density function:
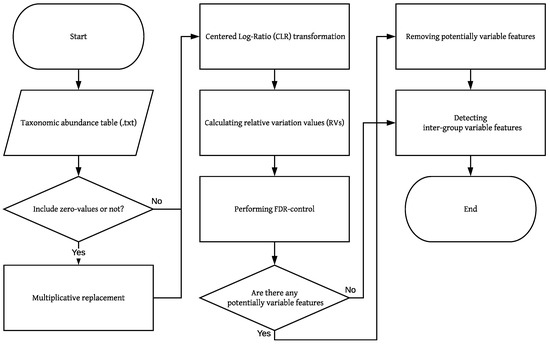
Figure 1.
Flowchart of BRaVO. This flowchart shows the logic of the BRaVO algorithm. The parallelogram means the input data. The rectangular box means the process or data manipulation. A diamond shape indicates a decision process. The taxonomic abundance table indicates the taxonomic count data obtained from OTU tables. A zero-value means the absence of observation in the taxonomic abundance table. Potentially variable features indicate outliers independent of grouping.
Therefore, is provided by the following expression:
These outliers are statistically evaluated based on p-values derived from the robust Z-scores using RV values. To considers the adjustment to the type I error (false positive), our framework also performs the Benjamini and Hochberg procedure [32]. This procedure adjusts p-values based on the false discovery rate (FDR). The FDR was used as the threshold level to detect outliers with significant compositional changes. In this study, we set the threshold level as 0.05 for this procedure.
However, some microbes may have compositional changes that are independent of the intervention. Their compositional changes may be caused by not the intervention but individual differences or sampling biases. To distinguish them from microbial species with compositional changes induced by the intervention, we describe them as potentially variable features. Similar to edgeR and DESeq2, BRaVO also analyzes samples by labeling them in some groups like before the intervention (e.g., PRE) and after the intervention (e.g., POST). Our framework considers microbial species with common compositional changes independent of grouping as potentially variable features. These potentially variable microbes are detected as features with shared variation among different experimental conditions, such as before and after the dietary intervention. Our framework assesses relative compositional variation in individual groups and then finds these features showing significant variation in all groups. BRaVO does not treat them as outliers with variation induced by changes in a certain experimental condition.
3. Results
3.1. Detected Outliers in Diet Intervention Trials
In the animal-based diet group, BRaVO, Edge R, and DESeq2 detected 28, 27, and 42 features as outliers, respectively (Table 1). Among these outliers, 21 outliers were detected only by our approach. Among these 21 outliers, 12 showed more than 2-fold changes in the composition of taxonomic abundance after the meal intervention (Table S1). The most reduced feature after the intervention was the percentage of Porphyromonas catoniae, which decreased by 11.23-fold. Interestingly, the genus Clostridium showed different compositional patterns according to the kind of species. In the animal-based diet group, the compositional ratio of C. paraputrificu increased by 7.60-fold, whereas that of C. sartagoforme decreased by 5.11-fold. Other outliers also showed interesting variations. For instance, the compositional ratio of Bifidobacterium longum decreased by 3.45-fold, and the compositional ratio of Lactococcus lactis increased by 2.34-fold after the animal-based meal.

Table 1.
Comparison of outliers detected by three methods. This table shows a summary of outliers detected by BRaVO, EdgeR, and DESeq2. Composition means the compositional percentages of outliers detected by each method. Outliers indicate the number of features with compositional changes in their taxonomic abundance.
In the plant-based diet group, BRaVO and DESeq2 detected 19 outliers and 1 outlier, respectively. EdgeR could not detect any significant outliers in this diet group. In our approach, 12 out of 19 outliers showed more than 2-fold changes in the composition of taxonomic abundance after the plant-based diet intervention (Table S2). In this diet group, Lactobacillus ruminis, Bifidobacterium catenulatum, and Acetobacterium carbinolicum increased by 24.61, 18.03, and 3.66-fold, as compared to before the plant-based diet. In contrast, Prevotella stercorea, Bacteroides fragilis, and Lactobacillus casei decreased by 9.05, 2.40, and 2.14-fold after the plant-based diet.
3.2. Composition of Detected Outliers
The outliers detected by our approach showed lower compositional rates than those of EdgeR and DESeq2. The average composition percentages of outliers detected by BRaVO, EdgeR, and DESeq2 were 0.017%, 0.250%, and 0.727%, respectively (Table 1). This table revealed that our approach showed higher sensitivity for minor compositional outliers than those of EdgeR and DESeq2. Furthermore, the distributions of the compositional percentages were apparently different among these three approaches. The composition percentages of outliers detected by BRaVO, EdgeR, and DESeq2 were in the ranges (min-max) of 0.00014–0.27178%, 0–4.34274%, and 0.00014–7.53432%, respectively (Figure 2).
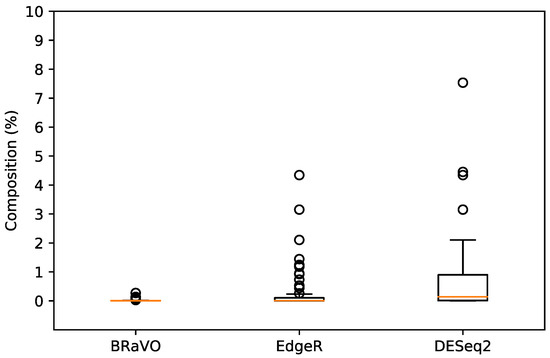
Figure 2.
Composition and distribution of outliers. This figure shows the compositional percentages of taxonomic abundance for outliers detected by BRaVO, EdgeR, and DESeq2. Horizontal lines inside these box plots are their median values. Lower and upper box limits are the 25th and 75th percentiles in their distribution. Less than 25th percentile and more than 75th percentile are shown as unfilled circles. The compositional percentages of outliers detected by BRaVO, EdgeR, and DESeq2 were in the range (min-max) of 0.00014–0.27178%, 0–4.34274%, and 0.00014–7.53432%, respectively.
In the animal-based diet group, EdgeR detected 8 zero-inflated features (Prevotella stercorea, Sphingobacteriaceae bacterium SOC A20(36), Erwinia pyrifoliae, primary endosymbiont of Sitophilus oryzae, Fusobacterium equinum, Enterococcus cecorum, Shigella sonnei, Escherichia albertii) that were not observed in all samples, but BRaVO and DESeq2 could not detect them as outliers. In the plant-based diet group, EdgeR could not detect any outliers and DESeq2 detected one outlier. In contrast, our method detected 19 features as outliers. In the plant-based diet, the outliers detected by BRaVO also showed a lower composition percentage than that of DESeq2, as in the animal-based diet group (Table 1).
3.3. Overlap of Detected Outliers
As a result of applying three differential abundance analyses to the empirical data reported by David et al., (2013), the outliers detected by BRaVO did not coincide completely with those detected by EdgeR and DESeq2 (Figure 3). In the animal-based dietary terms, BRaVO, EdgeR, and DESeq2 detected 28, 42, and 27 outliers, respectively (Figure 3). EdgeR and DESeq2 detected the same outliers at rates of 42.86% (18/42) and 66.67% (18/27). The outliers detected by BRaVO overlapped with those by EdgeR and DESeq2 at a rate of 21.43% (6/28). In the plant-based diet group, EdgeR could not detect any outliers and DESeq2 detected 1 outlier, whereas our approach detected 19 features as variable outliers. Interestingly, these outliers were not detected by EdgeR and DESeq2, and some detected features showed more than 2-fold compositional changes in the taxonomic abundance.
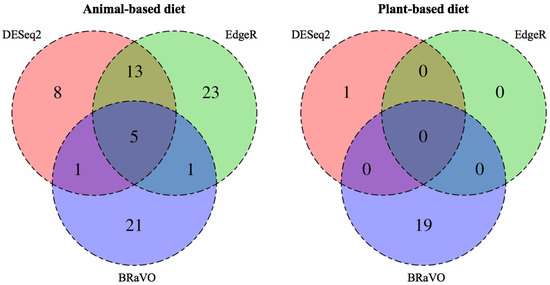
Figure 3.
Comparison among outliers detected by three differential abundance analyses. This diagram shows the overlap among outliers detected by EdgeR, DESeq2, and BRaVO. The number in each color shade shows the total amount of outliers detected by each method. In the animal-based diets, BRaVO, EdgeR, and DESeq2 detected 28, 27, and 42 outliers, respectively. Among these outliers, 21 were detected only by our approach. In the plant-based diet group, BRaVO and DESeq2 detected 19 outliers and 1 outlier, respectively. EdgeR could not detect any significant outliers in this diet group. Therefore, there is no overlap of detected outliers in the three methods.
4. Discussion
4.1. Detected Outliers
Among the three differential abundance analyses, only our approach detected two remarkable microorganisms that significantly changed after the animal-based diet. Lactococcus lactis underwent a significant compositional variation after the animal-based diet. Our result is consistent with the previous finding that the 16S rRNA gene expression level of L. lactis increased in the animal-based diet group [24]. Actually, L. lactis is abundant in dairy products, including cheese, and these products often accompany animal-based meals. In addition, Bacteroides clarus showed a significant compositional variation after the animal-based diet. This result is also consistent with the previous experimental observations that bile-tolerant microorganisms, such as the genus Bacteroides, showed significant increases in this diet group [24].
In the plant-based diet group, DESeq2 and EdgeR could barely detect any outliers. These two methods were not designed for zero-inflated and compositional data. Therefore, these features in the taxonomic abundance tables may affect the sensitivity of outlier detection. In contrast, our method detected 19 significant outliers in the plant-based diet group, and 11 of them showed more than two-fold changes in their compositions. Especially, the compositions of Lactobacillus ruminis and Bifidobacterium catenulatum showed notable changes of approximately 24- and 18-fold, respectively (Table S2). These results suggest that the plant-based meal influenced various kinds of gut microbes including minor components, even though it was a short-term diet. In addition, our approach detected the compositional changes of the genera Lactobacillus, Bifidobacterium, and Acetobacterium in the plant-based diet group (Table S2). These genera are considered to be related to the production of lactic acid, and this product can be consumed in the pathways for the biosynthesis of short chain fatty acids [33].
4.2. Detection of Minor Compositional Outliers
BRaVO, EdgeR, and DESeq2 have different features for the composition of detected outliers. EdgeR tends to detect zero-inflated features that are not observed in either of the comparison groups. In the animal-based diet group, 8 outliers detected by EdgeR were ultra-rare microorganisms that were not observed in the diet group. Therefore, this method may be affected by sampling biases that can produce non-observed features. In contrast, DESeq2 tends to detect outliers with more than 1% composition in the taxonomic abundance. Therefore, this method may be required for some pre-processing procedures for non-observed features in the taxonomic abundance. Although BRaVO can detect compositional changes in minor microorganisms with lower compositions, as compared to the other two approaches, our method is less susceptible to features with non-observed values. Therefore, our approach is effective to assess the compositional changes including rare components, without being affected by noise factors such as sampling biases.
We should consider that the taxonomic abundance data in the microbiome have the features of the composition data. The abundance data are subjected to a constant sum constraint. Therefore, the compositional changes of certain microbial species can affect the compositions of other microbial species. Our approach deals with this technical issue by using a centered log-ratio transformation. Our method can also capture the compositional changes of rare species by calculating the relative variation value in the taxonomic abundance data. In addition, the taxonomic abundance data from metagenome sequencing often include many zero values. BRaVO supports the existence of zero values in taxonomic abundance tables without changing the composition ratios, using the multiplicative replacement. Unfortunately, changes in features with rare compositions are often underestimated. Outlier detection for compositional variations of minor microbial species might shed light toward understanding microbial communities and their complex relationships.
Supplementary Materials
The following are available online at https://www.mdpi.com/2076-3417/9/7/1355/s1, Table S1: Summary of detected outliers in the animal-based diet, Table S2: Summary of detected outliers in the plant-based diet.
Author Contributions
Conceptualization, K.I. and S.A.; Methodology, K.I.; Investigation, K.I.; Resources, K.I.; Writing–Original draft preparation, K.I.; writing–review and editing, S.A.; visualization, K.I.; project administration, S.A.
Acknowledgments
We thank our lab members for helpful discussions. Especially, we appreciate Kego Ide for his expert advice.
Conflicts of Interest
The authors declare no conflicts of interest.
Abbreviations
The following abbreviations are used in this manuscript:
| NGS | Next-generation sequencing |
| OTUs | Operational taxonomic units |
| rRNA | ribosomal RNA |
| TMM | Trimmed mean of M values |
| HKGs | House keeping genes |
| RV | Relative variation |
| GMPR | Geometric mean of pairwise ratios |
| RLE | Relative log expression normalization |
| TSS | Total sum scaling |
| CLR | Centered log-ratio |
| NIQR | Normalized interquartile range |
| IQR | Interquantile range |
| FDR | False dicovery rate |
References
- Sunagawa, S.; Coelho, L.P.; Chaffron, S.; Kultima, J.R.; Labadie, K.; Salazar, G.; Djahanschiri, B.; Zeller, G.; Mende, D.R.; Alberti, A.; et al. Structure and function of the global ocean microbiome. Science 2015, 348, 1261359. [Google Scholar] [CrossRef] [PubMed]
- Bahram, M.; Hildebrand, F.; Forslund, S.K.; Anderson, J.L.; Soudzilovskaia, N.A.; Bodegom, P.M.; Bengtsson-Palme, J.; Anslan, S.; Coelho, L.P.; Harend, H.; et al. Structure and function of the global topsoil microbiome. Nature 2018, 560, 233–237. [Google Scholar] [CrossRef] [PubMed]
- Ottman, N.; Smidt, H.; de Vos, W.M.; Belzer, C. The function of our microbiota: Who is out there and what do they do? Front. Cell. Infect. Microbiol. 2012, 2, 104. [Google Scholar] [CrossRef]
- Saravanakumar, K.; Yu, C.; Dou, K.; Wang, M.; Li, Y.; Chen, J. Biodiversity of Trichoderma Community in the Tidal Flats and Wetland of Southeastern China. PLoS ONE 2016, 11, e0168020. [Google Scholar] [CrossRef]
- Hodkinson, B.P.; Grice, E.A. Next-Generation Sequencing: A Review of Technologies and Tools for Wound Microbiome Research. Adv. Wound Care 2015, 4, 50–58. [Google Scholar] [CrossRef] [PubMed]
- Scholz, M.B.; Lo, C.C.; Chain, P.S.G. Next generation sequencing and bioinformatic bottlenecks: The current state of metagenomic data analysis. Curr. Opin. Biotechnol. 2012, 23, 9–15. [Google Scholar] [CrossRef]
- Strickland, M.S.; Lauber, C.; Fierer, N.; Bradford, M.A. Testing the functional significance of microbial community composition. Ecology 2009, 90, 441–451. [Google Scholar] [CrossRef] [PubMed]
- Claesson, M.J.; Jeffery, I.B.; Conde, S.; Power, S.E.; O’Connor, E.M.; Cusack, S.; Harris, H.M.B.; Coakley, M.; Lakshminarayanan, B.; O’Sullivan, O.; et al. Gut microbiota composition correlates with diet and health in the elderly. Nature 2012, 488, 178–184. [Google Scholar] [CrossRef]
- Arumugam, M.; Raes, J.; Pelletier, E.; Le Paslier, D.; Yamada, T.; Mende, D.R.; Fernandes, G.R.; Tap, J.; Bruls, T.; Batto, J.M.; et al. Enterotypes of the human gut microbiome. Nature 2011, 473, 174–180. [Google Scholar] [CrossRef]
- Walter, J.; Ley, R. The human gut microbiome: Ecology and recent evolutionary changes. Annu. Rev. Microbiol. 2011, 65, 411–429. [Google Scholar] [CrossRef]
- Li, J.; Jia, H.; Cai, X.; Zhong, H.; Feng, Q.; Sunagawa, S.; Arumugam, M.; Kultima, J.R.; Prifti, E.; Nielsen, T.; et al. An integrated catalog of reference genes in the human gut microbiome. Nat. Biotechnol. 2014, 32, 834–841. [Google Scholar] [CrossRef] [PubMed]
- Cantarel, B.L.; Lombard, V.; Henrissat, B. Complex Carbohydrate Utilization by the Healthy Human Microbiome. PLoS ONE 2012, 7, e28742. [Google Scholar] [CrossRef] [PubMed]
- LeBlanc, J.G.; Milani, C.; de Giori, G.S.; Sesma, F.; van Sinderen, D.; Ventura, M. Bacteria as vitamin suppliers to their host: A gut microbiota perspective. Curr. Opin. Biotechnol. 2013, 24, 160–168. [Google Scholar] [CrossRef] [PubMed]
- Nicholson, J.K.; Holmes, E.; Kinross, J.; Burcelin, R.; Gibson, G.; Jia, W.; Pettersson, S. Host-Gut Microbiota Metabolic Interactions. Science 2012, 336, 1262–1267. [Google Scholar] [CrossRef]
- Shreiner, A.B.; Kao, J.Y.; Young, V.B. The gut microbiome in health and in disease. Curr. Opin. Gastroenterol. 2015, 31, 69–75. [Google Scholar] [CrossRef] [PubMed]
- Greenblum, S.; Turnbaugh, P.J.; Borenstein, E. Metagenomic systems biology of the human gut microbiome reveals topological shifts associated with obesity and inflammatory bowel disease. Proc. Natl. Acad. Sci. USA 2012, 109, 594–599. [Google Scholar] [CrossRef]
- Zackular, J.P.; Rogers, M.A.M.; Ruffin, M.T.; Schloss, P.D. The human gut microbiome as a screening tool for colorectal cancer. Cancer Prev. Res. (Philadelphia PA) 2014, 7, 1112–1121. [Google Scholar] [CrossRef]
- Lozupone, C.A.; Stombaugh, J.I.; Gordon, J.I.; Jansson, J.K.; Knight, R. Diversity, stability and resilience of the human gut microbiota. Nature 2012, 489, 220–230. [Google Scholar] [CrossRef]
- Duncan, S.H.; Louis, P.; Thomson, J.M.; Flint, H.J. The role of pH in determining the species composition of the human colonic microbiota. Environ. Microbiol. 2009, 11, 2112–2122. [Google Scholar] [CrossRef]
- Espey, M.G. Role of oxygen gradients in shaping redox relationships between the human intestine and its microbiota. Free Radic. Biol. Med. 2013, 55, 130–140. [Google Scholar] [CrossRef]
- Donaldson, G.P.; Lee, S.M.; Mazmanian, S.K. Gut biogeography of the bacterial microbiota. Nat. Rev. Microbiol. 2015, 14, 20–32. [Google Scholar] [CrossRef] [PubMed]
- Robinson, M.D.; McCarthy, D.J.; Smyth, G.K. edgeR: A Bioconductor package for differential expression analysis of digital gene expression data. Bioinformatics 2010, 26, 139–140. [Google Scholar] [CrossRef]
- Love, M.I.; Huber, W.; Anders, S. Moderated estimation of fold change and dispersion for RNA-seq data with DESeq2. Genome Biol. 2014, 15, 550. [Google Scholar] [CrossRef] [PubMed]
- David, L.A.; Maurice, C.F.; Carmody, R.N.; Gootenberg, D.B.; Button, J.E.; Wolfe, B.E.; Ling, A.V.; Devlin, A.S.; Varma, Y.; Fischbach, M.A.; et al. Diet rapidly and reproducibly alters the human gut microbiome. Nature 2013, 505, 559–563. [Google Scholar] [CrossRef] [PubMed]
- Wilke, A.; Bischof, J.; Gerlach, W.; Glass, E.; Harrison, T.; Keegan, K.P.; Paczian, T.; Trimble, W.L.; Bagchi, S.; Grama, A.; et al. The MG-RAST metagenomics database and portal in 2015. Nucleic Acids Res. 2016, 44, D590–D594. [Google Scholar] [CrossRef]
- DeSantis, T.Z.; Hugenholtz, P.; Larsen, N.; Rojas, M.; Brodie, E.L.; Keller, K.; Huber, T.; Dalevi, D.; Hu, P.; Andersen, G.L. Greengenes, a Chimera-Checked 16S rRNA Gene Database and Workbench Compatible with ARB. Appl. Environ. Microbiol. 2006, 72, 5069–5072. [Google Scholar] [CrossRef]
- Chen, L.; Reeve, J.; Zhang, L.; Huang, S.; Wang, X.; Chen, J. GMPR: A robust normalization method for zero-inflated count data with application to microbiome sequencing data. PeerJ 2018, 6, e4600. [Google Scholar] [CrossRef] [PubMed]
- Pawlowsky-Glahn, V.; Egozcue, J.J. Compositional data and their analysis: An introduction. Geol. Soc. Lond. Spec. Publ. 2006, 264, 1–10. [Google Scholar] [CrossRef]
- Van den Boogaart, K.G.; Tolosana-Delgado, R. “compositions”: A unified R package to analyze compositional data. Comput. Geosci. 2008, 34, 320–338. [Google Scholar] [CrossRef]
- Mandal, S.; Van Treuren, W.; White, R.A.; Eggesbø, M.; Knight, R.; Peddada, S.D. Analysis of composition of microbiomes: A novel method for studying microbial composition. Microb. Ecol. Health Dis. 2015, 26, 27663. [Google Scholar] [CrossRef]
- Martín-Fernández, J.A.; Barceló-Vidal, C.; Pawlowsky-Glahn, V. Dealing with Zeros and Missing Values in Compositional Data Sets Using Nonparametric Imputation. Math. Geol. 2003, 35, 253–278. [Google Scholar] [CrossRef]
- Benjamini, Y.; Hochberg, Y. Controlling the False Discovery Rate: A Practical and Powerful Approach to Multiple Testing. J. R. Stat. Soc. Ser. B 1995, 57, 289–300. [Google Scholar] [CrossRef]
- Koh, A.; De Vadder, F.; Kovatcheva-Datchary, P.; Bäckhed, F. From Dietary Fiber to Host Physiology: Short-Chain Fatty Acids as Key Bacterial Metabolites. Cell 2016, 165, 1332–1345. [Google Scholar] [CrossRef] [PubMed]


© 2019 by the authors. Licensee MDPI, Basel, Switzerland. This article is an open access article distributed under the terms and conditions of the Creative Commons Attribution (CC BY) license (http://creativecommons.org/licenses/by/4.0/).