From the experiment data, the analysis was conducted to investigate the relationship between cutting parameters and power consumption, and, thus, establish the regression equation using the polynomial regression method to achieve the purpose of optimizing machining efficiency and low power consumption.
4.1. Power Consumption Analysis without Cutting Load
According to the experiment scheme in the previous section, the experimental data can be divided into spindle and three servo motors. In the spindle experiments, six machining parameters were taken from 500 to 3000 rpm, with an increasing step every 500 rpm. The power consumption for each spindle speed parameter is shown in
Figure 4. The experiment 1 to 3 and 4 to 6 were measured on different dates. It showed each power consumption value is very close to each other, around 0.00006 to 0.00009 kW. The power consumption does not significantly increase when the spindle speed increases. The reason is perhaps that the spindle is only in the idle state rather than the cutting state, so there is no cutting resistance, hence, increasing the spindle speed will not significantly affect the spindle power consumption.
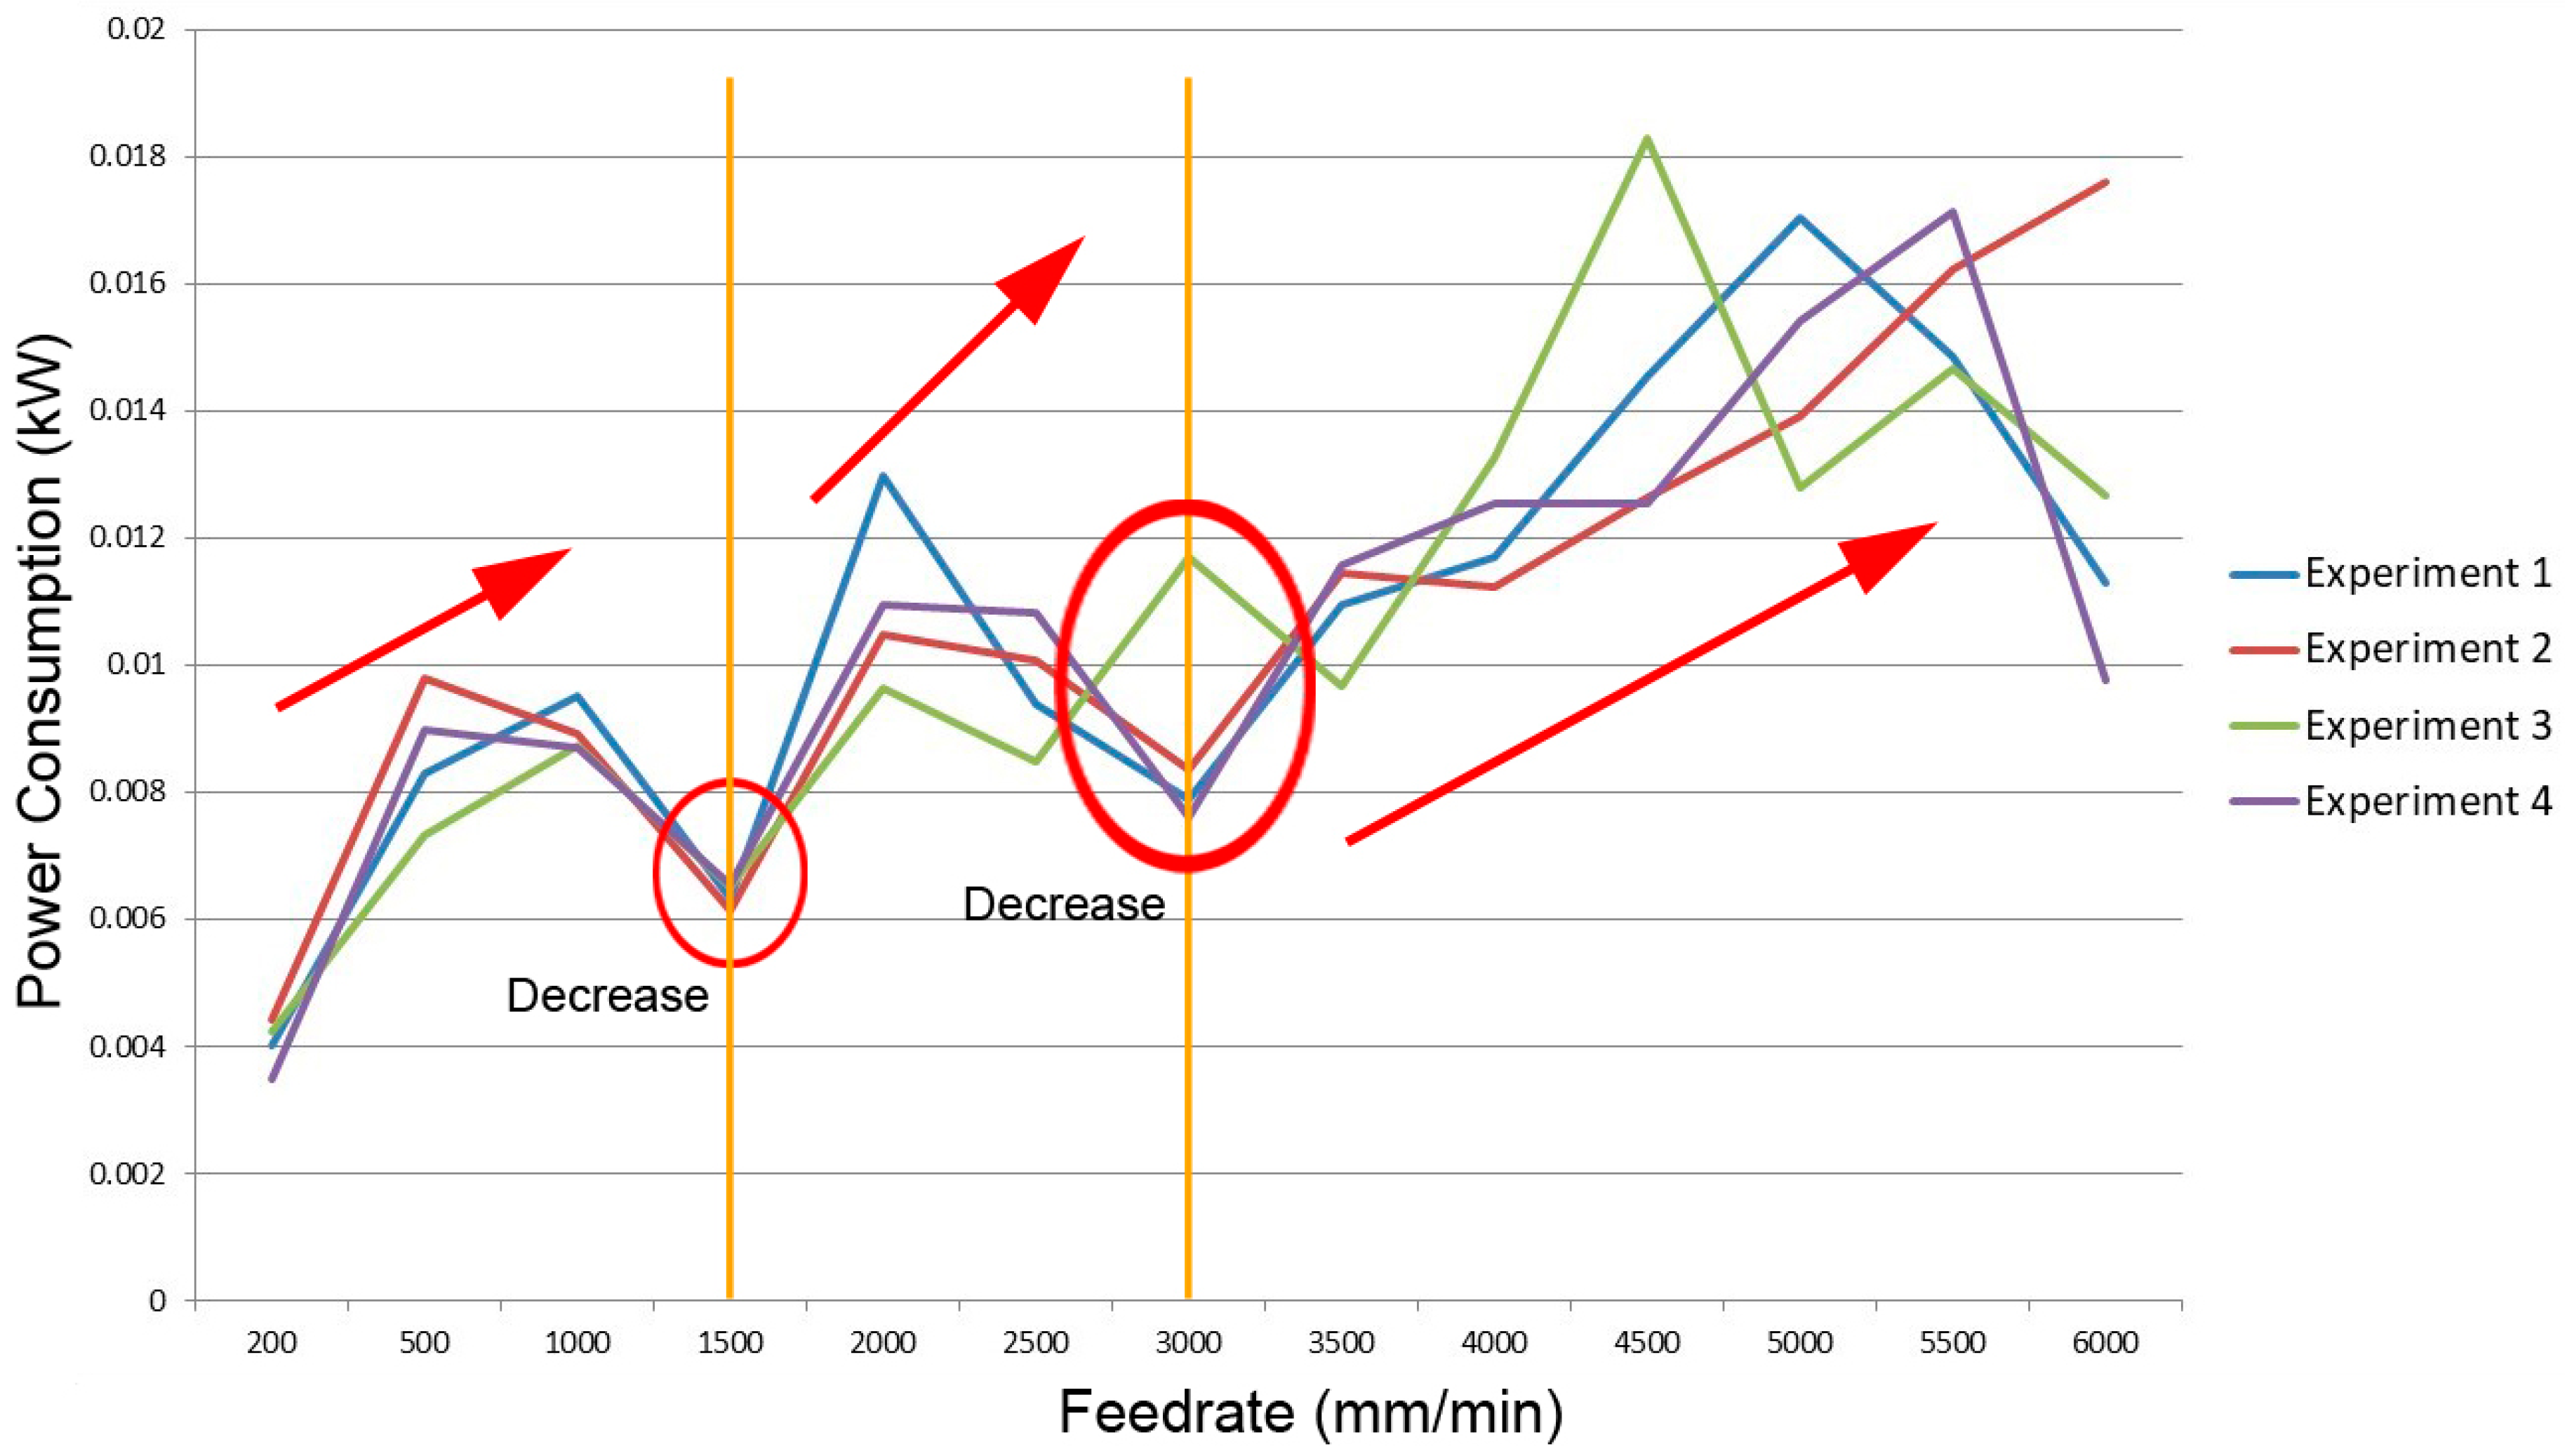
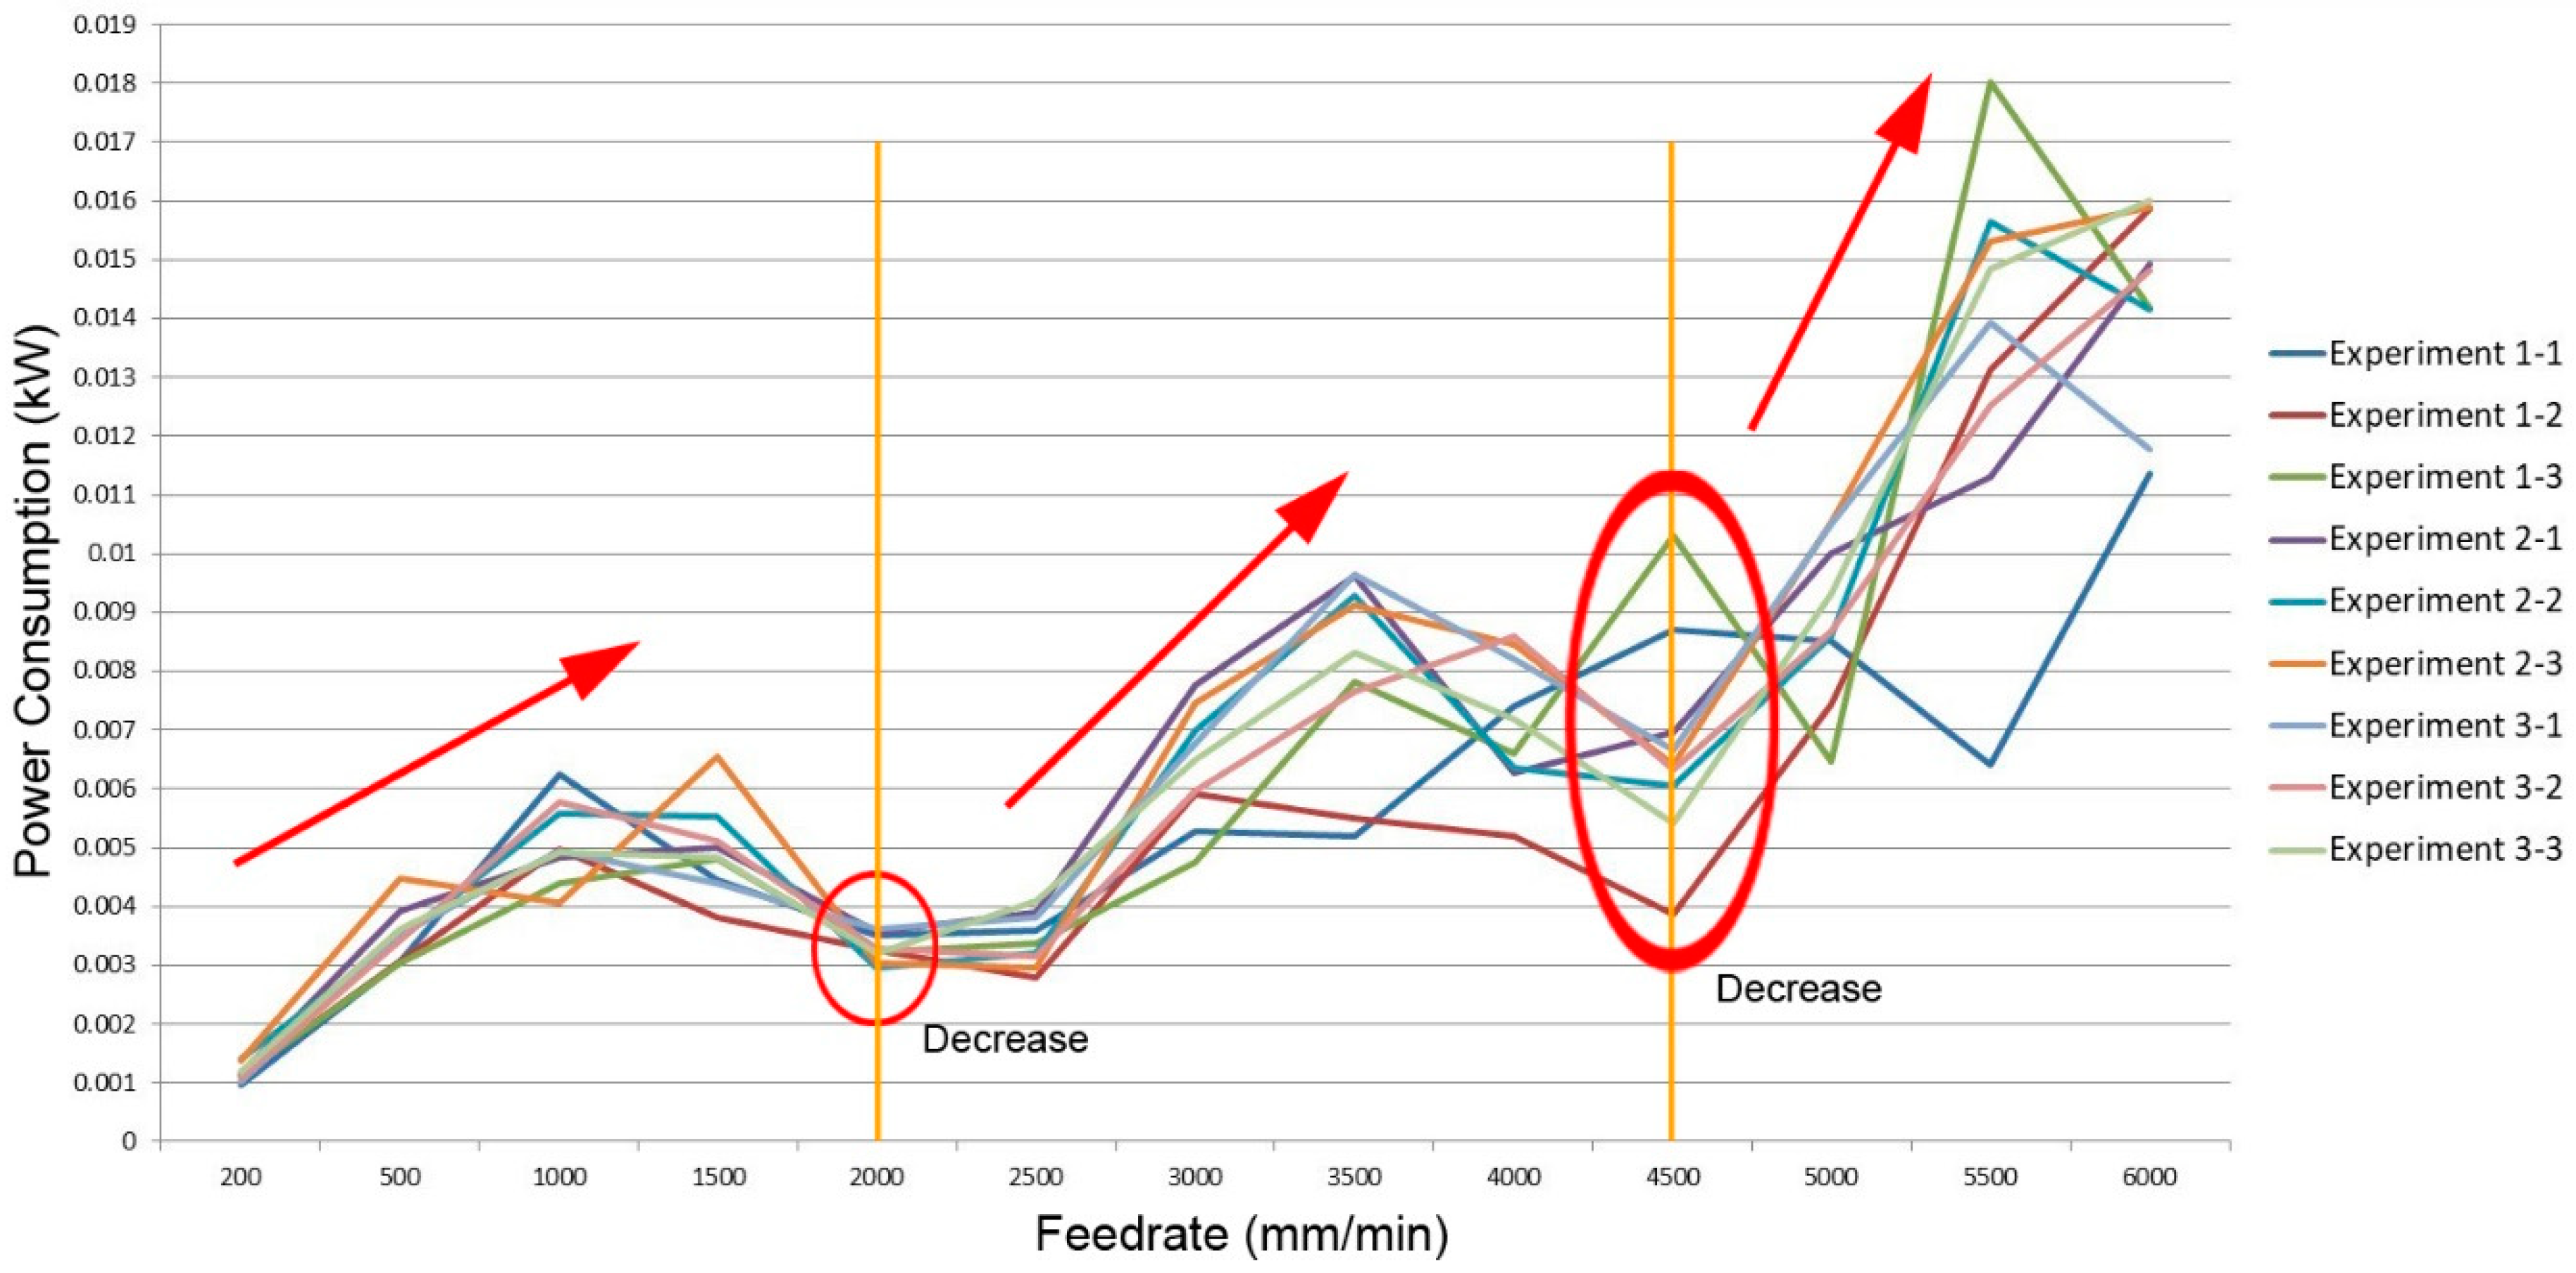
For X-axis servo motor, 13 combinations of feedrate were carried out from 200 mm/min until 6000 mm/min. The ommencinh feedrate was 200 mm/min and after 500 mm/min, the feedrate was increased every 500 mm/min up to 6000 mm/min.
Figure 5 shows the resulting power consumption for different feedrates. The experiment was repeated three times, and the results were reproducible. However, only a few of data showed a difference of about 0.005 kW, even at the feedrate of 4500 mm/min, the maximum difference was 0.01 kW. As seen in
Figure 5, the power consumption increase rate is about 0.00125 kW per 500mm/min when the feedrate is 200 to1500 mm/min, but at feedrate of 2000 mm/min it reduces. When the feedrate is in the range of 2000 to 4000 mm/min, the power consumption trend is higher with an increase rate of about 0.0025 kW per 500 mm/min. However, at the feedrate of 4000 mm/min the power consumption is significantly reduced, but in the feedrate range of 4500 to 6000 mm/min the power consumption rises quickly with increasing value of 0.005 kW per 500 mm/min. The increasing trend is higher than the first two feedrate sections. It can be concluded that increasing feedrate will increase power consumption, but when the feedrate is 2000 mm/min and 4500 mm/min the power consumption is lower. Moreover, it recommends to use these two feedrates to obtain lower power consumption.
Since the power consumption at the feedrate of 4500 mm/min is large, this data is excluded in the average calculation.
Figure 6 shows the average calculation result, and each section regression equation can be obtained as follow:
For Y-axis servo motor, the parameter is similar to X-axis servo motor experiment, commencing at 200 mm/min and rising to 6000 mm/min with an increasing step of 500 mm/min.
Figure 7 shows the relationship Y-axis motor upward direction with power consumption for different feedrates. It is seen the power consumption rate for feedrate range 200 to 1000 mm/min is about 0.0025 kW per 500 mm/min but smaller at a feedrate of 1500 mm/min. When the feedrate range is between 1500 and 2000 mm/min the power consumption increase rate is 0.005 kW per 500 mm/min, but a feedrate of 2500 to 3000 mm/min exhibits a decreasing trend. When the feedrate is between 3000 and 5500 mm/min the power consumption gradually increases from 0.008 kW up to 0.015 kW. From the results, the power consumption tends to increase with feedrate increase, but a feedrate of 1500 mm/min, 3000 mm/min, and 6000 mm/min showed lower power consumption. Therefore, these three feedrates can be considered to obtain lower power consumption without decrease machining efficiency.
Figure 8 shows the power consumption of Y-axis motor downward direction. It is seen the power consumption at a feedrate of 200 mm/min and 500 mm/min is greater than the feedrate of 1000 to 3500 mm/min. This perhaps is due to the influence of spindle weight. To maintain the low feedrate, the current must be increased to overcome the impact of spindle weight. When the feedrate is over 3500 mm/min, the power consumption increases with the increasing rate of 0.002 kW per 500 mm/min. As seen in
Figure 8, the feedrate range of 1000 to 3500 mm/min provided lower power consumption without loss of machining efficiency, so this feedrate range can be considered for machining. Compare to up direction power consumption, the down direction power consumption is lower. This is because more power is needed to overcome spindle weight during toward up.
Figure 9 shows the average calculation of Y-axis up direction power consumption, then the regression equation can be obtained as follows: Equation (6) for a feedrate of 500 to 1500 mm/min, Equation (7) for a feedrate of 1500 to 2000 mm/min, and Equation (8) for a feedrate of 2000 to 6000 mm/min.
Figure 10 shows the average calculation of Y-axis down direction power consumption, and the regression equation can be obtained as follows: Equation (9) for a feedrate of 500 to 3500 mm/min, and Equation (10) for a feedrate of 3500 to 6000 mm/min.
Regarding Z-axis servo motor, the experiment parameters are similar to X- and Y-axis, 13 parameter combination feedrates from 200 mm/min up to 6000 mm/min with increasing step 500 mm/min.
Figure 11 shows the experiment results for different feedrates. As seen, the results are mostly reproducible. Only a few of the data have a 0.005 kW difference, such as at the feedrate of 5500 the difference is 0.012 kW. As seen in
Figure 11, the power consumption rate at a feedrate of 200 to 1500 mm/min is 0.001 kW per 500 mm/min, but at a feedrate of 2000 mm/min the power consumption is decreased. When the feedrate range is 2500 to 3500 mm/min, the power consumption rate increases about 0.002 kW per 500 mm/min. When the feedrate is 4000 mm/min and 4500 mm/min, the power consumption is reduced, but at a feedrate range of 4500 to 6000 mm/min the power consumption rate increase is about 0.003 kW per 500 mm/min. It can be seen that the overall power consumption tends to increase with the increasing feedrate, but at a feedrate of 2000 mm/min, 2500 mm/min, 4000 mm/min, and 4500 mm/min the power consumption is lower. These feedrates can be considered as the machining parameter to obtain lower power consumption without production efficiency loss.
Since the power consumption at a feedrate of 5500 mm/min has a larger difference, it will be excluded from the average calculation analysis.
Figure 12 shows the average calculation result, and the regression equation of each section can be obtained as follow: Equation (11) for a feedrate of 500 mm/min to 2000mm/min, Equation (12) for a feedrate of 2000 to 4500 mm/min, Equation (13) for a feedrate of 4500 to 6000 mm/min.
As seen in
Figure 12, when the feedrate is 500 mm/min, the power consumption is 0.004 kW. If the feedrate is increased to 1500 mm/min, the power consumption is 0.005 kW. When the feedrate increases to 3000 mm/min, the power consumption is 0.006 kW. If in the beginning, the machining used a feedrate of 500 mm/min, the power consumption is 0.004 kW per second, so for an hour the power consumption 0.004 kW/sec X 3,600 sec/hr = 14.4 kWh. When the machining feedrate is 1500 mm/min for which the machining efficiency increases three times, the power consumption is 0.005 kW/sec X 3,600 sec/hr = 18 kWh. When the machining feedrate is 3000 mm/min for which the machining efficiency increase six times, the power consumption is 0.006 kW/sec X 3,600 sec/hr = 21.6 kWh. If we assume for a feedrate of 500 mm/min, the machining time needed is half an hour, the power consumption is 0.5 hr X 14.4 kWh = 7.2 kWh. If we use the feedrate of 1500 mm/min, the machining time needed is 10 min, then the power consumption is 3 kWh. Hence, compared to a feedrate of 500 mm/min, the power saving is 4.2 kWh and also the machining time is three times faster.
4.2. Power Consumption Analysis with Cutting Load
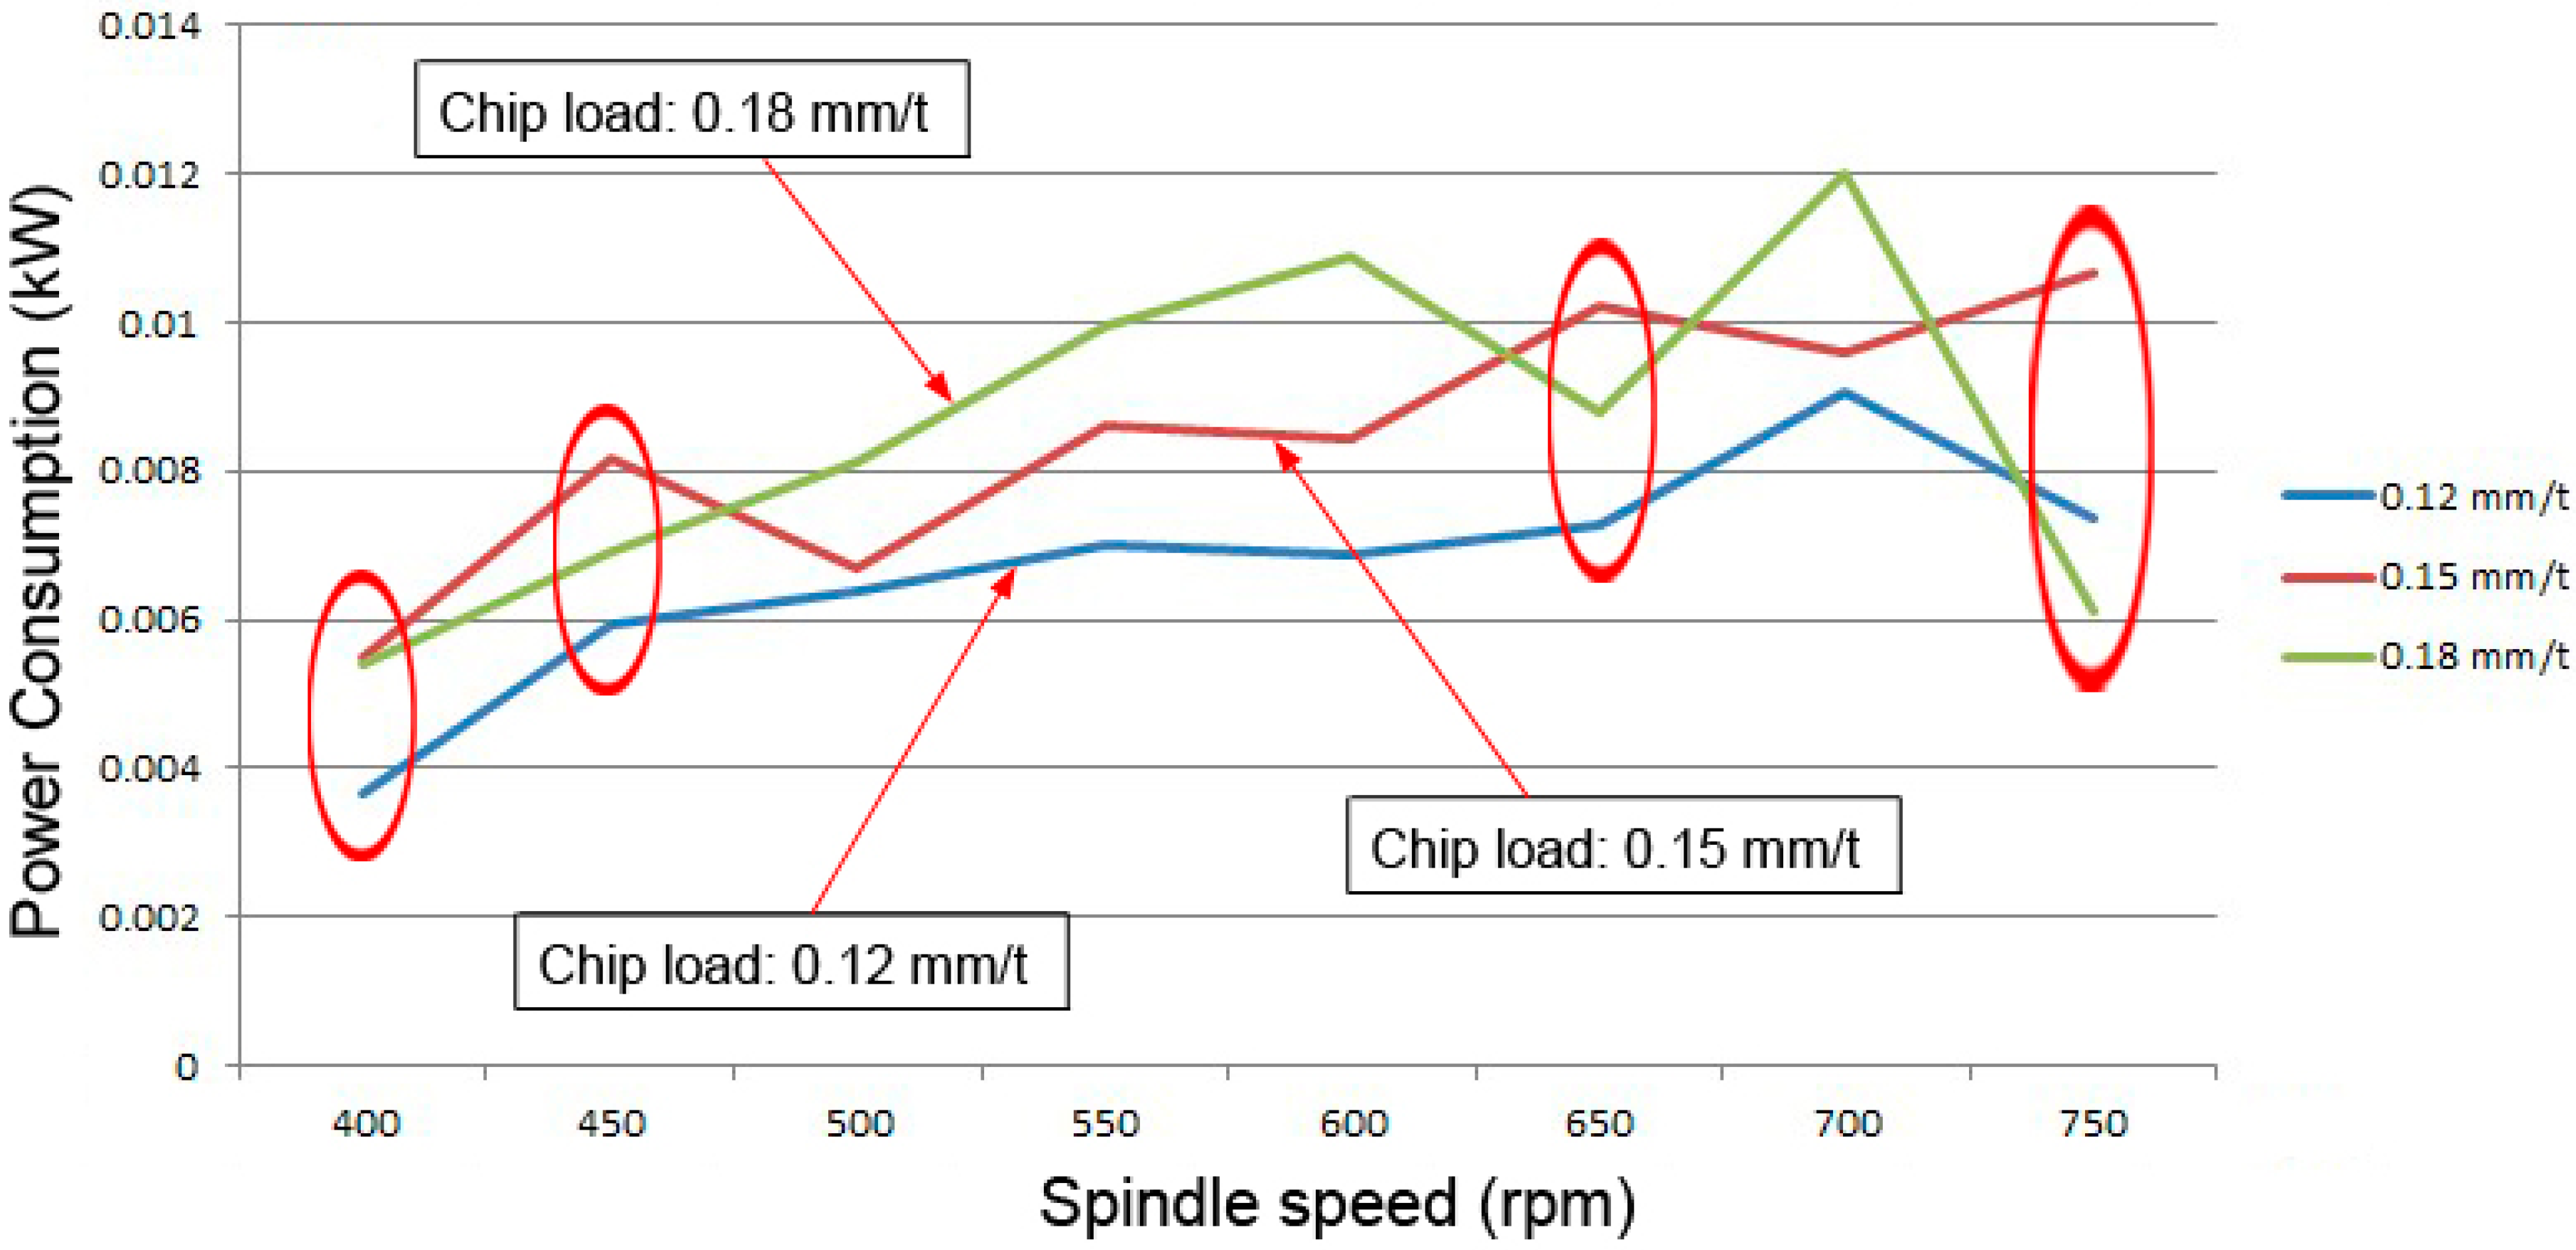
Since the experiment under cutting condition was repeated five times for each parameter, the average result will be used in the analysis. The result of experiment 1 is shown in
Figure 13. The power consumption trend of X-axis motor for different chip loads is seen. Under the same spindle speed, a higher chip load (0.18 mm/t) did not consume higher power than the other two smaller chip loads. For eight different spindle speeds, there are four power consumptions of the 0.18 mm/t chip load smaller than the power consumption of the 0.15 mm/t chip load. Under the fixed spindle speed, the feedrate determines the chip load. Similarly, to maintain the same chip load, the feedrate must be proportional to the spindle speed. The chip load not only determines the spindle cutting load but also influences power consumption. The results do not exhibit significant affection for spindle power consumption due to the small difference of chip load.
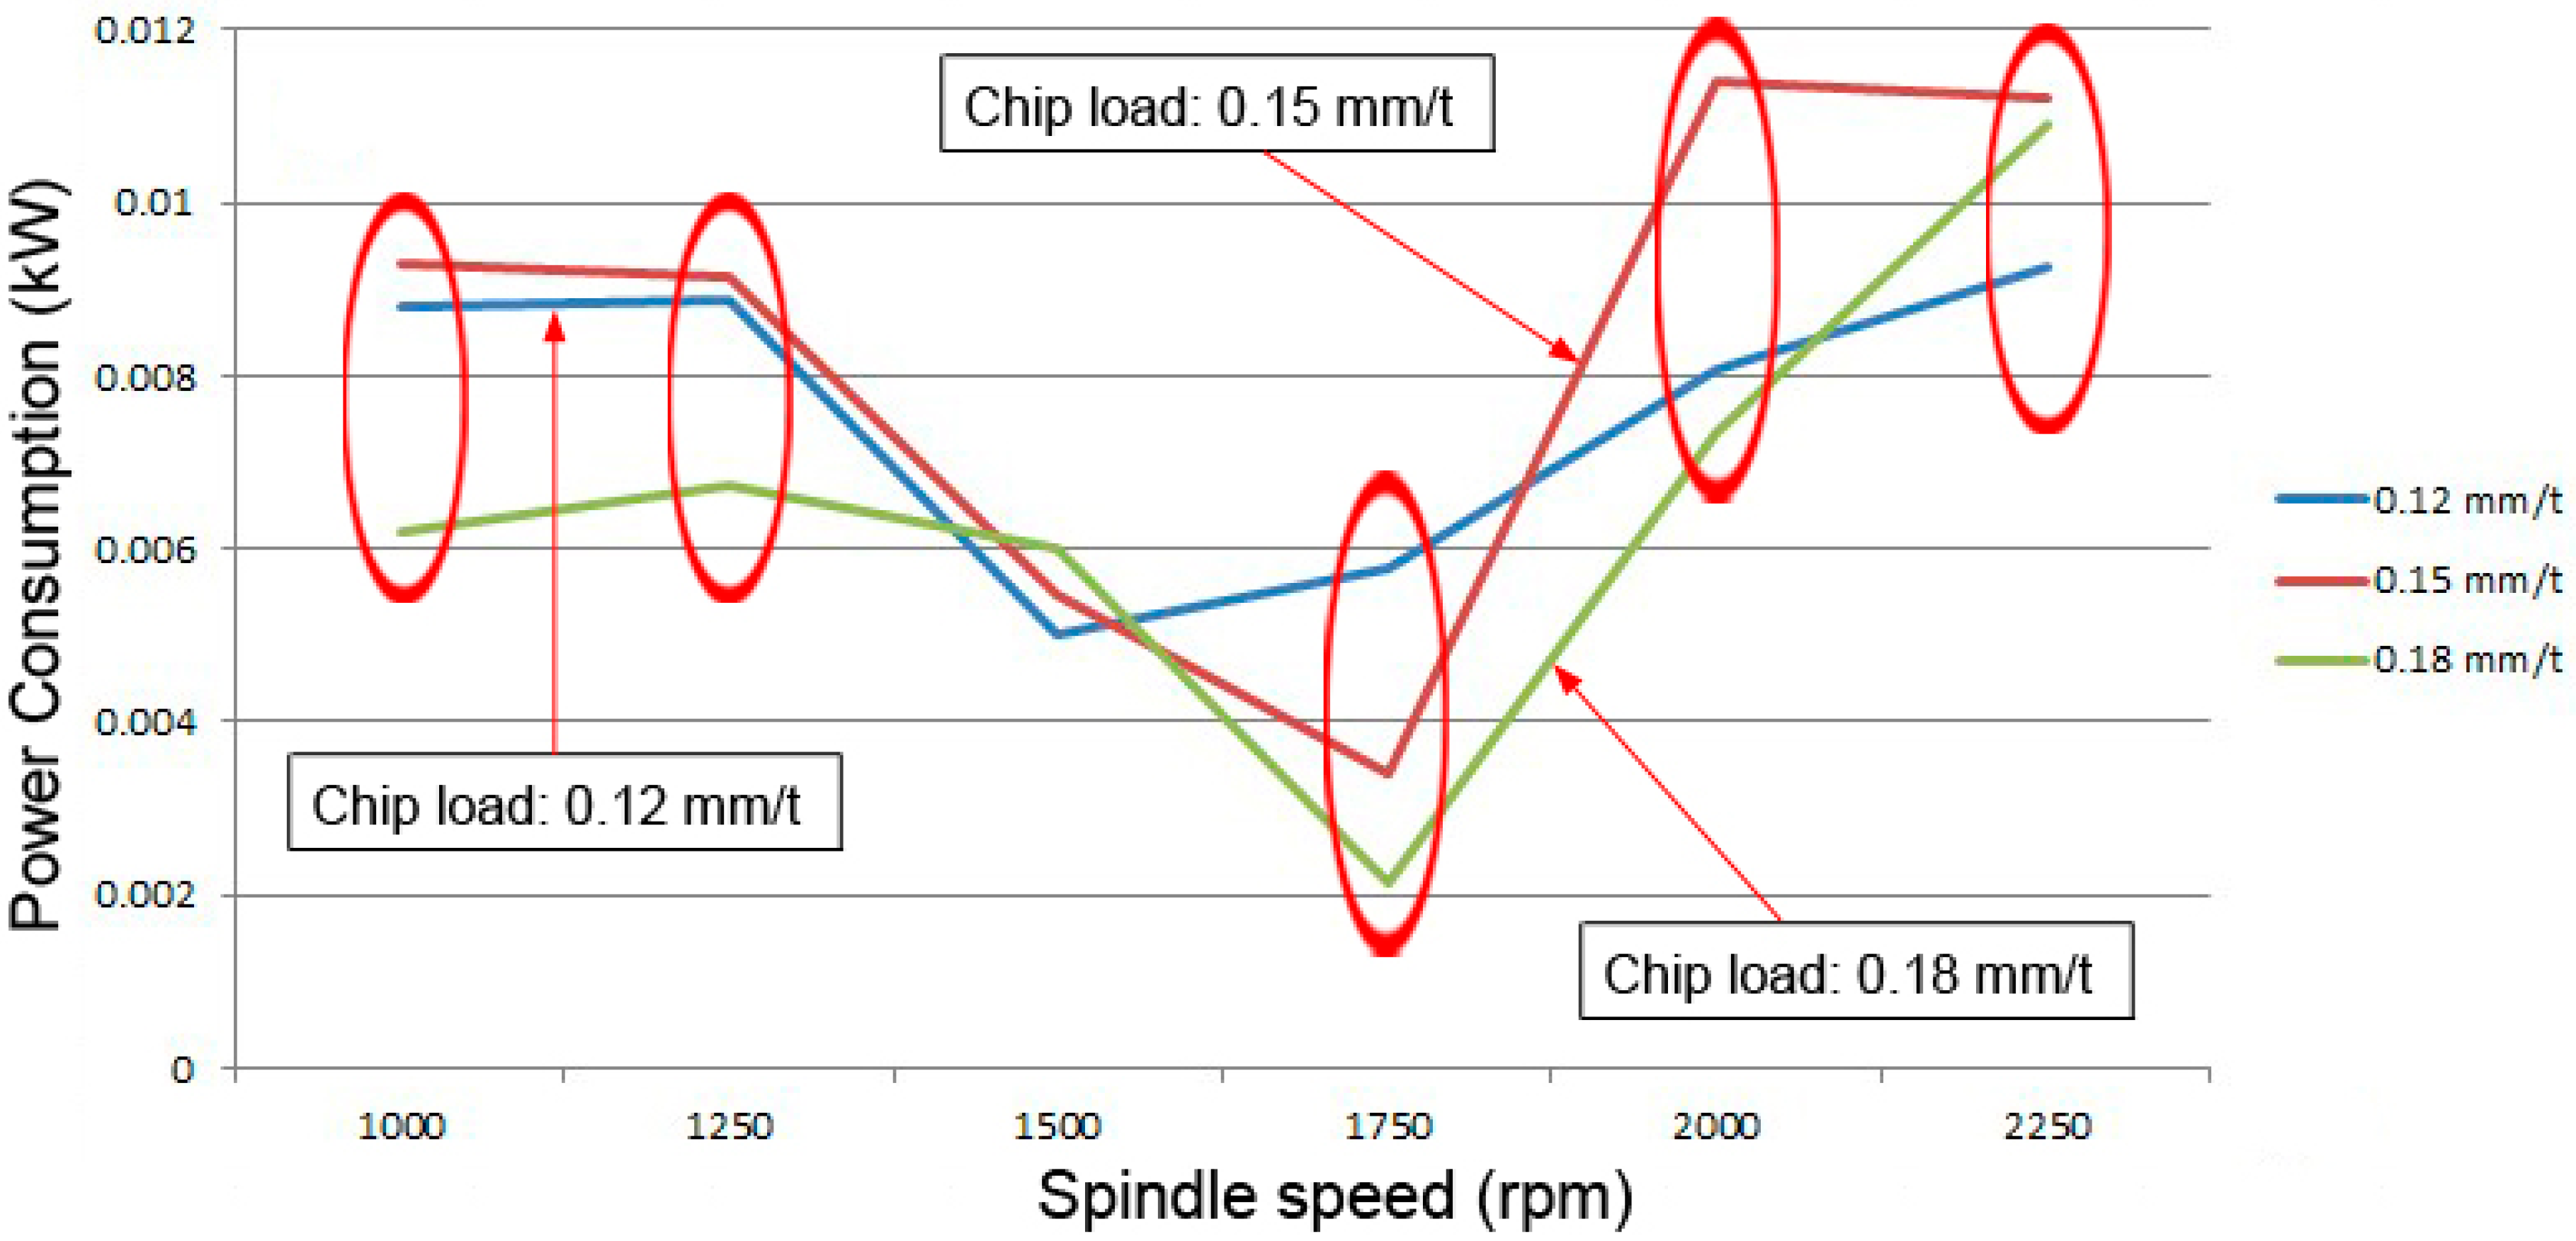
In experiment 2, a larger interval of spindle speed was used to obtain a larger feedrate difference and observe the power consumption characteristic of the feedrate servo motor. The power consumption results of experiment 2 are shown in
Figure 14. It is seen, even when the spindle speed was increased to 1000 to 2250 rpm with the maximum feedrate of 270 mm/min, the power consumption of chip load of 0.18 mm/t is smaller than chip load of 0.12 mm/t and 0.15 mm/t. This is perhaps due to the width of cut 20 mm which has reached 80% of cutter diameter that is classified as heavy cutting, thus, generating large cutting resistance. Hence, the motor power consumption is increased. In addition, when the spindle speed was 2250 rpm and the feedrate 1620 mm/min, a spark was appearing during the cutting process, so it is not appropriate to increase the feedrate.


