Article

Three-Motorized-Stage Cyclic Stretching System for Cell Monitoring Based on Chamber Local Displacement Waveforms

1
Micro/Nano Technology Center, Tokai University, 4-4-1 Kitakaname, Hiratsuka-city, Kanagawa 259-1292, Japan
2
Graduate School of Life Science and Systems Engineering, Kyushu Institute of Technology, Kitakyushu 808-0196, Japan
*
Authors to whom correspondence should be addressed.
Those authors contribute equally to this paper.
Appl. Sci. 2019, 9(8), 1560; https://doi.org/10.3390/app9081560
Submission received: 14 March 2019 / Revised: 30 March 2019 / Accepted: 10 April 2019 / Published: 15 April 2019

Abstract

:
Researchers have developed a cell stretching device to mimic the in vivo mechanical environment in vitro in order to investigate cell mechanotransduction. Cyclic stretch is involved in lengthening and relaxation phases. Cells may respond to mechanical stimulation rapidly within a few seconds, and sudden disruption of cell cytoskeletons may also occur at any point in any phase of cyclic stretch. However, until now, no research has been done to establish a method of collecting cell images at the two phases of cyclic stretch. Because image processing is time-consuming, it is difficult to adjust focus and collect high-resolution images simultaneously at the two phases during the process. In this study, a three-motorized-stage system was developed to meet the requirements. The results demonstrated that linear compensation is effective for cell imaging, and it is applicable to have a feed-forward control method without image processing. A method was then developed to determine the maximum displacement of the target in the horizontal and vertical directions, and the linear compensation waveforms were designed using the C program automatically and immediately before stretching. Further, the cyclic stretch was applied to cells using the three motorized stages, and clear phase-contrast cell imaging (30 fps) were obtained almost at any point in time. Detailed cell changes such as sudden disruption of cell–cell junctions, not only long-term cell response, were observed. Therefore, our study established a methodology to greatly improve the time resolution of imaging of cyclic stretch for the research of detailed cellular mechanotransduction.

1. Introduction

Cells in vivo are exposed to various mechanical forces [1,2,3,4,5]. For example, endothelial cells, which line the interior surface of blood vessels and lymphatic vessels, are mainly exposed to three types of mechanical forces: (1) shear stress caused by blood shear flow; (2) cyclic stretch results from vasodilation; and (3) hydrostatic pressure from blood pressure [6,7]. In vivo cells sense mechanical forces and have appropriate morphological responses, which plays an important role in health maintenance. For example, it has been reported that atherosclerosis is always located at the bifurcation of the artery, where the mechanical forces and cell morphology are different from those in uniform linear blood vessels [8,9]. Over the past 30 years, many researchers have attempted to study the mechanisms by which cells perceive and respond to mechanical forces, which may provide new types of drug targets that are different from those discovered from chemical methods [10,11,12].
Cyclic stretch is an in vitro method to investigate the influence of mechanical forces on a population of cells [13,14]. Figure 1a shows a diagrammatic sketch of a typical cell cyclic stretch system. Dimethylpolysiloxane (PDMS) is usually used as the material for the membrane in the commercially available stretch chamber, because it is deformable, biocompatible, and optically transparent [4,15,16]. At the beginning of the experiments, cells are cultured on an elastic membrane for 24 hours or longer before exposure to cyclic stretch, a process that enables the cells to adhere firmly onto the membrane [14,17,18,19]. After that, the stretch chamber filled with 1~2-mL cell culture medium was set to one or two motorized stages, which cyclically stretched the chamber according to the experimental design of researchers [20].
The role of cyclic stretching in cell behavior was investigated through real-time visualization of the morphology of living cells and the internal structures during the process of cyclic stretching, because the cellular response to mechanical forces is a process ranging from less than 1 second to several days [21,22,23,24,25,26,27]. It has been reported that the size of focal adhesions in vascular smooth muscle cells increased significantly after exposure to cyclic stretch for 2 min [28]. Goldyn et al. recorded cell behaviors every 5 min during an experimental process of 115 min and found that, when they measured the activity of RhoA (a small guanosine triphosphatase (GTPase) protein), it increased significantly after exposure to cyclic stretch for 10 min compared to that in the initial state [29]. Naruse et al. pointed out that the kinase activity of c-src increased and peaked at 15 min after an application of uni-axial cyclic stretch in human endothelial cells [30]. On the other hand, it has been reported that cells had an immediate viscoelastic response after exposure to mechanical forces, and had adaptive behavior within 15 s, or a shorter time (less than 1 s) [31,32,33,34]. It is not possible to obtain the rapid responses of cells to mechanical cyclic stretching by using phenomena observed at discrete time points. Further, instead of gradual cell changes, quick structural disruption, such as the sudden disassociation of a actin-myosin apparatus, may occur at any time point during the periods of experiments [35], the imaging timing cannot be designed prior to the experiments. Therefore, it is useful to improve the time resolution to figure out the continuous or sudden cell responses under cyclic stretch. In addition, a cyclic stretch system for real-time imaging without stopping the system is useful in studying the mechanical dynamics of some cellular components that are not suitable for immobilization, such as Ca2+ and phospholipids [36,37,38].
Even today, the details of cell rapid responses induced by cyclic stretch have not been fully understood. Part of the reason is that it is difficult to observe the cells in real time, or the time of occurring during the stretching experiment is unexpected. As shown in Figure 1b, the cell culture medium may subtly influence the bottom surface of the elastic membrane because of its gravity. When stretched, the target on the membrane moves horizontally out of the field of view of the microscope. Therefore, previous studies have attempted to design a cyclic stretch system that compensates the movement in the horizontal direction [16,38,39,40]. Huang et al. developed a system for cell cyclic stretch, and time-lapse images of cells were acquired every 3 min after the motor was held at the stretched position for ~30 s [39]. Similarly, Wang et al. designed a stretch system using PDMS membrane and a vacuum chamber. Upon the application of vacuum, the elastic membrane stretched and moved closer to the bottom glass slide and living cell images were obtained after relaxing the cells to their original state [38]. However, from the previous studies, we know that the bottom surface has a vertical shift, which always results in out-of-focus images. Furthermore, the vertical shift could not be deleted even when researchers tried to fabricate and use a micro-scale chamber [41,42]. Therefore, in order to record a real-time movie of cells exposed to cyclic stretch during each cycle of cyclic stretching, it is necessary to consider the displacement trajectory of the stretch chamber in the vertical direction at each time point to control the motorized stage in real time.
To solve this problem, we measure the displacement characteristics of a stretch chamber, and newly propose a methodology to establish a cell cyclic stretch system. By using the technique that can track the target, such a stretch system can perform on-line cell observation during each cycle of cyclic stretching. Through the basic experiments, the performance of the developed system was confirmed. By using our method, the position of the target cell is maintained under the microscope, and the deformed cells are easily monitored even in a dynamic state in which a high magnification lens is used. A part of this work has been reported as a proceeding of a conference [43].

2. Materials and Methods

2.1. Required Specifications

Shift compensation in the horizontal and vertical direction in real-time without manual compensation is required. As shown in Figure 1b, the stretch chamber is stretched in the horizontal direction to mimic the mechanical stretch in vivo. Under the stretching, it is difficult to continuously observe the targeted single cell, since the position of the cell is moved out from the field of view of the microscope. Further, the trajectory of the vertical displacement is unknown during the lengthening–holding–relaxation cycle (Figure 1b,c), which must be compensated for the high-resolution imaging at any time point during the experiments. Conventional systems only focus on imaging before or after the experiments or during the lengthening/relaxation phases, and imaging was only possible at the desired time point. Therefore, a system capable of real-time compensation is required to achieve cell monitoring with a high time resolution.

2.2. Design of the Cyclic Stretch System

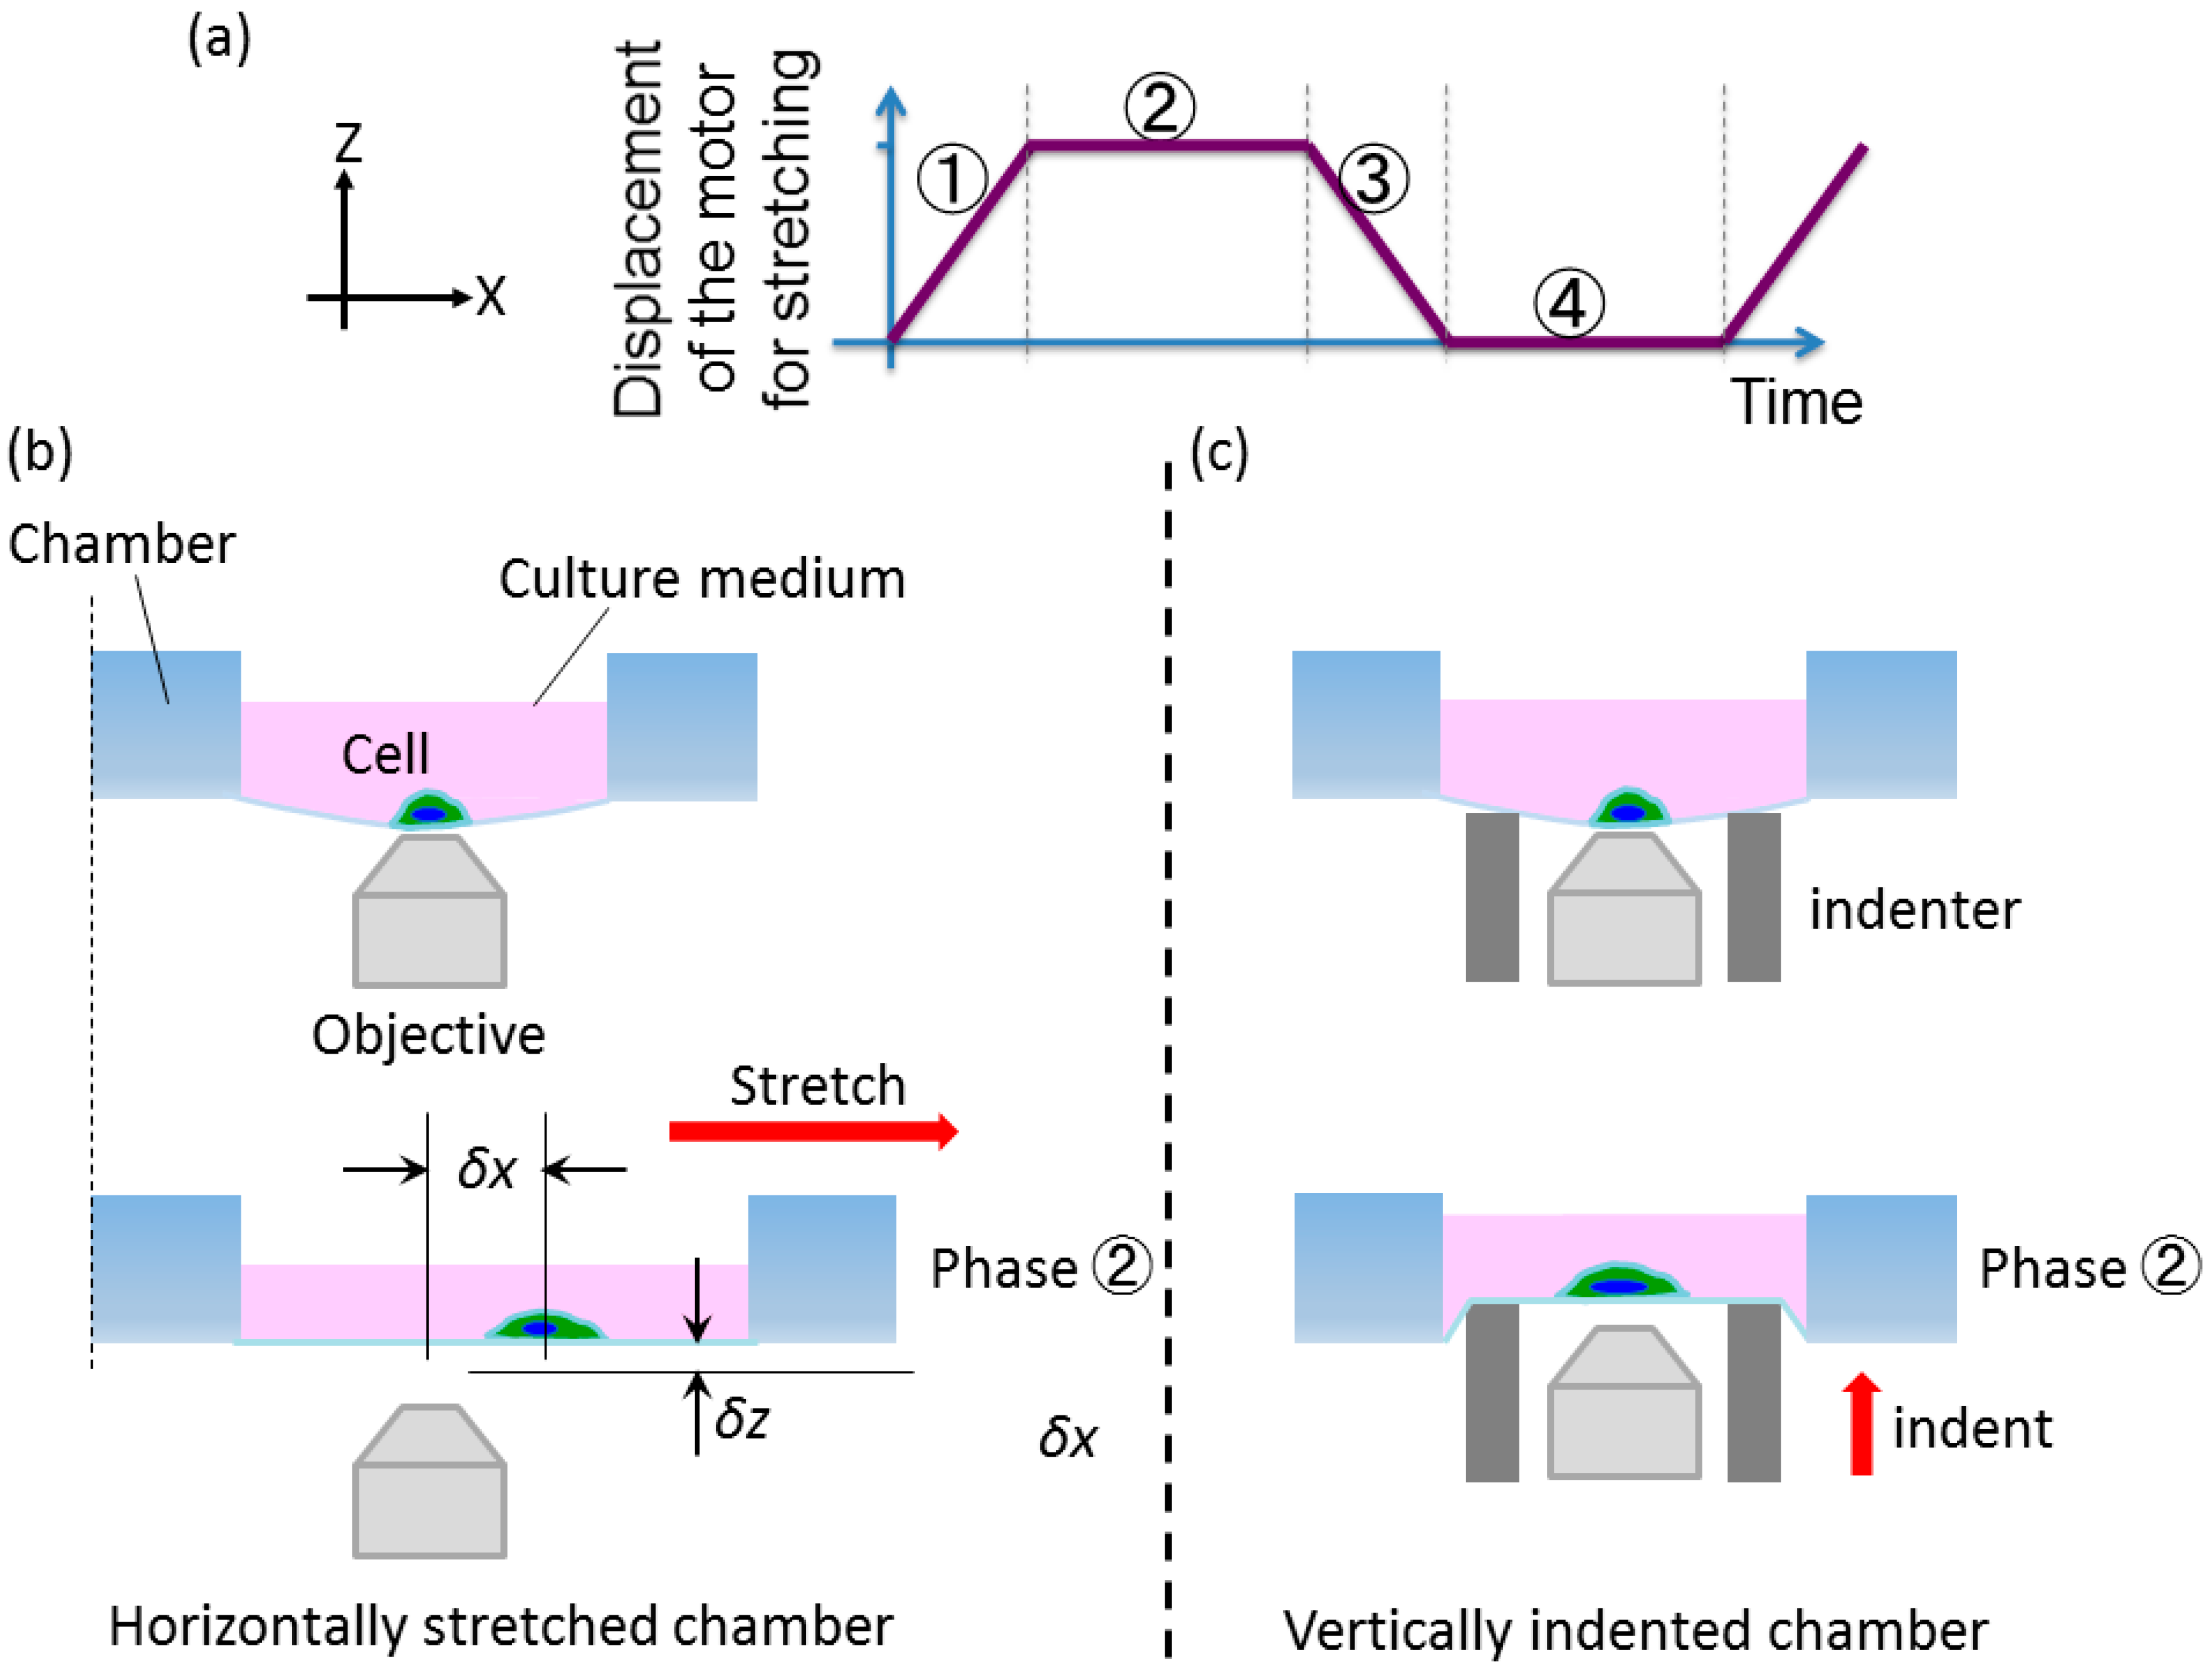
2.2.1. Basic Concept

We tried to observe the dynamic behavior of cells exposed to cyclic stretch in real-time during each cycle of cyclic stretching without stopping the system. Therefore, to have on-line observation, the displacement δx (horizontal) and δz (vertical), as shown in Figure 1b, must be accurately compensated at every time point. To compensate the δx and δz, we fixed the stretching stage to the other X- and Z-stage, as shown in Figure 2a. A displacement of the chamber is created when the chamber is stretched by stage 1 in the horizontal direction (x-direction). In order to cancel the displacement, stage 2 is moved in the opposite direction, as shown in Figure 2b. Meanwhile, for the purpose of maintaining the focal point of the microscope, stage 3 is also moved accordingly.

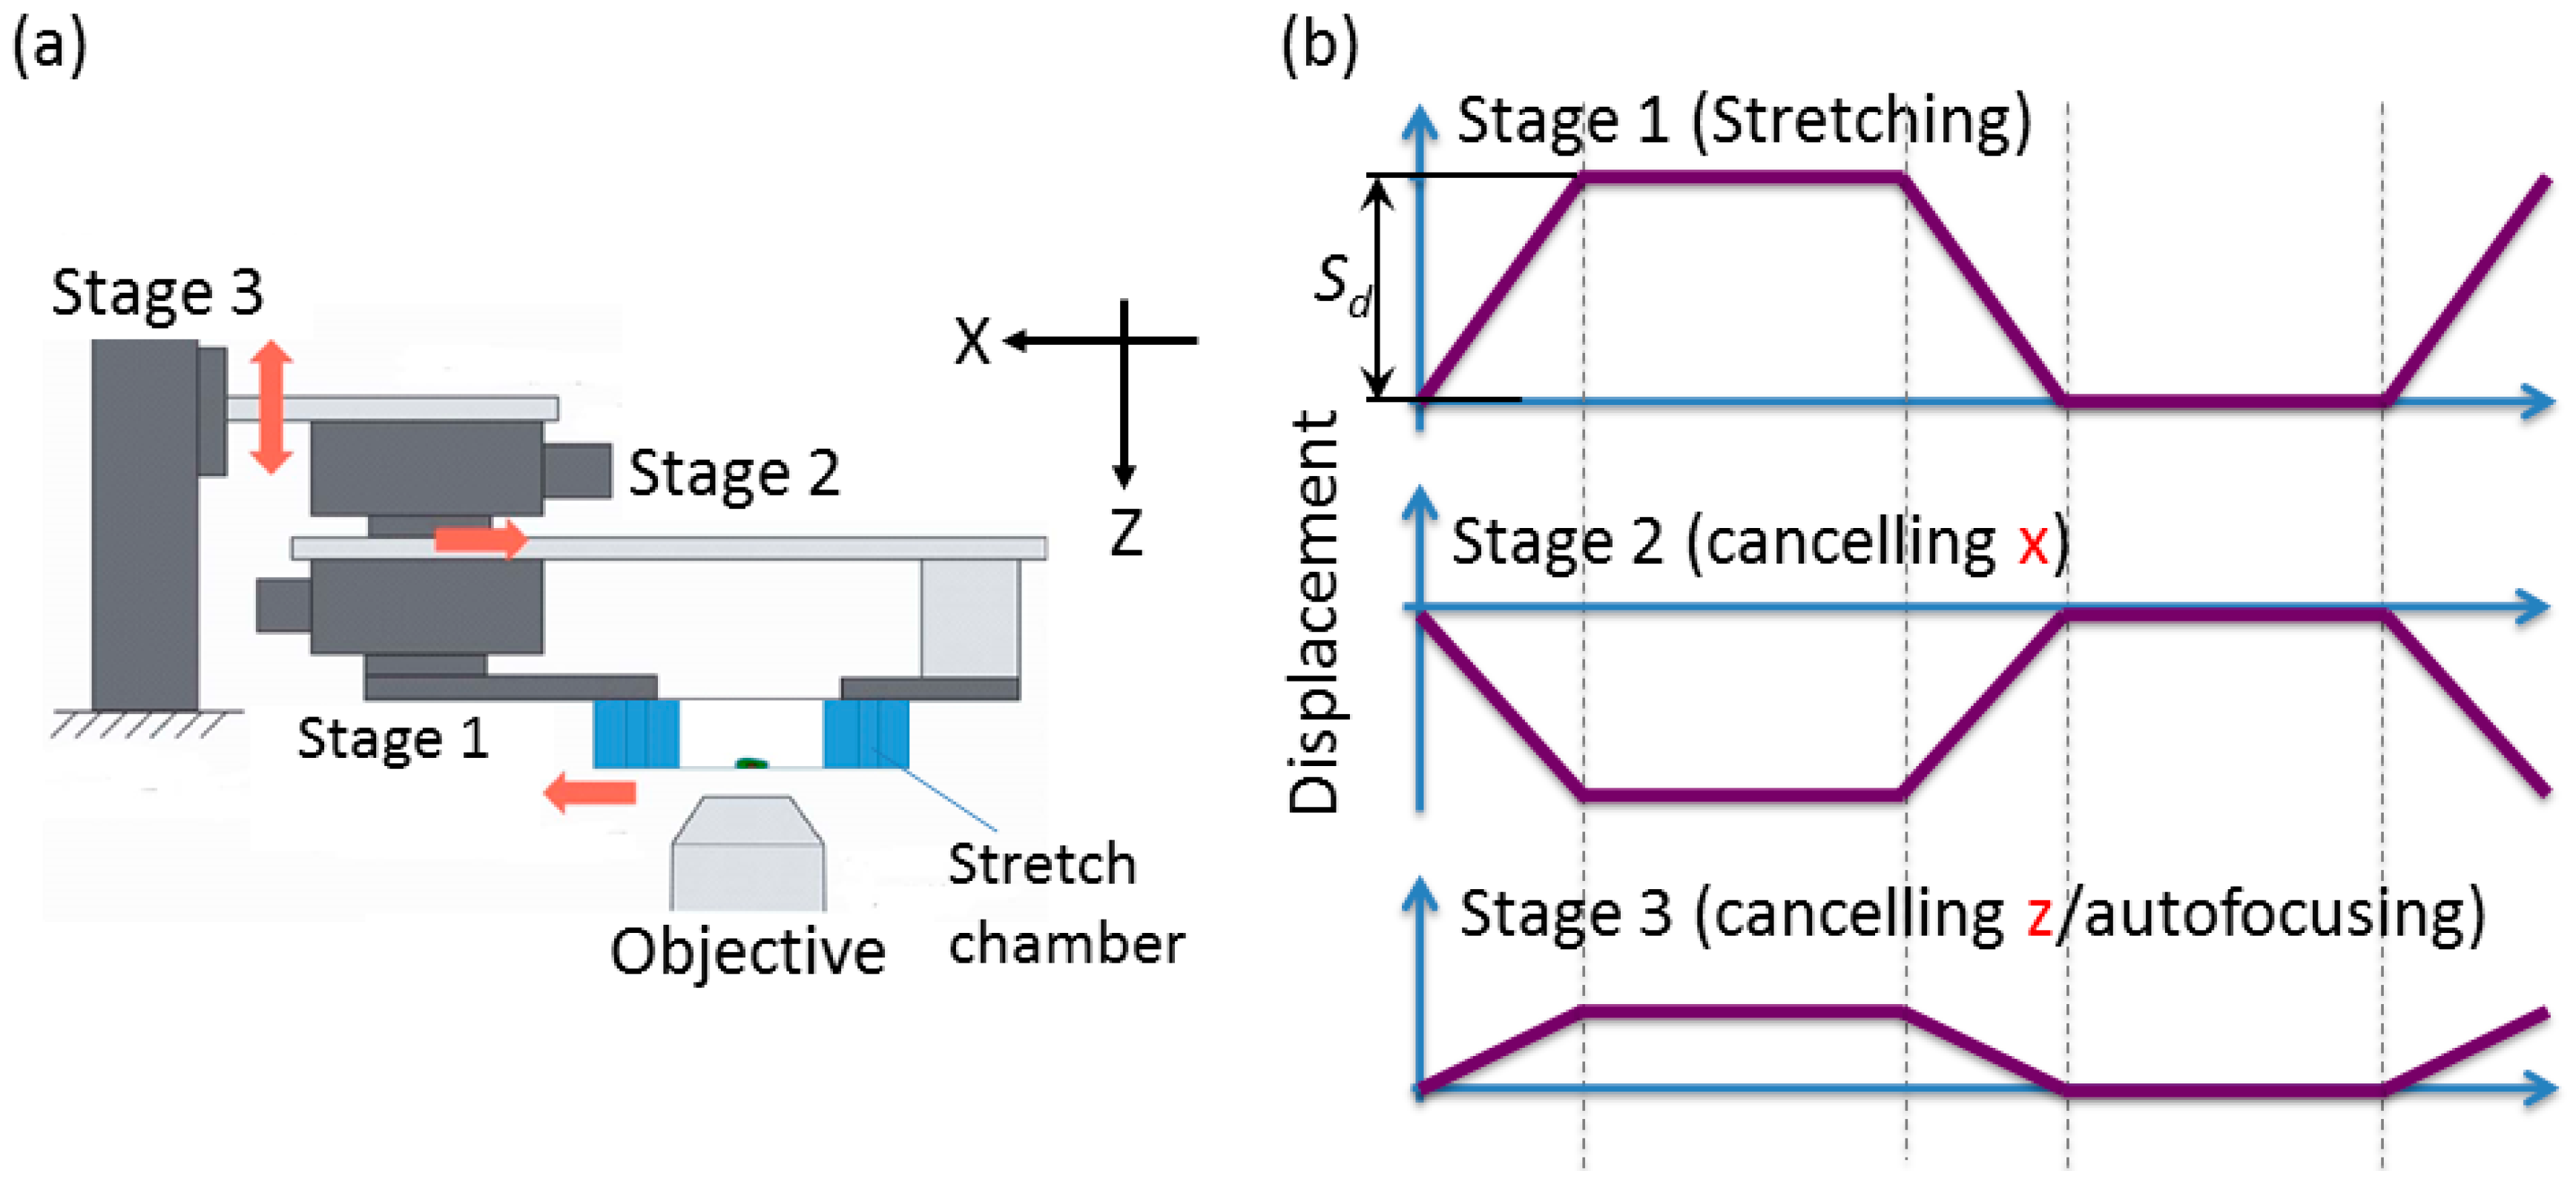
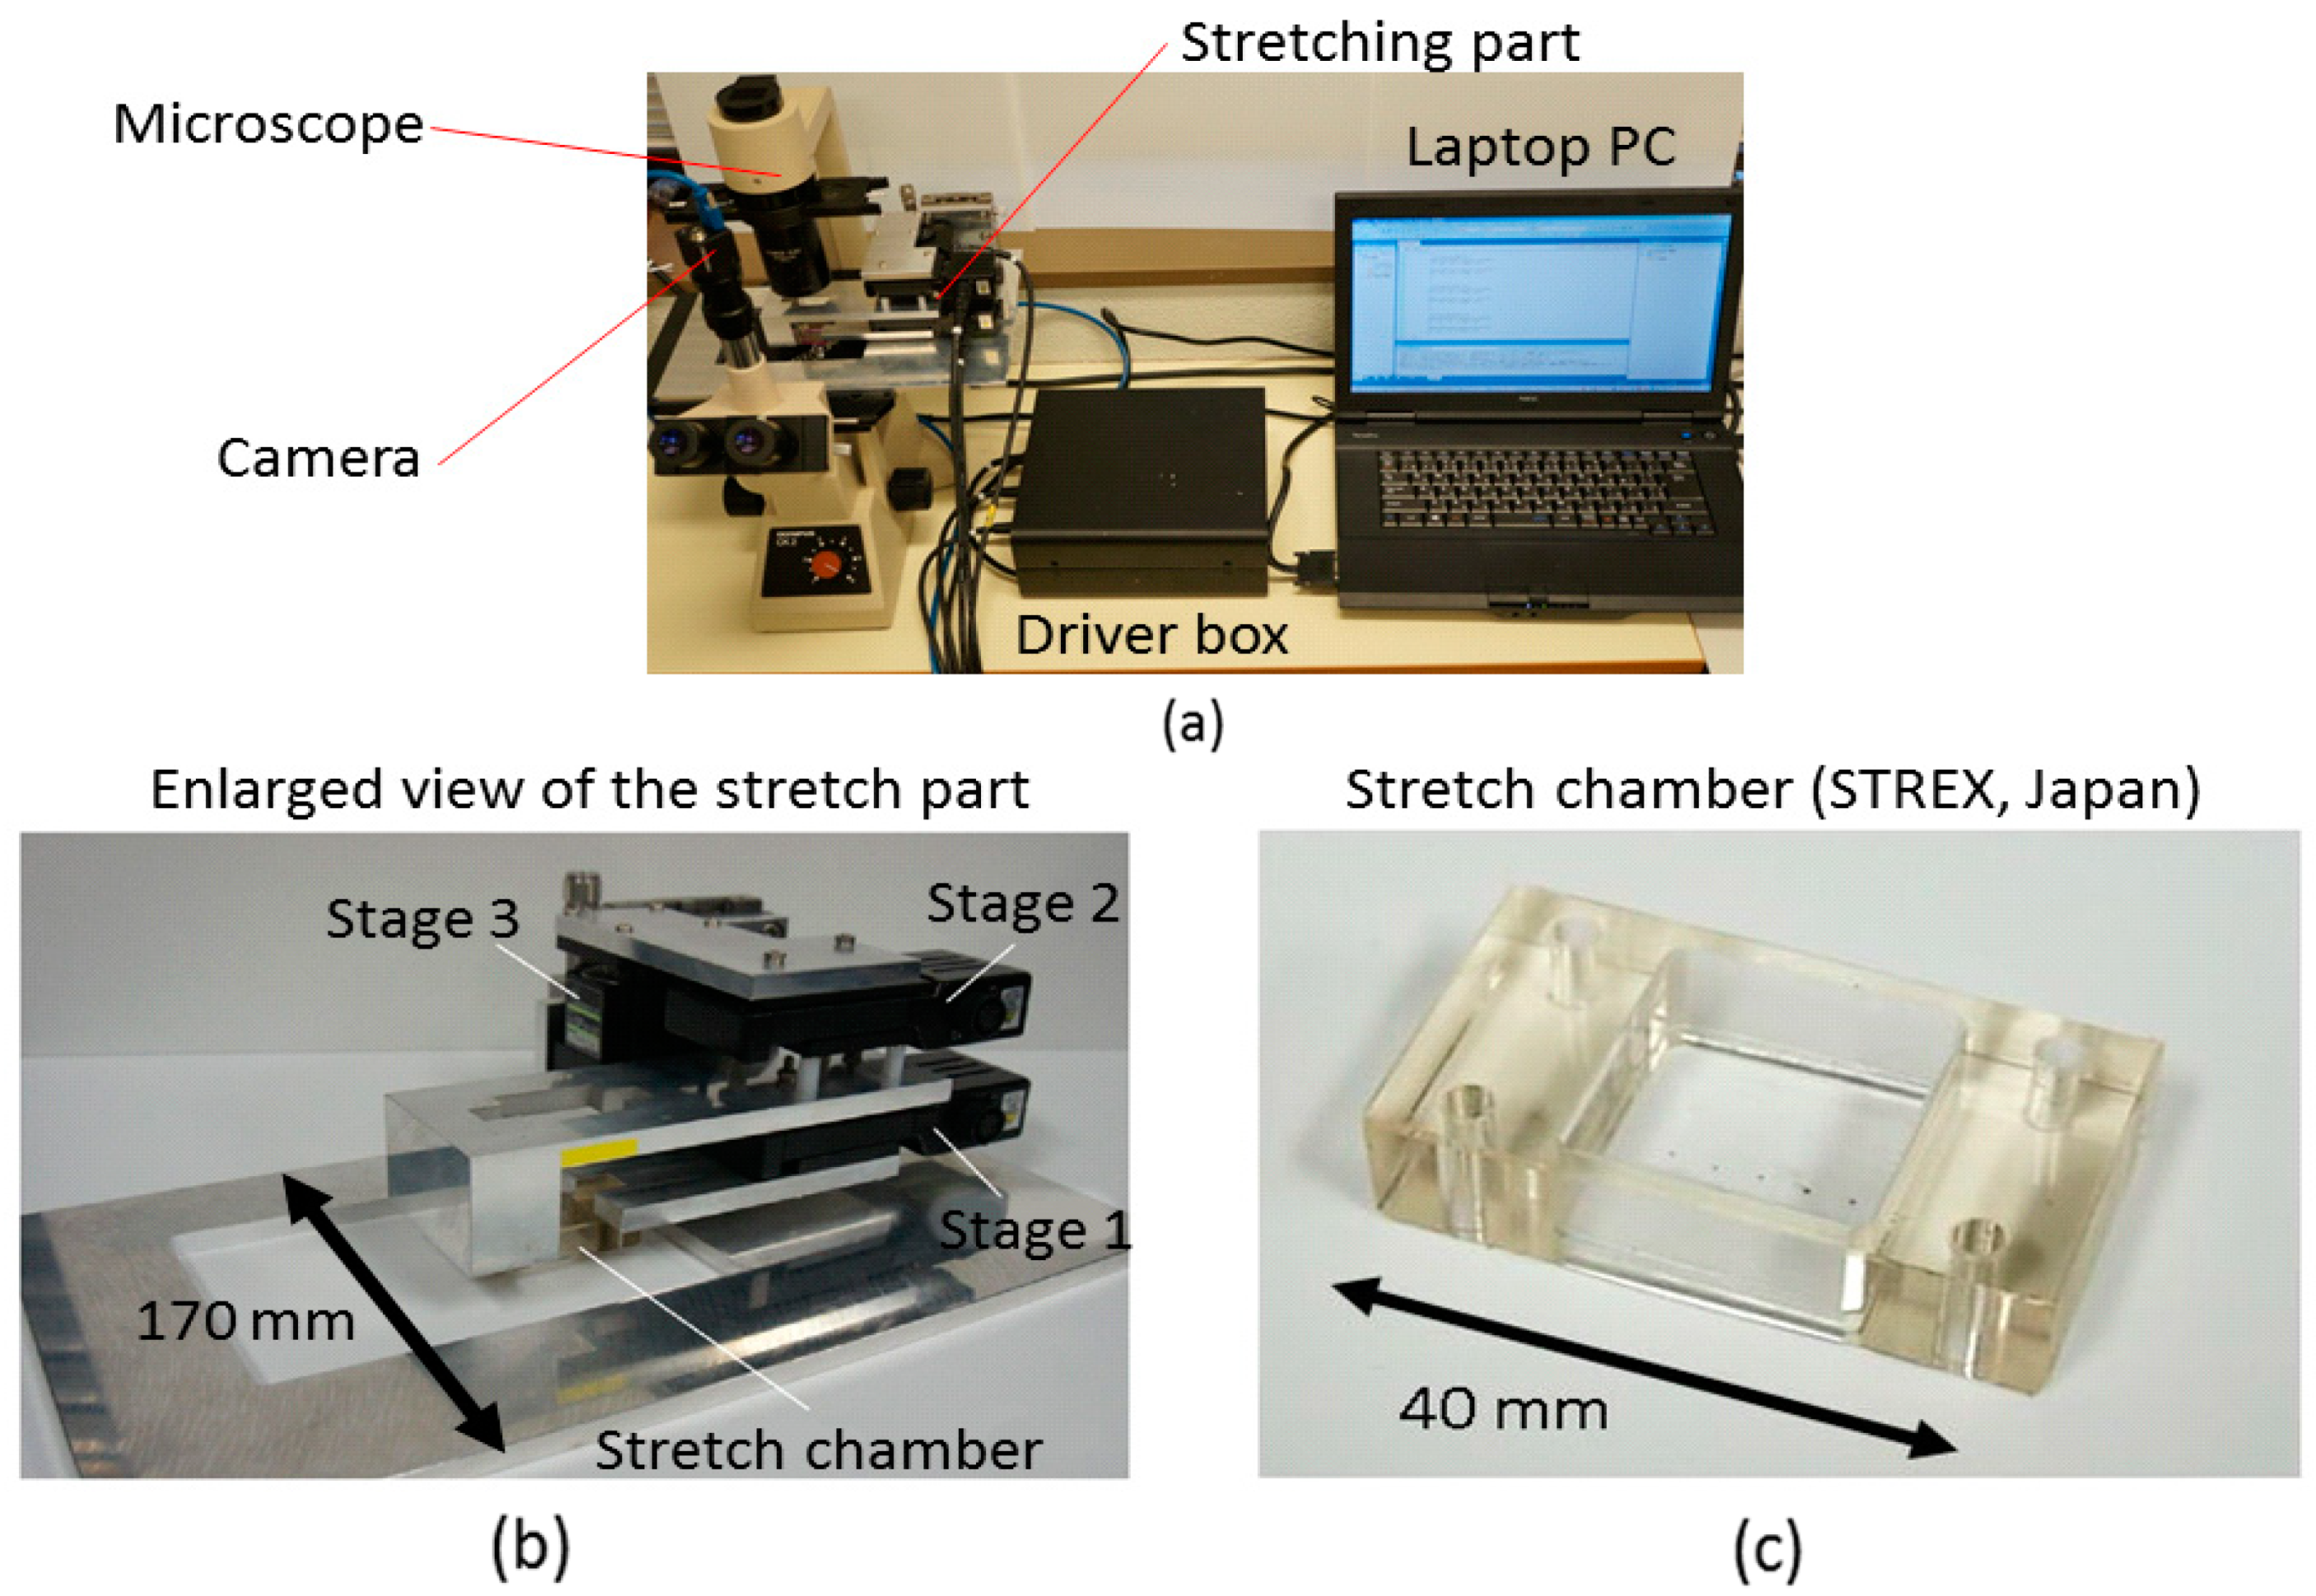
2.2.2. Developed System

The system was developed based on the concept as shown in Figure 3. It consists mainly of a laptop PC, a stage driver box, a stage unit, and a microscope. The motorized stages with desired waveforms were driven by the stage controllers according to the digital pulses from PC. The specifications of each system component are listed below:
  • An inverted microscope with 40× objective lenses was used for image and video capture (Olympus Inc., Tokyo, Japan).
  • A laptop PC equipped with the interface card slot with 8 bit Digital I/O, with 1.9 GHz CPU, installed physical memory of 2 GB, and Windows 7 OS as the operation system.
  • Stage unit: the 5-phase stepping motors with the positioning accuracy of 2 μm/pulse and drive speed of 15 mm/s (SIGMA KOKI Inc., Tokyo, Japan) are required for both stage 1 and stage 2. A stepper motor with the positioning accuracy of 1 μm/pulse and drive speed of 2 mm/s is required for stage 3.
In this study, we designed the cyclic stretch system based on a commercially available uni-axial stretch chamber (Figure 3c), which can be purchased from STREX Inc. (STREX Inc., Osaka, Japan), and has been used by more than 100 research studies around the world [27,44,45,46]. Because it has been reported that the elastic membrane was uniformly stretched over the whole membrane area and deformation in the direction perpendicular to the stretch axis did not exceed 1% at 20% stretch (4 mm stretch) [4], it is supposed that at most of the points on the stretchable membrane, the displacement in the y-direction is small enough and can be neglected during the x-direction extension. In this study, we only investigated the displacement of targets on the membrane in the horizontal and vertical directions to establish a compensation waveform.

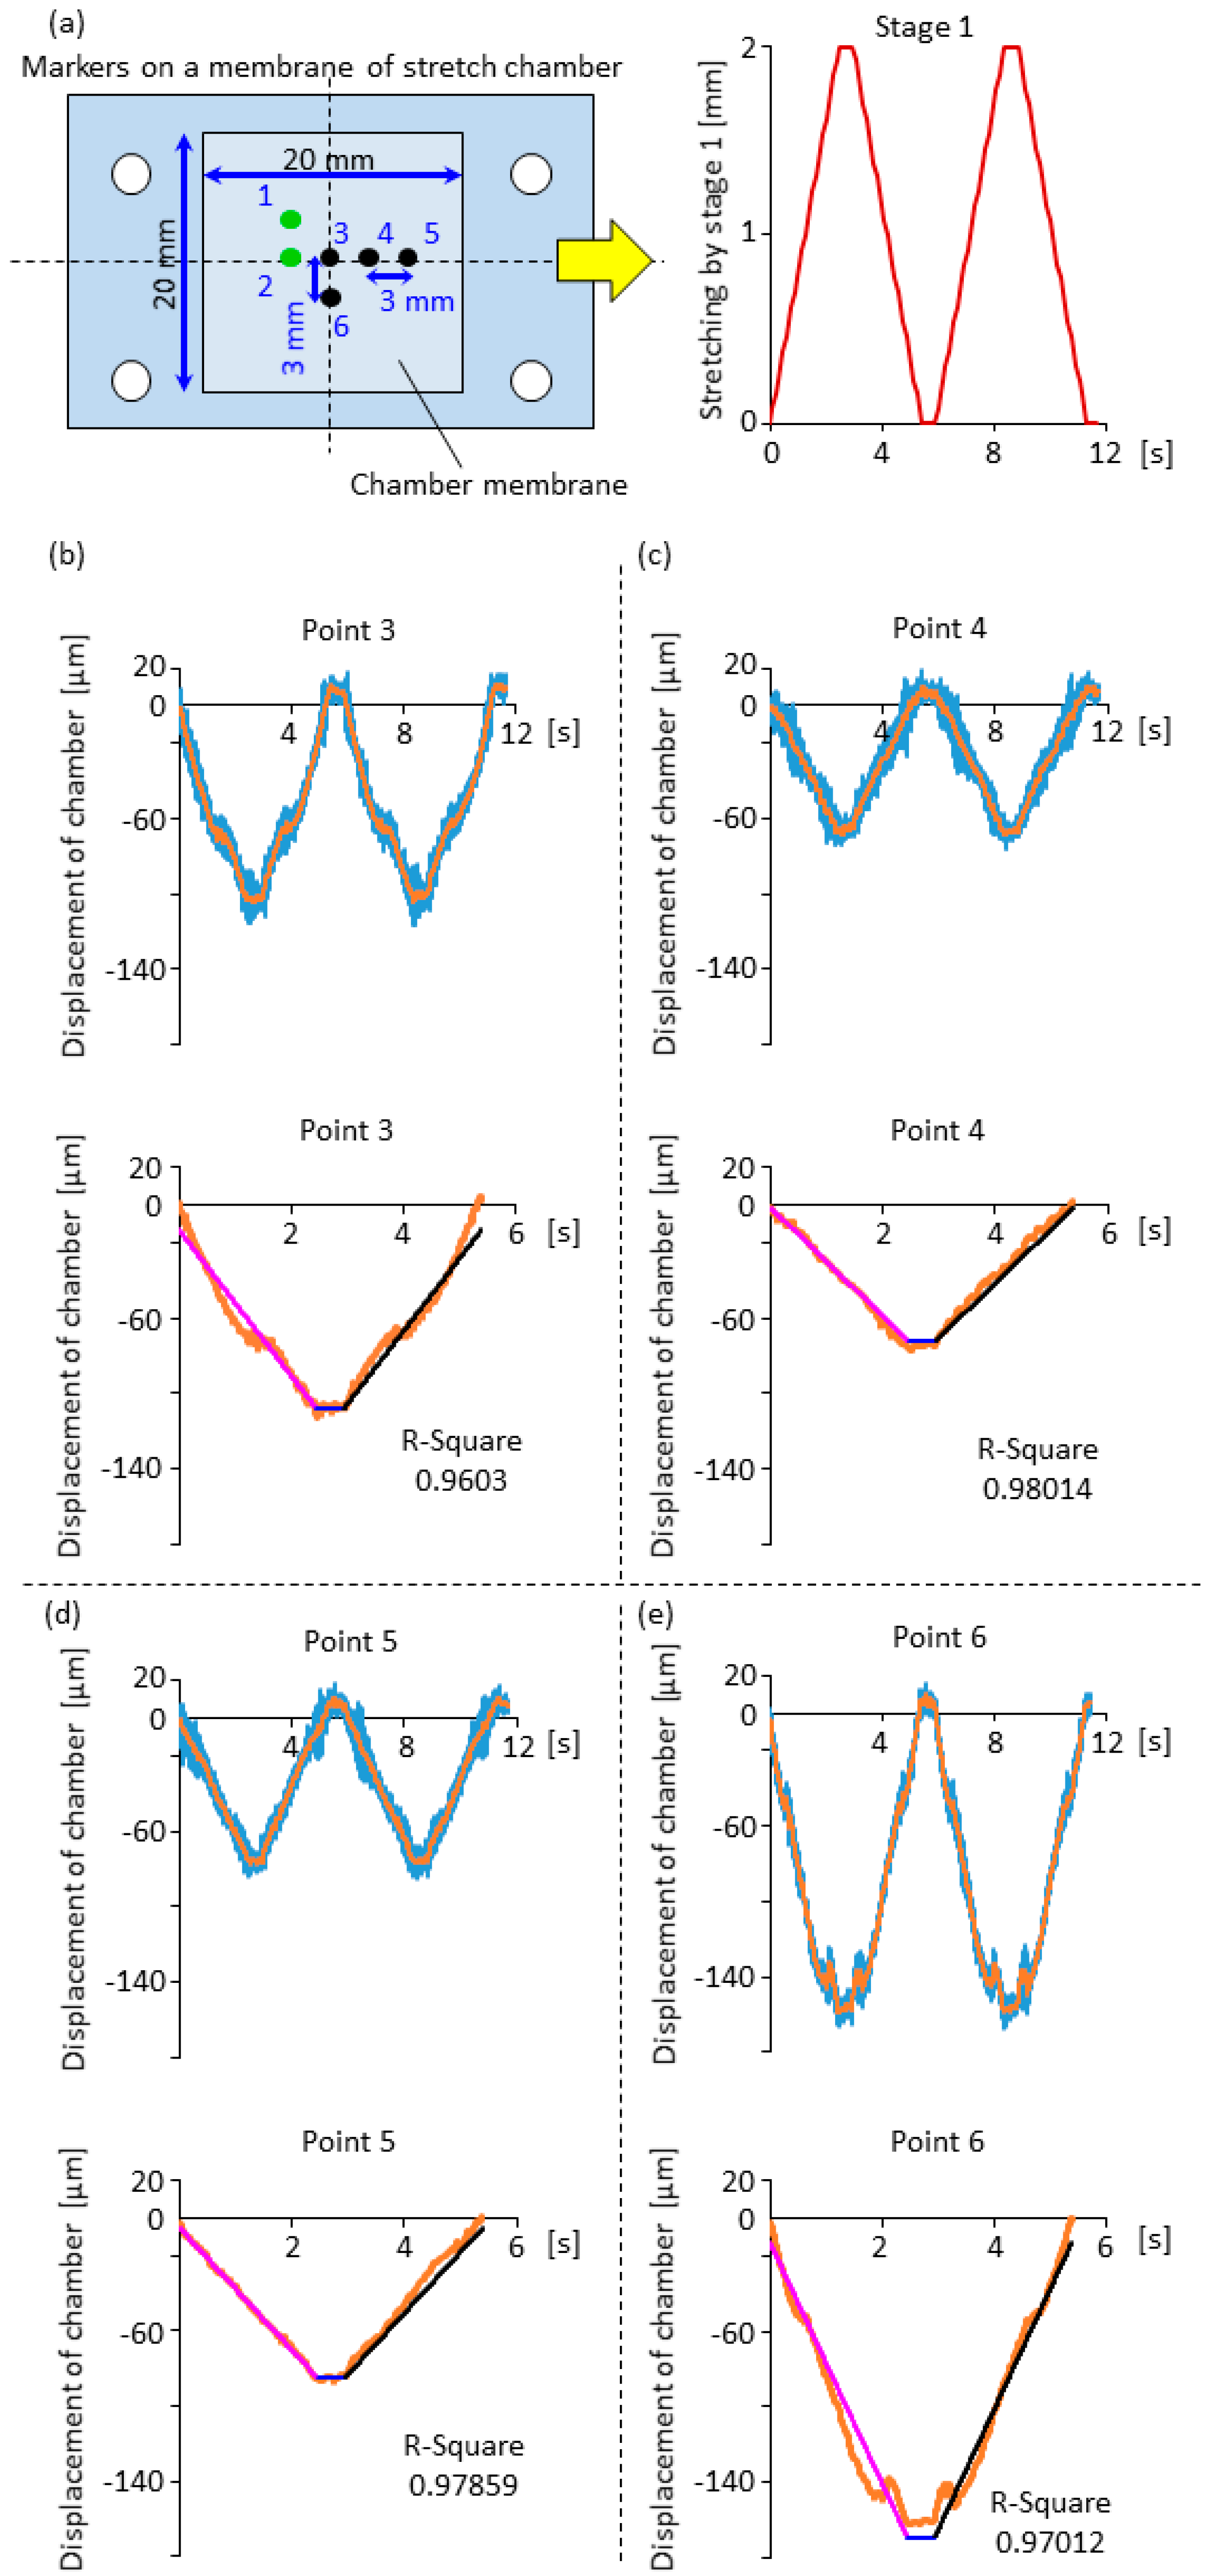
2.3. Displacement Characteristics in the Horizontal and Vertical Direction for the Design of Compensation Waveforms

As shown in Figure 2b, for chamber stretching, we used the same method to that of the conventional apparatus. One end of the chamber was fixed, while the other end was stretched by a movable frame driven by stage 1 (Figure 2a) [4]. The displacements of the points on the stretch chamber in the horizontal direction were different from the fixed end to the movable end. In this study, in order to establish a methodology for the sophisticated cyclic stretch system, we used a demonstration system to investigate the displacement characteristics of the chamber exposed to 10% cyclic stretching, the magnitude of which is comparable to that of vascular cells caused by vasodilation [7,47].
Because processing images during the stretching and relaxation periods (e.g., several seconds) is challenging, it is ideal to control the movement of stage 2 and 3 based on the knowledge about the position shift of the cells on the chamber membrane (feed-forward). Therefore, in order to determine the feasibility of feed-forward control and design the compensation waveforms, we measured the deformation waveforms in the horizontal and vertical directions. As shown in Figure 4a, several markers were drawn on the chamber membrane with an interval of 3 mm for the measurement of displacements. In this study, we focused on and investigated the displacement trajectories of the markers approximately 6 mm from the center of the chamber. The first reason is that the maximum vertical displacement of the chamber fixed at two ends should be located in the center due to the gravity of the culture medium. We want to confirm if the heavy vertical displacement around the center point will cause an unexpected trajectory. In addition, researchers tend to focus on the targets (cells) in the center because they generally believe that the deformation of the chamber near the membrane edge may not be uniform. In this study, the points used to investigate the vertical displacements are not always the ones used for horizontal displacement calibration. The reason is that we first considered the symmetry of the chamber design, and selected the representative points at the lower right corner, and then investigated some points at the upper left corner to randomly increase the testing points. This methodology of compensating for chamber displacements can be used for various studies. Movies of markers were recorded at a frame rate of 30 fps when the chamber was exposed to cyclic stretching.
First, the horizontal displacements were investigated. Before stretching, the target was set to the center of the microscope’s field of view (FOV). Horizontal movements of the center point (point 3) and the two points on the left (point 2) and right (point 4) sides were recorded by a camera set under the chamber. Displacements were calculated from the captured images with a resolution of approximate 13 μm/pixel using imageJ (NIH, Bethesda, MD, USA), and the interval of image capture for analysis was approximate 0.1 s. From Figure 4b–d, the waveforms were confirmed to be almost linear with high similarity even at different points. In addition, δx (horizontal) was always smaller than the stretch volume. Furthermore, the accurate compensation by stage 2 was not required due to sufficient FOV of the microscope (235 × 133 μm at 40×) compared to the stage positioning accuracy (2 μm). As a result, the on-line compensation did not require a perfect waveform. In other words, the δx (horizontal) value at the desired measurement point before the experiment can be measured, and compensate with the interpolated waveform in an actual cell experiment.
In order to capture the feature of the waveform, a curve fitting was obtained through the Fitting Function Builder of Origin 2017 (OriginLab Corporation, Northampton, MA, USA) with the following C program. The displacement was assumed to be xd.
  • if(xd < M)
  • y = A×xd + B;
  • else if(xd >= M && N >= xd)
  • y = K;
  • else
    y = D×xd + E
M and N are the data number at the end of the stretching process and the starting point of the relaxation phase. A and D are the slope of the lengthening and relaxation phase, respectively, and B and E are the intercept values for each line. K is the value of maximum displacement of a target after the chamber is stretched. Here, we supposed that the stretching and relaxation phases are linear, and further, A = −D, which simplifies the control of stage 2. That is, if the maximum position shift of a point on the membrane in the horizontal direction is known, the average movement speed of the motor during the stretching process can be calculated. Moreover, the shift can be compensated by the linear movement of the stage. The goodness of the fit is shown in Figure 4b–d (lower figures). Here, when the R-squared value is larger than 0.95, the fitting is regarded as an appropriate one. From the results, it was confirmed that the movement of cells on the membrane can be compensated by the linear movement of stage 2 in the horizontal direction. The method to measure the maximum position shift will be demonstrated later.
Second, the design of the vertical compensation waveforms of stage 3 was conducted based on the analysis of the vertical shift of these markers on the chamber membrane. By using a laser displacement sensor (KEYENCE Inc., Osaka, Japan) fixed on a robust aluminum structure under the chamber, the vertical displacement of the chamber at the points can be measured during the stretching and relaxation processes. Further, the position under each marker was painted with a silver permanent marker for the reflection of the laser beam. Firstly, we measured the shift of the membrane without adding culture medium into the chamber. Here, the sampling interval was set to be 3 ms. As shown in Figure 5b–e, when the chamber was exposed to stretching of a frequency of approximate 0.17 Hz, the vertical displacement waveforms at points 3, 4, 5, and 6 showed a repeatability feature similar to the stretching waveform of stage 1, although there may be slight non-linearity when compared with the displacement waveforms in the horizontal direction.
Analysis of the displacement waveforms in the vertical direction was conducted using Origin 2017 (OriginLab). In order to cut off the noise, a fast Fourier transformation (FFT) filter was used to obtain data smoothing with points of the window at 10. Next, as mentioned above, because the displacement waveforms possess a repeatability feature, a stretching–holding–relaxation cycle was extracted and used for the design of compensation waveforms. We expected that a linear waveform can also be used to compensate for the most part of the vertical shift, although there may be some instantaneous position aberrations during a cycle when the compensation waveform is linear. Therefore, similar to the curve fitting process in the horizontal direction, Formula (1) was used to perform the curve fitting.
Figure 5b–e (lower) shows the waveforms at position 3, 4, 5, and 6 before and after smoothing using FFT filters. Curve fitting results of a stretching–holding–relaxation cycle are shown under the corresponding displacement waveforms. Here, a high R-square of above 0.95 was obtained for each displacement waveform, which reveals that the trendline was reliable and could be used as the rough trajectory of the movement of stage 3.
To further confirm that the vertical shift waveform during the stretching and relaxation phase can be fitted using a linear approximation method, the displacement waveform in the vertical direction at a different frequency (0.25 Hz) was investigated. As shown in Figure 6b,c, a linear function fit well to the set of data of a stretching or relaxation phase of the vertical shift at point 1 or 2. Further, in order to mimic realistic conditions close to an actual cell experiment with 1-mL culture medium, 1 mL of water was added into the stretch chamber before measuring the displacement of targets. The vertical displacement waveform can be also fitted with linear waveforms at the stretching or relaxation phase (Figure 7), which demonstrates practical application in cell monitoring when exposed to cyclic stretching.
After the design of the compensation waveform, the next was to establish the methodology to determine the maximum local displacement in the horizontal and vertical direction. Here, we have developed a method to determine the maximum volume of compensation online for the first cycle by pressing the PC ENTER button, and after that, the cyclic stretch starts automatically and immediately, as shown in Figure 8. The process was performed at the beginning of all experiments, and the details are as follows. First, before stretching, adjust the focus, recognize and select the targets (a marker or cell for live imaging) by human eyes at any point on the membrane. After pressing the enter key to start stage 1, the chamber stretches at the desired speed and leads to membrane displacement in the horizontal and vertical directions. Second, stage 2 moves slowly at a speed of 10 μm/s in the opposite direction of stage 1. Since the speed can be changed easily in the control program of stage 2, a sufficiently slow speed is achieved, and the targeting point can be recognized by human eyes during the period stage 2 movement. When the recognized target comes back to the center of the microscope’s field of view, the movement of stage 2 is stopped by pressing the ENTER key, and the displacement of stage 2 is used as the maximum compensation value in the horizontal direction. The target is out of focus due to the vertical shift of the chamber membrane. Next, push the enter key to start the movement of stage 3 to adjust the focus. Normally, since it is necessary to lower the position of the stretched chamber, stage 3 moves in the lower direction. After the target is brought into focus, press the enter key to stop stage 3, and the maximum compensation in the vertical direction is obtained. Since the stretching, holding, and relaxation time periods are fixed, moving speeds of stage 2 and 3 are calculated as the maximum compensation values divided by the time period. Therefore, moving speeds are obtained for the three stages, and cyclic stretch starts immediately with the desired stretching speed.

3. Results

3.1. Effectiveness of the Compensation Waveforms

We can measure the vertical displacement of any point within tens of seconds before the beginning of cyclic stretching and establish the corresponding waveforms for real-time imaging.
In this experiment, first, we used a marker imitating a single cell which is in the center of the chamber to test the effectiveness of the demonstration system. The compensation waveform for each point was obtained according to Formula (1). The chamber was stretched (lengthened) at a constant speed of 2 mm/s for a stretching distance Sd = 2 mm (Figure 2b), and then shortened to the original length. Images were taken by a 40× objective lens during the experiments. As shown in Figure 9, using only stage 1, the marker was clearly moved out of the microscope’s FOV. With the combination of stage 1 and 2, the system was able to maintain the target in the microscope’s FOV, but the marker was completely out of focus. Finally, in the case of a combination of all three stages, the images and movies with higher resolution were obtained in real time. Movies of the results are shown in Supplementary Materials Video S1.
In the purpose of verifying the system performance, the contrast of images was calculated using the following equations [48]:
C = 1 H · W H W ( I ( i , j ) μ ) 2
μ = 1 H · W H W I ( i , j )
where I represents the pixel at the coordinates (i, j) in grey level intensity. H is the height of the image, and W is the width of the image. μ is the mean intensity equal to the averaged gray level intensity of the image. Based on the results of the image analysis shown in Figure 10, the contrast value of the system with only stage 1 was found to be very low when the chamber was stretched, because the marker was completely out of the FOV of the microscope. The marker re-appeared in the FOV once the relaxation phase of the cycle ended, thus, the image at this point can be obtained with a high contrast value. By using both stages 1 and 2, the marker still remains in the FOV of the microscope; however, the images were blurry during the lengthening and relaxation processes. This is because the marker was not able to be focused. Therefore, the contrast value decreases linearly in both processes. By using all three stages, the contract values maintain in high quality during the whole lengthening and relaxation processes since the aberration in the z-direction was well compensated compared to the other systems with only stage 1 and stage 2.

3.2. Cell Observation with a High Time Resolution

Finally, we applied cyclic stretching to the cells by using this system. The system was designed to be compact, which can be fit to the stages of conventional microscopes. In this study, an Olympus CK2 (Olympus) or the EVOS digital inverted microscope (Advanced Microscopy Group) were applied. Olympus CK2 was mainly used to investigate the effectiveness of the designed compensation strategy, and the EVOS digital microscope was used for the collection of online images of cells with transmitted light (phase contrast).
Cell culture: The MC3T3-E1 cell line (American Type Culture Collection, Manassas, VA, USA) from mouse was used, which was first cultured in Minimum Essential Medium (MEM) α (Sigma–Aldrich, Saint Louis, MO, USA) containing 10% heat-inactivated fetal bovine serum (Life Technologies, Carlsbad, CA, USA) in a flask, and then were detached with 0.05% trypsin-EDTA and seeded at a concentration of 2 × 10⁴ cells/mL on fibronectin-coated membranes in a stretch chamber, and maintained at 37 °C in a humidified atmosphere for 24 h.
Cyclic stretch exposure and image acquisition: Cells on an elastic membrane under static conditions exhibit cobble-stone-like shapes with random orientation. We applied 10% cyclic stretch (stage 1 moved for 2 mm in 1 sec) to cells for 90 min. In the experiment with living cells, we added a semi-closed stage incubator to maintain the cell culture temperature (37 °C). Using a lens with a magnitude ratio 20× or 40×, the phase contrast images of cells in the FOV was monitored over a 90-min period by capturing 30 images every 1 s.
An online cell movie was obtained using a lens with a magnification of 20×, as shown in Figure 11 and Video S2. The movie shows that targets (cells for investigation) were observed clearly during a period of approximately 90 min.
By using this system, conventional cell analysis is certainly possible (Figure 11), and further, detailed cellular responses within several seconds can be only figured out from the movie using the developed system with a high time resolution in this study (Figure 12). As shown in Figure 11a, we can roughly analyze the morphological change of a single cell exposed to cyclic stretching from the cell movie at the time point of 0, 45, and 90 min. After exposure to a cyclic stretch for 90 min, the cell enclosed by the broken line in Figure 11a changed its shape and orientation, a phenomenon also observed using the conventional stretching systems, although the results in most of the previous studies were those analyzed from different samples with cell fixation [49,50].
In order to classify the process of morphological change, cell morphology was further analyzed every 5 min as cell orientation and shape index with respect to the stretch direction. The outline of the target cells in each image was drawn manually, and then the cell areas, perimeters, and corresponding equivalent ellipse were obtained using a self-made macro language of software ImageJ (NIH, USA). Shape Index of a cell is expressed as Equation (4) [51]:
Shape Index = 4πA/P2
where A is the area, and P is the perimeter of a cell. Shape Index is a parameter demonstrating the cell elongation, which is one for the circle and zero for a line. In this study, the angle between the direction of the long axis of the equivalent ellipse and stretch direction was defined as the orientation angle of cells, which was also determined by using ImageJ. Then the time course of the morphological changes was drawn, as shown in Figure 11b,c. From the curve of the shape index, we can observe many sudden changes, and drastic shape change was observed at approximately 85 min after cyclic stretch exposure.
Because the movie with a high time solution around 85 min was available, it is possible to investigate detailed information about the sudden change. As shown in Figure 12, a sudden and complete rupture of the intercellular junction between cell 1 and cell 2 during six stretching–holding–relaxation cycles was confirmed. These images were captured from the middle of several stretching phases around 85 min. There was a drastic morphological change. To demonstrate this change, the distance of the center of the two cell areas was calculated. As shown in Figure 12c, the distance of the center of cells changed for approximate 10 μm during a time period of 30 s. The results demonstrate that the system can be used to record cellular changes even when the change cannot be predicted.
Further, an on-line cell movie was also obtained using a lens with a magnifying power of 40 times, as shown in Figure 13 and Video S3.

4. Discussion

The advantage of this study is that a methodology to collect real-time images at the stretching and relaxation phases was established and tested. Based on the developed method, a system was developed with the capability of taking high time resolution video clips of living cells exposed to cyclic stretching continuously. Our system, therefore, provides the possibility that even unexpected cellular mechanoresponses can be detected during experiments. To the best of our knowledge, no existing research has been developed using this technique to observe cells during the two phases. Indeed, several studies have fabricated a system to get two images during a cycle: one image before the stretching phase, and the other in the holding phase. Conventionally, the focus plate of the chamber membrane will be changed after exposure to a stretch induced by a moving indenter under the chamber. To solve this problem, Huang et al. [39] developed a system with a fixed indenter underneath but a vertically moving stretch chamber. Because the indenter was fixed, the vertical position of the chamber membrane on the top of the indenter was almost constant when it was stretched. Even so, there was still a vertical shift. Therefore, they measured the volume of the maximum shift, and obtained the images before and after stretching successfully. Another effort to obtain images before and after stretching is to minimize the stretching system using microfabrication techniques, and even devices for studying the behavior of individual cells have been created. For example, Huang et al. [40] have developed a micro-stretching device with a width of approximately 250 μm. Indeed, miniaturization of a stretching device may minimize the volume of vertical shift. However, even though the device was fabricated at the micro level, there were cases where the targets moved out of the focal plane, which may depend on the magnification of the lens or the structure of the micro-device [41,42]. Further, the quality of imaging was always dependent on the thickness of the chamber membrane, because stretch-induced thickness change was also involved in a target position change. Therefore, a theory other than system minimization to compensate for the shift is necessary, a theme which was tried by this study.
This study did not investigate the effectiveness of the methodology on real-time imaging when the chamber was exposed to a larger/smaller strain or stretching with a different type of stretch waveform (e.g., sinusoidal waveforms) other than trapezoidal ones. Indeed, if the stretch waveform was different from the waveforms used in this study, the corresponding waveforms of the vertical shift should be specially designed. One method is that researchers directly measure the displacement waveforms of the chamber membrane when exposed to cyclic stretching before experiments involved in cells, and then figure out the mathematical model of the stretching or relaxation phases, linear or non-linear ones, by curve fitting. However, a trapezoidal waveform may be the most practical one for vertical compensation of a miniaturized chamber exposed to types of stretching waveforms, and the reasons are as follows. If the vertical shift is very small (several μm to 10~20 μm), the averaged vertical shift compensated by the motorized stage at every millisecond should be very small during lengthening/relaxation. Because the averaged vertical shift for each millisecond is 0~2 μm of a lengthening/relaxation phase in this study, the shift can be compensated by sending one or two pulses (positioning accuracy of stage 3: 1 μm/pulse, and maximum drive speed of 2 μm/ms). For the stretching chamber used in this study, which had a size of 20 mm × 20 mm, the maximum vertical shift was approximate 200 μm, and for a miniaturized stretch chamber, the vertical shift may become a value smaller than 10 μm [40,42]; a small vertical shift only resulted from the thickness change of the membrane of a miniaturized stretch chamber. In this case, since the thickness changed gradually but not suddenly, stage linear movement (a trapezoidal waveform) should be effective for compensation.
It is challenging to use the methodology established in this study in fluorescence observation of cell organelles nowadays. There are two reasons as follows. First, fluorescence is weak in comparison to transmitted light phase contrast, and long exposure time is always necessary to improve the signal-to-noise ratio when using a conventional fluorescence microscope [52]. An essential difference of the method in this study is that the feedforward method was used and no image processing was conducted at the lengthening/relaxation phases. Although a high-speed camera such as an Electron Multiplying Charge Coupled Device (EM-CCD) or scientific-grade CMOS (sCMOS) camera may be suitable for high-speed imaging of fluorescently tagged cells (>100 fps) [53], for a conventional fluorescence microscope, because the vertical shift was compensated at a millisecond level, there is a time limit for the collection of real-time fluorescence images because of long exposure time. Second, to observe the cell organelles using the immunofluorescence method, the stability of the stretched membrane may be influenced heavily by the culture medium in a chamber with a size of 20 mm × 20 mm and the lens is sensitive to the small vibration when the magnification is high. In the future study, for enhanced stability, a miniaturized chamber is recommended, and if such a large chamber is necessary anyway, the stability of the chamber membrane may be achieved by putting a cover glass into the area between the chamber membrane and the objective lens. The reasons are as follows. There is a weak adhesion force between the membrane and the cover glass, which may reduce the effect of vibration when using a lens with high magnifying power, although the displacement of the membrane may become smaller. Further, the adding of a cover glass is necessary for the experiments observing cell organelles using conventional silicone chambers because for the observation of organelles using high power lens immersion oil is necessary, but the silicone substrate swells with immersion oil and turns into non-uniform shape [41]. Therefore, a cover glass here not only protects the membrane from immersion oil but also stabilizes the membrane when a lens with high power is applied.
The following can be conducted to further improve the performance of the system. Displacement waveforms were specific at a different position on the membrane. It will be valuable to establish a mathematical model about the relationship between the membrane position and the displacement values (compensation values) of these positions, and combine the mathematical model to Formula (1). The combined model will be capable of predicting compensation waveforms more precisely. Next, the volume of the culture medium was a crucial factor influencing the effect of the compensation. As shown in Figure 5b and Figure 7, the vertical displacement of point 3 was larger in the chamber with medium addition compared to the chamber without medium addition. Indeed, a large volume of the culture medium may increase the steps of compensation and the accumulation of position deviation. On the other hand, the volume of the culture medium may also influence cell functions. For example, the volume of the culture medium influenced the differentiation of osteoblasts and osteoclasts [54]. Therefore, a trade-off is necessary. To make the system compatible with fluorescent imaging, several factors should be taken into consideration. Besides the above-mentioned high-speed camera such as an EM-CCD or sCMOS camera [53] and the methods to stabilize the membrane discussed above, it should be necessary to consider the numerical aperture (NA) and magnification (M) of the lens used in the experiments. The problem is that the brightness of the fluorescence is lower than that of the transmitted light phase contrast, therefore, a long exposure time is necessary. We noticed that brightness is proportional to NA2, and inversely proportional to M2 [55]. In other words, high NA and low M may shorten the exposure time and make fluorescent imaging possible. Again, a trade-off is necessary. Last, but not the least, a microscope enclosure thermostatic chamber should be capable to improve the performance of the system when considering the effects of thermal fluctuation (characterized by space–time functions [56]), the problem of thermal stability such as the heating non-homogeneity of the stretch chamber [57], etc. In this study, cells on the membrane of the stretch chamber were cultured within a semi-closed incubator. Indeed, temperature control may be a problem because the thermal effects may amplify the focus drift of stretch chamber. In the follow-up study, better temperature control by a thermostatic chamber may solve the problem of thermal drift and improve the ability of imaging at high magnification.
In this study, experiments on the monitoring of cells exposed to cyclic stretch were conducted to demonstrate the performance of the system. As a highlight, the drastic change of cell–cell junctions observed after around 85-min stretch was shown in Figure 12. We showed that the system provides the ability to capture images of cell response at almost any time point except the first stretch cycle when the x and z displacements were determined. However, the interpretation of the rapid cell response after the first stretching cycles should be an issue to be worthy of consideration. As a typical phenomenon, it was reported that focal adhesions in cells increased prominently after exposure to stretch for 2 min in a previous study [28]. Here, we want to point out that the first frames collected using the system may not relevant to a rapid response (if there is such a response) at the beginning of the stretching activity.

5. Conclusions

In this research, the displacement of targets on a stretchable chamber was investigated in both horizontal and vertical directions. A cyclic stretch system consisting of three stages was conceptually proposed to compensate for the chamber displacement in real time. Based on this concept, a high time resolution tracking system for observing cells exposed to cyclic stretching during the lengthening and shortening phases was developed without the necessity of designing imaging timing in advance. Image contrast values of ink markers imitating cells stay at a high level at the lengthening and shortening phases during the cyclic stretching. Further, observation of detailed cell changes at millisecond level was achieved during the stretch exposure process. In conclusion, the three-motorized-stage cyclic stretching system presents a promising platform towards the study of the immediate responses of cells exposed to cyclic stretching.

Supplementary Materials

The following are available online at https://www.mdpi.com/2076-3417/9/8/1560/s1.

Author Contributions

T.K., W.H., S.Z. and B.A. conceived and designed the experiments; W.H., B.A. and T.K. performed the experiments; W.H. and S.Z. analyzed the data; W.H., T.K. and S.Z. contributed reagents/materials/analysis tools; W.H., S.Z. and T.K. wrote the paper.

Funding

This research was partially supported by JSPS KAKENHI Grant Numbers 25750154 and 18H01395.

Conflicts of Interest

The authors declare no conflict of interest.

References

  1. Nerem, R.M.; Cornhill, J.F. Hemodynamics and atherogenesis. Atherosclerosis 1980, 36, 151–157. [Google Scholar] [CrossRef]
  2. Katanosaka, Y.; Bao, J.-H.; Komatsu, T.; Suemori, T.; Yamada, A.; Mohri, S.; Naruse, K. Analysis of cyclic-stretching responses using cell-adhesion-patterned cells. J. Biotechnol. 2008, 133, 82–89. [Google Scholar] [CrossRef]
  3. Kataoka, N.; Ujita, S.; Kimura, K.; Sato, M. The morphological responses of cultured bovine aortic endothelial cells to fluid-imposed shear stress under sparse and colony conditions. JSME Int. J. Ser. C 1998, 41, 76–82. [Google Scholar] [CrossRef]
  4. Naruse, K.; Yamada, T.; Sai, X.; Hamaguchi, M.; Sokabe, M. Pp125fak is required for stretch dependent morphological response of endothelial cells. Oncogene 1998, 17, 455–463. [Google Scholar] [CrossRef]
  5. Ngu, H.; Feng, Y.; Lu, L.; Oswald, S.J.; Longmore, G.D.; Yin, F.C.P. Effect of focal adhesion proteins on endothelial cell adhesion, motility and orientation response to cyclic strain. Ann. Biomed. Eng. 2010, 38, 208–222. [Google Scholar] [CrossRef] [PubMed]
  6. Ballermann, B.J.; Dardik, A.; Eng, E.; Liu, A. Shear stress and the endothelium. Kidney Int. 1998, 54, S100–S108. [Google Scholar] [CrossRef] [Green Version]
  7. Jufri, N.F.; Mohamedali, A.; Avolio, A.; Baker, M.S. Mechanical stretch: Physiological and pathological implications for human vascular endothelial cells. Vasc. Cell 2015, 7, 8. [Google Scholar] [CrossRef] [PubMed]
  8. Davies, M.J.; Woolf, N.; Rowles, P.M.; Pepper, J. Morphology of the endothelium over atherosclerotic plaques in human coronary arteries. Br. Heart J. 1988, 60, 459–464. [Google Scholar] [CrossRef] [PubMed]
  9. Gimbrone, M.A., Jr.; García-Cardeña, G. Endothelial cell dysfunction and the pathobiology of atherosclerosis. Circ. Res. 2016, 118, 620–636. [Google Scholar] [CrossRef]
  10. Sokabe, M.; Naruse, K.; Sai, S.; Yamada, T.; Kawakami, K.; Inoue, M.; Murase, K.; Miyazu, M. Mechanotransduction and Intracellular Signaling Mechanisms of Stretch-Induced Remodeling in Endothelial Cells. Heart Vessels 1997, (Suppl. 12), 191–193. [Google Scholar]
  11. Childs, P.G.; Boyle, C.A.; Pemberton, G.D.; Nikukar, H.; Curtis, A.S.G.; Henriquez, F.L.; Dalby, M.J.; Reid, S. Use of nanoscale mechanical stimulation for control and manipulation of cell behaviour. Acta Biomater. 2016, 34, 159–168. [Google Scholar] [CrossRef]
  12. Marturano-Kruik, A.; Villasante, A.; Yaeger, K.; Ambati, S.R.; Chramiec, A.; Raimondi, M.T.; Vunjak-Novakovic, G. Biomechanical regulation of drug sensitivity in an engineered model of human tumor. Biomaterials 2017, 150, 150–161. [Google Scholar] [CrossRef]
  13. Sumpio, B.E.; Banes, A.J.; Link, G.W.; Iba, T. Modulation of endothelial cell phenotype by cyclic stretch: Inhibition of collagen production. J. Surg. Res. 1990, 48, 415–420. [Google Scholar] [CrossRef]
  14. Huang, W.; Sakamoto, N.; Hanamura, K.; Miyazawa, R.; Sato, M. Role of intercellular junctions in redistribution of focal adhesions and orientation of vascular endothelial cells exposed to cyclic stretching. Cell. Mol. Bioeng. 2011, 4, 368. [Google Scholar] [CrossRef]
  15. Ursekar, C.P.; Teo, S.-K.; Hirata, H.; Harada, I.; Chiam, K.-H.; Sawada, Y. Design and construction of an equibiaxial cell stretching system that is improved for biochemical analysis. PLoS ONE 2014, 9, e90665. [Google Scholar] [CrossRef] [PubMed]
  16. Shao, Y.; Tan, X.; Novitski, R.; Muqaddam, M.; List, P.; Williamson, L.; Fu, J.; Liu, A.P. Uniaxial cell stretching device for live-cell imaging of mechanosensitive cellular functions. Rev. Sci. Instrum. 2013, 84, 114304. [Google Scholar] [CrossRef] [Green Version]
  17. Huang, W.; Sakamoto, N.; Miyazawa, R.; Sato, M. Role of paxillin in the early phase of orientation of the vascular endothelial cells exposed to cyclic stretching. Biochem. Biophys. Res. Commun. 2012, 418, 708–713. [Google Scholar] [CrossRef]
  18. Chen, K.; Vigliotti, A.; Bacca, M.; McMeeking, R.M.; Deshpande, V.S.; Holmes, J.W. Role of boundary conditions in determining cell alignment in response to stretch. Proc. Natl. Acad. Sci. USA 2018, 115, 986. [Google Scholar] [CrossRef] [PubMed]
  19. Boccafoschi, F.; Bosetti, M.; Gatti, S.; Cannas, M. Dynamic fibroblast cultures: Response to mechanical stretching. Cell Adhes. Migr. 2007, 1, 124–128. [Google Scholar] [CrossRef]
  20. Kamble, H.; Barton, M.J.; Jun, M.; Park, S.; Nguyen, N.-T. Cell stretching devices as research tools: Engineering and biological considerations. Lab Chip 2016, 16, 3193–3203. [Google Scholar] [CrossRef]
  21. Bayas, M.V.; Leung, A.; Evans, E.; Leckband, D. Lifetime measurements reveal kinetic differences between homophilic cadherin bonds. Biophys. J. 2006, 90, 1385–1395. [Google Scholar] [CrossRef] [PubMed]
  22. Diez, S.; Gerisch, G.; Anderson, K.; Müller-Taubenberger, A.; Bretschneider, T. Subsecond reorganization of the actin network in cell motility and chemotaxis. Proc. Natl. Acad. Sci. USA 2005, 102, 7601–7606. [Google Scholar] [CrossRef] [PubMed] [Green Version]
  23. Jiang, G.; Huang, A.H.; Cai, Y.; Tanase, M.; Sheetz, M.P. Rigidity sensing at the leading edge through alphavbeta3 integrins and rptpalpha. Biophys. J. 2006, 90, 1804–1809. [Google Scholar] [CrossRef] [PubMed]
  24. Pierres, A.; Prakasam, A.; Touchard, D.; Benoliel, A.-M.; Bongrand, P.; Leckband, D. Dissecting subsecond cadherin bound states reveals an efficient way for cells to achieve ultrafast probing of their environment. FEBS Lett. 2007, 581, 1841–1846. [Google Scholar] [CrossRef]
  25. Panorchan, P.; Thompson, M.S.; Davis, K.J.; Tseng, Y.; Konstantopoulos, K.; Wirtz, D. Single-molecule analysis of cadherin-mediated cell-cell adhesion. J. Cell Sci. 2006, 119, 66. [Google Scholar] [CrossRef] [PubMed]
  26. Kurazumi, H.; Kubo, M.; Ohshima, M.; Yamamoto, Y.; Takemoto, Y.; Suzuki, R.; Ikenaga, S.; Mikamo, A.; Udo, K.; Hamano, K.; et al. The effects of mechanical stress on the growth, differentiation, and paracrine factor production of cardiac stem cells. PLoS ONE 2011, 6, e28890. [Google Scholar] [CrossRef]
  27. Suzuki, M.; Naruse, K.; Asano, Y.; Okamoto, T.; Nishikimi, N.; Sakurai, T.; Nimura, Y.; Sokabe, M. Up-regulation of integrin β3expression by cyclic stretch in human umbilical endothelial cells. Biochem. Biophys. Res. Commun. 1997, 239, 372–376. [Google Scholar] [CrossRef]
  28. Na, S.; Trache, A.; Trzeciakowski, J.; Sun, Z.; Meininger, G.A.; Humphrey, J.D. Time-dependent changes in smooth muscle cell stiffness and focal adhesion area in response to cyclic equibiaxial stretch. Ann. Biomed. Eng. 2008, 36, 369–380. [Google Scholar] [CrossRef]
  29. Goldyn, A.M.; Rioja, B.A.; Spatz, J.P.; Ballestrem, C.; Kemkemer, R. Force-induced cell polarisation is linked to rhoa-driven microtubule-independent focal-adhesion sliding. J. Cell Sci. 2009, 122, 3644–3651. [Google Scholar] [CrossRef]
  30. Naruse, K.; Sai, X.; Yokoyama, N.; Sokabe, M. Uni-axial cyclic stretch induces c-src activation and translocation in human endothelial cells via sa channel activation. FEBS Lett. 1998, 441, 111–115. [Google Scholar] [CrossRef]
  31. Vogel, V.; Sheetz, M. Local force and geometry sensing regulate cell functions. Nat. Rev. Mol. Cell Biol. 2006, 7, 265. [Google Scholar] [CrossRef]
  32. Davies, P.F.; Tripathi, S.C. Mechanical stress mechanisms and the cell. An endothelial paradigm. Circ. Res. 1993, 72, 239–245. [Google Scholar] [CrossRef] [PubMed]
  33. Thoumine, O.; Ott, A. Time scale dependent viscoelastic and contractile regimes in fibroblasts probed by microplate manipulation. J. Cell Sci. 1997, 110, 2109. [Google Scholar] [PubMed]
  34. Bongrand, P. Physical Basis of Cell-Cell Adhesion; CRC Press Inc: Boca Raton, FL, USA, 2018; p. 149. [Google Scholar]
  35. Gavara, N.; Roca-Cusachs, P.; Sunyer, R.; Farré, R.; Navajas, D. Mapping cell-matrix stresses during stretch reveals inelastic reorganization of the cytoskeleton. Biophys. J. 2008, 95, 464–471. [Google Scholar] [CrossRef] [PubMed]
  36. Melcrová, A.; Pokorna, S.; Pullanchery, S.; Kohagen, M.; Jurkiewicz, P.; Hof, M.; Jungwirth, P.; Cremer, P.S.; Cwiklik, L. The complex nature of calcium cation interactions with phospholipid bilayers. Sci. Rep. 2016, 6, 38035. [Google Scholar] [CrossRef] [Green Version]
  37. Pedersen, U.R.; Leidy, C.; Westh, P.; Peters, G.H. The effect of calcium on the properties of charged phospholipid bilayers. Biochim. Biophys. Acta 2006, 1758, 573–582. [Google Scholar] [CrossRef] [Green Version]
  38. Wang, D.; Xie, Y.; Yuan, B.; Xu, J.; Gong, P.; Jiang, X. A stretching device for imaging real-time molecular dynamics of live cells adhering to elastic membranes on inverted microscopes during the entire process of the stretch. Integr. Biol. 2010, 2, 288–293. [Google Scholar] [CrossRef]
  39. Huang, L.; Mathieu, P.S.; Helmke, B.P. A stretching device for high-resolution live-cell imaging. Ann. Biomed. Eng. 2010, 38, 1728–1740. [Google Scholar] [CrossRef]
  40. Huang, Y.; Nguyen, N.-T.; Lok, K.S.; Lee, P.P.F.; Su, M.; Wu, M.; Kocgozlu, L.; Ladoux, B. Multiarray cell stretching platform for high-magnification real-time imaging. Nanomedicine 2013, 8, 543–553. [Google Scholar] [CrossRef] [PubMed] [Green Version]
  41. Minami, K.; Hayashi, T.; Sato, K.; Nakahara, T. Development of micro mechanical device having two-dimensional array of micro chambers for cell stretching. Biomed. Microdevices 2018, 20, 10. [Google Scholar] [CrossRef]
  42. Sato, K.; Kamada, S.; Minami, K. Development of microstretching device to evaluate cell membrane strain field around sensing point of mechanical stimuli. Int. J. Mech. Sci. 2010, 52, 251–256. [Google Scholar] [CrossRef]
  43. Huang, W.; Ahmad, B.; Kawahara, T. On-line tracking of living cell subjected to cyclic stretch. In Proceedings of the 37th Annual International Conference of the IEEE Engineering in Medicine and Biology Society (EMBC), Milan, Italy, 25–29 August 2015; pp. 3553–3556. [Google Scholar]
  44. Kato, T.; Ishiguro, N.; Iwata, H.; Kojima, T.; Ito, T.; Naruse, K. Up-regulation of cox2 expression by uni-axial cyclic stretch in human lung fibroblast cells. Biochem. Biophys. Res. Commun. 1998, 244, 615–619. [Google Scholar] [CrossRef]
  45. Inoh, H.; Ishiguro, N.; Sawazaki, S.-I.; Amma, H.; Miyazu, M.; Iwata, H.; Sokabe, M.; Naruse, K. Uni-axial cyclic stretch induces the activation of transcription factor nuclear factor κb in human fibroblast cells. FASEB J. 2002, 16, 405–407. [Google Scholar] [CrossRef]
  46. Hsu, H.-J.; Lee, C.-F.; Locke, A.; Vanderzyl, S.Q.; Kaunas, R. Stretch-induced stress fiber remodeling and the activations of jnk and erk depend on mechanical strain rate, but not fak. PLoS ONE 2010, 5, e12470. [Google Scholar] [CrossRef] [PubMed]
  47. Anwar, M.A.; Shalhoub, J.; Lim, C.S.; Gohel, M.S.; Davies, A.H. The effect of pressure-induced mechanical stretch on vascular wall differential gene expression. J. Vasc. Res. 2012, 49, 463–478. [Google Scholar] [CrossRef]
  48. Yu, S.; Duthaler, S.; Nelson, B.J. Autofocusing algorithm selection in computer microscopy. In Proceedings of the IEEE/RSJ International Conference on Intelligent Robots and Systems, Edmonton, AB, Canada, 2–6 August 2005; pp. 70–76. [Google Scholar]
  49. Livne, A.; Bouchbinder, E.; Geiger, B. Cell reorientation under cyclic stretching. Nat. Commun. 2014, 5, 3938. [Google Scholar] [CrossRef] [PubMed]
  50. Barron, V.; Brougham, C.; Coghlan, K.; McLucas, E.; O’Mahoney, D.; Stenson-Cox, C.; McHugh, P.E. The effect of physiological cyclic stretch on the cell morphology, cell orientation and protein expression of endothelial cells. J. Mater. Sci. Mater. Med. 2007, 18, 1973–1981. [Google Scholar] [CrossRef] [Green Version]
  51. Ohashi, T.; Hanamura, K.; Azuma, D.; Sakamoto, N.; Sato, M. Remodeling of endothelial cell nucleus exposed to three different mechanical stimuli. J. Biomech. Sci. Eng. 2008, 3, 63–74. [Google Scholar] [CrossRef]
  52. Jensen, E.C. Overview of live-cell imaging: Requirements and methods used. Anat. Rec. 2013, 296, 1–8. [Google Scholar] [CrossRef]
  53. Beier, H.T.; Ibey, B.L. Experimental comparison of the high-speed imaging performance of an EM-CCD and scmos camera in a dynamic live-cell imaging test case. PLoS ONE 2014, 9, e84614. [Google Scholar] [CrossRef]
  54. Yoshimura, Y.; Kikuiri, T.; Hasegawa, T.; Matsuno, M.; Minamikawa, H.; Deyama, Y.; Suzuki, K. How much medium do you use for cell culture? Medium volume influences mineralization and osteoclastogenesis in vitro. Mol. Med. Rep. 2017, 16, 429–434. [Google Scholar] [CrossRef] [PubMed] [Green Version]
  55. Kubitscheck, U. Fluorescence Microscopy: From Principles to Biological Applications, 2nd ed.; Wiley-Blackwell: Hoboken, NJ, USA, 2017; p. 539. [Google Scholar]
  56. Ortiz de Zárate, J.M.; Sengers, J.V. Chapter 3—Fluctuations in fluids in thermodynamic equilibrium. In Hydrodynamic Fluctuations in Fluids and Fluid Mixtures; Ortiz de Zárate, J.M., Sengers, J.V., Eds.; Elsevier: Amsterdam, The Netherlands, 2006; pp. 39–62. [Google Scholar]
  57. Stark, F.O.; Falender, J.R.; Wright, A.P. 9.3—Silicones. In Comprehensive Organometallic Chemistry; Wilkinson, G., Stone, F.G.A., Abel, E.W., Eds.; Pergamon Press: Oxford, UK, 1982; pp. 305–363. [Google Scholar]
Figure 1. Problems on conventional cell stretching chambers for cell imaging. (a) A diagrammatic sketch of the trapezoidal waveform used for the control of the chamber stretching motor in this study. (b) The chamber is typically made of Dimethylpolysiloxane (PDMS) which is an elastic and transparent material. An actuator is used to deform the chamber in the horizontal direction. It is difficult to continuously observe the target cells with the high magnification of a microscope during stretching. Because, under the stretching motion, the position of the cell is moved from the field of view of the microscope. (c) A stretching method for cell imaging applied by Huang et al. [39]. Vertical displacement of the indenter stretches the membrane, which results in a displacement in the z-direction. Therefore, researchers have to stop the system and adjust the focus to get live cell images.
Applsci 09 01560 g001
Figure 2. Basic concept of the stretching system for real-time compensation. (a) Three motorized stages for chamber stretching (stage 1), and compensation in the horizontal (stage 2) and vertical (stage 3) directions, respectively. (b) The timing chart for compensation.
Applsci 09 01560 g002
Figure 3. Overview of the developed system with the stages. (a) System setup. (b) Stage unit. (c) A stretch chamber with a thin membrane (approximate 200 μm) for on-line cell observation.
Applsci 09 01560 g003
Figure 4. Horizontal displacement trajectories of targets on the chamber membrane. (a) The layout of targets on the chamber membrane and the waveform for the control of stage 1/chamber stretching. (bd) Upper: a typical waveform of point 2, 3, or 4 when the chamber was stretched. Lower: the fit results of the stretching/holding/relaxation phases of the corresponding upper waveform. From (b), original data is drawn in light blue. The lines with color in purple, blue, and black are the lines fitting for the lengthening, holding, and relaxation phases, respectively.
Applsci 09 01560 g004
Figure 5. Vertical displacement trajectories of targets on the chamber membrane. (a) The layout of targets on the chamber membrane and the waveform for the control of stage 1/chamber stretching. (be) Upper: a typical waveform of points 3–6 when the chamber was stretched. Lower: the fit results of the stretching/holding/relaxation phases of the corresponding upper waveform. From (b) to (e), original data is in light blue and filtered data in orange. The lines with color in purple, blue, and black are the lines fitting for the lengthening, holding, and relaxation phases, respectively.
Applsci 09 01560 g005
Figure 6. Vertical displacement trajectories of targets on the chamber membrane exposed to a stretching waveform different from that in Figure 4 and Figure 5. (a) Layout of targets on the chamber membrane and the waveform for the control of stage 1/chamber stretching. (b,c) Upper: a typical waveform of points 1 and 2 when the chamber was stretched. Lower: the fit results of the stretching/holding/relaxation phases of the corresponding upper waveform. In (b,c), original data is in light blue and filtered data in orange. The lines with color in purple, blue, and black are the lines fitting for the lengthening, holding, and relaxation phases, respectively.
Applsci 09 01560 g006
Figure 7. The vertical displacement trajectory of point 3. 1 mL water was added to the stretch chamber before measuring. Lower: the fit results of the stretching/holding/relaxation phases. Original data is in light blue and filtered data in orange. The lines with color in purple, blue, and black are the lines fitting for the lengthening, holding, and relaxation phases, respectively.
Applsci 09 01560 g007
Figure 8. A diagrammatic sketch of the method to determine the maximum displacement values in the horizontal and vertical directions. The C program was used to control the three stages and record the movements of stages 2 and 3 automatically before cyclic stretching. The linear compensation waveforms were formed automatically with the C program for the lengthening, holding, and relaxation phases based on the record. Cyclic stretching was started only after the recognition of the target by human eyes and by pressing the ENTER key.
Applsci 09 01560 g008
Figure 9. An artificial marker was used in the basic experiments to test the effectiveness of compensation. The diameter of the marker was approximate 50 μm. Images at the beginning, middle, and end of a lengthening phase are shown from the left to right. (a) Chamber stretching by stage 1 only (conventional). (b) Chamber stretching by stage 1 with compensation in the horizontal direction by stage 2. (c) Stretching by stage 1 and compensation in horizontal (stage 2) and vertical direction (stage 3).
Applsci 09 01560 g009
Figure 10. Stretch waveform of stage 1 and calculated contrast for each condition. In this experiment, maximum δx and δz were 1.25 mm and 0.11 mm, respectively. (a) The chamber stretching waveform by stage 1. (b) Contrast values of point 3 during the stretching/relaxation process without compensation (corresponding to Figure 9a). (c) Contrast values with the compensation in the horizontal direction (stage 2) (corresponding to Figure 9b). (d) Contrast values with the compensation by stage 2 and 3 (corresponding to Figure 9c).
Applsci 09 01560 g010
Figure 11. Cell morphological response after cyclic stretch exposure using the developed system. Images were captured from a real-time movie. (a) The cell enclosed by the dashed line was selected as the target, and images at the beginning, middle, and end of experiments are shown here. (b) The orientation of the cell with respect to the stretching direction. Analysis results of images with an interval of 5 min. (c) Cell shape change with a time solution of 5 min.
Applsci 09 01560 g011
Figure 12. Analysis of the detailed cell change occurring suddenly from the real-time movie with 30 fps. (a) A cell–cell junction was observed before a sudden disruption between two cells. (b) Analysis of images in the middle of lengthening phases before and after the sudden disruption. The distance of the center of mass was used to demonstrate the drastic changes of cells induced by the disruption of the cell–cell junction. (c) Distance of the center of cells changed over a short period time.
Applsci 09 01560 g012
Figure 13. Images of cells exposed to cyclic stretch captured from an on-line movie.
Applsci 09 01560 g013

