Article

Comparison of Mechanical and Electrical Characteristics of Various Polymers Blended with Ground Tire Rubber (GTR) and Applications

by
Marc Marín-Genescà
1,*,
Jordi García-Amorós
2,
Ramon Mujal-Rosas
3,
Xavier Salueña Berna
4 and
Lluís Massagués Vidal
2
1
Mechanical Engineering Department, Escola Tècnica Superior d’Enginyeria Química-Rovira i Virgili University (ETSEQ-URV), 43007 Tarragona, Spain
2
Electrical Engineering Department, Escola Tècnica Superior d’Enginyeria-Rovira i Virgili University (ETSE-URV), 43007 Tarragona, Spain
3
Electrical Engineering Department, Escola d’Enginyeria de Terrassa-Technical University of Catalonia (EET-UPC), 08222 Terrassa, Spain
4
Mechanical Engineering Department, Escola d’Enginyeria de Terrassa-Technical University of Catalonia (EET-UPC), 08222 Terrassa, Spain
*
Author to whom correspondence should be addressed.
Appl. Sci. 2019, 9(8), 1564; https://doi.org/10.3390/app9081564
Submission received: 14 March 2019 / Revised: 1 April 2019 / Accepted: 11 April 2019 / Published: 15 April 2019
(This article belongs to the Section Materials Science and Engineering)

Abstract

:
The massive manufacture of tires and the difficulty of reducing the stocks of used tires is a serious environmental problem. There are several methods used for recycling wasted tires, one of which is mechanical crushing, in which vulcanized rubber is separated from steel and fibers, resulting in a ground tire rubber (GTR). This can be used in applications such as insulation for footwear work. The aim of the present investigation is to evaluate the use of the GTR when it is mixed with several types of polymer matrix by means of measuring its dielectric and mechanical properties of the resulting composites (polymer + GTR). The analysis is carried out using seven polymeric matrices mixed with different GTR concentrations. With the present study, it is intended to propose a way to reuse the tires out of use as an industrial work footwear insulation, by demonstrating the feasibility of the properties analyzed.

1. Introduction

The global problem of the accumulation of used tires as stores [1,2] has driven the efforts of the scientific community to search for solutions for recovery and reuse of this wasted material. The use of this ground tire rubber (GTR) as reinforcements in composite materials has been widely studied in several works [3]. The presence of GTR in polymer matrix composite materials modifies both the dielectric and mechanical behavior. In general, a thermoplastic or thermosetting polymer acts as a matrix and the elastomer acts as a dispersed phase [4,5,6]. Moreover, as in other two-phase polymer blends, as composites [7,8], the interfacial compatibility between the components is important for achieving the desired properties. In the case of recycled elastomers, expected compatibility is low. One way to increase the compatibility between components is to reduce the degree of cross-linked GTR by devulcanization [9,10,11]. Significant changes in properties are observed when we change the size of the reinforcement particles [12].
In previous investigations [13], it has been shown that there are better mechanical properties for samples with particle diameter under 200 μm than for particles between 200 and 500 μm. The worst mechanical properties are observed for diameters greater than 500 μm. Thus, this research is focused on particles of GTR whose diameter is under 200 μm. Assuming a possible worsening in the mechanical properties of the polymer matrix when mixing with GTR, our goal is to determine what percentage of GTR can be added to a set of polymeric matrices (PVC, EVA, HDPE, PP, PA, ABS, and PS), keeping the mechanical properties within an acceptable range of values, as well as the polymer initial microstructure [14]. This would allow the addition of GTR to various industrial processes, and the recycling of this wasted material. To this end, we have analyzed various concentrations of polymer/GTR (from 0% to 70% of GTR) with the indicated particle size. Finally, we will give some applications that could use these compounds analyzed.
The GTR constitutes the reinforcing agent here. In this way, the GTR would not serve in the applications of high requirements that polymers already have. Most polymeric materials have very good properties as insulating materials, with conductivity values under 10−12 S·cm−1. It is known that with the incorporation of conductive additives such as graphite, carbon black, metallic oxides, and so forth, the conductivity is significantly improved. Without a doubt, carbon black is the most common and easily handled additive; previous investigations [15] have observed that the presence of carbon black and fiberglass, as reinforcement in composite materials, increases both the mechanical properties and the electrical behavior. Composite materials are heterogeneous and their properties depend on the quantity, size, and shape of the reinforcement, as well as other factors such as the preparation thereof, as well as compatibility. Other researchers [16,17] have studied different samples of materials with different compositions and variable proportions of additives such as carbon black (CB).

Featured Application

The objectives of this research are to analyze the mechanical and dielectric behavior of different composite materials obtained by mixing different polymers with different percentages of GTR (up to 70%), to see their response in function of the amount of GTR and its possible feasibility to be used in specific applications in the industrial electric field. Therefore, the double objective of this research is, on one hand, the characterization and study of the physical properties of composite materials and, on the other hand, the use of some of these compounds for industry, giving solutions to the environmental problem of the recycling of this type of waste. Finally, the evaluation is analyzed for applications with GTR, specifically applications such as insulating work footwear; the parameters needed are: >10–6 S/cm, tensile strength >10–12 MPa, and elongation at break >450%, as cited in the regulations UNE-EN ISO 20345/6/7:2005 and UNE 53510.

2. Materials and Methods

2.1. Materials

The polymers used in this study were: polyvinyl chloride (PVC); high-density polyethylene (HDPE) recycled from water bottles; the EVA (Ethylene Vinyl Acetate) copolymer, which is especially suitable for the production of films and extrusion coatings (18% of vinyl acetate and 82% ethylene); polypropylene (PP); acrylonitrile butadiene-styrene (ABS), which is made up of 30% acrylonitrile, 20% butadiene, and 50% styrene, and is an amorphous thermoplastic material, highly resistant to impact; polyamide 6 (PA 6), known as nylon 6, a transparent, hard, and brittle solid that is a semicrystalline thermoplastic with high strength, toughness, and impact resistance and shows good slip behavior and good wear resistance; and polystyrene (PS), a hard and brittle material which is an amorphous thermoplastic, highly resistant to impact. Several properties of these seven polymeric materials are summarized in Table 1 and Table 2.
On the other hand, the old used tire (GTR), with a particle size less than 700 μm, was verified by TGA analysis that its carbon black content was about 35%. The original GTR was separated by sieving into three categories of size particles: <200 μm, 200–500 μm, and >500 μm.

2.2. Preparation of the Compound

The recycled tire powder was dried in an oven at 100 °C for 24 h. Five samples of Polymer/GTR compound, varying the composition (5%, 10%, 20%, 40%, 50%, and 70% of GTR), were prepared. The mixing process was done with a Brabender mixer machine (see Figure 4a), at different temperatures and to prevent degradation of the polymer, and a mixing time limited to 4 min. Polymer/GTR laminates were obtained by using a hot plate press at 100 kN and different temperatures for 10 min depending on the polymer to be treated. The cooling stage was done with a closed water circuit, which was held in the same press and pressure for 5 min. Samples for testing were properly set up according to the specifications of ASTM-D-638 type V. A sample of the pure polymer was also prepared with the same requirements in order to obtain comparable results. Five specimens for testing were used.

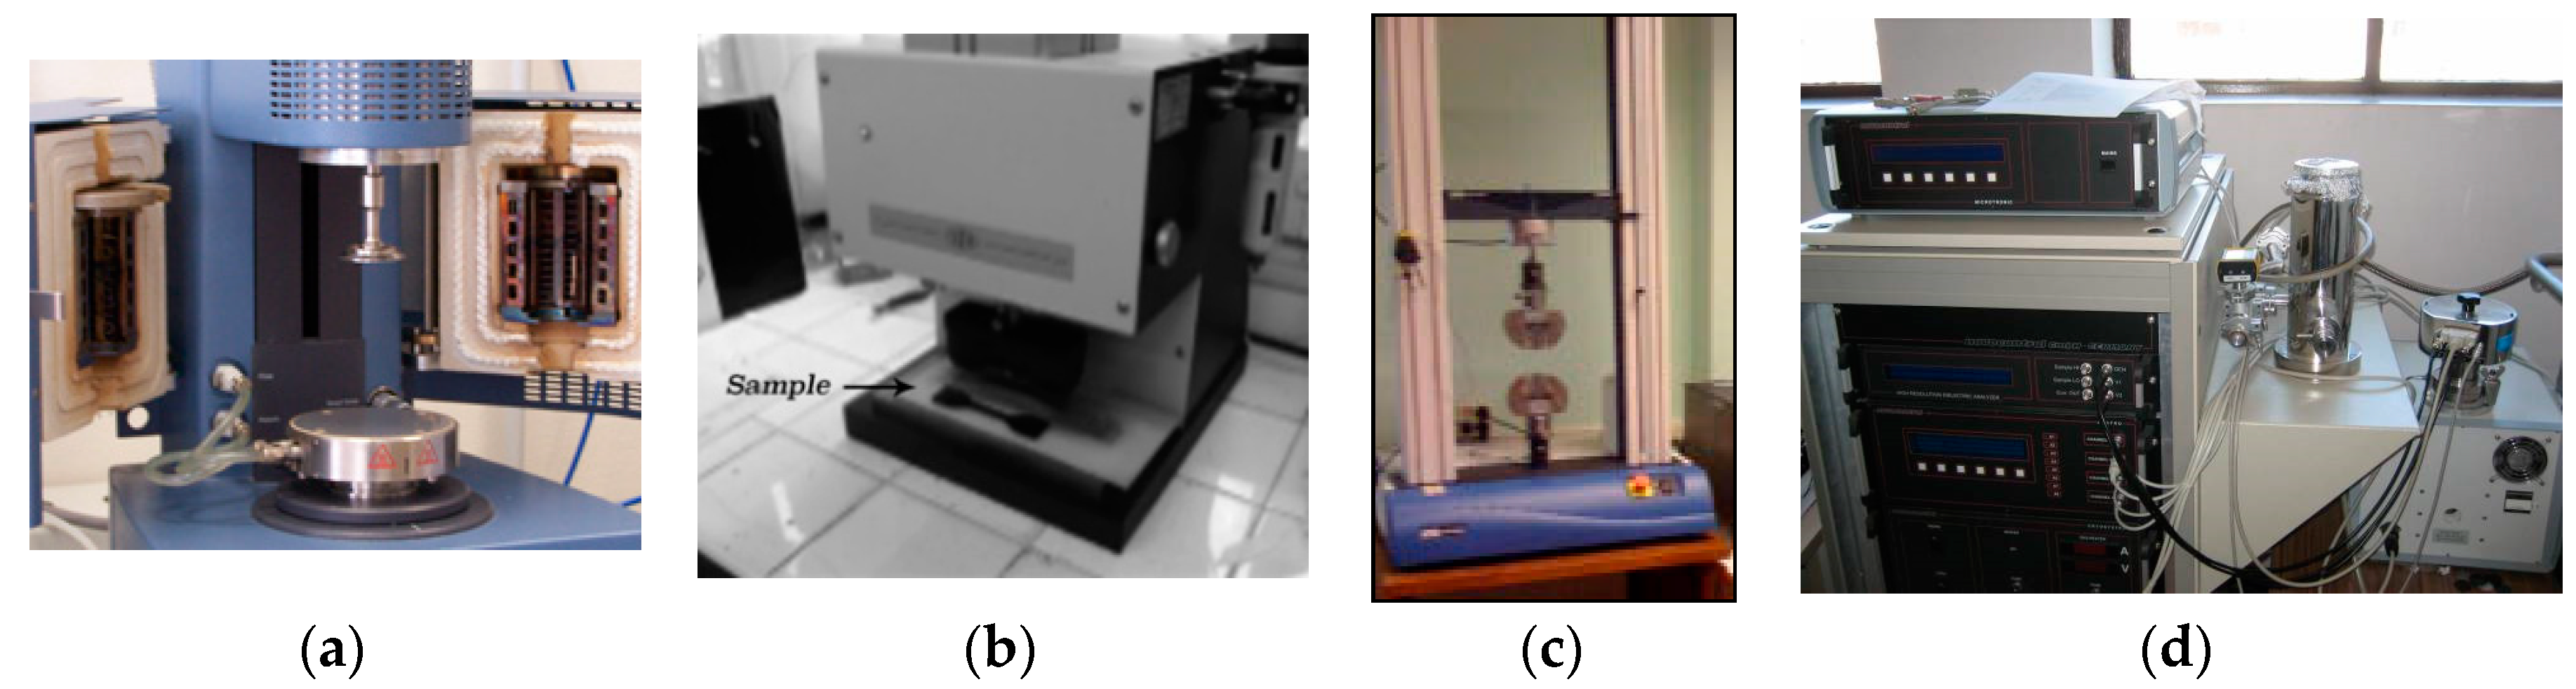
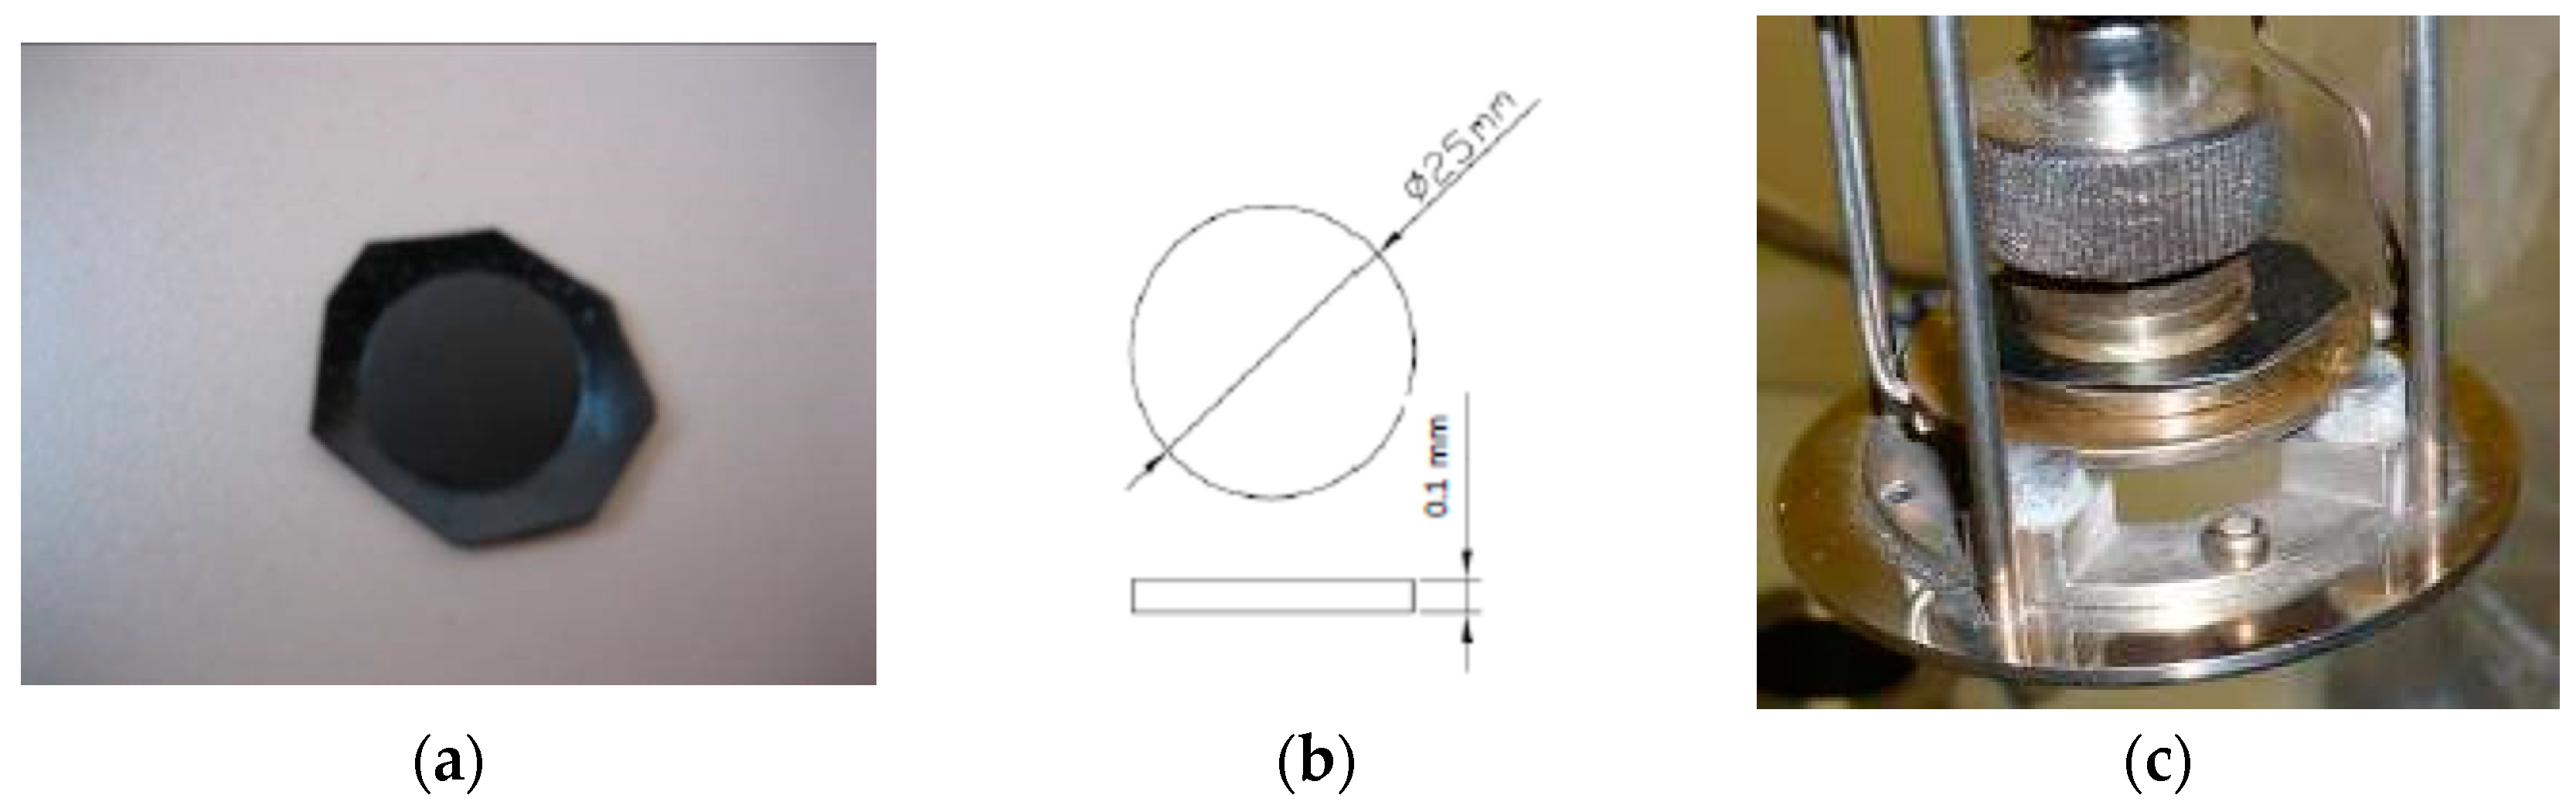
2.3. Mechanical Analysis

Stress–strain tests were carried out with an Instron 3366–10 kN universal machine (Instron, High Wycombe, UK), following the specifications of ASTM-D-638 type V. The test speed was 20 mm/min. The test temperature was 23 ± 2 °C, and the relative humidity was of 50 ± 5%. The study of mechanical properties, according to the GTR concentration in the matrix and the particle size, included the Young’s modulus, tensile stress, elongation at break, and toughness. Five specimens for testing were used (Figure 1). The mean and standard deviation were calculated for each magnitude, leaving out of account those samples with such a result that was proven to be defective.
This paper reports laboratory tests conducted on a series of seven polymer matrices blended with an increasing percentage of GTR (0%, 5%, 10%, 20%, 40%, 50%, 70%) in order to evaluate the elastic parameters of the resulting composites. Five specimens (see Figure 4b) were tested until failure for each composite to determine the σ–ε relationship in uniaxial tension. The pure polymer matrix material can be considered as a homogeneous isotropic material [18], resulting in simple relations between the elastic constants: E = 2 · G · ( 1 + ν ) , where ν is the Poisson’s ratio, G the shear modulus (MPa), and E the Young’s modulus (MPa). The Young’s modulus E is a measure of the stiffness of the material, only for the linear strain–stress behavior. The Poisson’s ratio ν is related to the ratio between lateral and longitudinal strain in uniaxial tensile stress.
Figure 2 shows the curves obtained from the test of the PP and ABS blended with the full range of GTR concentrations. As it can be seen, the mechanical characteristic is greatly influenced by the GTR. At high concentrations of GTR ( 30%), the curves are concave (see Figure 2 red curves). In this study case, the complex morphology of the matrix polymer blended with GTR particles does not allow the use of the standard elastoplastic equations or the classical approach. For this reason, and in the same way as [19], a simple uniaxial tensile stress–strain relation is proposed, based on three parameters, σ Y , ε Y , and n.
σ = σ Y · [ 1 ( 1 + ε ε Y ) n ]
where σ Y is the yield strength and ε Y the elongation at yield. The exponent n is a value greater than 1. The model is used to fit the blended polymer composite at high GTR concentrations (e.g., 30–70%), see Figure 3. The Young’s modulus (E) can be obtained differentiating (1), resulting in:
E ( ε ) = d σ d ε = n · σ Y ε Y · ( 1 + ε ε Y ) n + 1

2.4. Dynamic Electric Analysis

Dielectric analysis was carried out with particles smaller than 200 μm, because they offer better results in all thermal and mechanical tests (see Figure 4c). Dielectric parameters were measured by means of the dynamic electric analysis (DEA) with a BDS 40 broad-band dielectric spectrometer, which incorporates a Novocontrol Novotherm temperature sensor and uses 2 cm diameter compression molds. The data were obtained by using a parallel plate sensor. For this test, a piece of test specimens was placed between two electrodes in contact with the sample (see Figure 5a–c). The dielectric permittivity ( ε ′), the dielectric losses ( ε ″), as well as the conductivity were measured by DEA (see Figure 4d). Parameters must be set before starting the dielectric test. When these parameters are defined, the machine can be activated, which will give an alternating current between the two electrodes. Two responses result from this current: a resistive intensity and a reactive intensity. The phase difference between these two intensities calculates the electrical parameters: real permittivity, imaginary permittivity, phase angle, and conductivity. The dimensions of the specimens were defined by ASTM D-150; the specimens were cylindrical, 2.5 mm in diameter, and 0.1 mm in thickness. After obtaining the results of the different samples, the dielectric potential of the mixture of materials in depth was analyzed.

2.4.1. Conductivity

At low frequencies (below 100 Hz) and low temperatures, the conductivity is independent of frequency. On the other hand, in the regime of high frequencies, the dependency is seen as linear on a logarithmic scale. This is consistent with a sublinear dispersive conductivity of the type:
σ   =   σ 0 + A · ω n
where σ0 is the conductivity to direct current (DC) conductivity, ω = 2π·f, where f is the frequency (50 Hz), while A and n (which have values between 0 and 1) are parameters which depend on temperature, material, and GTR content. This relation is known as the “universal dynamic response”, as was described by Leon et al. [20], and is associated to materials with a high degree of disorder such as the composites analyzed. The frequency that delimits one or the other regime is not fixed, and it moves towards higher values with temperature [20,21].

2.4.2. MWS Relaxation

The dielectric relaxation (Maxwell–Wagner–Sillars, MWS [22,23]) for materials with different phases, as the composites analyzed, is manifested with the percentage increase in GTR. An MWS interfacial relaxation process is found at low frequencies, as in the present investigation. We can obtain the relaxation frequency with the Arrhenius model for thermally activated mechanisms. We can see the MWS behavior in accordance with the following expression:
f   =   f 0 · e E a / k T
where f is the frequency of maximum relaxation, f0 is the natural frequency, Ea is the activation energy, k is the Boltzmann constant, and T is temperature in Kelvin. Parameters obtained from the linear regression line in the graph allows us to see the activation energy behavior Ea, while relaxation time τ0 changes, for the analyzed dielectric relaxation with increasing GTR content in the compounds.

2.4.3. Electrical Permittivity

The permittivity of the vacuum ε 0 is 8.8541878176 × 10⁻¹² C2/N·m2
ε 0   =   1 c 2 · μ 0
where c is the speed of light and μ0 is the magnetic permeability of the vacuum. The permittivity is determined by the tendency of a material to polarize before the application of an electric field. The real or absolute unit (ε′) is calculated:
ε = ε ε 0
The imaginary permittivity ( ε ) is:
ε = 1 σ · ε 0
where σ is the conductivity and ε0 is the permittivity of vacuum. Finally, the delta tangent describes the relation between the real and imaginary parts of the permittivity:
Tan δ   = ε ε
where ε″ is the imaginary part of permittivity and ε′ is the real part of permittivity.

3. Results and Discussion

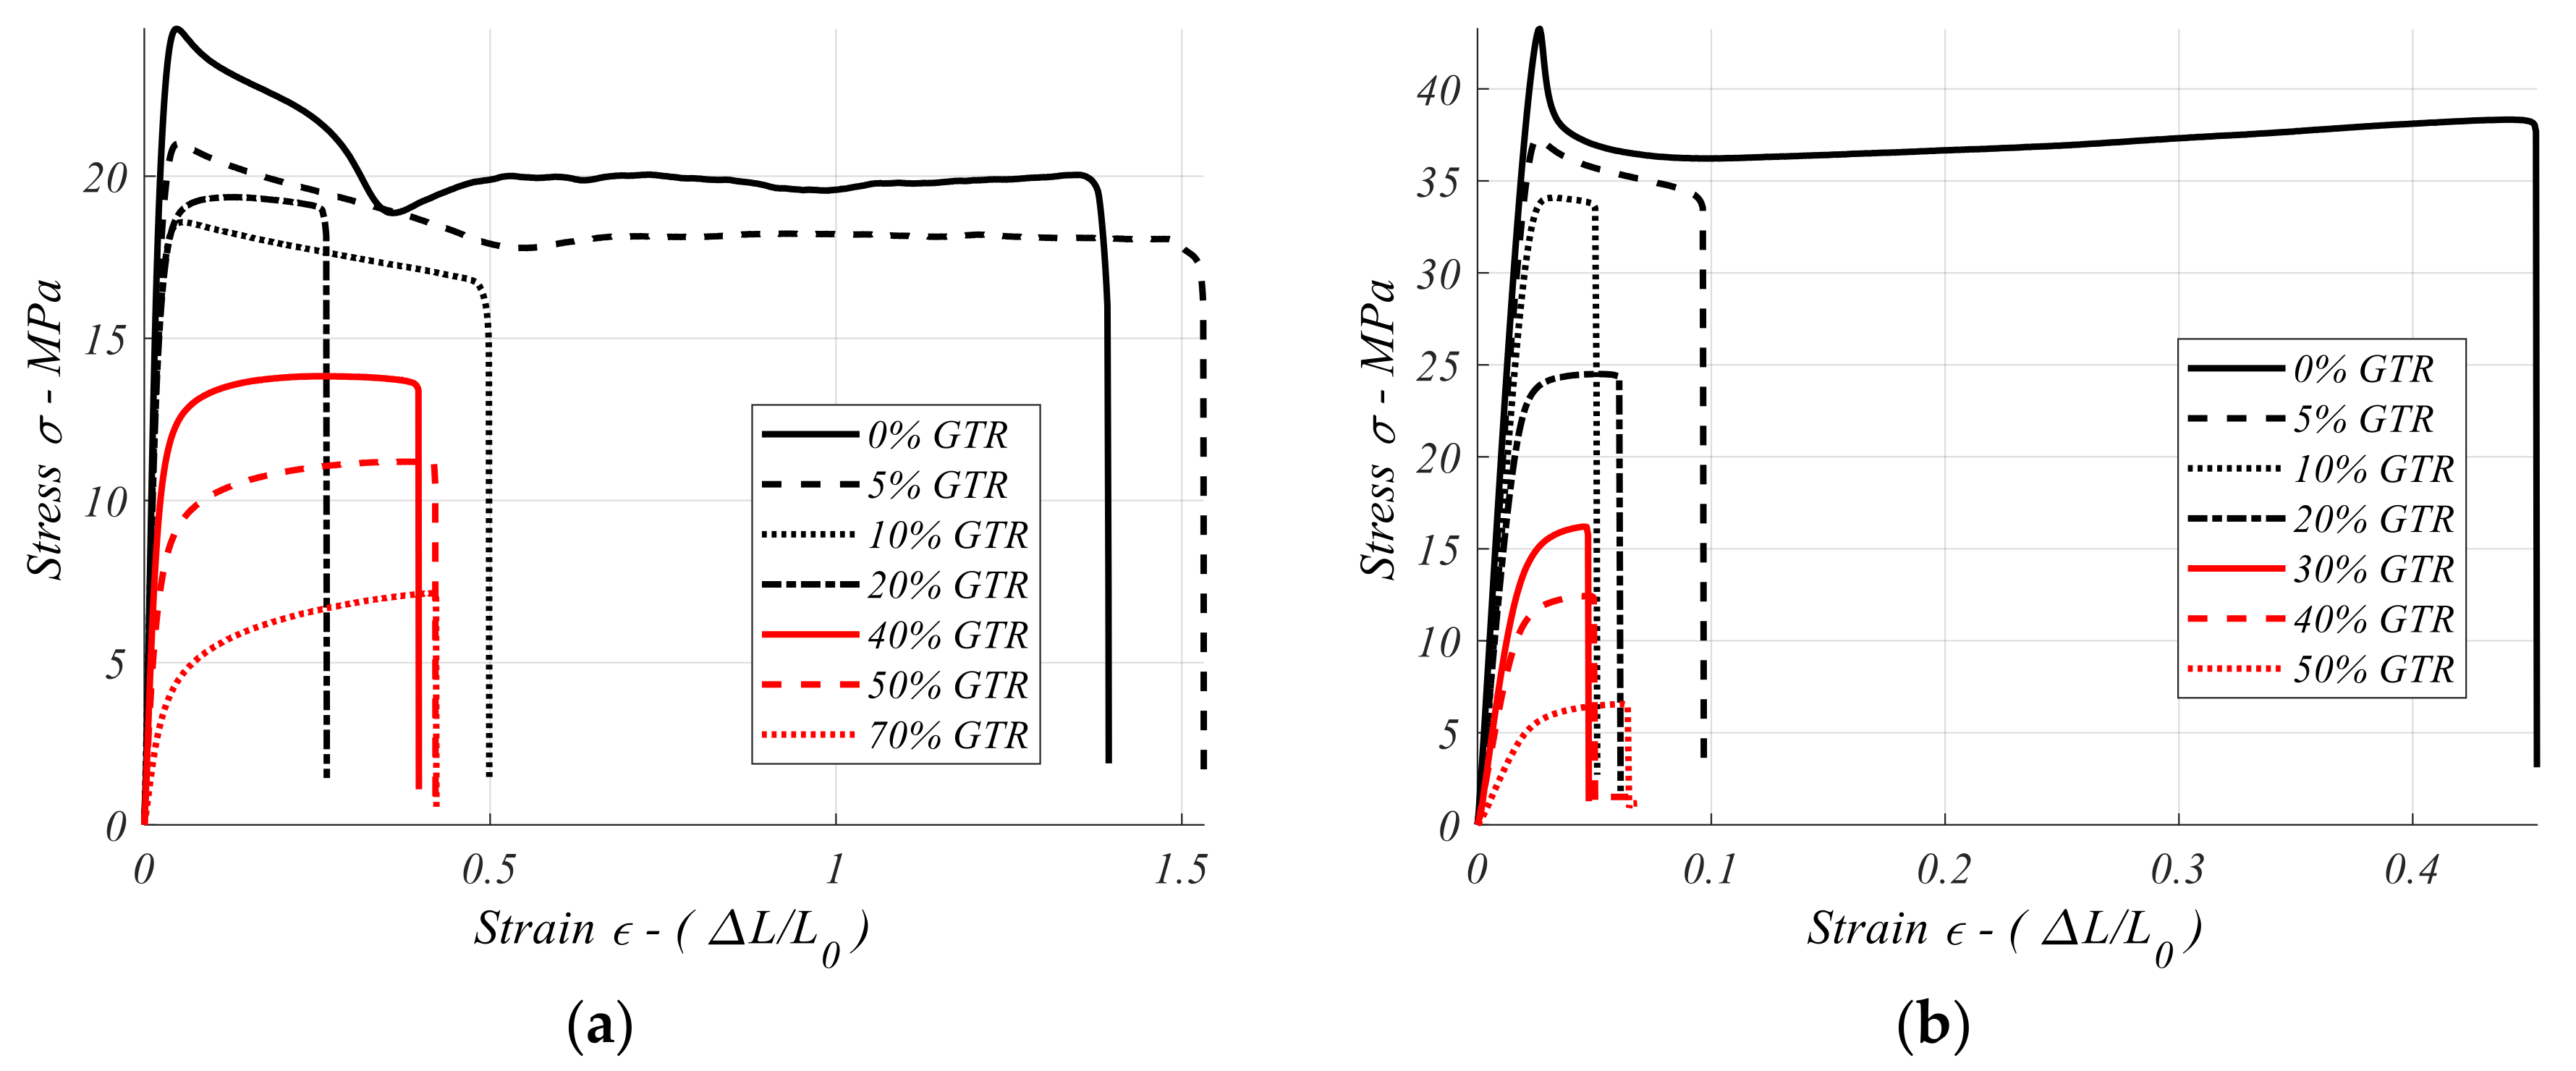
3.1. Mechanical Properties

Mechanical Comparative of All Seven Polymers/GTR

As we can see in the Figure 6a,b and Figure 7a,b analyzed, the addition of old, used tire particles in all compounds produces a decrease in the four mechanical properties analyzed in general like Young’s modulus (Figure 6a) and tensile strength (Figure 6b) elongation at break (Figure 7a) and toughness (Figure 7b). For the Young’s modulus analysis, we can see how the PVC and EVA compounds have better behavior with the addition of the GTR percent in the composite, and in the tensile strength analyzed, we can see how the PA and PVC compounds have better behaviors with the addition of quantities of GTR (near 70%).
From the observation of the comparative graph of the Young’s modulus (Figure 6a), it can be deduced that the analyzed materials have comparable characteristics of the Young’s modulus. Of all of them, those with a higher Young’s modulus are: PVC, PA, and ABS (3028.89, 2841.47, and 2522.37 MPa, respectively). Highlighted, the PVC polymer reaches 3028.89 MPa, and secondly, and in a range of very similar values, the PA polymer (2841.47 MPa) is located. With the addition of GTR particles, in general, the properties of Young’s modulus fall. It must be said that, in general, comparatively, the polymer with the best properties of the Young’s modulus is PVC, and with percentage of GTR of 20%, a good behavior of the Young’s modulus is observed for particle sizes <200 μm (2225.87MPa); however, for percentages of GTR greater than 20% (40%, 50%, 70%: 2005.87, 1900, 1627 MPa, respectively), the behavior of the Young’s modulus drops to values close to 40% of the value of the polymer without additive. The analyzed composites, in general, have worse behaviors of the Young’s modulus with the addition of GTR, except for the PS and the HDPE composites, for which the addition of GTR positively affects these composites (PS, HDPE), increasing the Young’s modulus for percentages of GTR of 5, 10, 20%. A very prominent case is the EVA copolymer, which has very low Young’s modulus properties (13.26 MPa) which improves with the incorporation of GTR (41.67 MPa for EVA + 10% GTR).
In the comparative graph of tensile strength (Figure 6b), it can be deduced that the materials analyzed have comparable characteristics of resistance to breakage. Of all of them, those that have a greater resistance to breakage are: PA, ABS, PS, and PVC. In a very prominent way, the PA polymer reaches 50.41 MPa, and in second place is the ABS polymer (44.98 MPa) from the addition of GTR particles, the properties of resistance to breakage (5% GTR), the following value of breaking strength is obtained: 19.67 MPa; this is the exception found in the present analysis. In general, small percentages of GTR additive (5%) result in worse behavior of tensile strength. Comparatively, the polymer with the best breaking strength properties is the PA and with percentages of GTR of up to 20%, a good behavior of the breaking strength (47.39 MPa) is observed, however, for percentages of GTR greater than 20% (40%, 50%, 70%), the behavior of the breaking strength drops to values close to values of 50% breaking strength of the polymer without additive. For the rest of the materials, it can be deduced that, in general, they have good breaking strength behaviors, although for PS and EVA (38.89 MPa and 23.08 MPa, respectively), the addition of GTR negatively affects these properties, and they suffer a certain drop in breaking strength for percentages higher than 20% of GTR (40%, 50%, 70%). For example, for the PS + 40/50/70% GTR, the following values of breaking strength are: 19.07, 15.93, 11.80 MPa, respectively, and for EVA compounds + 40/50/70% GTR, the values of breaking strength of 7.02, 5.70, 5.46 MPa, respectively, are obtained, from which they already represent less than 50% of the resistance (MPa) of the polymeric matrix (the polymer without GTR).
In general, analyzing the graph of elongation at break (Figure 7a), materials that have special characteristics of elongation at break are highlighted; these are basically, very prominently, the EVA copolymer (704.6%) and in second place is the PP polymer (346.71%). From the addition of GTR particles, the elongation properties of PP dramatically fall, and only for particles of sizes <200 μm there is a certain attenuation of this considerable fall of the elongation. Comparatively, the polymer with better elongation properties is the EVA and with percentages of GTR of up to 10–20%, a good behavior to the elongation is observed: EVA + 10% GTR: 438%; EVA + 20% GTR: 351.53%. For particles of sizes <200 μm, however, for the PP with the same percentage (10–20%), its elongation behavior is very poor, reaching 15% of the polymer without reinforcement (PP + 10% GTR: 41.73%; PP + 20% GTR: 33.89%). For the rest of materials, there is the PS and the HDPE that have certain elongation properties, although they do not reach values of 100% elongation at break (PS: 66.27%, HDPE: 50.12%). The addition of GTR negatively affects these properties, but suffers a certain drop in % elongation to percentages of 20% GTR (PA + 20% GTR: 23.30%, HDPE + 20% GTR: 20.01%) which already represents percentages less than 50% of the polymer matrix. Is observed that for elongation at break of the GTR compounds (for particle sizes <200 μm) [24,25], the optimum behavior is for EVA compounds, which go from 704% to 528%, 437%, and 351%, which means decreases of 29%, 43%, and 50% for GTR concentrations of 5%, 10%, and 20%, respectively. From 40% concentration, the values are always lower than 3.5 times those of pure EVA. Is seen that the reduction of deformation capacity of the elastomer influences the decrease in elongation, and the decrease in elongation at break is related to the imperfect interfacial adhesion between components. The rest of the polymers have very low values for the elongation at break and toughness properties. The incidence of poor adhesion between phases is a particularly important result [26,27].
From the comparative graph of toughness (J), it can be concluded that the materials analyzed have very heterogeneous characteristics of energy at break or hardness, and subsequently, the decrease of hardness, and we have similar behaviors of the toughness property for the EVA/GTR composites. Regarding toughness, these drops are even greater. Actually, the toughness goes from 72.3 J for pure EVA to 40 J or 29.2 J for 5% and 10% GTR concentrations. It will decrease even more for larger particle sizes. For concentrations above 20%, considerations on the particle’s size or the percentage of GTR are not important at all, since even 10 J of energy are not reached in any case, and it means that these values are seven times lower than the original EVA. Of all of compounds analyzed, those that have a greater energy to the break are: EVA, PP, and in a second level, ABS and HDPE polymers would be located. The EVA polymer stands out at 72.32 J and, secondly, the PP polymer (64.22 J) is located in a very similar range of values. From the addition of GTR particles, the properties of the energy at break (J) dramatically decrease. For PP with 10–20% of GTR, the breaking energies of the compound decrease significantly, from 5.84 J–4.99 J. Comparatively, the polymer with the best breaking energy properties is the EVA copolymer and with percentages of GTR of up to 20%, a good behavior of the energy at break (20.24 J) is observed for particles of size <200 μm, unlike for percentages of GTR greater than 20% (40%, 50%, 70%) the behavior of the energy at breakdown (10.16 J, 4.51 J, 3.86 J, respectively) at values close to 40% value of the polymer without additive. For the PP, ABS, and to a lesser extent the HDPE, the addition of GTR affects very negatively the properties of resistance to breakage (J), and suffers a vertiginous fall of the resistance to breakage for percentages in GTR from 5% of GTR, not reaching values of 5% with respect to values of the matrix without GTR. For HDPE, the addition of GTR does not so severely affect the breaking Strength. Very prominent cases are the polymers PVC, PA, and PS, which have very low energy breaking properties, comparatively have very little properties of breaking energy for these polymers, and with the addition of GTR, they worsen said characteristics.
As it can be seen in Table 3, mainly, the highest values of property are corresponding to the pure polymer (0% GTR), with some important exceptions as are highlighted in the table. For EVA, HDPE, PA, and PS, some mechanical properties are improved by the addition of microparticles (<200 µm) of GTR in the matrix of the polymer. The mechanical parameters are significantly influenced by the GTR. Basically, it is observed that at the mechanical levels, the properties of the pure matrix of the polymer are maintained, approximately, between 10 and 20% contribution of GTR particles (for particle size ≤200 microns). The interaction of the matrix with the GTR particles is rather low, and therefore, it accepts this low content of GTR in its matrix. For values higher than 20% of GTR in the polymeric matrix, mechanical properties decrease dramatically.
Adding the GTR in the matrix (5–10%) for EVA, PS, and HDPE composites, the Young’s modulus of the compound increases, although other mechanical properties decrease as it happens, and for the rest of the cases, the Young’s modulus gets worse. This behavior may be due to the fact that reinforcement matrix is correct for these formulations, and therefore, some mechanical properties such as stiffness improve. However, for GTR concentrations above 20%, all mechanical properties decrease, except for PA composites.

3.2. Analysis of Electrical Results

3.2.1. Comparison of Conductivities and Loss Tangent (Tg of δ)

For compounds with GTR contents (at 30 °C), the PA samples are the most conductive of the samples analyzed (see Figure 8a). With the increase in GTR, the conductive behavior of the samples, in most of the cases analyzed, is increased up to two orders of magnitude for pure PA. From 0–5%, the conductive behavior is more heterogeneous, the PS and PP being the least conductive. For pure PS and PP, at 50 Hz there are some conductivities of 10−13 and 10−11 S/cm. For 70% GTR, the PS is revealed as the most insulating material (10−14 S/cm) followed by ABS, for which, at industrial frequency (50 Hz), is observed a conductivity of 10−10 S/cm. For pure PVC (0% GTR), the most resistive without GTR are HDPE, PS, and PP, followed by EVA, PVC, and ABS, and finally the PA is found as the least resistive. Thus it is observed that with the addition of the GTR, the conductive behavior of almost all polymers tends to converge, except for the case of the PA, which remains two orders of magnitude above the rest of the polymers analyzed, that is, for the 40–50%, PA: 4.95 × 10⁻¹³ and 1.73 × 10⁻¹² S/cm, and for the rest of the polymers, 10−15 S/cm, and in the case of ABS and PS, for the 40% of GTR, they reach conductivities of 1.05 × 10⁻¹⁴ and 1.32 × 10⁻¹⁴ S/cm, respectively. These results can be interpreted as worse electrical behavior composites than others’ experiences with carbon black (CB) [28,29].
Observing the Tangent (Tg) of δ analyzed for the case of the seven polymers + GTR (see Figure 8b), the material with the highest tangent of delta is polyamide, which without additives of GTR presents values of 10−1, and it is deduced that the addition of GTR affects the Tg of δ in this case, since it increases an order of magnitude the Tangent of δ. Thus the materials with smaller Tg of δ are the PP, HDPE, EVA, and PS (0.001); they are followed by PVC and ABS (0.01), and finally with greater Tg of delta is the PA (0.1). For increases of the proportion of GTR, this ratio changes, tending to converge all the polymers in Tangent of delta 10−1 and with few variations with the increase of temperature, with the exception of PVC and of the PA. The general tendency is to increase the value of the Tg of δ with increases in temperature. The polyamide experiences strong increases in the Tg of δ with the temperature in percentages of GTR of 40–70% and goes from Tg of delta from 0.1 to 10. In low concentrations of GTR, the Tg of δ is heterogeneous and as GTR is added, the behavior begins to be assimilated. In general, the Tg of δ oscillates between 10−1 and 10−2 for almost all polymers except for the PA; the addition of GTR increases one order of magnitude. PVC has a variable behavior of up to an order of magnitude from the addition of GTR.

3.2.2. Comparison of Real and Imaginary Permittivities

The material with the greatest real permittivity is polyamide (see Figure 9a), which without additives of GTR presents values of 2.5, and it is deduced that the addition of GTR affects the imaginary permittivity in this case (see Figure 9b). Thus the materials with lower real permittivity are PP, HDPE, EVA, and PS (between 1 and 2 for Tª: 30 °C), followed by PVC and ABS (3.27 and 3.34 for Tª: 30 °C), and finally with greater real permittivity is the PA (4.34). For increases in the proportion of GTR, this relationship changes, tending to converge all polymers and with very few variations with the increase in temperature, with the exception of PVC, PA, and EVA. In low concentrations of GTR, the ε′ is heterogeneous and as GTR is added, the behavior begins to be assimilated. In general, the ε′ oscillates between 2 and 20 for almost all the polymers; the addition of GTR does increase an order of magnitude. The PVC has a variable behavior, up to two orders of magnitude from 0% GTR to 50% addition of GTR.
The material with the highest imaginary permittivity is polyamide (see Figure 9b), which without additives of GTR presents values of 1, and it is deduced that the addition of GTR does not affect the imaginary permittivity in this case. Thus, the materials with lower imaginary permittivity are PP, HDPE, EVA, and PS (0.000375, 0.00718, 0.000322 for Tª: 30 °C), followed by PVS and ABS (close to 0.1), and finally with greater imaginary permittivity is the PA (close to the unit); for increases in the proportion of GTR this ratio changes. In low concentrations of GTR, the ε″ is heterogeneous and as GTR is added, the behavior begins to assimilate. In general, the ε″ ranges from 1 to 10−1 for almost all polymers; the addition of GTR increases by an order of magnitude. PVC has a variable behavior of ε″ of up to two orders of magnitude from the addition of GTR (0.49 to 22.96).

4. Discussion about the Influence of GTR in the Electrical Measurements

The value of the dielectric constant is very much linked to the polarization of orientation. When the polarization of orientation increases, the dielectric constant also increases, and the polarization of orientation is due to the presence of permanent dipoles in a molecule [30]. It is necessary to understand that the presence of GTR (and more especially of carbon black, the main component of the GTR) creates changes in the structure of the polymer. But the most important conclusion of this study is that when the carbon atoms are placed between the chains of the polymer, they indirectly decrease the chain–chain distance and therefore the movement of free volume. Therefore, it can be deduced that the structure changes created by the presence of GTR in the polymer can also create changes (increases) in the dipole moments and therefore in the polarization and the dielectric constant that has been measured. The study of the dielectric properties of polymers reinforced with GTR has shown that the presence of a tire out of use in thermoplastics increases the values of the real permittivity (or dielectric constant), the imaginary permittivity, the conductivity, and delta tangent. It has also been possible to see that the presence of GTR is not the only factor influencing the different dielectric properties. In each case, evolution is created by changes in polarization (in particular by polarization of orientation), through changes in measured properties. The presence of a tire out of use causes the evolution of the polarization, changing the structure and dipole moments of the polymer, especially thanks to the carbon black it contains. The electrical properties of an insulator have to be adopted for special uses, which means, in general, that the dielectric constant has to be small. It is noted that the measured values of the dielectric constant with the samples used vary between 2.2186 (HDPE only, 30 °C) and 7.66 (HDPE with 50% GTR, 30 °C) at a frequency of 50 Hz. (50 Hz is the frequency that interests us because it is the frequency of electric current distributed by the grid in Europe.) Regarding dielectric constant, mixtures of polymers and pneumatics can be used as insulation, for cases of PA at high concentrations of GTR cannot be considered as an insulator (K = 14.5).

5. Conclusions

Firstly, stress–strain tests show how, by adding the GTR in the matrix up to 10%, the Young’s modulus of the compound increases, although other mechanical properties decrease with the EVA, PVC, and HDPE composites. This behavior may can be due to the reinforcement matrix being correct for these formulations, and therefore, some mechanical properties such as stiffness improve. However, for GTR concentrations above 20%, all mechanical properties decrease. The results obtained from the analysis of these compounds show that 10–20% GTR concentration is the limit concentration value for keeping acceptable values of mechanical and dielectric properties of the compound. This would allow its use in various fields of industry, and through these applications we could introduce recycled GTR in industrial applications, and so we could give also an exit to quantities of GTR in disuse that nowadays represent a problem in both its storage and its recycling.
On the other hand, the dielectric parameters are significantly influenced by the GTR content from 20% concentration [31]. The activation energy decreases considerably while the natural relaxation times grow exponentially. This behavior is attributed to the possible interaction between GTR particles when the concentration of these particles is higher than 20%. Basically, it is observed that at the dielectric and mechanical levels, the properties of the pure matrix of the polymer are maintained, approximately, between 10 and 20% contribution of GTR particles. The interaction of the matrix with the GTR particle is rather low, and therefore, it accepts this low content of GTR in its matrix. For values higher than 20% of GTR in the polymeric matrix, both mechanical and dielectric properties decrease dramatically. Comparatively, it can be deduced from the observation of the data resulting from HDPE, PVC, EVA, PP, PA, ABS, and PS with GTR that the analyzed properties of the matrix can undergo some significant changes depending on the amount of GTR that is supplied to the polymeric matrix [32,33], that is, some important properties vary according to the percentage of GTR contributed, so it is concluded in the following: PVC, PP, HDPE, ABS, PS, and EVA with 10–20% of GTR have good results dielectrically and mechanically. Mechanically, it is verified that HDPE, ABS, PS, and PVC behave in a similar way, and the EVA and PP have a more flexible behavior than the rest of the analyzed compounds, and therefore have greater elongation at break.
Compounds with high filler concentration (from 40% to 70% of GTR) result in an increase in the faults and cracks in the matrix, worsening interface adhesion between matrix and filler, and as a result, worsening all the mechanical properties analyzed. Nevertheless, at low concentrations of GTR in the matrix (from 5% to 20% GTR), the interfacial cohesion is still acceptable, whereas with percentages of 40% GTR, the particles start to show important discontinuities on their surface with pores and cracks and weaken the compound. The GTR concentration influences the compounds worsening their interfacial union.
Further and later research is needed to focus on aspects of thermal and structural analysis of the composites (polymer/GTR) which can help lead to a deeper study of the observed physical behavior. Analysis with SEM (Scanning Electron Microscopy) microphotographs in order to make a complete structural analysis, and a calorimetric analysis, which will show the dynamic thermal behavior of the samples using heat flow differential scanning calorimetry (DSC Thermal Analysis), can complement the research shown in this paper and the results obtained.
After obtaining the results of the different samples and checking the mechanical and dielectric data, real values are compared with values of the appropriate standards in each case to determine the viability of the material and the mixtures adopted; as in this research, in general, other authors had tried to give solutions to the waste management for reuse [34,35]. The final application allowing its use in industry will be defined based on the study of the UNE regulations, so, after this study, only the EVA + 10% GTR composite analyzed can be used for work footwear insulation, because its parameters are in the regulation limits: >10−6 S/cm, tensile strength >10−12 MPa, and elongation at break >450%. According to the regulations UNE-EN ISO 20345/6/7:2005 and UNE 53510, this composite obeys these values.

Author Contributions

The individual contribution of each author is: Introduction, Abstract, and Methodology: M.M.-G., Graphs, Results, and Model: J.G.-A., Conclusions: R.M.-R. and M.M.-G., L.M.V., X.S.B.

Funding

This research was funded by the MINISTERIO DE ECONOMIA Y COMPETITIVIDAD, Gobierno de España ENE2015-64117-C5-3-R (MINECO/FEDER).

Acknowledgments

This work was funded by the Ministerio de Economía y Competitividad de España ENE2015-64117-C5-3-R (MINECO/FEDER). The DEA equipment has been provided by the research group on dielectric materials of the UPC (Dilab).

Conflicts of Interest

The authors declare no conflict of interest.

References

  1. European Tyre Recycling Association (ETRA). Available online: www.etra-eu.org (accessed on 15 February 2019).
  2. Liu, H.S.; Richard, C.P.; Mead, J.L.; Stacer, R.G. Development of Novel Applications for Using Recycled Rubber in Thermoplastics; Technical Research Program; Chelsea Center for Recycling and Economic Development, University of Massachusetts: Lowell, UK, 2000. [Google Scholar]
  3. Mujal, R.; Marin, M.; Orrit, J.; Rahhali, A.; Colom, X. Dielectric, mechanical, and thermal characterization of high-density polyethylene composites with ground tire rubber. J. Thermoplast. Compos. Mater. 2012, 25, 537–559. [Google Scholar] [CrossRef]
  4. Figovslq, O.; Beilin, D.; Blank, N.; Potapo, J.; Chernyshe, V. Development of polymer concrete with polybutadiene matrix. Cem. Concr. Compos. 1996, 18, 437–444. [Google Scholar]
  5. Hernandez-Olivares, F.; Barluenga, G.; Bollatib, M.; Witoszekc, B. Static and dynamic behaviour of recycled tyre rubber-filled concrete. Cem. Concr. Compos. 2002, 32, 1587–1596. [Google Scholar] [CrossRef]
  6. Goncharuk, G.P.; Knunyants, M.I.; Kryuchkov, A.N.; Obolonkova, E.S. Effect of the specific surface area and the shape of rubber crumb on the mechanical properties of rubber-filled plastics. J. Polym. Sci. Part B Polym. Chem. 1998, 40, 166–169. [Google Scholar]
  7. Dierkes, W.K. Rubber recycling. In Recent Research Developments in Macromolecules; Pandalai, S.G., Ed.; Research Signpost: Trivandrum, India, 2003; Volume 7, pp. 265–292. [Google Scholar]
  8. Radeshkumar, C.; Karger-Kocsis, J. Thermoplastic dynamic vulcanisates containing LDPE, rubber, and thermochemically reclaimed ground tyre rubber. Plast. Rubber Compos. 2002, 31, 99–105. [Google Scholar] [CrossRef]
  9. Yehia, A.; Mull, M.A.; Ismail, M.N.; Hefny, Y.A.; Abdel-Bary, E.M. Effect of chemically modified waste rubber powder as a filler in natural rubber vulcanizates. J. Appl. Polym. Sci. 2004, 93, 30–36. [Google Scholar] [CrossRef]
  10. Colom, X.; Andreu-Mateu, F.; Cañavate, F.J.; Mujal, R.; Carrillo, F. Study of the influence of IPPD on thermo-oxidation process of elastomeric hose. J. Appl. Polym. Sci. 2009, 5, 2011–2018. [Google Scholar] [CrossRef]
  11. Cepeda-Jimenez, C.M.; Pastor-Blas, M.M.; Ferrándiz-Gómez, T.P.; Martín-Martinez, J.M. Surface Characterization of vulcanized Rubber treated with sulphuric acid and its adhesion to polyurethane adhesive. J. Adhes. 2000, 73, 135–160. [Google Scholar] [CrossRef]
  12. Mujal, R.; Orrit, J.; Ramis, X.; Marín-Genescà, M.; Rahhali, A. Study on dielectric, mechanical and thermal properties of polypropylene (PP) composites with ground tyre rubber (GTR). Polym. Polym. Compos. 2012, 20, 755–766. [Google Scholar]
  13. Mujal, R.; Orrit, J.; Ramis, X.; Marin, M.; Rahhali, A. Dielectric, thermal, and mechanical properties of acrylonitrile butadiene styrene reinforced with used tires. Adv. Polym. Technol. 2013, 32, E399–E415. [Google Scholar] [CrossRef]
  14. Nakason, C.; Kaesaman, A.; Supasanthitikul, P. The grafting of maleic anhydride onto natural rubber. Polym. Test. 2004, 23, 35–41. [Google Scholar] [CrossRef]
  15. Markov, A.; Fiedler, B.; Schulte, K. Electrical conductivity of carbon black/fibres filled glass-fibre-reinforced thermoplastic composites. Compos. Part A Appl. Sci. Manuf. 2006, 37, 1390–1395. [Google Scholar] [CrossRef]
  16. Saad, A.L.G.; Aziz, H.A.; Dimitry, O.I.H. Studies of electrical and mechanical properties of poly(vinyl chloride) mixed with electrically conductive additives. J. Appl. Polym. Sci. 2004, 91, 1590–1598. [Google Scholar] [CrossRef]
  17. Li, C.; Fan, Z.; Wu, S.; Li, Y.; Gan, Y.; Zhang, A. Effect of Carbon Black Nanoparticles from the Pyrolysis of Discarded Tires on the Performance of Asphalt and its Mixtures. Appl. Sci. 2018, 8, 624. [Google Scholar] [CrossRef]
  18. de Morais, A.B. Prediction of the longitudinal tensile strength of polymer matrix composites. Compos. Sci. Technol. 2006, 66, 2990–2996. [Google Scholar] [CrossRef]
  19. Giroud, J.P. Mathematical model of geomembrane stress-strain curves with a yield peak. J. Geotext. Geomembr. 1994, 13, 1–22. [Google Scholar] [CrossRef]
  20. Leon, C.; Lucıa, M.L.; Santamarıa, J. Correlated ion hopping in single-crystal yttria-stabilized zirconia. Phys. Rev. B 1997, 55, 882. [Google Scholar] [CrossRef]
  21. Jonscher, A.K. Dielectric relaxation in solids. J. Phys. D Appl. Phys. 1999, 32, R57. [Google Scholar] [CrossRef]
  22. Maxwell, J.C. A Treatise on Electricity and Magnetism, 3rd ed.; Clarence Press: Oxford, UK, 1891; Volume 1. [Google Scholar]
  23. Wagner, K.W. Zur theorie der unvolkommenen dielektrika. Amalen der Physik 1913, 40, 817–855. [Google Scholar] [CrossRef]
  24. El-Nashar, D.E.; Eid, M.A.M.; Abou Aiad, T.H.; Abd-El-Messieh, S.L. Electrical and Mechanical Investigations on Polyvinyl Chloride Filled with HAF Black. J. Reinf. Plast. Compos. 2009, 28, 1763–1773. [Google Scholar] [CrossRef]
  25. Mujal, R.; Orrit-Prat, J.; Ramis-Juan, X.; Marin-Genesca, M. Electrical application of polyamide reinforced with old tire rubber (ground tire rubber): Dielectric, thermal, mechanical and structural properties. J. Thermoplast. Compos. Mater. 2014, 27, 1209–1231. [Google Scholar] [CrossRef]
  26. Orrit-Prat, J.; Mujal-Rosas, R.; Rahhali, A.; Marin-Genesca, M.; Colom-Fajula, X.; Belana-Punseti, J. Dielectric and mechanical characterization of PVC composites with ground tire rubber. J. Compos. Mater. 2016, 45, 1233–1243. [Google Scholar] [CrossRef]
  27. Mujal, R.; Orrit-Prat, J.; Ramis-Juan, X.; Marin-Genesca, M.; Rahhali, A. Study on dielectric, thermal, and mechanical properties of the ethylene vinyl acetate reinforced with ground tire rubber. J. Reinf. Plastics Compos. 2011, 30, 581–592. [Google Scholar] [CrossRef]
  28. Abbasi, H.; Antunes, M.; Velasco, J.I. Effects of Carbon Nanotubes/Graphene Nanoplatelets Hybrid Systems on the Structure and Properties of Polyetherimide-Based Foams. Polymers 2018, 10, 348. [Google Scholar] [CrossRef] [PubMed]
  29. Antunes, M.; Velasco, J.I. Chapter 8: Polymer-Carbon Nanotube Nanocomposite Foams. In Polymer Nanotube Nanocomposites: Synthesis, Properties, and Applications; Mittal, V., Ed.; Scrivener Publishing LLC: Beverly, MA, USA, 19 September 2014. [Google Scholar] [CrossRef]
  30. Feller, J.F.; Linossier, I.; Levesque, G. Conductive polymer composites (CPCs): Comparison of electrical properties of poly(ethylene-co-ethyl acrylate)-carbon black with poly(butylene terephthalate)/poly(ethylene-co-ethyl acrylate)-carbon black. Polym. Adv. Technol. 2002, 13, 714–724. [Google Scholar] [CrossRef]
  31. Tang, H.; Chen, X.; Luo, Y. Studies on the PTC/NTC effect of carbon black filled low density polyethylene composites. Eur. Polym. J. 1997, 8, 1383–1386. [Google Scholar] [CrossRef]
  32. Mallette, J.G.; Quej, L.M.; Marquez, A.; Manero, O. Carbon black-filled PET/HDPE blends: Effect of the CB structure on rheological and electric properties. J. Appl. Polym. Sci. 2001, 81, 562–569. [Google Scholar] [CrossRef]
  33. Zhang, J.-F.; Zheng, Q.; Yang, Y.-Q.; Yi, X.-S. High-density polyethylene/carbon black conductive composites. I. Effect of CB surface modification on its resistivity-temperature behavior. J. Appl. Polym. Sci. 2002, 83, 3112–3116. [Google Scholar] [CrossRef]
  34. Saikia, N.; de Brito, J. Use of plastic waste as aggregate in cement mortar and concrete preparation: A review. Constr. Build. Mater. 2012, 34, 385–401. [Google Scholar] [CrossRef]
  35. Evangelista, L.; de Brito, J. Mechanical behavior of concrete made with fine recycled concrete aggregates. Cement and concrete composites. Cem. Concr. Compos. 2007, 29, 397–401. [Google Scholar] [CrossRef]
Figure 1. Obtained samples for testing. Depth sample of 2.5 mm. L0 = 55 mm. Width = 5 mm.
Applsci 09 01564 g001
Figure 2. Curve set of Stress ( σ ) vs. Strain ( ε ) test, for several GTR concentrations. (a) PP, (b) ABS.
Applsci 09 01564 g002
Figure 3. σ ε curve test vs model, for GTR concentrations over 40%. (a) PP, (b) ABS.
Applsci 09 01564 g003
Figure 4. (a) Brabender mixer machine. (b) Specimen stamp machine. (c) Stress–strain tests, (d) Dielectric test.
Applsci 09 01564 g004
Figure 5. (a) Specimens for DEA. (b) Dimensions for DEA specimens. (c) DEA electrodes.
Applsci 09 01564 g005
Figure 6. (a) Young’s modulus (MPa), (b) tensile strength (MPa), for seven polymers/GTR concentrations and particle size <200 μm.
Applsci 09 01564 g006
Figure 7. (a) Elongation at break (%), (b) toughness (J) for seven polymers/GTR concentrations and particle size <200 µm.
Applsci 09 01564 g007
Figure 8. (a) Electrical conductivity (S/cm), (b) Loss Tangent (Tan δ) for different polymers/GTR concentrations and particle size <200 µm, and frequency fixed at 50 Hz and 30°.
Applsci 09 01564 g008
Figure 9. (a) Real part of the permittivity (ε′), (b) imaginary part of the permittivity (ε″), for different polymers/GTR concentrations and particle size <200 µm, frequency fixed at 50 Hz and 30 °C.
Applsci 09 01564 g009
Table 1. Commercial name, fluidity index, and density for each material.
Polymer TypeCommercial NameFluidity Index or Melt Flow Index (g/min)Density (kg/m3)
PVCEtinox1.351.225
EVAAlcudia PA 539 type0.20937
HDPEAlcudia 4810-B1.35960
PA 6Ultramid B3S1.551130
ABSTerluran® HH-1061.451050
PPIsplen® 099 K2M type0.55902
PSPolystyrol 486 M1.451050
Table 2. Processing temperatures for each material with the Brabender mixing machine and pressing temperatures at constant pressure at 200 bar.
PolymerProcessing Temperature (°C)Pressing Temperature (°C)
PVC195–200 °C210 °C
EVA105–110 °C120 °C
HDPE150–155 °C170 °C
PA 6195–200 °C210 °C
ABS180–185 °C195 °C
PP155–165 °C165 °C
PS180–185 °C195 °C
Table 3. Highest values of each property analyzed, and the composite regarded (size particle of GTR <200 µm).
Polymer CompositeYoung’s Modulus (MPa)Tensile Strength (MPa)Elongation at Break (%)Toughness (J)
PVC/GTR3028.89 (0%GTR)35.75 (0%GTR)6.31 (5%GTR)1.31 (5%GTR)
EVA/GTR41.67 (10%GTR)23.08 (0%GTR)704.6 (0%GTR)72.32 (0%GTR)
HDPE/GTR1300.11 (5%GTR)25.51 (5%GTR)50 (0%GTR)7 (0%GTR)
PP/GTR1368.65 (0%GTR)29.9 (0%GTR)346.71 (0%GTR)64.22 (0%GTR)
ABS/GTR2522.37 (0%GTR)44.98 (0%GTR)32.91 (0%GTR)9.9 (0%GTR)
PA/GTR2841.47 (0%GTR)50.41 (0%GTR)8.46 (70%GTR)1.09 (50%GTR)
PS/GTR2235.42 (10%GTR)38.89 (0%GTR)66.27 (0%GTR)0.20 (0%GTR)
In bold you can check which composites improve with the addition of GTR.

