Abstract
Inflammatory bowel diseases (IBD) is a term referring to chronic and recurrent gastrointestinal disease. It includes Crohn’s disease (CD) and ulcerative colitis (UC). It is undeniable that presenting features may be unclear and do not enable differentiation between disease types. Therefore, additional information, obtained during the analysis, can definitely provide a potential way to differentiate between UC and CD. For that reason, finding the optimal logistic model for further analysis of collected medical data, is a main factor determining the further precisely defined decision class for each examined patient. In our study, 152 patients with CD or UC were included. The collected data concerned not only biochemical parameters of blood but also very subjective information, such as data from interviews. The built-in logistics model with very high precision was able to assign patients to the appropriate group (sensitivity = 0.84, specificity = 0.74, AUC = 0.93). This model indicates factors differentiating between CD and UC and indicated odds ratios calculated for significantly different variables in these two groups. All obtained parameters of the model were checked for statistically significant. The constructed model was able to be distinguish between ulcerative colitis and Crohn’s disease.
1. Introduction
Inflammatory bowel diseases (IBD), among which ulcerative colitis (UC) and Crohn’s disease (CD) can be distinguished, are the subject of many studies. Despite many years of research on IBD, they are still of interest to scientists today.
CD and UC have been known by doctors for many years. One of the first clear descriptions of UC in the medical literature was Wilkes’ work published in 1859 [1]. Crohn’s disease was officially described later by the research team, which included Crohn, Ginzburg, and Gordon Oppenheimer, in 1932 [1,2].
However, there are still many unknown facts about these diseases. There are many descriptions of each disease’s progression, their different location of abnormalities or descriptions of symptoms. The collected information provides useful knowledge about the course of IBD. However, it does not give any idea about the further treatment of the patient or prevention of relapse. It comes from the fact that presenting symptoms often do not explicitly point to one exact disease. Therefore, the diagnosis of IBD is often difficult, even among highly specialized doctors [2,3,4].
UC-related inflammation typically begins in the rectum and extends for a variable distance around the colon. The affected tissue is swollen, with the presence of ulcers that in some cases lead to severe bleeding. In the majority of cases, symptoms intensify in a few weeks. In some cases, rapid acceleration of the disease is observable. Then, standard medical treatment may not be beneficial and surgical intervention with colectomy may be required urgently. In most cases of UC, however, medical therapies can be used to successfully induce remission. Despite this, patients remain at risk of subsequent relapse [2,3].
In the case of CD, the inflammation is observable in the area of the small intestine and the cecum (40% of cases), only in the small intestine (30% of patients), and only in the large intestine (25% of cases). In cases where only the large intestine is covered, one of two forms of the IBD can be recognized [4,5]. The most common clinical symptoms of CD are diarrhea, abdominal pain, and weight loss. Various environmental factors, such as smoking in the context of CD, influence the development of IBD. Importantly, former or current smokers have an increased risk of developing CD [6,7,8,9,10,11].
It is important to look for new factors that differentiate the disorder and check the relationship between them. The obtained information will help to better understand UC and CD. Our paper attempts to model the medical diagnostic process, based on a logistic model, which helps in the correct classification of the two subtypes of IBD.
2. Materials and Methods
The protocol of the study was approved by the Bioethics Committee of the Medical University of Bialystok, Poland (R-I-002/209/2018).
2.1. Data Collection
The study concerned the analysis of the data collected from patients with IBD. We obtained data about patients of the Department of Gastroenterology and Internal Diseases of the Medical University of Bialystok Clinical Hospital. The study involved interviews of adults and basic analysis of their medical records. The patients were diagnosed based on clinical symptoms, biochemical, radiological results, endoscopic findings, and histological reports.
All patients were given CT examinations, for initial qualification. Information on the following laboratory results was collected: WBC (white blood cells) [], RBC (red blood cells) [], MCV (mean corpuscular volume) [], PLT [], neutrophils [], lymphocytes [], monocytes [], eosinophils [], basophils [], glucose [], bilirubin [], AspAT (aspartate aminotransferase) [], ALAT (alanine aminotransferase) [], amylase [], PT [], INR (international normalized ratio), fibrinogen [], urea [], creatinine [], sodium [], potassium [], and CRP (C reactive protein) []. Additional features like age, gender, smoking (a smoker is a patient who smoked at least a year without interruption), occurrence of blood in the stool, and a palpable tumor within the abdominal cavity were taken into account.
In the past, for CD and UC diagnosis, only laboratory tests were considered. In times of biological drugs, laboratory tests have become necessary to assess the burden of IBD, as symptom-based results are too subjective to predict properly the response to pharmacological options and calculate the risk of relapse. In this work, we were looking for features to distinguish easily CD from UC. Laboratory tests are helpful in assessing the activity of each disease. Morphological tests of blood and biochemical parameters determination allow early detection of changes, side effects of therapy, and monitoring of nutritional deficiencies. Below is a brief description of some data taken into account in our study [12].
Leukocytes (WBC) affect the immune system. Both excess and drop of white blood cells may indicate overload of the immune system, due to infections, diseases, including UC and CD.
Erythrocytes (RBC) transport oxygen and carbon dioxide in the body, participating in gas exchange. A too small number of erythrocytes may indicate malnutrition, while higher values occur when there is a disturbance in the production of red blood cells in the course of IBD. Iron deficiency anemia is common in IBD. Elevated MCV occurs in patients receiving azathioprine or 6-mercaptopurine. However, the roles, functions, and levels of monocytes in case of the UC and CD have not been fully examined [13,14].
Neutrophils are one of the groups of white blood cells (leukocytes). They play a significant role in the immune response. They are perceived as effector cells in acute and chronic inflammation. However, the roles of neutrophils in the pathogenesis and development of IBD and their differences between disease variants are still not fully understood [15].
Lymphocytes are cells of the immune system that belong to the leukocyte agranulocytes to involve and underlie the immune response. CD and UC disease are characterized by dispersed accumulation of lymphocytes in the intestinal mucosa due to overexpression of endothelial adhesion molecules. It is important to know if there are any differences in the level of this parameter between UC and CD [13,14].
Eosinophils play a role in the pathogenesis of IBD. Immunohistopathological examinations revealed the accumulation and activation of eosinophils in the active inflammatory intestinal mucosa in patients with UC and CD. However, there is a lack of accurate quantitative data and their possible distinction in the two diseases analyzed in this paper [12].
Basophils belong to leukocytes. The previously unrecognized function of basophils in oblique adaptive immunity opens up new perspectives for understanding their contribution to the pathogenesis of IBD [16].
The number of platelets (PLT) often increases due to active inflammation or iron deficiency. This is evidenced through blood clotting. Too large values may be indicative of tuberculosis, liver problems, and cancers. Too small values can indicate blood clotting disorders.
Changes in the glucose level in the results of laboratory tests are observed in many diseases, including IBD. Glucose is also an important factor in current IBD research. It is important to check if its level significantly differs between UC and CD [17].
Bilirubin is a bile pigment that comes from the breakdown of red blood cells. It is believed that oxidative stress plays an important role in CD and UC. However, this idea is still not explored in detail.
The relationship between abnormal hepatic biochemical parameters (AspAT and ALAT) and IBD is not fully understood. Approximately 29% of patients with IBD have abnormal results of liver function tests [18]. Increased serum amylase is often observed in patients with IBD without any clinical signs of pancreatitis [12].
Prothrombin time (PT), the INR test and fibrinogen, are measures of the activity of plasma coagulation factors. Thromboembolism events are the main cause of morbidity and mortality in patients with IBD and may occur in both the gastrointestinal tract and in parenteral sites [19,20].
Creatinine and urea are metabolic products. Their levels can change in IBD. Therefore, they are the important parameter whose differences in levels between UC and CD are unfortunately not exactly known [12].
In IBD, changes in the absorption of electrolytes in diarrhea are frequent. Therefore, the study-examined differences in sodium and potassium levels in the UC and CD are interesting to see, if they are significantly different [21].
CRP is a protein synthesized by the liver at low concentrations (0.1 mg/L). Although CRP concentration increases in response to many physiological conditions, it usually correlates with inflammation in IBD, being the most frequently used acute phase reactant [12].
2.2. Logistic Regression Model
Logistic regression is a frequently used statistical method for classification problems when the variable is presented in a dichotomic scale form. It means that the predictive model of logistic regression determines the probability of one of two possible outcomes: Illness (number 1) or disease (number 2). For the given data, a logistic regression model was built to find different types of analyzed disease. The model coefficients were determined and were statistically significant at the level of . The odds ratio values, defined as the ratio of the probability of success to the probability of failure, were then calculated.
The main advantage of the odds ratio, as compared to conventional probability, is that the odds ratio assumes values in the range for a range from 0 to 1, and the logarithm value of the field . This means that we can use regression methods not limited to a range (0–1), such as linear regression, to estimate the log of chance in a regression model [22,23].
For the odds ratio, we assumed a 95% confidence interval; the span is based on the number of patients in the study group. The odds ratio can also be calculated taking into account the division of the respondents into two separate groups using Formula (1):
where is the probability of an event (disease) A and is the probability of an event (disease) B.
We interpret this measure as follows [22,23,24]:
- If , then in the first group, the occurrence of the event is more likely.
- If , then in the second group, the occurrence of the event is more likely.
- If , then the event is equally likely in both groups.
Transformation function on the logarithm of the probability of chance is called logit (Formula (2)):
The logistic model is based on the function (Formula (3)) [22]:
The predictive model formulates the probability of malignancy with the probability of benign tumors. The constructed model also allows us to observe which of the tested independent variables influence the dependent variable explained on a dichotomous scale. Conditional probability for dependent variable Y assumes a value of 1 for the value of the independent variables and is described as Formula (4) [23]:
where are regression coefficients and represent independent variables. Values of estimators are calculated using the most reliable method. The greater reliability of a model, the more likely it is that the variable will appear in the sample, which further means better matching the model to the data [22,23].
In our work, we used the quasi-Newton method. The function is estimated at various points to estimate the first and second order derivatives. Then, the obtained information is used to minimize the loss function value.
All variables which were taken into the study were subjected to significance tests. The Mann–Whitney test was used for comparison of the CD group with the UC group in cases where parameters were not shown to be in a normal distribution. We applied Student’s t-test in cases of compatibility with normal distribution and homogeneity of variance, while the Cochran–Cox test was used in cases when compliance with the normal distribution had been shown, but there was no homogeneity of variance. In cases of comparison of data on the qualitative scale, a chi-square test was used. The Shapiro–Wilk test was applied to check compliance with the normal distribution, and the Leven test was used to test homogeneity of variance. For the construction of classifiers using three algorithms of knowledge extraction, we used a selected set of features. The significance level was assumed as α = 0.05. The tests carried out resulted in finding those features which significantly differentiate UC and CD ().
2.3. Model Testing
The analyses were carried out using the Statistica 13.1 (StatSoft, Cracow, Poland) and Weka Software (University of Waikato, Hamilton, New Zealand).
In order to test the accuracy of the constructed model, a matrix of errors (Table 1) was used to calculate the measures describing the correctness of the classification [24,25].

Table 1.
Confusion matrix.
The board has two rows and two columns. Rows represent predicted classes, while columns represent real classes.
We use some statistics, explained briefly as follows [25]:
- Sensitivity (TPR)—rate of the instances correctly classified as a given class:
- Specificity (TNR)—rate of the instances that are actually healthy (without a given trait):
- AUC—the area under the ROC Curve (Receiver Operating Characteristic Curve). The accuracy of the test depends on how well the test divides the tested group into two separate classes.
In order to analyze the quality of the building model, a new measure of the action quality measure (AQM) was proposed, taking into account all the results from the binary matrix of mistakes. The measure evaluates the overall quality of model prediction:
The proposed measure returns values from to , with the factor corresponding to an ideal classification, a value oscillating within 0 meaning a random assignment of the result, and meaning a total discrepancy between the forecast and the observation.
We compared our model with another, which contained variables different from the standard ones, appearing in the literature (WBC, RBC, PLT, CRP, ALAT, PT, fibrinogen).
Our experiments on various medical data confirm that substitution of the new AQM measure proposed in the work gives promising results in the evaluation of modeling medical diagnostic processes.
3. Results
3.1. Study Group
The analysis was based on the construction of logistic model, containing variables affecting the patient’s belonging to a given class (disease entity).
In the first group, UC was diagnosed (N = 86, women n = 32, men n = 54), while in the second group, patients with CD (N = 66, women n = 32, men n = 34) were diagnosed.
The age in the study group was 38.05 ± 16.57, where the average age of women was 35.97 ± 15.56 and for men 39.57 ± 17.19. The mean age in the CD group was 34.42 ± 14.30 (mean age of women 36.19 ± 16.90, men 32.76 ± 11.34). The mean age in the group of UC patients was 40.84 ± 17.70 (mean age of women 35.75 ± 14.37, men 43.85 ± 18.88).
3.2. Model Selection
The constructed model was trained in 90% of available cases of patients, while it was tested in 10% of all available cases (cross-validation method). A cross-validation method (10-fold) was used to select specific model parameters. The results presented below relate to the model constructed after the introduction of variables significantly differing in the analyzed groups. These variables were previously subjected to significance tests.
The model, containing variables appearing in literature, was poorly classified (specificity = 3.03%, sensitivity = 91.86%, which indicates the lack of ability of the model built on the basis of the classifier used to detect patients with UC). Additionally, it contained all possible variables (model parameters also indicated that such a model was inferior—specificity = 53.13%, sensitivity = 41.23%).
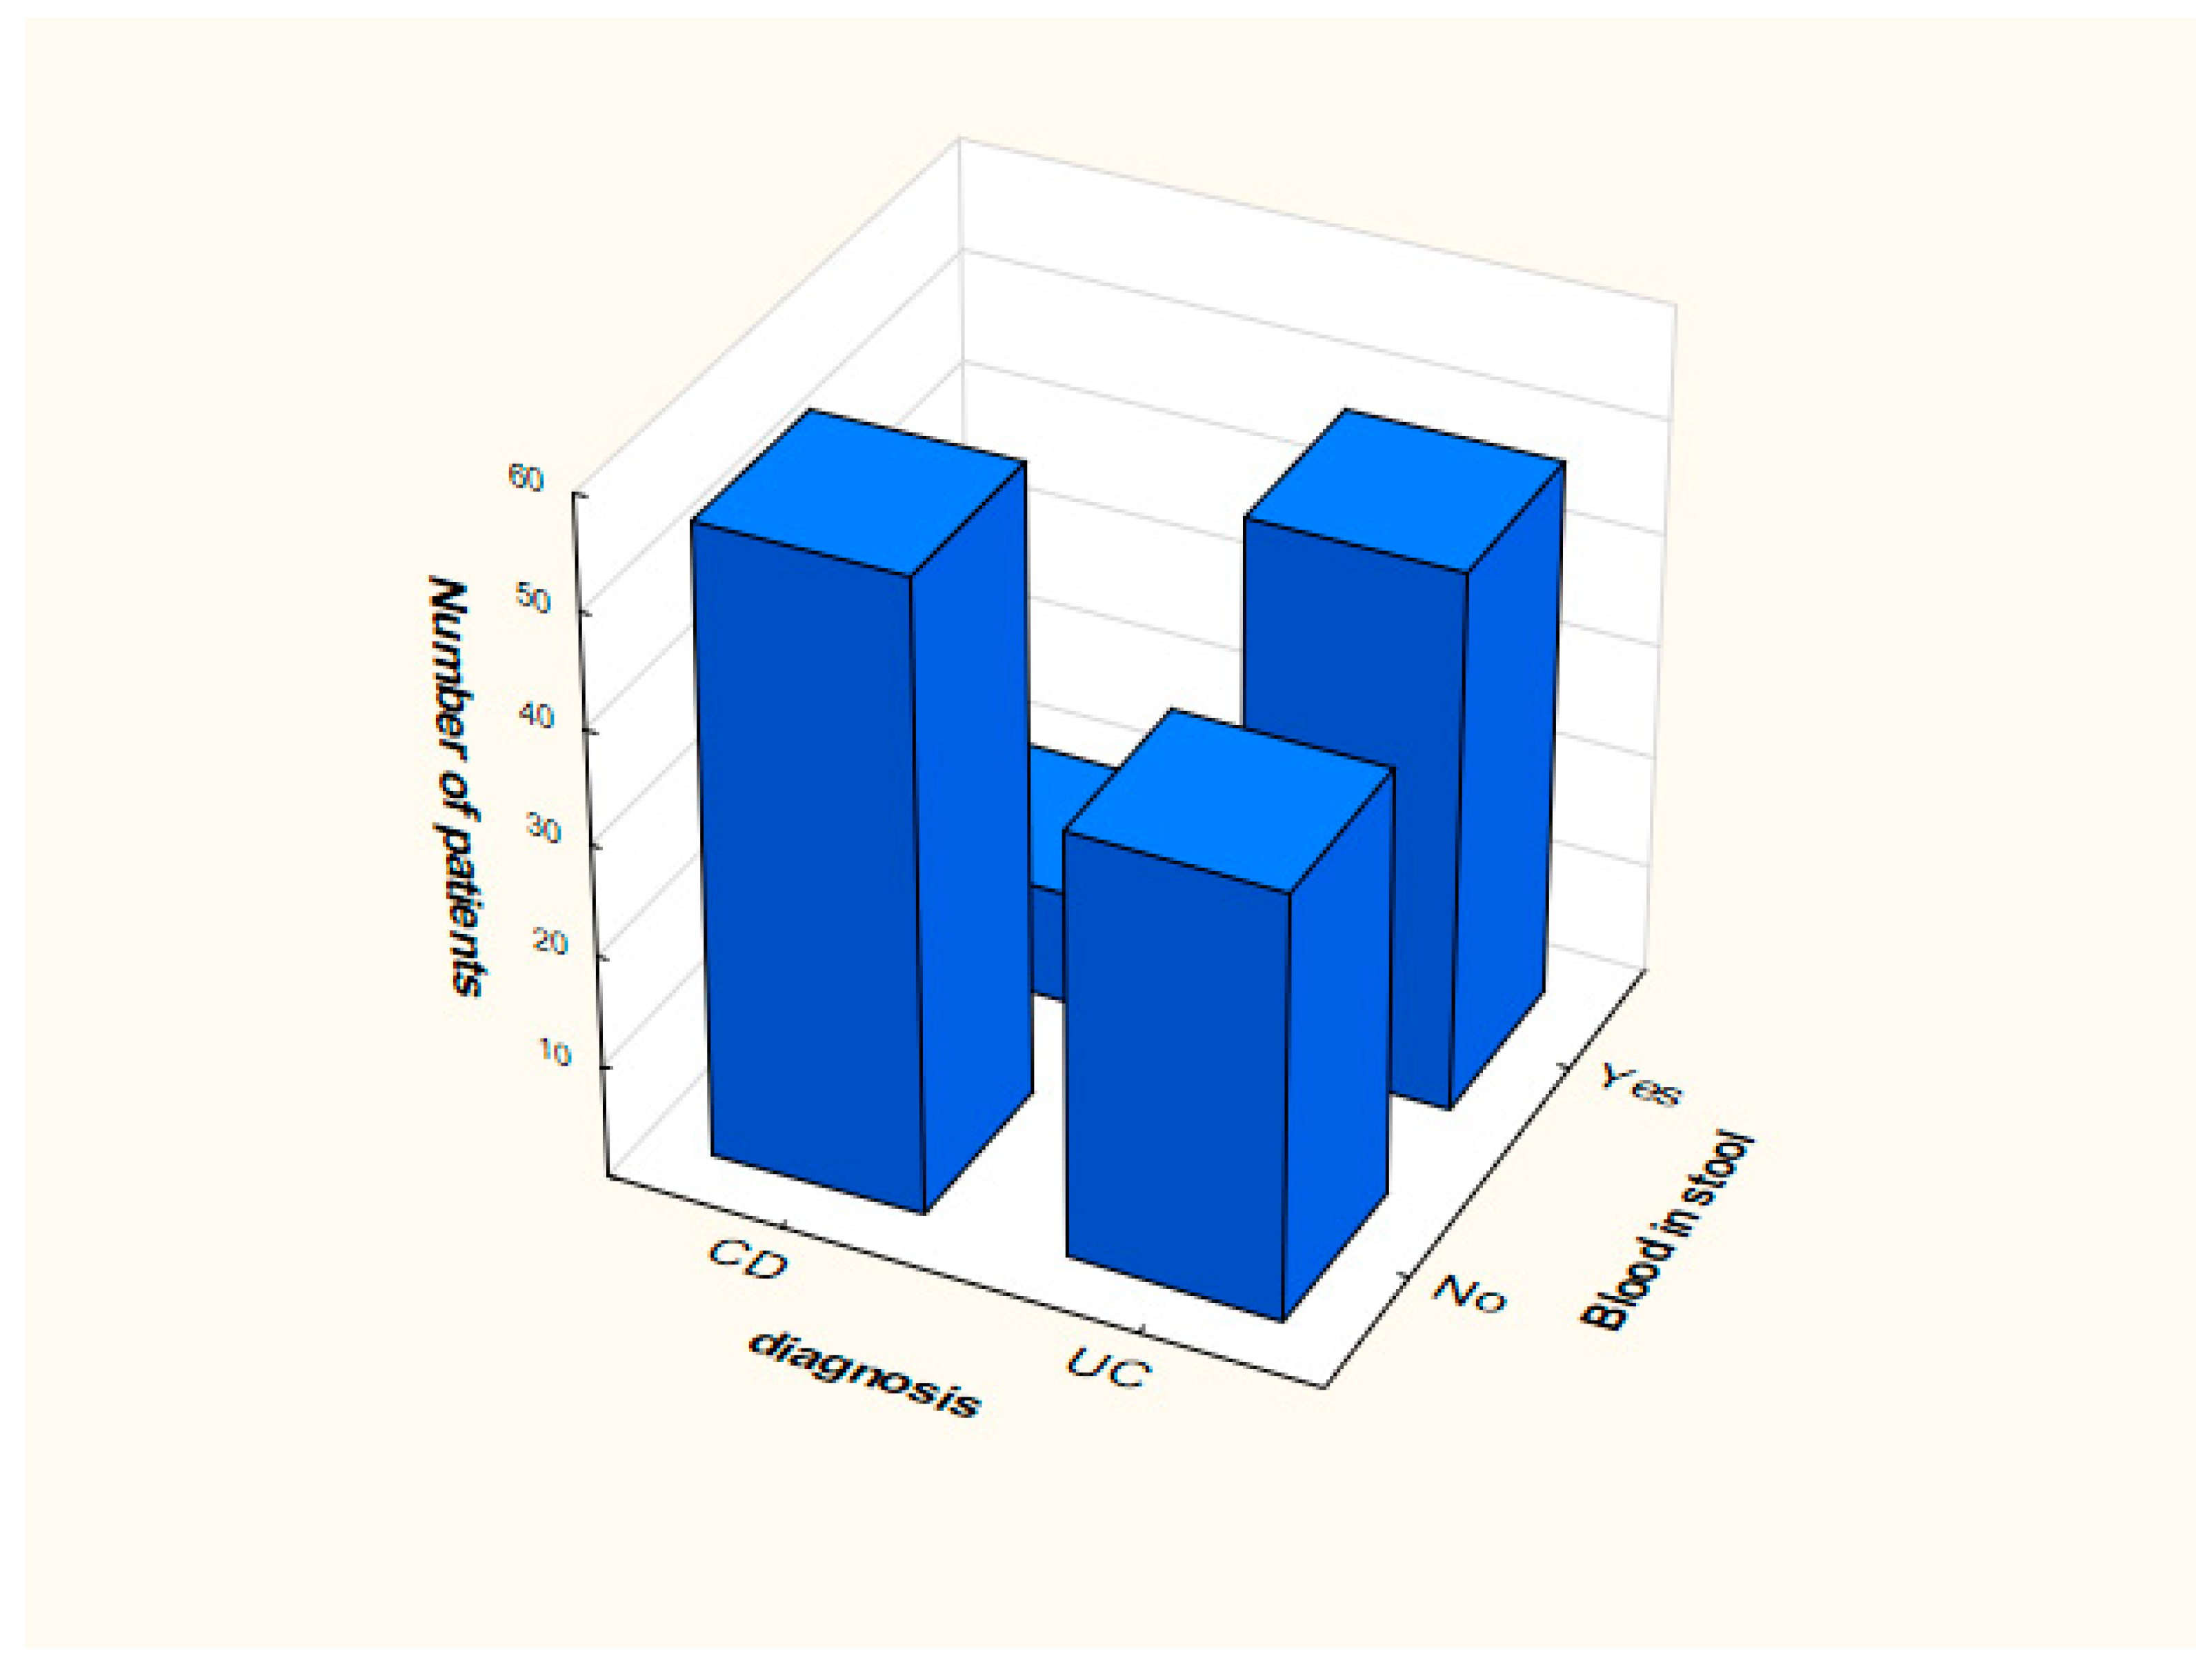
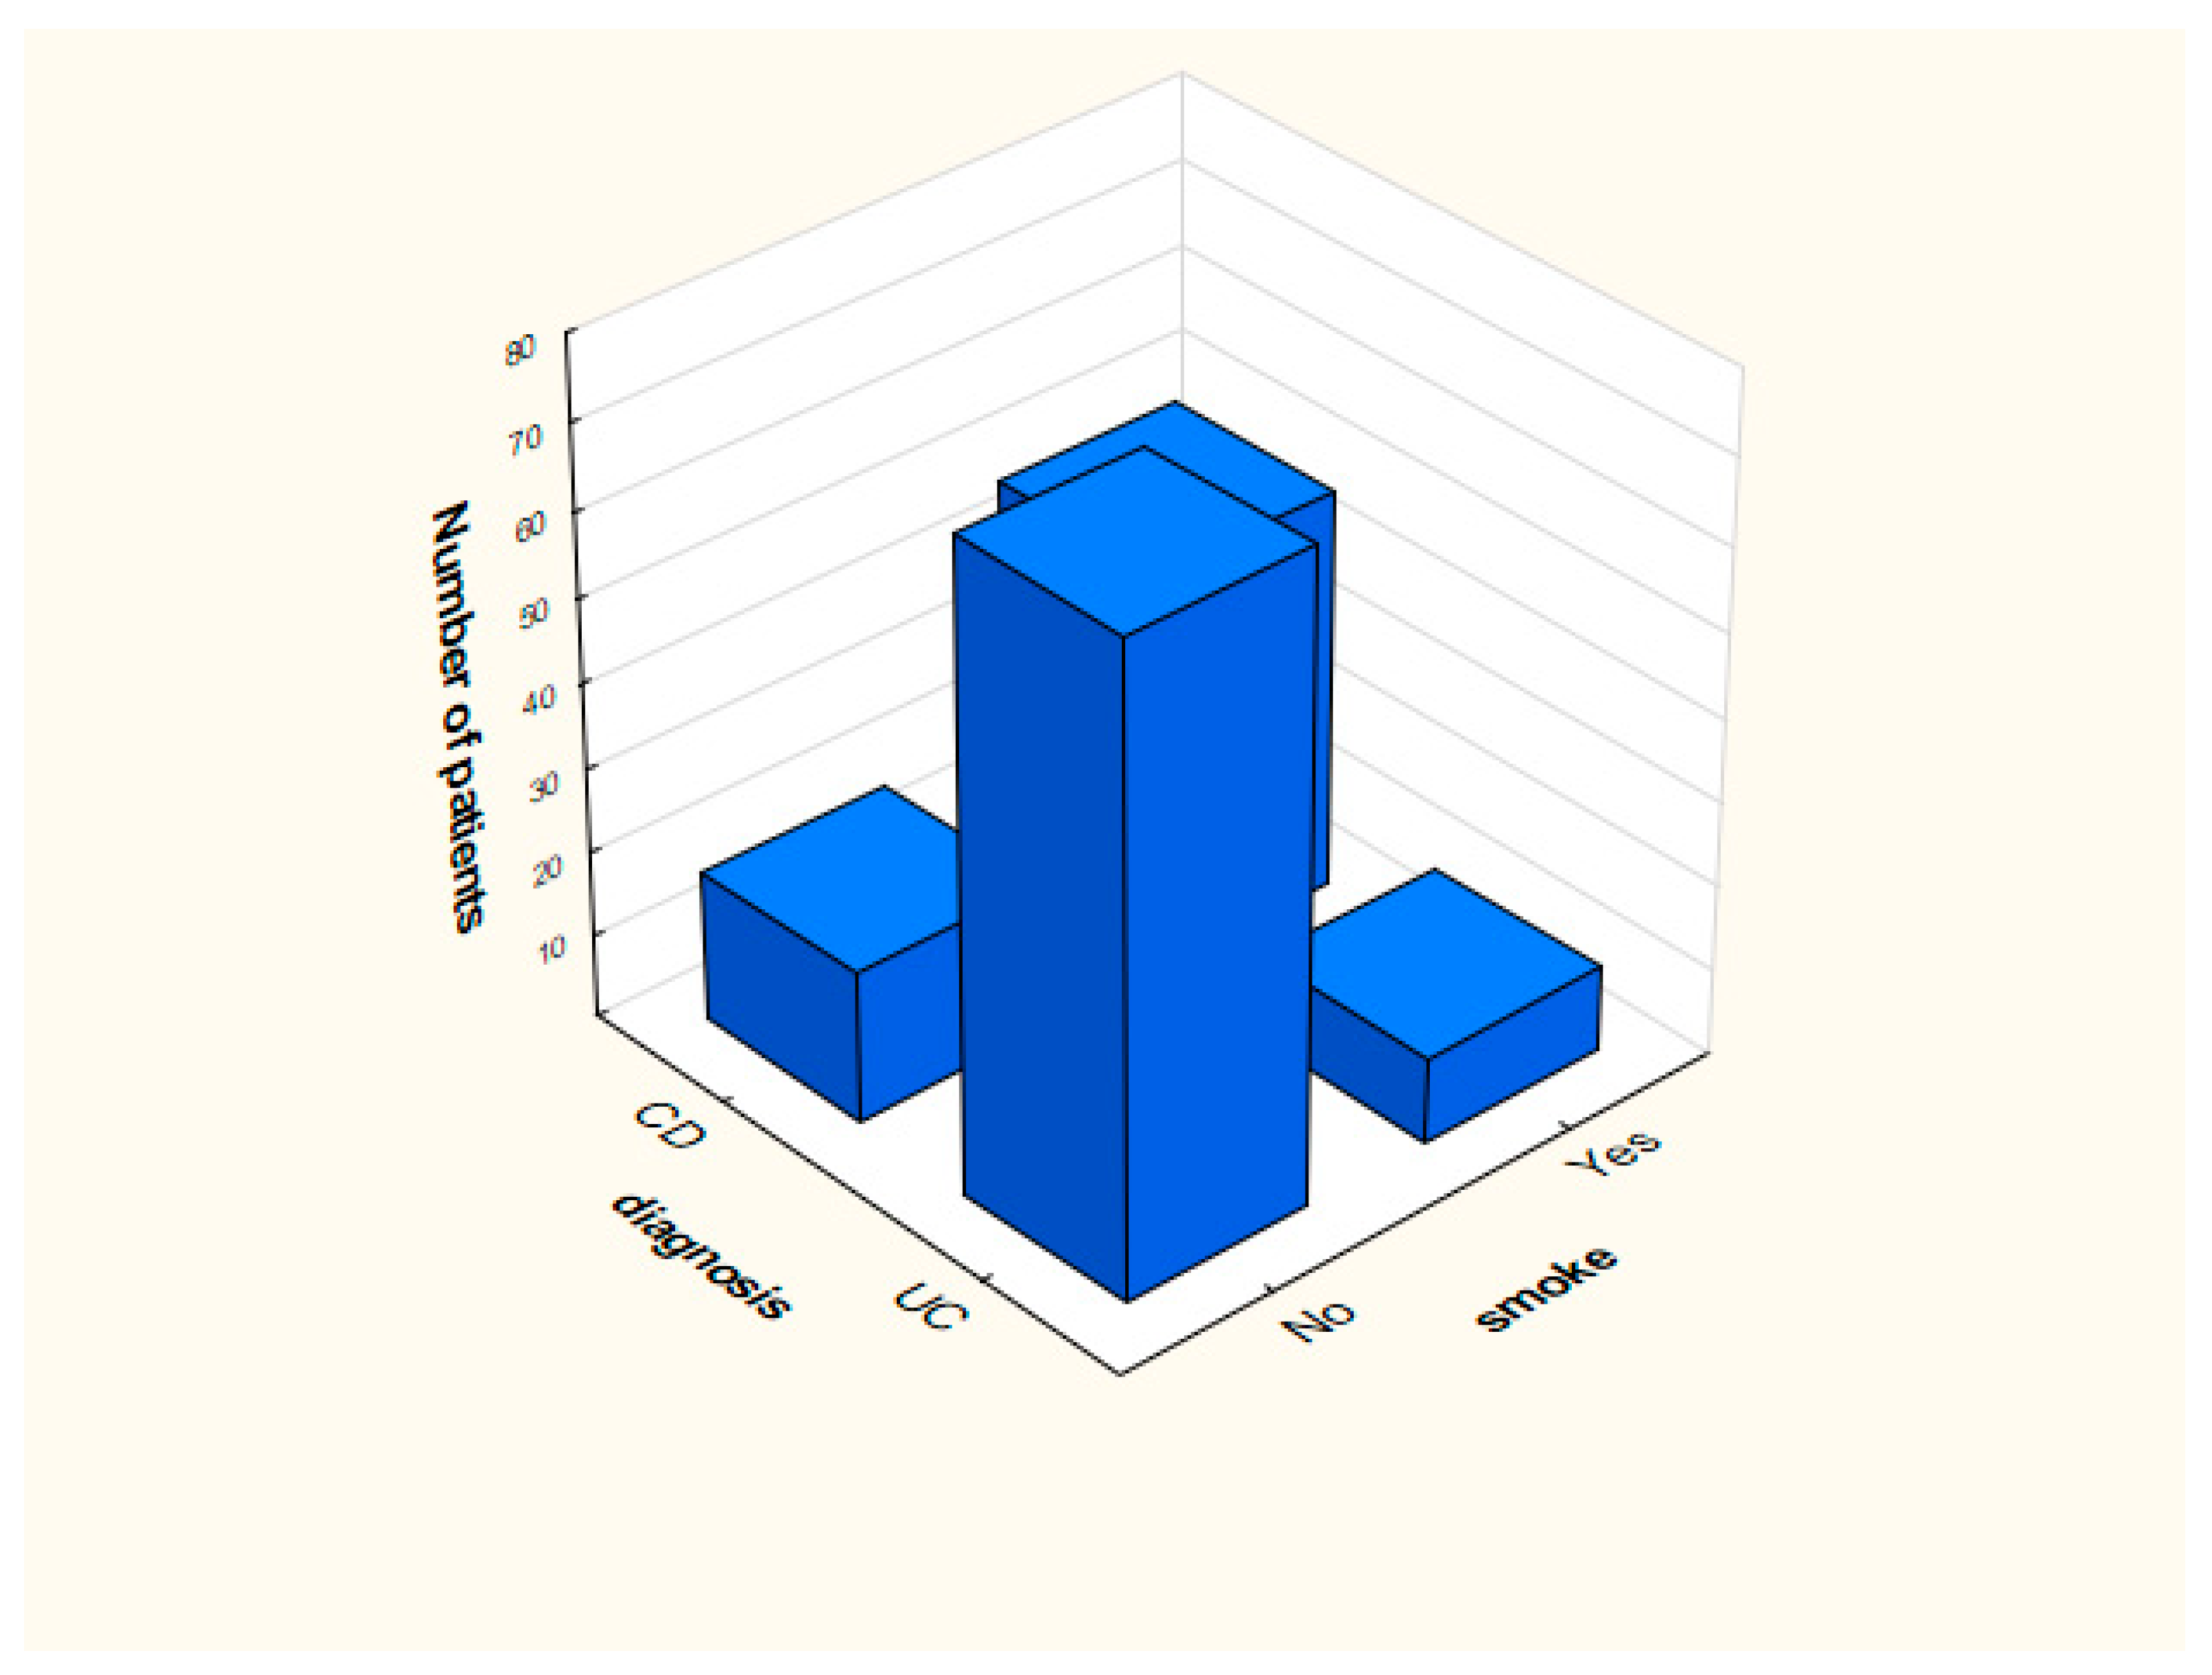
Distribution of smoking and the presence of blood in feces in the analyzed groups is presented in Figure 1 and Figure 2.
Figure 1.
Distribution of data depending on the presence of blood in the stool.
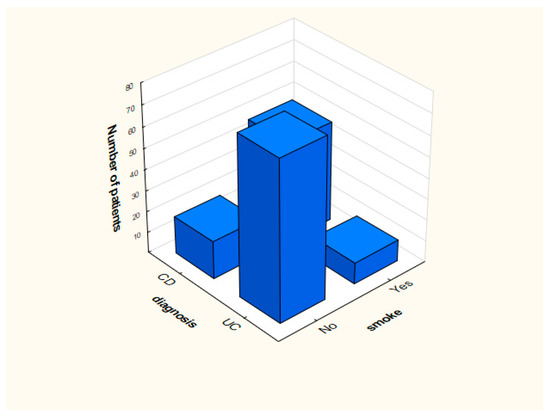
Figure 2.
Distribution of data depending on the presence of smoking.
3.3. Model Verification
The coefficients of the regression model were calculated. All significantly changing variables (at the significance level of 0.05) are presented in Table 2.

Table 2.
Coefficients with the p-value and odds ratio (OR).
In case of the proposed model (Table 2), OR values that significantly deviate from value 1 were obtained for the current/past smoker attribute (OR = 0.012, 95% CI: 0.001 ÷ 0.023). This means that people who smoke more often suffer from CD. We can conclude that smoking does not affect the development of UC. Another attribute is blood in stool. In this case, OR = 14.454, 95% CI: 14.324 ÷ 14.658, which means that the phenomenon of bloody stools much more often means UC than CD. The occurrence of blood stools increases the probability of UC by about 15 times.
In the case of MCV, OR = 1.913 (95% CI: 1.899 ÷ 2.101), which means that increasing its value should cause the patient to be classified into the group with UC disease. Similar results were obtained for PLT (OR = 1.201, 95% CI: 1.199 ÷ 1.215), monocytes (OR = 1.049, 95% CI: 1.039 ÷ 1.149), eosinophils (OR = 1.101, 95% CI: 1.002 ÷ 1.111), basophils (OR = 2.118, 95% CI: 2.018 ÷ 2.128), ALAT (OR = 1.029, 95% CI: 1.001 ÷ 1.089), and sodium (OR = 1.162, 95% CI: 1.142 ÷ 1.182). In the case of neutrophils, OR = 0.96 (95% CI: 0.94 ÷ 1.11), and increasing their value should cause the patient to be classified into the group with CD disease. Similar results were obtained for creatinine (OR = 0.708, 95% CI: 0.698 ÷ 0.798) and potassium (OR = 0.086, 95% CI: 0.077 ÷ 0.096) (Table 2).
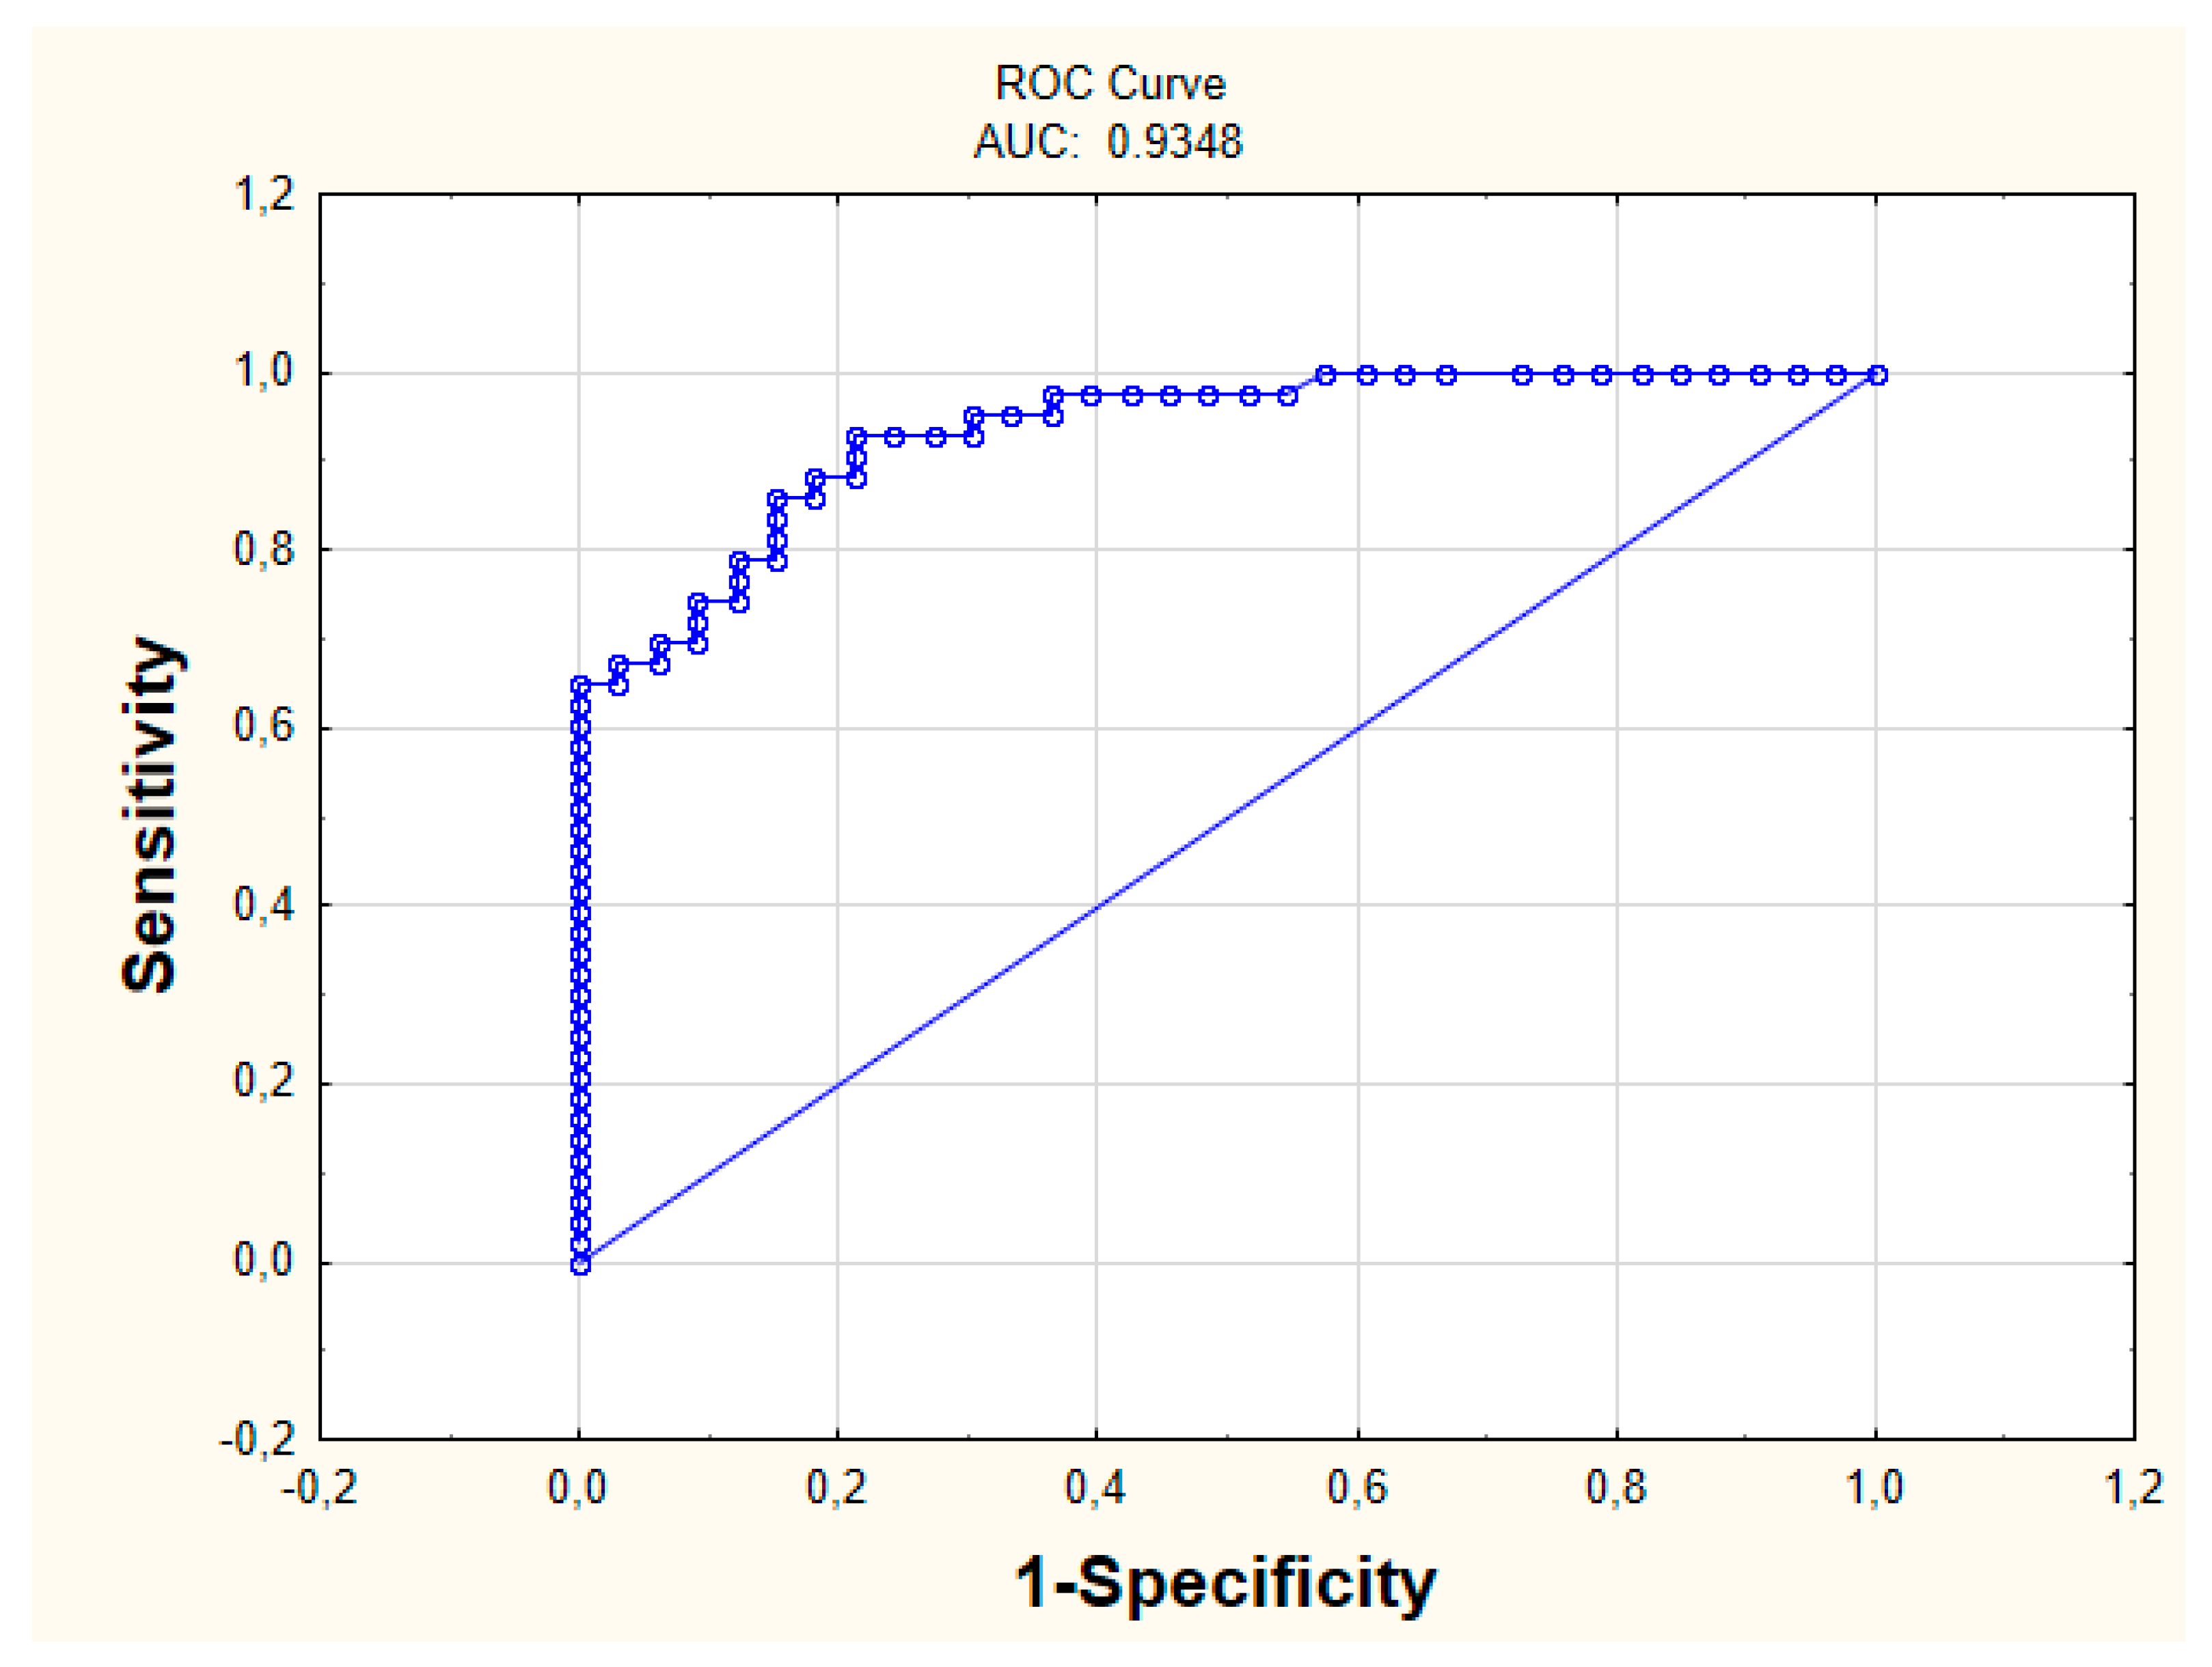
The measurements characterizing the constructed model concerning IBD diseases were calculated (Table 3). The sensitivity value is 0.84 for specificity 0.74. The AUC was 0.93 (Figure 3). The proposed AQM measure also indicates a good prediction quality, as AQM = 0.79.

Table 3.
Parameters of the model.
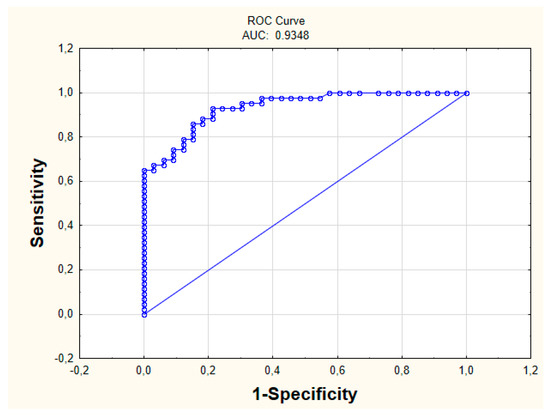
Figure 3.
ROC Curve (Receiver Operating Characteristic Curve).
4. Discussion
Experts (physicians) have known UC and CD for decades. Unfortunately, so far, there are still many unknowns regarding CD and UC. The characteristics of these diseases are often ambiguous. This contributes to the fact that their diagnosis creates many additional problems [2,3,4,5]. Therefore, it is necessary to look for symptoms that directly differentiate the disorders. Undoubtedly, it will deepen the current knowledge about UC and CD and their treatment. A lot of open questions, related to medical databases, pose a challenge for us to find new effective methods in the area of knowledge exploration.
The study carried out in this work aimed to check the significant differences in basic research and the results of interviews with the patient. It was done to check whether laboratory tests could support high-level diagnostics. Such knowledge would improve the speed of diagnosis, perhaps without the need for a series of time-consuming and expensive tests. In addition, the analysis indicates which causative factors differentiate the research sample.
In the logistic regression model, the input containing given variables is commonly studied in basic research towards the diagnosis of UC and CD. These variables were the basic laboratory exponents (WBC RBC, MCV, neutrophils, lymphocytes, monocytes, eosinophils, basophils, glucose, bilirubin, AspAT, ALAT, amylase, PT, INR, fibrinogen, urea, creatinine, sodium, potassium, CRP) and collected additional information from the basic patient’s interview (age, gender, smoking, occurrence of blood in the stool, palpable tumor within the abdominal cavity). There are no concrete studies on these attributes in IBD [12,13,14,15,16,17,18,19,20,21].
Modeling pointed to variables which are significantly different in the analyzed groups. Among the biochemical factors from blood tests with different parameters, the levels of MCV (p = 0.015), PLT (p = 0.019), neutrophils (p = 0.041), monocytes (p = 0.031), eosinophils (p = 0.004), basophils (p = 0.002), ALAT (p = 0.001), creatinine (p = 0.019), sodium (p = 0.000), and potassium (p = 0.017) are all significant. Other important parameters were smoking (p = 0.000) and blood in stool (p = 0.000).
There are many logistic models that show the relationship between IBD varieties [26,27,28,29,30,31]. However, the most accurate model which could clearly point the appropriate group for the patient has not been found so far. This shows that there is a real need to analyze UC and CD and build an optimal model for this problem.
Analysis indicated that people who were diagnosed with UC did not smoke in most cases (n = 76). The number of smokers (n = 48) in relation to nonsmokers (n = 18) was significantly higher among patients with CD. This phenomenon is described in the literature [7,9,10,11]. Importantly, former or current smokers have an increased risk of developing CD, and the researchers suggest that nicotine is responsible for it. Studies using other substances (replacing nicotine) were inconclusive [6,7,8,9]. Literature indicates that smoking is associated with a lower risk of developing UC. People who smoke and suffer from UC are less frequently hospitalized (less frequent episodes of exacerbation of the disease appear) compared to patients with UC who have never smoked. Currently, animal studies are being carried out indicating mechanisms that may be responsible for the protective effect of smoking in UC. However, no explanation of the reason tobacco can have such an effect was found.
In the case of blood in stool, the variable OR = 14.454, (95% CI: 14.324 ÷ 14.658), which means that the phenomenon of bloody stools more often means UC than CD. The occurrence of bloody stools about 15 times increases the probability of ulcerative colitis. Similar results were obtained in the literature [32]. Current research, confirmed also by the analysis included in this work, returns the knowledge that this symptom is rare in CD, while the opposite is true for UC.
The literature indicates that MCV levels change in IBD. However, the levels, functions, and causes of changes between UC and CD are still not well understood [33]. In the case of MCV, OR = 1.913 (95% CI: 1.899 ÷ 2.101), which means that increasing its value can cause the patient to be classified in the group with UC disease.
Similar results were obtained for PLT (OR = 1.201, 95% CI: 1.199 ÷ 1.215). The PLT value may be increased if inflammation occurs. Both CD and UC are associated with abnormalities in the number and function of platelets. The role of platelet dysfunction in the pathogenesis of IBD is still unclear [34]. The obtained results indicate that the level is significantly higher in the UC group.
Monocytes are part of the body’s first line of defense, eliminating pathogens by phagocytosis or releasing a wide range of inflammatory mediators, such as cytokines, chemokines, and proteases. However, the roles and functions of monocytes in health and disease in IBD are not fully understood [15]. The differences in their levels are not confirmed. Because of the logistic regression, we got significant results indicating differences between UC and CD. The obtained odds ratio includes that the higher level of monocytes indicates UC (OR = 1.049, 95% CI: 1.039 ÷ 1.149).
The conducted research emphasizes the role of eosinophils in the diagnosis of IBD, but there are no quantitative data between UC and CD. Our research indicates that the right parameter levels differ significantly in the analyzed groups [12]. Our study showed that it is significantly higher in the UC group (OR = 1.101, 95% CI: 1.002 ÷ 1.111).
Our research indicates significant differences in basophil levels in the analyzed IBD groups. Literature indicates that their role and values in the course of diseases are not well known [16]. Logistic analysis concluded that the level of basophils is significantly higher in the UC group (OR = 2.118, 95% CI: 2.018 ÷ 2.128).
In IBD, there are changes in the level of electrolytes. It is interesting to observe the differences in sodium and potassium levels in UC and CD [21]. Our study showed significant differences in them. Sodium has significantly higher levels in UC (OR = 1.162, 95% CI: 1.142 ÷ 1.182), while the same applied to potassium in CD (OR = 0.086, 95% CI: 0.077 ÷ 0.096). The obtained results clearly show that the differences are significant and can deepen the current knowledge about IBD.
Neutrophils play a significant role in the immune response. Their importance in the development of IBD and their differences between UC and CD are not yet fully understood [13]. The role of neutrophils has been studied in various animal models of IBD for many years, but their participation in the pathogenesis of IBD remains poorly understood and no neutrophil-targeted molecules have been used and validated for the treatment of these pathologies OR = 0.96 (95% CI: 0.94 ÷ 1.11). Therefore, a better understanding of how to operate under these specific conditions is to provide new therapeutic pathways for IBD [35].
Creatinine is a metabolic product. Its level can be significantly changed in IBD. However, the level differences between UC and CD are not exactly known [12]. In this paper, we received a result indicating that its level is significantly different between IBD varieties. In addition, it is significantly higher in CD (OR = 0.708, 95% CI: 0.698 ÷ 0.798)
In the literature, it is difficult to find some relationships between the biochemical parameters themselves without studying the influence of other factors, such as genetic ones. Therefore, it is a new point of view, indicating that when having suspicions about the disease, more attention should be given to the simple results of the tests. This is significant because the constructed model is characterized by an extremely high quality of prediction. The calculated measures show that this model can be taken into account while diagnosing patients. For specificity of 0.74, the sensitivity value is 0.84, and the AUC is 0.93. Sensitivity forced the ability to identify patients with CD, while specificity indicates the ability to assign patients to the UC group correctly. In about 84% of cases, the patient with CD was properly assigned to this group. This is a high prediction capability.
The new AQM measure proposed in this work is a balanced measure that interprets all the results from a matrix of errors. It shows, in full scale, how the developed model increments the match results. This measure has been previously tested in other studies. It often gave better results than commonly used measures, due to the fact that it showed better prediction errors. In the case of the model proposed in this work, AQM = 0.79, which indicates a very good fit of the model to the data.
The obtained results bring out the significant differences and can affect the faster diagnosis. This is extremely important in health-problematic situations (e.g., when the disease is hard to diagnose, due to unclear symptoms).
In further directions of the research, it should be noted that it is necessary to check how the constructed model predicts results on various, balanced research groups.
5. Conclusions
The analysis showed that the use of advanced data analysis methods can increase medical knowledge. A system was constructed in the work indicating the differences between Crohn’s disease and ulcerative colitis. The results indicate very high predictive capabilities of the model and indicate the applicability in diagnostic practice.
Author Contributions
Conceptualization, A.K. and J.D.; methodology, A.K, A.D., and J.D.; formal analysis, A.K.; investigation, A.K.; data curation, A.K. and J.D.; writing—original draft preparation, A.K. and A.D.; writing—review and editing, A.K., A.D., and J.D.; visualization, A.K.; supervision, A.D. and J.D.; project administration, A.D. and J.D.; funding acquisition, A.D. All authors read and approved the final manuscript.
Funding
This research was funded by Ministry of Science and Higher Education in Poland, grant number S/WM/1/2017.
Conflicts of Interest
The authors declare no conflict of interest.
References
- Aufses, A.H. The History of Surgery for Crohn’s Disease at The Mount Sinai Hospital. Mt. Sinai J. Med. 2000, 67, 198–203. [Google Scholar] [PubMed]
- Connelly, T.M.; Koltun, W.A. The cancer “fear” in IBD patients: Is it still real? J. Gastrointest. Surg. 2014, 18, 213–218. [Google Scholar] [CrossRef]
- Frolkis, A.D.; Dykeman, J.; Negron, M.E.; Debruyn, J.; Jette, N.; Fiest, K.M.; Frolkis, T.; Barkema, H.W.; Rioux, K.P.; Panaccione, R.; et al. Risk of surgery for inflammatory bowel diseases has decreased over time: A systematic review and meta-analysis of population-based studies. Gastroenterology 2013, 145, 996–1006. [Google Scholar] [CrossRef] [PubMed]
- Baumgart, D.; Sandborn, W. Crohn’s Disease. Lancet 2012, 380, 1590–1605. [Google Scholar] [CrossRef]
- Rutgeerts, P.; Goboes, K.; Peeters, M.; Hiele, M.; Penninckx, F.; Aerts, R.; Kerremans, R.; Vantrappen, G. Effect of faecal stream diversion on recurrence of Crohn’s disease in the neoterminal ileum. Lancet 1992, 338, 771–774. [Google Scholar] [CrossRef]
- Abraham, C.; Cho, J. Inflammatory bowel disease. NEJM 2009, 361, 2066–2078. [Google Scholar] [CrossRef] [PubMed]
- Mahid, S.S.; Minor, K.S.; Soto, R.E.; Hornung, C.A.; Galandiuk, S. Smoking and inflammatory bowel disease: A meta-analysis. Mayo Clin. Proc. 2006, 81, 1462–1471. [Google Scholar] [CrossRef] [PubMed]
- Bernstein, C.N.; Rawsthorne, P.; Cheang, M.; Blanchard, J.F. A population-based case control study of potential risk factors for IBD. Am. J. Gastroenterol. 2006, 101, 993–1002. [Google Scholar] [CrossRef] [PubMed]
- Cottone, M.; Rosselli, M.; Orlando, A.; Olivia, I.; Puleo, A.; Cappelo, M.; Traina, M.; Tonelli, F.; Pagliaro, L. Smoking habits and recurrence in Crohn’s disease. Gastroenterology 1994, 106, 643–648. [Google Scholar] [CrossRef]
- Daniluk, J.; Daniluk, U.; Reszec, J.; Rusak, M.; Dabrowska, M.; Dabrowski, A. Protective effect of cigarette smoke on the course of dextran sulfate sodium-induced colitis is accompanied by lymphocyte subpopulation changes in the blood and colon. Int. J. Colorectal. Dis. 2017, 32, 1551–1559. [Google Scholar] [CrossRef] [PubMed]
- Calkins, B.M. A meta-analysis of the role of smoking in inflammatory bowel disease. Dig. Dis. Sci. 1989, 34, 1841–1854. [Google Scholar] [CrossRef]
- Cappello, M.; Morreale, G.C. The Role of Laboratory Tests in Crohn’s Disease. Clin. Med. Insights Gastroenterol. 2016, 9, 51–62. [Google Scholar] [CrossRef] [PubMed]
- Zho, G.X.; Liu, Z.J. Potential roles of neutrophils in regulating intestinal mucosal inflammation of inflammatory bowel disease. J. Dig. Dis. 2017, 18, 495–503. [Google Scholar] [CrossRef]
- Giuffrida, P.; Corazza, G.R.; Di Sabatino, A. Old and New Lymphocyte Players in Inflammatory Bowel Disease. Dig. Dis. Sci. 2018, 63, 277–288. [Google Scholar] [CrossRef]
- Gren, S.T.; Grip, O. Role of Monocytes and Intestinal Macrophages in Crohn’s Disease and Ulcerative Colitis. Inflamm. Bowel. Dis. 2016, 22, 1992–1998. [Google Scholar] [CrossRef]
- Merigo, F.; Brandolese, A.; Facchin, S.; Missaggia, S.; Bernardi, P.; Boschi, F.; D’Incà, R.; Savarino, E.V.; Sbarbati, A.; Sturniolo, G.C. Glucose transporter expression in the human colon. World J. Gastroenterol. 2018, 24, 775–793. [Google Scholar] [CrossRef]
- Sarfati, M.; Wakahara, K.; Chapuy, L.; Delespesse, G. Mutual Interaction of Basophils and T Cells in Chronic Inflammatory Diseases. Front. Immunol. 2015, 6, 399. [Google Scholar] [CrossRef]
- Schieffer, K.M.; Bruffy, S.M.; Rauscher, R.; Koltun, W.A.; Yochum, G.S.; Gallagher, C.G. Reduced total serum bilirubin levels are associated with ulcerative colitis. PLoS ONE 2017, 12, e0179267. [Google Scholar] [CrossRef]
- Dolapcioglu, C.; Soylu, A.; Kendir, T.; Ince, A.T.; Dolapcioglu, H.; Purisa, S. Coagulation parameters in inflammatory bowel disease. Int. J. Clin. Exp. Med. 2014, 7, 1442–1448. [Google Scholar]
- Yazici, A.; Senturk, O.; Aygun, C.; Celebi, A.; Caglayan, C.; Hulagu, S. Thrombophilic Risk Factors in Patients with Inflammatory Bowel Disease. Gastroenterol. Res. 2010, 3, 112–119. [Google Scholar] [CrossRef][Green Version]
- Priyamvada, S.; Gomes, R.; Gill, R.K.; Seksena, S.; Alrefai, W.A.; Dudeja, P.K. Mechanisms Underlying Dysregulation of Electrolyte Absorption in IBD Associated Diarrhea. Inflamm. Bowel. Dis. 2015, 21, 2926–2935. [Google Scholar] [CrossRef]
- Hosmer, D.; Lemeshow, S.; Sturdivant, R. Applied Logistic Regression; Wiley Series in Probability and Statistics; Wiley: Hoboken, NJ, USA, 2013. [Google Scholar]
- De Jong, P.; Heller, G.Z. Generalized Linear Models for Insurance Data; Cambridge University Press: Cambridge, MA, USA, 2008. [Google Scholar]
- Kasperczuk, A.; Dardzinska, A. Comparative evaluation of the different data mining techniques used for the medical database. Acta Mech. Autom. 2016, 10, 233–238. [Google Scholar] [CrossRef]
- Powers, D.M. Evaluation: From Precision, Recall and F-Measure to ROC, Informedness, Markedness & Correlation. J. Mach. Learn. Technol. 2011, 2, 37–63. [Google Scholar]
- Vavrica, R.V.; Brun, J.; Ballabeni, P.; Pittel, V.; Vavrica, B.M.; Zeitz, J.; Rogler, G.; Schoepfler, A. Frequency and Risk Factors for Extraintestinal Manifestations in the Swiss Inflammatory Bowel Disease Cohort. Am. J. Gastroenterol. 2011, 106, 110–119. [Google Scholar] [CrossRef] [PubMed]
- Kanaan, Z.M.; Eichenberger, M.R.; Ahmad, S.; Weller, C.; Roberts, H.; Pan, J.; Rai, S.N.; Petras, R.; Weller, E.B.; Galandiuk, S. Clinical predictors of inflammatory bowel disease in a genetically well-defined Caucasian population. J. Negat. Res. Biomed. 2012, 11, 7. [Google Scholar] [CrossRef] [PubMed]
- Avalos, D.J.; Mendoza-Ladd, A.; Zuckerman, M.J.; Bashashati, M.; Alvarado, A.; Dwivedi, A.; Damas, O.M. Hispanic Americans and Non-Hispanic White Americans Have a Similar Inflammatory Bowel Disease Phenotype: A Systematic Review with Meta-Analysis. Dig. Dis. Sci. 2018, 63, 1558–1571. [Google Scholar] [CrossRef] [PubMed]
- Li, H.; Jin, Z.; Li, X.; Wu, L.; Jin, J. Associations between single-nucleotide polymorphisms and inflammatory bowel disease-associated colorectal cancers in inflammatory bowel disease patients: A meta-analysis. Clin. Transl. Oncol. 2017, 19, 1018–1027. [Google Scholar] [CrossRef]
- Bank, S.; Julsgaard, M.; Abed, O.K.; Burisch, J.; Broder, B.J.; Pedersen, N.K.; Gouliaev, A.; Ajan, R.; Nytoft Rasmussen, D.; Honore Grauslund, C.; et al. Polymorphisms in the NFkB, TNF-alpha, IL-1beta, and IL-18 pathways are associated with response to anti-TNF therapy in Danish patients with inflammatory bowel disease. Aliment Pharmacol. Ther. 2019, 49, 890–903. [Google Scholar] [CrossRef]
- Setoodeh, S.; Liu, L.; Boukhar, S.A.; Singal, A.G.; Westerhoff, M.; Waljee, A.K.; Ahmed, T.; Gopal, P. The Clinical Significance of Crohn Disease Activity at Resection Margins. Arch. Pathol. Lab. Med. 2018. [Google Scholar] [CrossRef]
- Wagner, J.; Sim, W.H.; Lee, K.J.; Kirkwood, C.D. Current knowledge and systematic review of viruses associated with Crohn’s disease. Rev. Med. Virol. 2013, 23, 145–171. [Google Scholar] [CrossRef] [PubMed]
- Kaitha, S.; Bashir, M.; Ali, T. Iron deficiency anemia in inflammatory bowel disease. World J. Gastrointest. Pathophysiol. 2015, 6, 62–72. [Google Scholar] [CrossRef] [PubMed]
- Danese, S.; Motte, C.L.; Fiocchi, C. Platelets in inflammatory bowel disease: Clinical, pathogenic, and therapeutic implications. Am. J. Gastroenterol. 2004, 99, 938–945. [Google Scholar] [CrossRef] [PubMed]
- Wera, O.; Lancellotti, P.; Oury, C. The Dual Role of Neutrophils in Inflammatory Bowel Diseases. J. Clin. Med. 2016, 5, 118. [Google Scholar] [CrossRef] [PubMed]
© 2019 by the authors. Licensee MDPI, Basel, Switzerland. This article is an open access article distributed under the terms and conditions of the Creative Commons Attribution (CC BY) license (http://creativecommons.org/licenses/by/4.0/).

