Model and Data-Driven System Portfolio Selection Based on Value and Risk

Abstract
Featured Application
Abstract
1. Introduction
2. Materials and Methods
2.1. Capability Gap Based Value Decision
2.1.1. Weight Decision Based on Correlation Analysis
2.1.2. Value Model Construction
- (1)
- Additive rule: the combined capability value is . E.g., Assuming that 3 transportation systems operate at the same time, the freight volume are 5t, 6t and 7t respectively, then the portfolio of the 3 systems can provide a freight capability of 18t.
- (2)
- Maximal rule: the combined capability value is . E.g., Assuming that there are three bridges over a river, and each bridge can bear the weight of 100t, 120t and 130t respectively, then only object less than 130t can pass the river, because one object can only pass over one bridge at the same time.
- (3)
- Minimal rule: the combined capability value is . E.g., Assuming that there are 3 tandem oil pipelines with oil flow of 5 t/hour, 6 t/hour and 3 t/hour, then the max oil flow of the 3 pipeline is 3 t/hour.
- (4)
- Average rule: the combined capability value is . E.g., Assuming there are 3 forecast systems, with correctly predicting probability 50%, 60%, and 70%, then the overall correctly predicting probability is 60%.
2.2. Risk Decision Based on RUL Prediction
2.2.1. Feature extraction based on variation coefficient
2.2.2. Reconstruction of Degradation Track Phase Space
2.2.3. System Portfolio Risk Determination Based on RUL
2.3. System Portfolio Optimization
3. Results
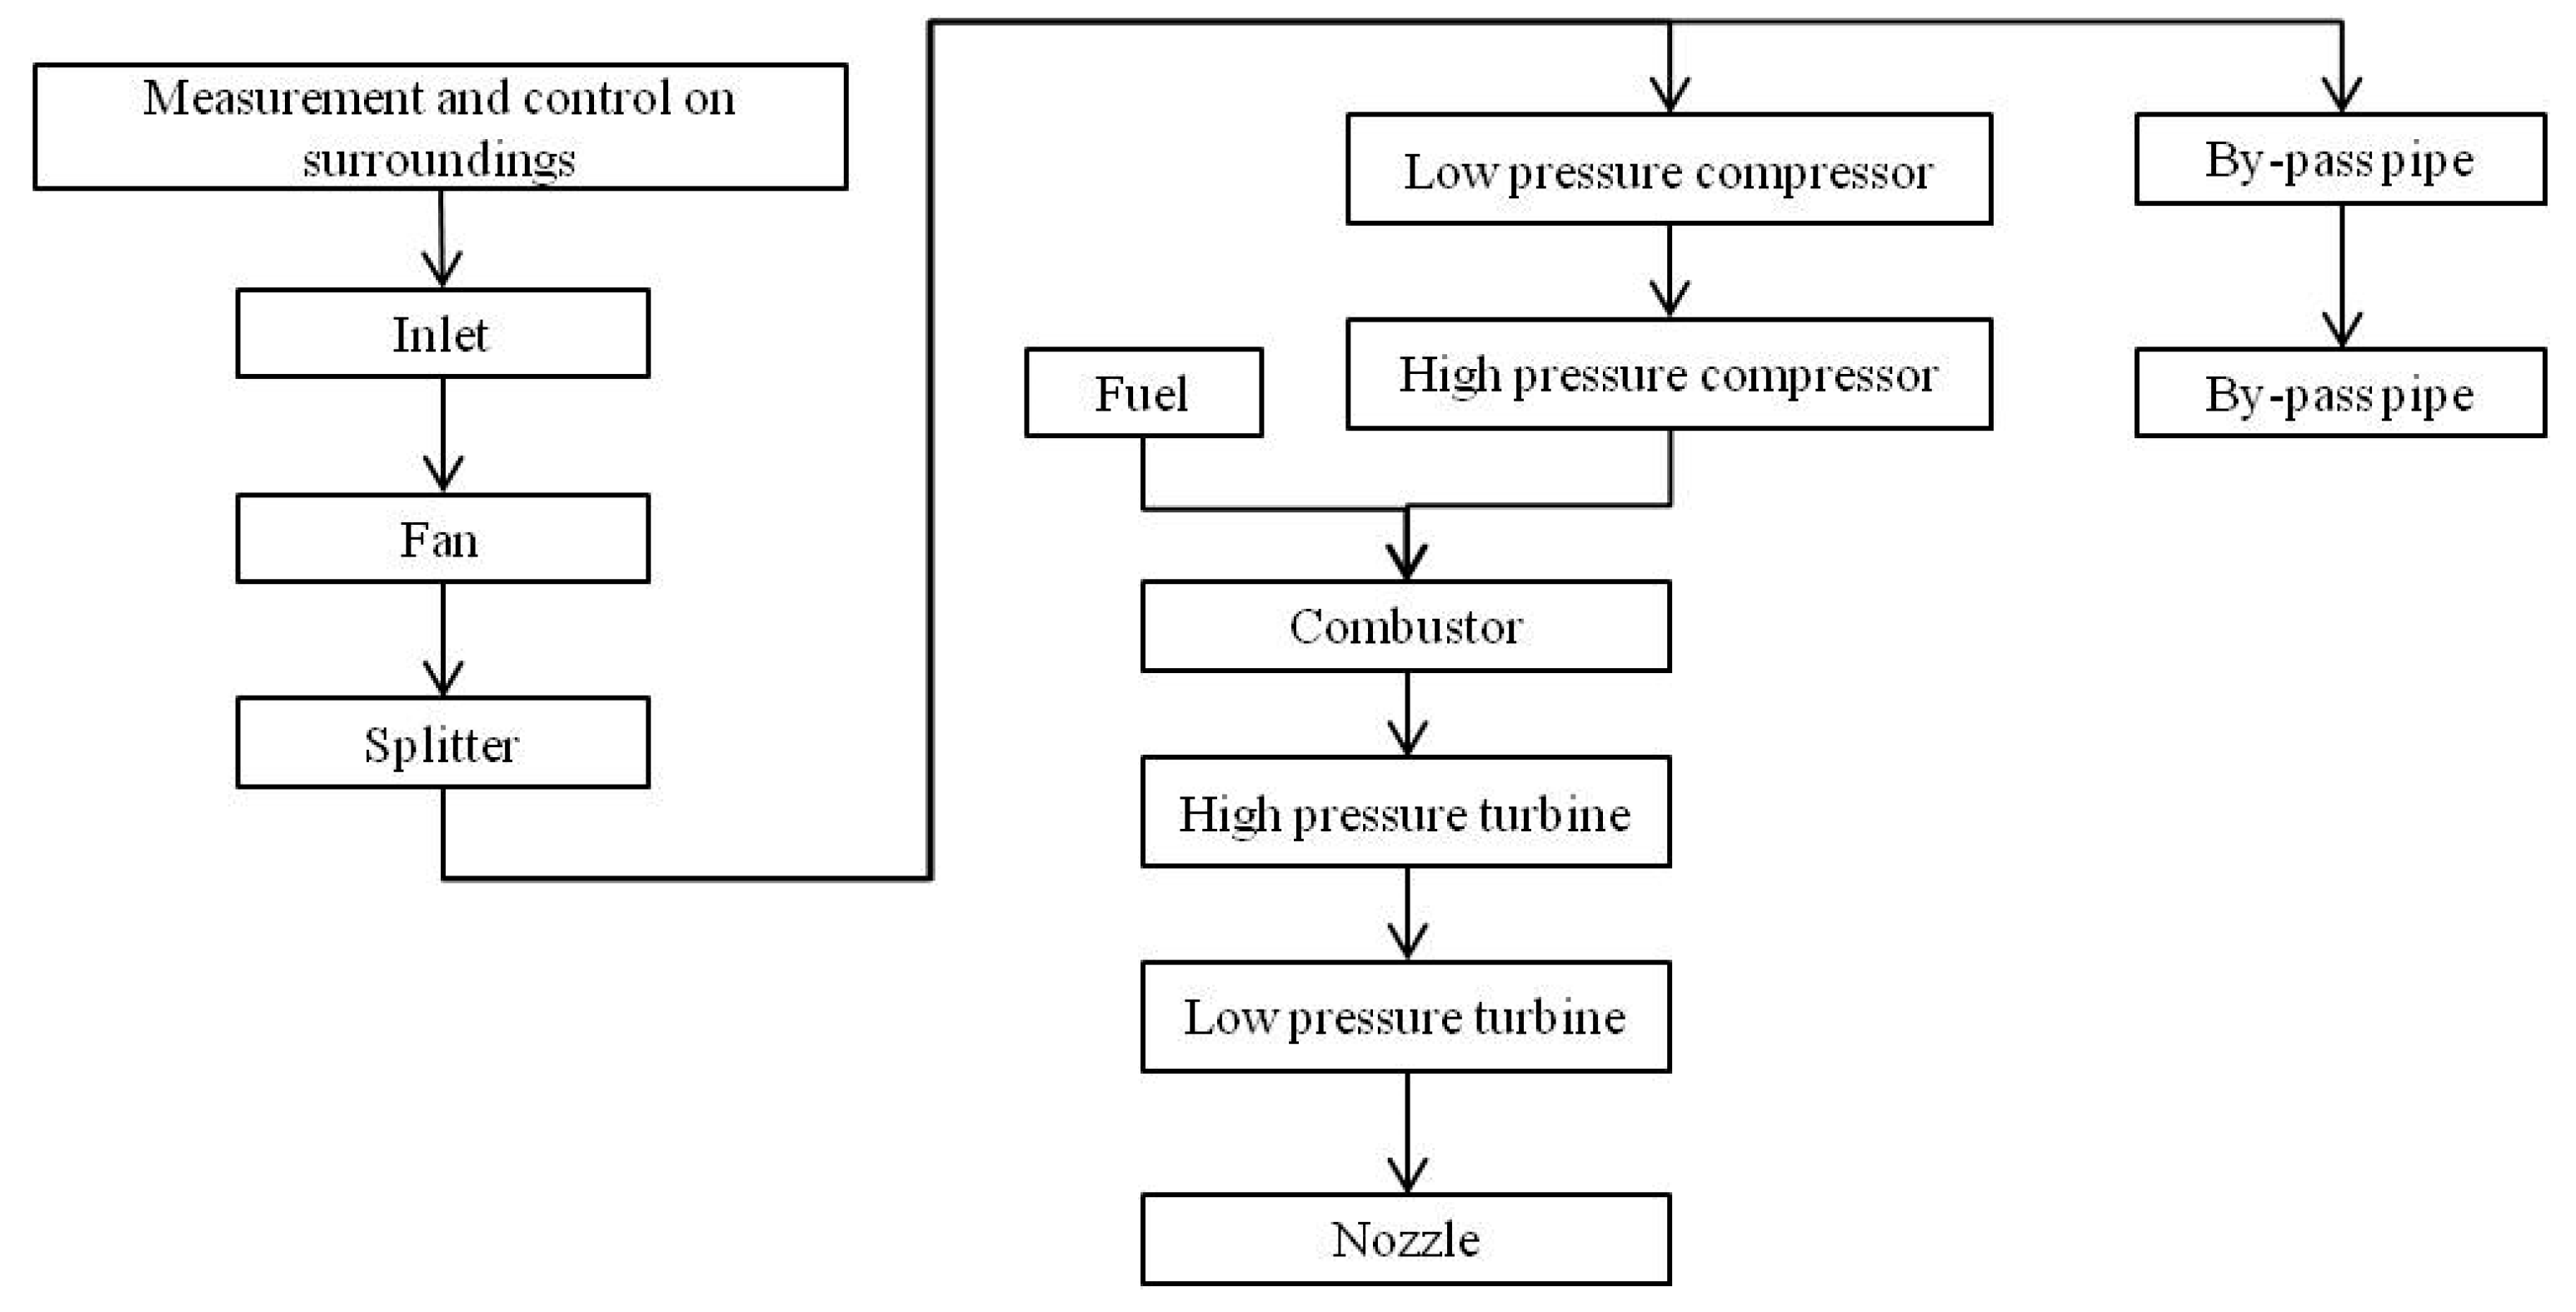
3.1. Background Description
3.2. Value Calculation
3.2.1. Weight Determination
3.2.2. Value Calculation
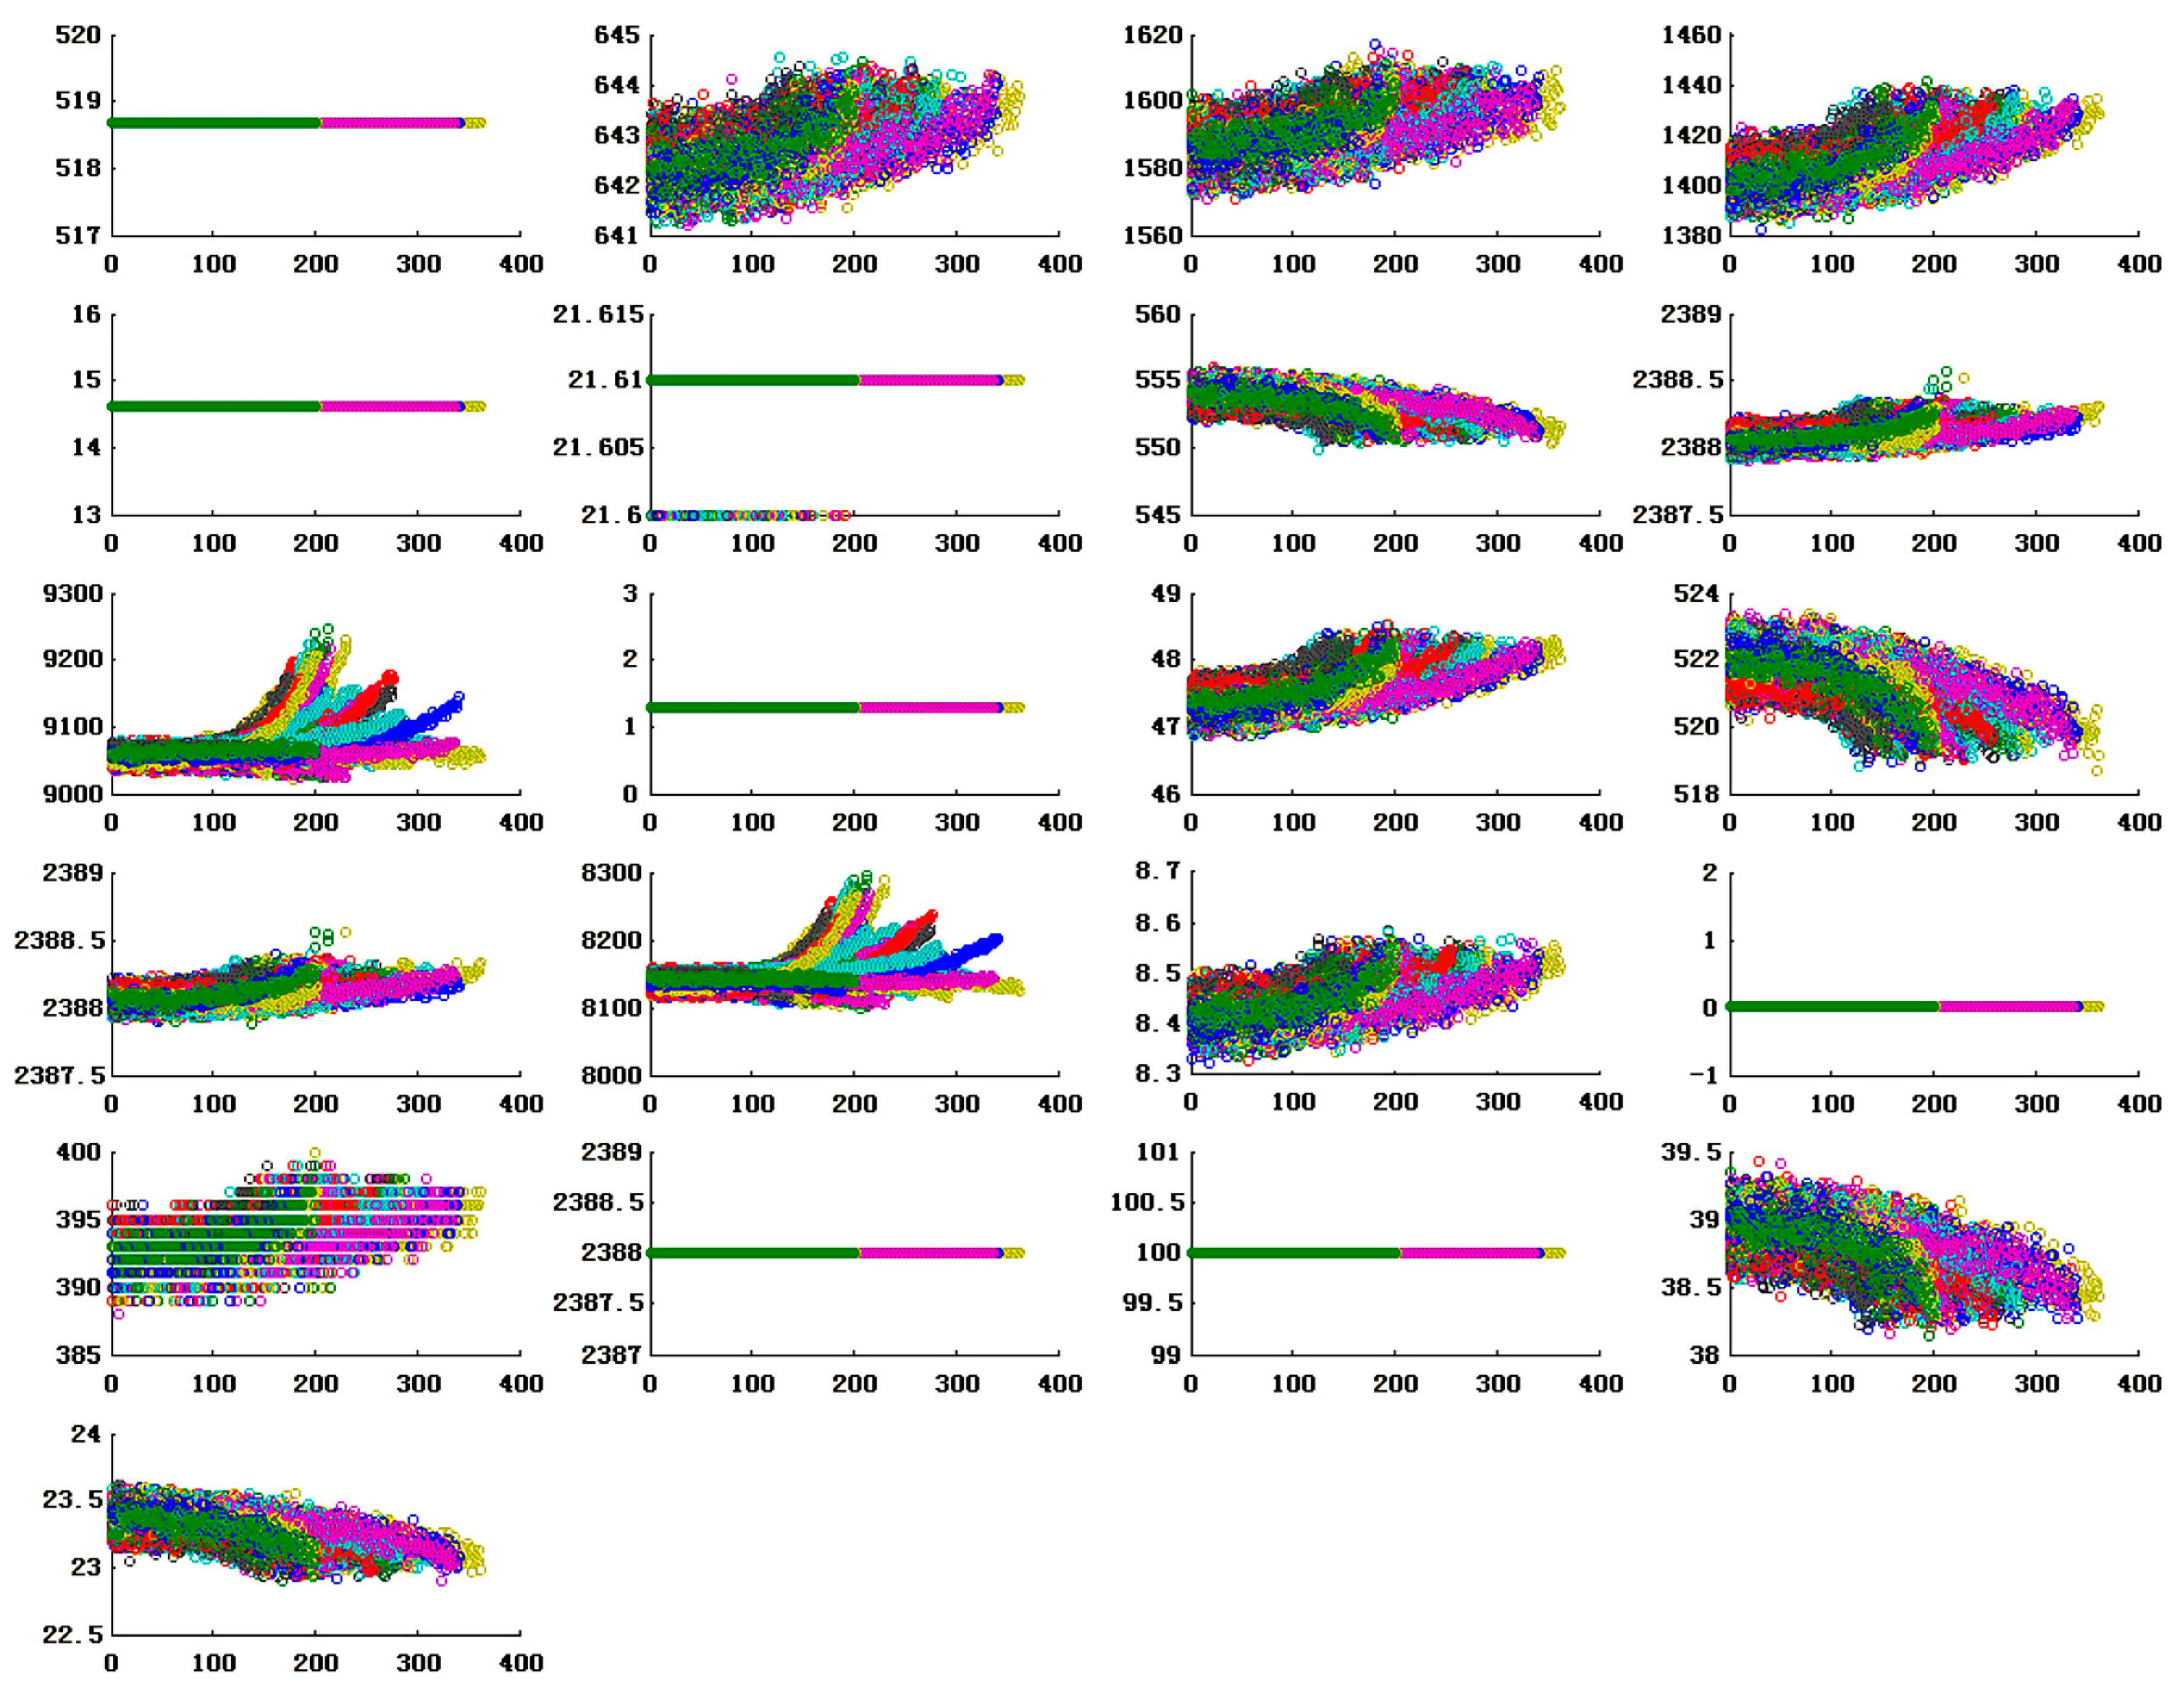
3.3. Risk Determination Based on RUL Prediction
- (1)
- The simulation experiment data contains time series of 21 variables. It can be further divided into a training set and a testing set. Each multivariate time series corresponds to a specific engine, meaning that the data can be considered to be generated by engines of different systems.
- (2)
- The initial wear condition of each engine might not be identical and there are manufacturing variations, which are considered reasonable and not treated as reasons of engine failures.
- (3)
- There are 3 operational setting parameters that have a substantial impact on an engine’s performance.
- (4)
- There are noises in the data.
- (5)
- The engines operate normally at the initial moment and begin to degrade at some points in time series. In the training set, the cumulative degradation quantity continues to grow until it reaches or exceeds the preset threshold. In the testing set, the time series will terminate when engines fail.
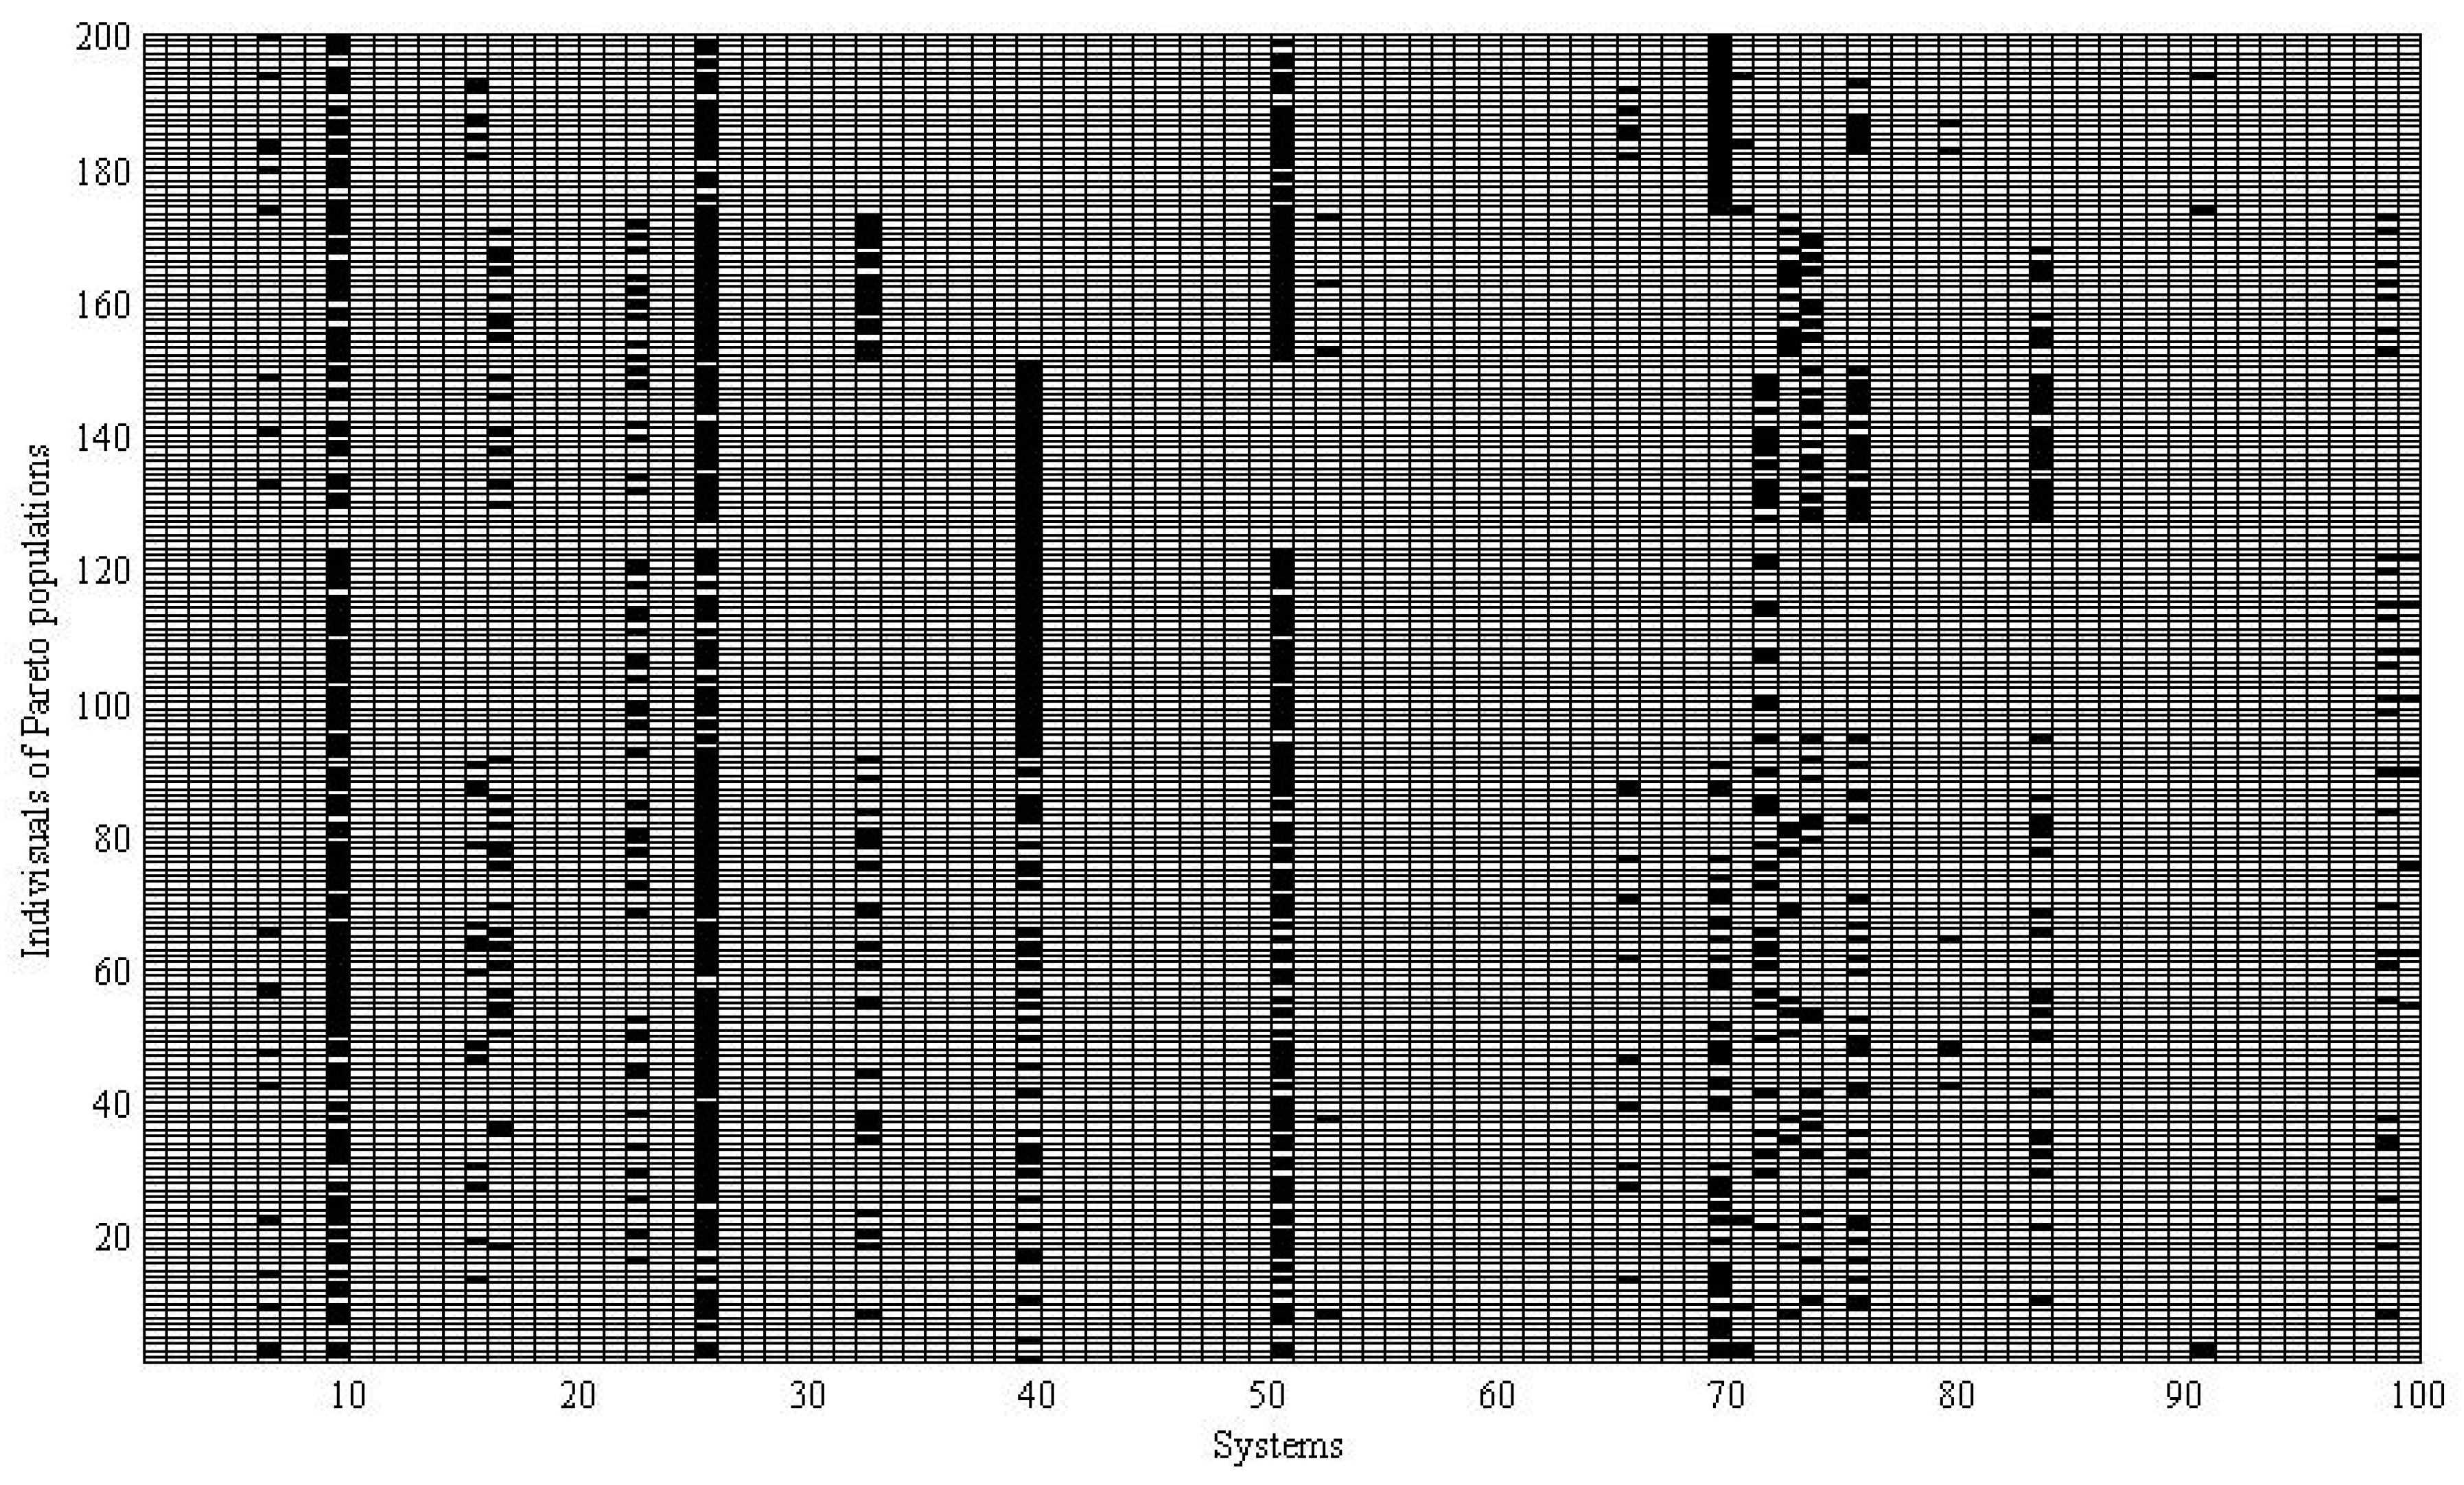
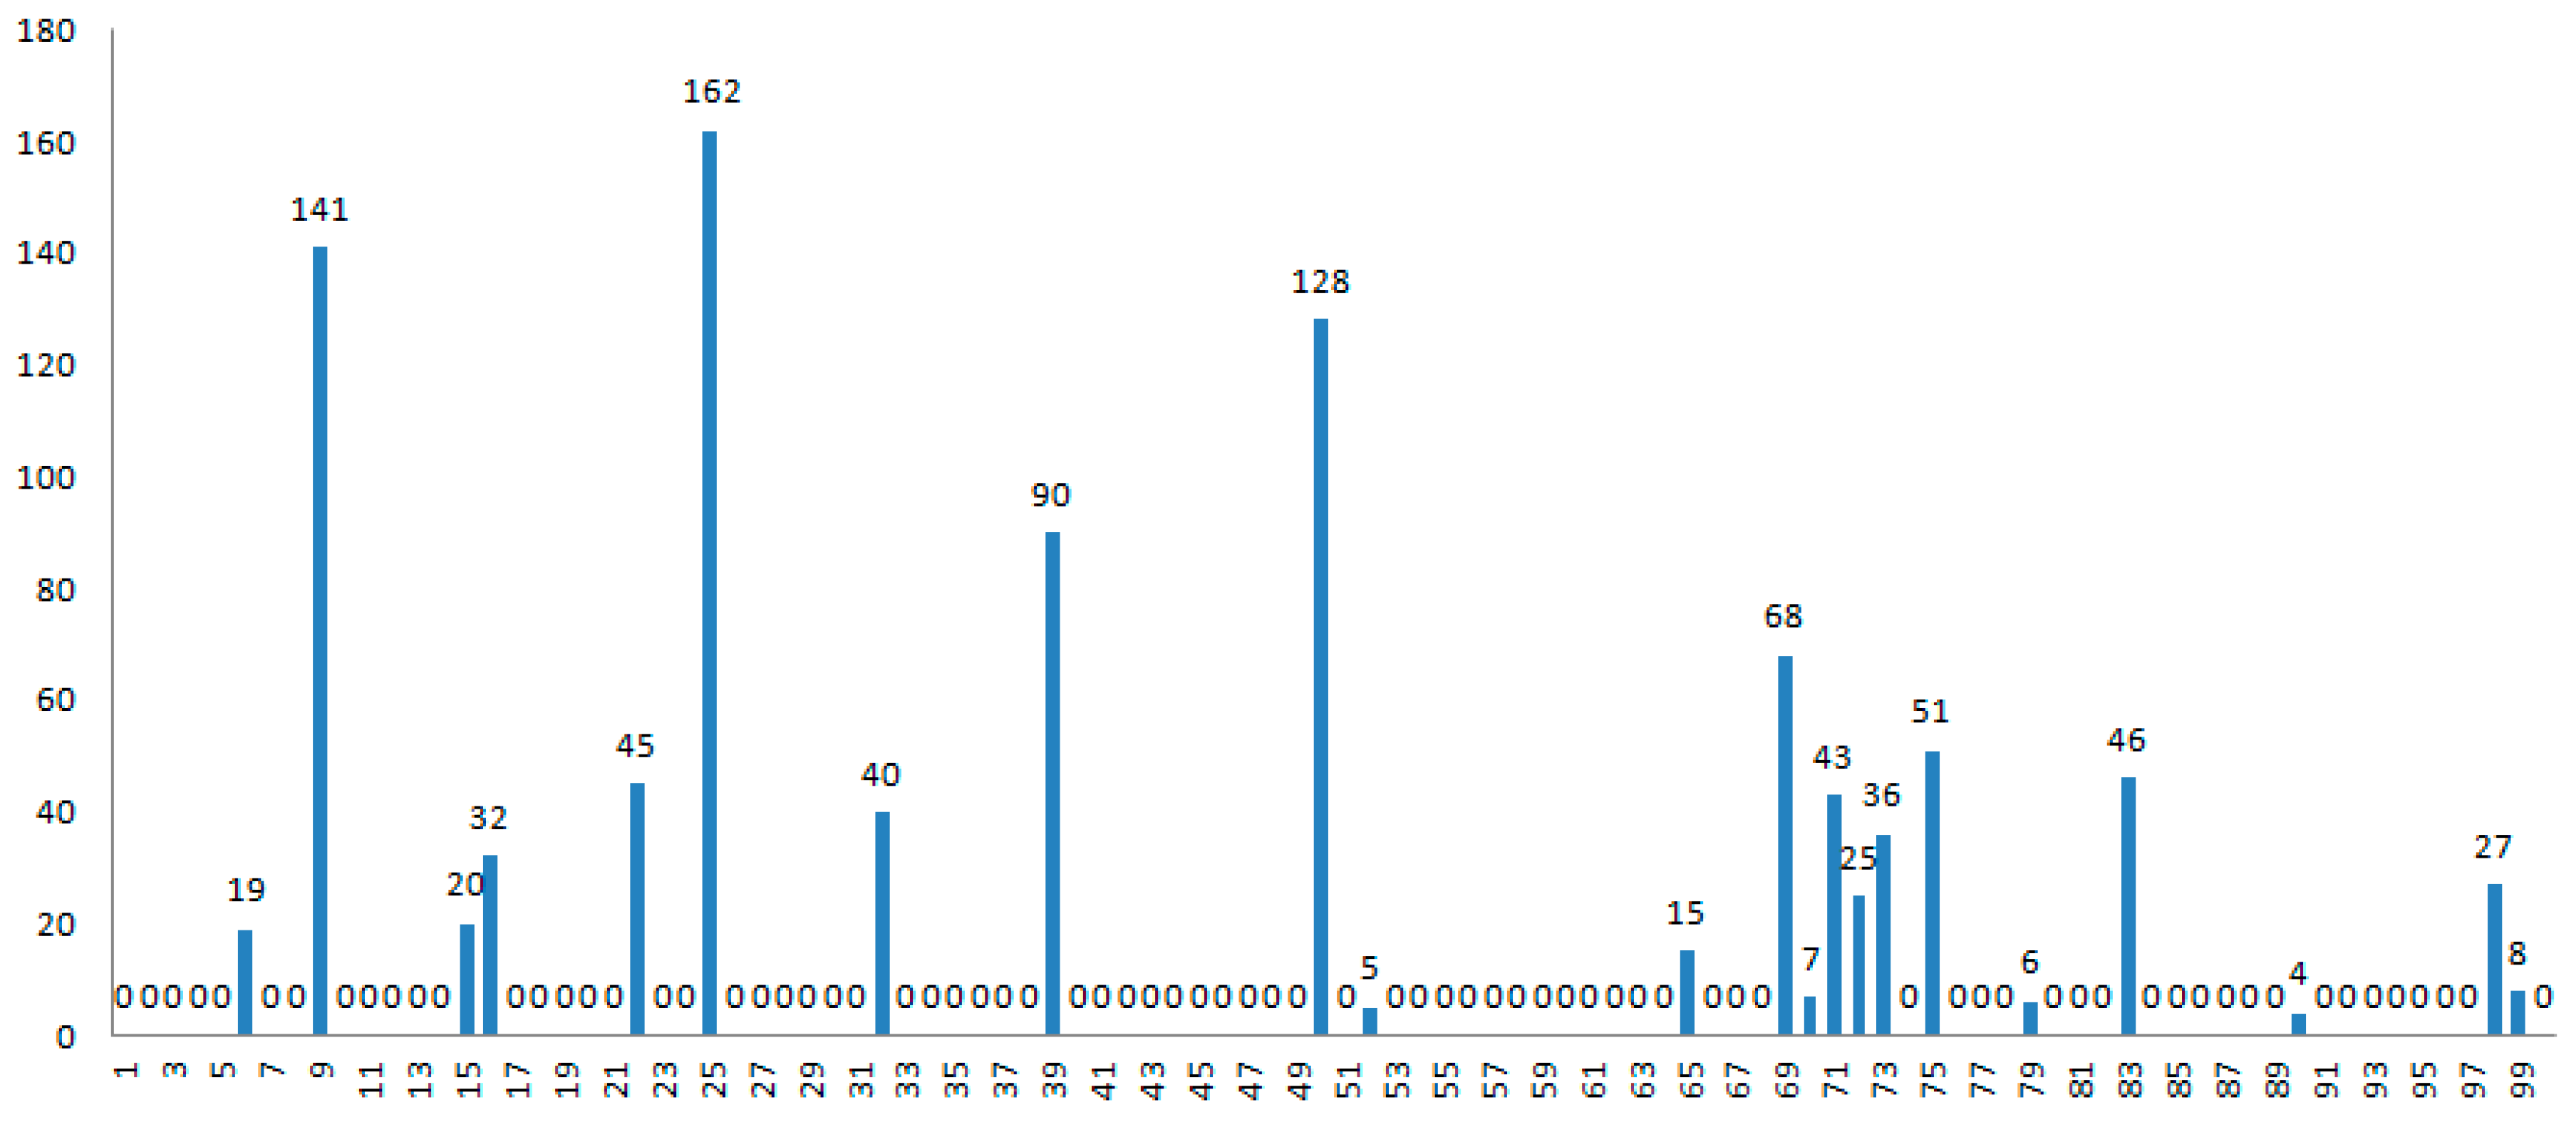
3.4. Portfolio Selection Results Analysis
4. Discussion
Author Contributions
Funding
Acknowledgments
Conflicts of Interest
References
- Xia, B.; Dou, Y.; Zhao, Q.; Ge, B.; Zhang, Y. Robust System Portfolio Selection with Multi-Function Requirements and System Instability. In Proceedings of the Proceedings of the Systems Conference (SysCon), Montreal, QC, Canada, 24–27 April 2017. [Google Scholar]
- Markowitz, H. Portfolio selection. J. Financ. 2012, 7, 77–91. [Google Scholar]
- Ľuboš, P. Portfolio Selection and Asset Pricing Models. J. Financ. 2000, 55, 179–223. [Google Scholar]
- Mohagheghi, V.; Mousavi, S.M.; Vahdani, B.; Shahriari, M.R. R&D project evaluation and project portfolio selection by a new interval type-2 fuzzy optimization approach. Neural Comput. Appl. 2017, 28, 3869–3888. [Google Scholar]
- Abdollahi, M.; Arvan, M.; Razmi, J. An integrated approach for supplier portfolio selection: Lean or agile. Expert Syst. Appl. 2015, 42, 679–690. [Google Scholar] [CrossRef]
- McCarthy, D.M. One Size Does Not Fit All-Right-Sized Signal Detection Systems That Are Appropriate for Your Portfolio Benefit-Risk Management Strategy. Pharmacoepidemiol. Drug Saf. 2016, 25, 404–405. [Google Scholar]
- Achillas, C.; Aidonis, D.; Iakovou, E.; Thymianidis, M.; Tzetzis, D. A methodological framework for the inclusion of modern additive manufacturing into the production portfolio of a focused factory. J. Manuf. Syst. 2015, 37, 328–339. [Google Scholar] [CrossRef]
- Dou, Y.; Zhang, P.; Ge, B.; Jiang, J.; Chen, Y. An integrated technology pushing and requirement pulling model for weapon system portfolio selection in defense acquisition and manufacturing. Proc. Inst. Mech. Eng. B J. Eng. 2015, 229, 1046–1067. [Google Scholar] [CrossRef]
- Chien, C.F.; Huynh, N.T. An Integrated Approach for IC Design R&D Portfolio Decision and Project Scheduling and a Case Study. IEEE Trans. Semiconduct. Manuf. 2018, 31, 76–86. [Google Scholar]
- Liesio, J.; Salo, A. Scenario-based portfolio selection of investment projects with incomplete probability and utility information. Eur. J. Oper. Res. 2012, 217, 162–172. [Google Scholar] [CrossRef]
- Li, Y.P.; Huang, G.H.; Chen, X. Multistage scenario-based interval-stochastic programming for planning water resources allocation. Serra 2009, 23, 781–792. [Google Scholar] [CrossRef]
- Xia, B.; Zhao, Q.; Yang, K.; Dou, Y.; Yang, Z. Scenario-Based Modeling and Solving Research on Robust Weapon Project Planning Problems. J. Syst. Eng. Electron. 2019, 30, 85–99. [Google Scholar]
- Rafiee, M.; Kianfar, F. A scenario tree approach to multi-period project selection problem using real-option valuation method. Int. J. Adv. Manuf. Tech. 2011, 56, 411–420. [Google Scholar] [CrossRef]
- Ben-Tal, A.; Chung, B.D.; Mandala, S.R.; Yao, T. Robust optimization for emergency logistics planning: Risk mitigation in humanitarian relief supply chains. Transp. Res. B Meth. 2011, 45, 1177–1189. [Google Scholar] [CrossRef]
- Ismail, A.; Pham, H. Robust Markowitz mean-variance portfolio selection under ambiguous covariance matrix. Math. Financ. 2019, 29, 174–207. [Google Scholar] [CrossRef]
- Hu, J.; Mehrotra, S. Robust and stochastically weighted multi-objective optimization models and reformulations. Oper. Res. 2012, 60, 939–953. [Google Scholar] [CrossRef]
- Quintana, D.; Denysiuk, R.; Garcia-Rodriguez, S.; Gaspar-Cunha, A. Implementation Risk Management Using Evolutionary Multiobjective Optimization. Appl. Sci. 2017, 7, 1079. [Google Scholar] [CrossRef]
- Poklepović, T.; Marasović, B.; Aljinović, Z. Portfolio selection model-based on technical, fundamental and market value analysis. In Proceedings of the European Conference on Operational Research, Vilnius, Litva, 8–11 July 2012. [Google Scholar]
- Liesiö, J.; Mild, P.; Salo, A. Robust portfolio modeling with incomplete cost information and project interdependencies. Eur. J. Oper. Res. 2008, 190, 679–695. [Google Scholar] [CrossRef]
- Golabi, K.; Kirkwood, C.W.; Sicherman, A. Selecting a portfolio of solar energy projects using multi-attribute preference theory. Manag. Sci. 1981, 27, 174–189. [Google Scholar] [CrossRef]
- Ge, B.; Hipel, K.W.; Fang, L.; Yang, K.; Chen, Y. An Interactive Portfolio Decision Analysis Approach for System-of-Systems Architecting Using the Graph Model for Conflict Resolution. IEEE Trans. Syst. Man Cybern. Syst. 2014, 44, 1328–1346. [Google Scholar] [CrossRef]
- Beraldi, P.; Violi, A.; Ferrara, M.; Ciancio, C.; Pansera, B.A. Dealing with complex transaction costs in portfolio management. Ann. Oper. Res. 2019. [Google Scholar] [CrossRef]
- Saborido, R.; Ruiz, A.B.; Bermúdez, J.D.; Vercher, E.; Luque, M. Evolutionary multi-objective optimization algorithms for fuzzy portfolio selection. Appl. Soft. Comput. 2016, 39, 48–63. [Google Scholar] [CrossRef]
- Nalpas, N.; Simar, L.; Vanhems, A. Portfolio selection in a multi-moment setting: A simple Monte-Carlo-FDH algorithm. Eur. J. Oper. Res. 2017, 263, 308–320. [Google Scholar] [CrossRef]
- Sands, C. Application of Multi-Criteria Decision Making Methods to the DLA Energy Military Construction Portfolio Selection Process. Ph.D. Thesis, Washington, DC, USA, 2016. [Google Scholar]
- Yang, S.; Yang, M.; Wang, S.; Huang, K. Adaptive immune genetic algorithm for weapon system portfolio optimization in military big data environment. Cluster Comput. 2016, 19, 1359–1372. [Google Scholar] [CrossRef]
- Kangaspunta, J.; Liesiö, J.; Salo, A. Cost-efficiency analysis of weapon system portfolios. Eur. J. Oper. Res. 2012, 223, 264–275. [Google Scholar] [CrossRef]
- Greiner, M.A.; Mcnutt, R.T.; Shunk, D.L.; Fowler, J.W. Selecting military weapon systems development portfolios: Challenges in value measurement. In Proceedings of the Portland International Conference on Management of Engineering & Technology, Portland, OR, USA, 29 July–2 August 2001. [Google Scholar]
- Cheng, C.; Li, J.; Zhao, Q.; Jiang, J.; Yu, L.; Shang, H. Research on weapon system portfolio selection based on combat network modeling. In Proceedings of the Systems Conference (SysCon), Montreal, QC, Canada, 24–27 April 2017. [Google Scholar]
- Zhou, Z.; Dou, Y.; Xia, B.; Jiang, J. Weapon systems portfolio selection based on fuzzy clustering analysis. In Proceedings of the IEEE International Conference on Control Science & Systems Engineering, Beijing, China, 17–19 August 2017. [Google Scholar]
- Li, M.H.; Li, M.J.; Yang, K.W.; Xia, B.Y.; Wan, C.Q. A Network-Based Portfolio Optimization Approach for Military System of Systems Architecting. IEEE Access 2018. [Google Scholar] [CrossRef]
- Yu, Z.; Tan, Y.J.; Yang, K.W.; Yu, Z.Y. Research on evolving capability requirements oriented weapon system of systems portfolio planning. In Proceedings of the International Conference on System of Systems Engineering, Genova, Italy, 16–19 July 2012. [Google Scholar]
- Huang, K. Combinatorial optimization and simulation for weapon system portfolio using self-adaptive Memetic algorithm. J. Eng. Res. 2017, 5, 124–139. [Google Scholar]


| Capabilities | ||||
|---|---|---|---|---|
| CR | [100,200] | [100,250] | [150,300] | [10,30] |
| Rules | Maximal | Addition | Addition | Average |
| MIC | Intercepted Missile Number |
|---|---|
| Detection range | 0.854 |
| Communication range | 0.772 |
| Striking range | 0.537 |
| Decision time | 0.928 |
| Systems | Detection Range | Communication Range | Striking Range | Decision Time |
|---|---|---|---|---|
| S1 | 128.8502018 | 45.00221559 | 41.93626171 | 22.55909356 |
| S2 | 205.1604693 | 36.35948504 | 50.01541323 | 16.53053513 |
| S3 | 156.9600287 | 27.11329846 | 43.28357399 | 16.46184426 |
| S4 | 152.7120943 | 26.19071935 | 53.57115127 | 21.31900886 |
| S5 | 111.5170147 | 15.40553804 | 29.95161145 | 15.33123079 |
| SP1 | 205.1604693 | 150.0713 | 218.758 | 18.44034 |
| Variable | Sensor 2 | Sensor 3 | Sensor 4 | Sensor 7 | Sensor 8 | Sensor 11 | Sensor 12 | Sensor 13 | Sensor 15 | Sensor 17 | Sensor 20 | Sensor 21 |
|---|---|---|---|---|---|---|---|---|---|---|---|---|
| VC | 0.0567 | 0.2760 | 0.5110 | 0.1239 | 0.0020 | 0.4573 | 0.1117 | 0.0020 | 0.3408 | 0.2907 | 0.3519 | 0.3514 |
| S | RUL | Risk | S | RUL | Risk | S | RUL | Risk | S | RUL | Risk |
|---|---|---|---|---|---|---|---|---|---|---|---|
| S1 | 112 | 0.008929 | S26 | 197 | 0.005076 | S51 | 114 | 0.008772 | S76 | 76 | 0.013158 |
| S2 | 104 | 0.009615 | S27 | 162 | 0.006173 | S52 | 72 | 0.013889 | S77 | 78 | 0.012821 |
| S3 | 97 | 0.010309 | S28 | 82 | 0.012195 | S53 | 78 | 0.012821 | S78 | 199 | 0.005025 |
| S4 | 92 | 0.01087 | S29 | 75 | 0.013333 | S54 | 187 | 0.005348 | S79 | 167 | 0.005988 |
| S5 | 133 | 0.007519 | S30 | 83 | 0.012048 | S55 | 189 | 0.005291 | S80 | 109 | 0.009174 |
| S6 | 105 | 0.009524 | S31 | 75 | 0.013333 | S56 | 75 | 0.013333 | S81 | 75 | 0.013333 |
| S7 | 81 | 0.012346 | S32 | 150 | 0.006667 | S57 | 76 | 0.013158 | S82 | 75 | 0.013333 |
| S8 | 61 | 0.016393 | S33 | 121 | 0.008264 | S58 | 75 | 0.013333 | S83 | 202 | 0.00495 |
| S9 | 137 | 0.007299 | S34 | 75 | 0.013333 | S59 | 190 | 0.005263 | S84 | 74 | 0.013514 |
| S10 | 66 | 0.015152 | S35 | 74 | 0.013514 | S60 | 87 | 0.011494 | S85 | 162 | 0.006173 |
| S11 | 107 | 0.009346 | S36 | 75 | 0.013333 | S61 | 72 | 0.013889 | S86 | 156 | 0.00641 |
| S12 | 107 | 0.009346 | S37 | 99 | 0.010101 | S62 | 68 | 0.014706 | S87 | 203 | 0.004926 |
| S13 | 79 | 0.012658 | S38 | 76 | 0.013158 | S63 | 67 | 0.014925 | S88 | 126 | 0.007937 |
| S14 | 136 | 0.007353 | S39 | 208 | 0.004808 | S64 | 74 | 0.013514 | S89 | 79 | 0.012658 |
| S15 | 197 | 0.005076 | S40 | 74 | 0.013514 | S65 | 200 | 0.005 | S90 | 79 | 0.012658 |
| S16 | 188 | 0.005319 | S41 | 94 | 0.010638 | S66 | 74 | 0.013514 | S91 | 72 | 0.013889 |
| S17 | 79 | 0.012658 | S42 | 73 | 0.013699 | S67 | 200 | 0.005 | S92 | 75 | 0.013333 |
| S18 | 101 | 0.009901 | S43 | 79 | 0.012658 | S68 | 75 | 0.013333 | S93 | 69 | 0.014493 |
| S19 | 171 | 0.005848 | S44 | 185 | 0.005405 | S69 | 197 | 0.005076 | S94 | 79 | 0.012658 |
| S20 | 75 | 0.013333 | S45 | 78 | 0.012821 | S70 | 87 | 0.011494 | S95 | 187 | 0.005348 |
| S21 | 156 | 0.00641 | S46 | 82 | 0.012195 | S71 | 202 | 0.00495 | S96 | 189 | 0.005291 |
| S22 | 182 | 0.005495 | S47 | 119 | 0.008403 | S72 | 130 | 0.007692 | S97 | 176 | 0.005682 |
| S23 | 182 | 0.005495 | S48 | 163 | 0.006135 | S73 | 190 | 0.005263 | S98 | 121 | 0.008264 |
| S24 | 75 | 0.013333 | S49 | 28 | 0.035714 | S74 | 117 | 0.008547 | S99 | 189 | 0.005291 |
| S25 | 203 | 0.004926 | S50 | 195 | 0.005128 | S75 | 195 | 0.005128 | S100 | 73 | 0.013699 |
| Ranking by Support | Ranking by Confidence | ||||
|---|---|---|---|---|---|
| Association Rules | Support | Confidence | Association Rules | Support | Confidence |
| 925 | 0.615 | 0.8723 | 7525 | 0.255 | 1.0000 |
| 259 | 0.615 | 0.7593 | [9,39]25 | 0.28 | 0.9032 |
| 5025 | 0.57 | 0.8906 | [9,50]25 | 0.465 | 0.9029 |
| 2550 | 0.57 | 0.7037 | 5025 | 0.57 | 0.8906 |
| 509 | 0.515 | 0.8047 | 925 | 0.615 | 0.8723 |
| 950 | 0.515 | 0.7305 | [25,50]9 | 0.465 | 0.8158 |
| [9,50]25 | 0.465 | 0.9029 | 509 | 0.515 | 0.8047 |
| [25,50]9 | 0.465 | 0.8158 | [25,39]9 | 0.28 | 0.7887 |
| [9,25]50 | 0.465 | 0.7561 | 259 | 0.615 | 0.7593 |
| 50[9,25] | 0.465 | 0.7266 | [9,25]50 | 0.465 | 0.7561 |
| 9[25,50] | 0.465 | 0.6596 | 6950 | 0.25 | 0.7353 |
| [9,39]25 | 0.28 | 0.9032 | 950 | 0.515 | 0.7305 |
| [25,39]9 | 0.28 | 0.7887 | 50[9,25] | 0.465 | 0.7266 |
| 39[9,25] | 0.28 | 0.6222 | 2550 | 0.57 | 0.7037 |
| 7525 | 0.255 | 1.0000 | 9[25,50] | 0.465 | 0.6596 |
| 6950 | 0.25 | 0.7353 | 39[9,25] | 0.28 | 0.6222 |
© 2019 by the authors. Licensee MDPI, Basel, Switzerland. This article is an open access article distributed under the terms and conditions of the Creative Commons Attribution (CC BY) license (http://creativecommons.org/licenses/by/4.0/).
Share and Cite
Wei, H.; Xia, B.; Yang, Z.; Zhou, Z. Model and Data-Driven System Portfolio Selection Based on Value and Risk. Appl. Sci. 2019, 9, 1657. https://doi.org/10.3390/app9081657
Wei H, Xia B, Yang Z, Zhou Z. Model and Data-Driven System Portfolio Selection Based on Value and Risk. Applied Sciences. 2019; 9(8):1657. https://doi.org/10.3390/app9081657
Chicago/Turabian StyleWei, Hechuan, Boyuan Xia, Zhiwei Yang, and Zhexuan Zhou. 2019. "Model and Data-Driven System Portfolio Selection Based on Value and Risk" Applied Sciences 9, no. 8: 1657. https://doi.org/10.3390/app9081657
APA StyleWei, H., Xia, B., Yang, Z., & Zhou, Z. (2019). Model and Data-Driven System Portfolio Selection Based on Value and Risk. Applied Sciences, 9(8), 1657. https://doi.org/10.3390/app9081657