Article

Joint Operation of Renewable Energy and Battery Switch Station Considering the Benefits of Different Subjects

1
State Grid Shandong Electric Power Research Institute, Jinan 250003, China
2
Shandong Energy Regulatory Office of National Energy Administration, Jinan 250004, China
3
Shandong Electric Power Dispatching and Control Center, Jinan 250001, China
*
Author to whom correspondence should be addressed.
Appl. Sci. 2019, 9(8), 1679; https://doi.org/10.3390/app9081679
Submission received: 19 February 2019 / Revised: 13 April 2019 / Accepted: 18 April 2019 / Published: 23 April 2019
(This article belongs to the Section Energy Science and Technology)

Abstract

:
The collaboration between renewable energy (RE) and an electric vehicles battery switch station (BSS) is a win-win strategy for both. In order to effectively coordinate and manage RE and BSS belonging to different investors, a new cooperative operation mode considering a multi-stakeholder scenario is proposed. By analyzing the relationship of cooperation and competition between them, their pursuit of maximizing their own interests is modeled as a Stackelberg game model. As the leader, the RE company determines the charge/discharge prices to guide the demand response of BSS. As the follower, the BSS optimizes its charge/discharge strategy according to the prices to maximize its own profits. The proposed model no longer requires that the RE company and BSS belong to a same interest subject, and there is no need for unified coordinated control between them. To solve the game equilibrium, a solution combining the backward-induction method and genetic algorithm is proposed by comparing and analyzing the characteristics of the strong and weak Stackelberg equilibriums. Finally, the effectiveness of the proposed model was validated by case studies. The simulation results show that both the RE company and the BSS have the motivation to participate in the game, and that a win-win outcome can be achieved automatically in the process of pursuing their own interest maximization in the game.

1. Introduction

With the rapid development of renewable energy (RE), its uncontrollability and volatility have caused a series of problems to the grid [1,2,3,4]. Cooperation with controllable resources to enhance the controllability of RE has become a consensus [5,6,7]. Although the construction of an energy storage station (ESS) for RE can effectively improve the controllability of RE [8], the investment cost of an ESS limits its large-scale promotion and application. The batteries of electric vehicles (EVs) can be regarded as a large number of cheap energy storage devices which provides a new idea to solve the problem of the high investment cost of conventional ESS. However, the mechanism of unified charge-discharge management for a large number of decentralized EVs is complex and difficult to implement [9].
The battery swapping pattern realizes geographical decoupling between batteries and EVs. As a result, the EV battery switch station (BSS) could achieve multiple benefits with the help of battery to grid (B2G) technology [10]. In addition to providing EV users with battery-swapping services, the BSS can also serve as an ESS or controllable load [11]. Therefore, the cooperation between RE and BSS is feasible and effective. The collaboration could not only benefit the power grid, but also promote the development of the RE industry and EV industry.
In [12], an economic dispatch model of the microgrid including the RE and BSS is established, and the economy of microgrid operation is improved through the cooperative optimization of the RE and BSS. The uncertainty of RE generation and battery-swapping demand is further considered in [13]. A stochastic optimization model of the microgrid including the RE and BSS is established based on the chance-constrained programming. In [14], a multi-objective cooperative optimizing model of the BSS and RE is established by fully considering the randomness. By adjusting the charging and discharging power of the BSS in coordination with the RE, the load fluctuation and network loss is reduced effectively, and the planning penetration of the RE is improved as well. However, these studies need the grid company as a coordinating body to coordinate and control a variety of dispatchable resources. Because of this, these studies are based on the interests of grid companies, while the interests of RE and BSS are not fully considered.
In the interest of the RE and BSS, the integrated mode of them was proposed [15,16,17,18,19]. If built together with a wind turbine (WT) and photovoltaic (PV) generation unit, the BSS can use the RE to charge electric vehicle batteries directly, which can not only cut the charging cost, but also reduce the carbon emissions of electric vehicles. Reference [15] established a collaborative operation pattern, in which the EV batteries are charged by wind and photovoltaic energy in the BSS. The results showed that the collaborative operation pattern can not only promote the local absorption of the RE, but also help to reduce the peak and valley difference of power load in the power system. An energy exchange model of the PV-based BSS was proposed considering the battery swapping service and power distribution in [16]. Liu et al. further researched the charging strategy of the PV-based BSS considering the self-consumption of PV energy in [17]. References [18,19] suggested that wind farms and BSS should be combined into a joint system and operate as an independent enterprise in the power system. With a unified coordinated control of wind farms and BSS, the whole benefit of the joint system is maximized. The simulation results showed that this operation mode can achieve a win-win situation for wind farms and BSS. However, there is a prerequisite for the above research, that is, RE and BSS belong to the same investment subject or they have the will to form a joint system.
With the development of the electricity market reform in China, the investors in the electricity market are becoming more and more diversified and complicated. Generally, the RE and BSS belong to different investors [20], and it is difficult to popularize the operational mode of the joint system mentioned above. Therefore, it is necessary to investigate the coordination between RE and BSS in a multi-stakeholder scenario. In a deregulated electricity market, the RE and BSS in a multi-stakeholder scenario are market signal-oriented and only pay attention to their own interests. Therefore, their generation and consumption are highly subjective, and it is challenging to coordinate and manage them effectively.
In recent years, game theory has been widely used in a power system [21,22,23,24]. Game theory is a theory to study how to optimize the decision-making strategy of each decision-making body which has interest correlation or conflict. This theory provides a new means to solve the cooperative optimization problem among the different investment entities mentioned above.
In this paper, the co-optimization of RE and BSS is studied. The innovation points are as follows. (1) Aiming at the situation that RE and BSS belong to different investment subjects, a cooperation mode is proposed. Different from the previous research, this cooperation mode no longer requires the two partners to belong to the same investment body, so this mode is more feasible in an electricity market where the investors are diversified. (2) Based on game theory, a Stackelberg model is established, in which the RE company is the leader and the BSS is the follower. The model could effectively reflect the co-existence relationship of competition and cooperation between RE and BSS. (3) In the model proposed in this paper, a unified coordinated control for the RE and BSS is no longer needed. In fact, an optimal allocation and a win-win situation could be automatically achieved in the course of the RE’s and BSS’s pursuit of maximizing their own interests respectively.
The organization of this paper is as follows. Section 2 introduces the operation mode of RE and BSS. The proposed Stackelberg game model is described in Section 3. In Section 4 we analyze the two kinds of game equilibrium solutions and propose the corresponding algorithm. Simulation analysis is given in Section 5. Finally, the conclusions are drawn in Section 6.

2. Operation Mode of Renewable Energy (RE) and Battery Switch Station (BSS)

Since the RE and BSS belong to different investors, they focus only on their own interests and operate independently. Their independent operation mode is introduced in Section 2.1. In order to achieve win-win outcomes, a viable cooperation mode is necessary. Therefore, a joint operation mode that does not require unified coordinated control is proposed and analyzed in detail in Section 2.2.

2.1. Independent Operation Mode

As an independent stakeholder, the RE company makes a profit by selling RE to the distribution company. However, the inherently intermittent nature of RE is detrimental to the reliable operation of the distribution company. In order to guide the RE company to adjust its output for each period of time, the distribution company will adopt a time-of-use (TOU) pricing strategy. Cooperating with an ESS or BSS, the RE company can increase its sales revenue by responding to the TOU price set by distribution company.
The BSS is mainly composed of battery system, power conversion system (PCS) and energy management system (EMS). The PCS is bidirectional, which can not only charge the batteries, but also discharge energy stored in the batteries back to the power grid. The EMS is the “brain” of the BSS, which optimizes and manages the charge/discharge strategy of the BSS intelligently. The BSS charges a fee by providing a battery swapping service for EV users. When the EV battery is insufficient to provide the energy required for the next trip, the EV user will replaces the empty battery with a fully charged one in the BSS. The empty battery will be placed in the storage room of BSS and be recharged to be available for other EVs. Considering the coal-based primary energy structure in China, if the BSS charges the batteries by the energy from the power grid, the indirect carbon emissions of EVs are no lower than those of fuel vehicles. Cooperating with the RE company, the BSS could uses RE to charge EVs battery, which will truly achieve the zero carbon emissions of EVs. Besides, the BSS could make a profit by providing a reserve for the RE company through the unified charge/discharge control of batteries.

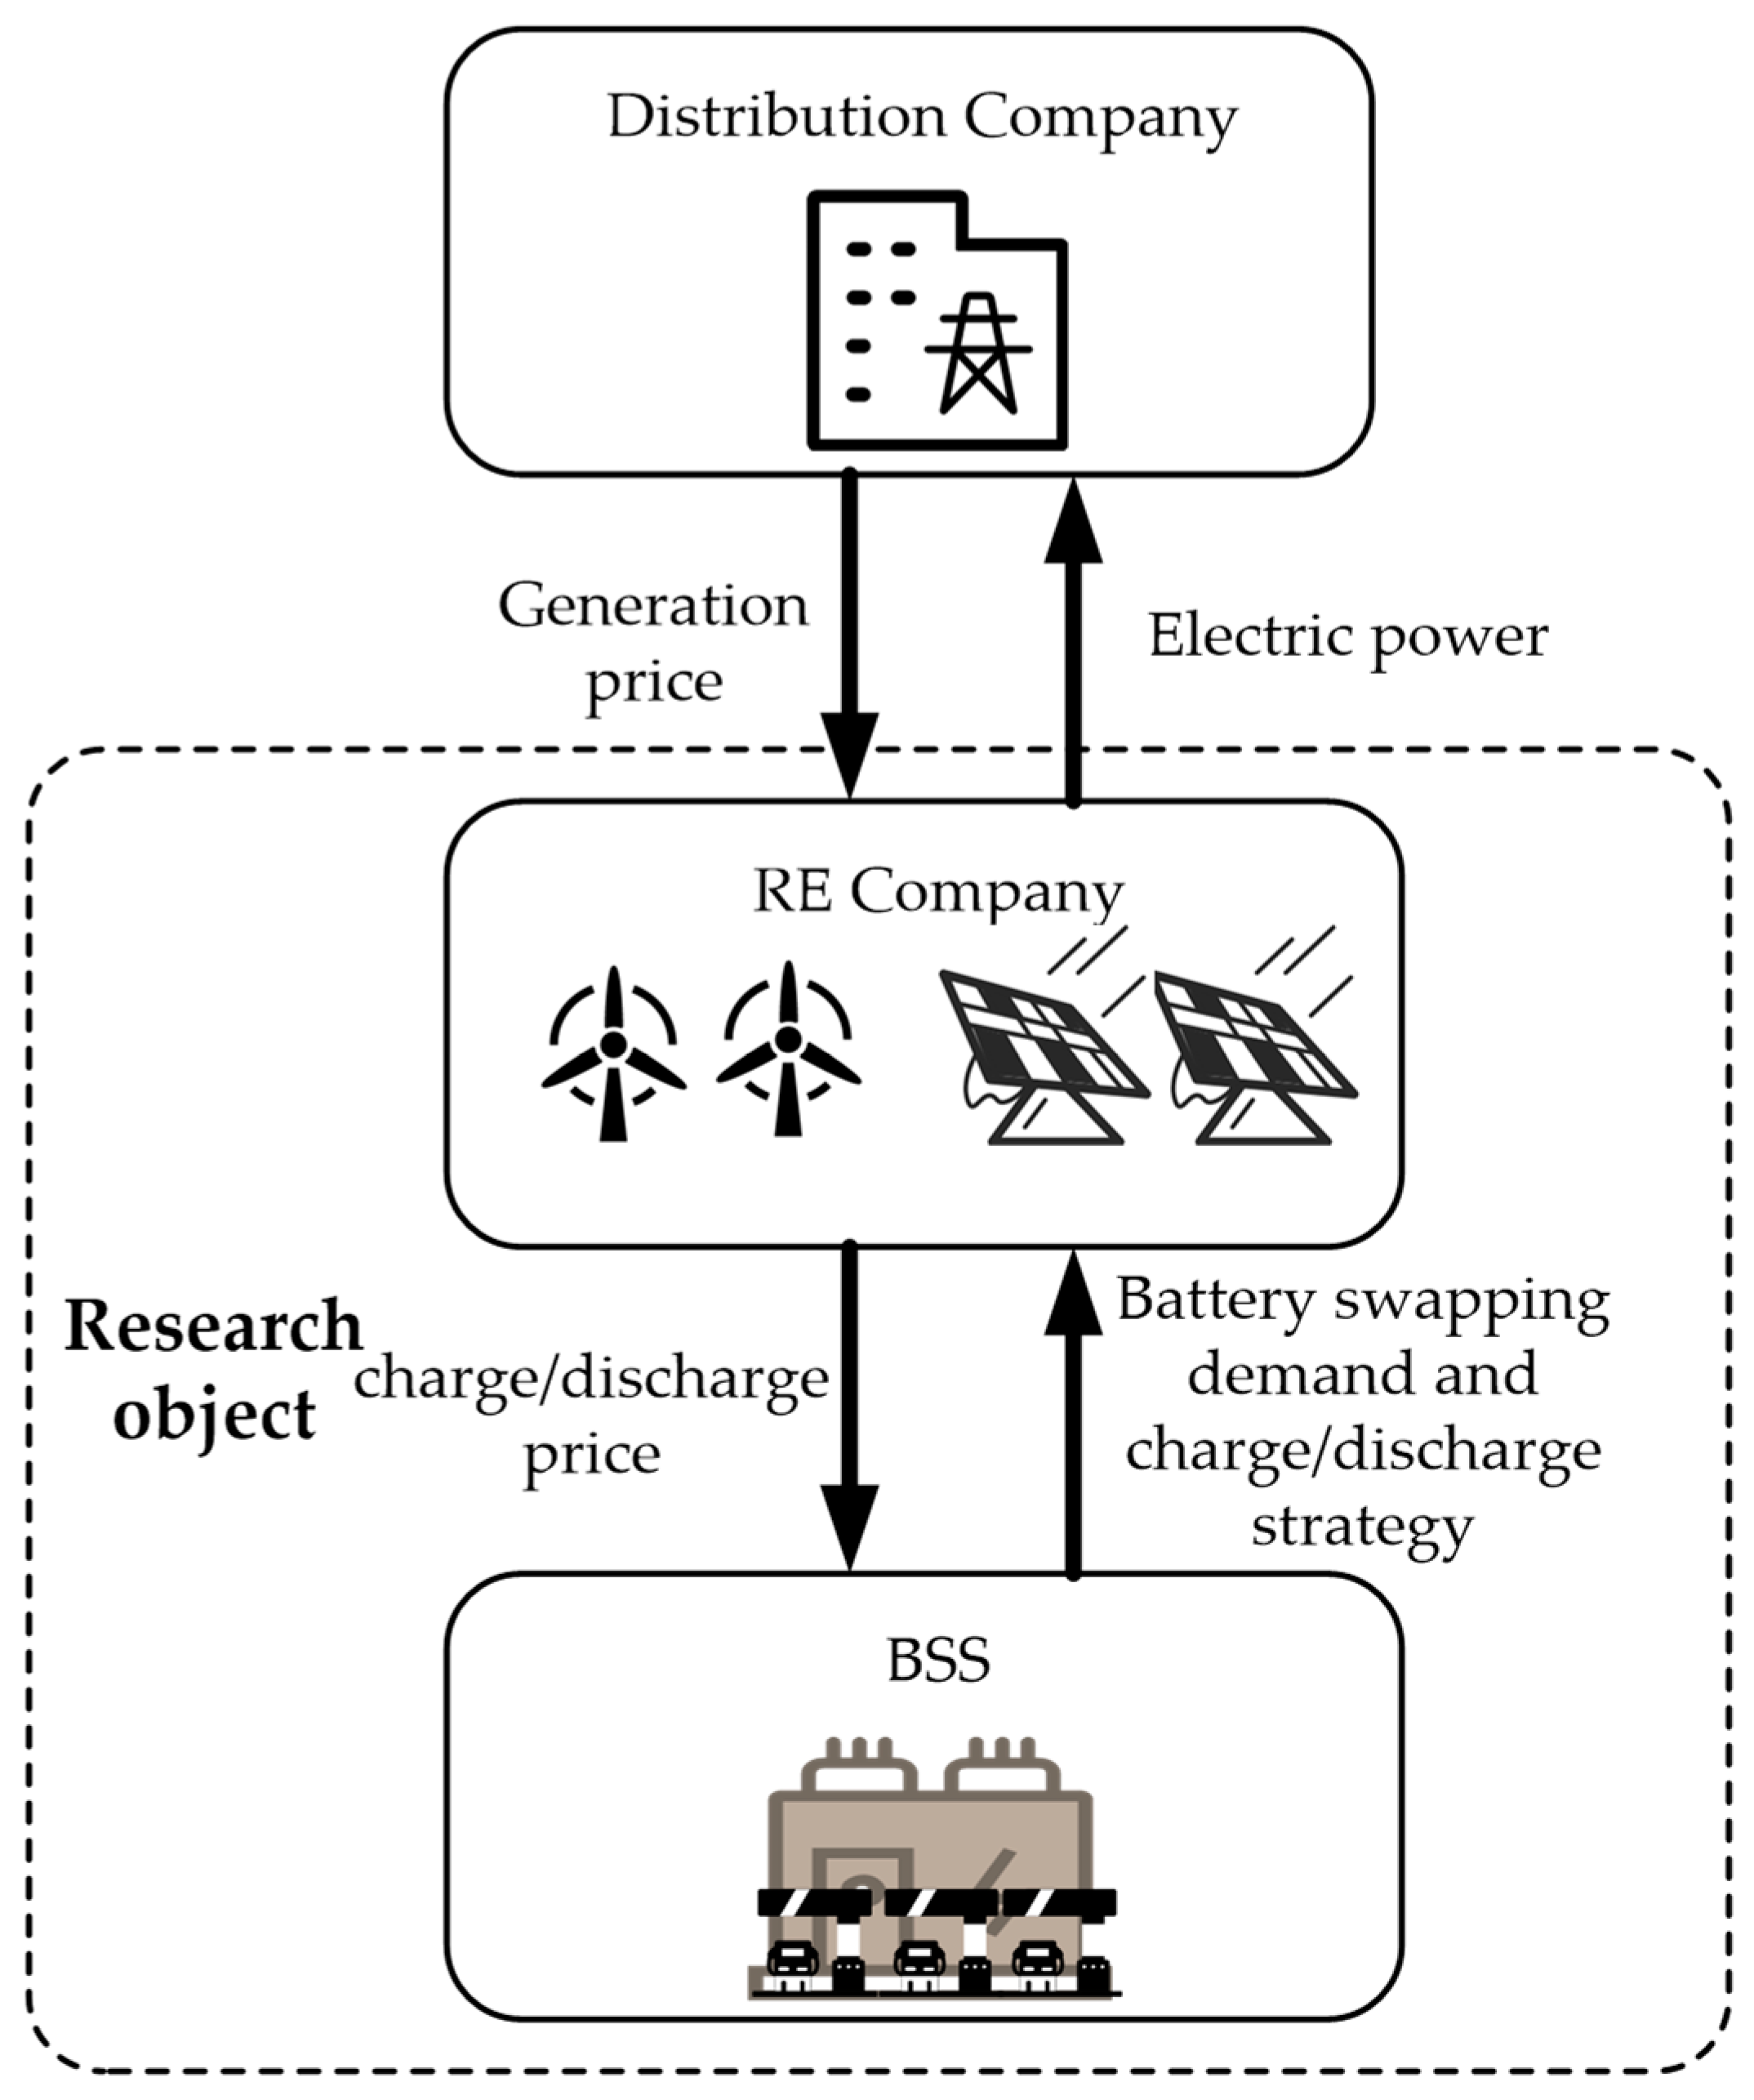
2.2. Joint Operation Mode

The RE company would aggregate distributed wind power, photovoltaic and other RE resources in its jurisdiction. The RE is divided into two parts according to the purpose. One part of the RE is sold to the distribution company at a purchase price determined by the distribution company. In order to guide the RE’s output in each period, the distribution company adopts the TOU pricing strategy. The RE company will try to increase revenue by selling electricity to the distribution company during the high-price periods. The other part of the RE is sold to BSS to charge the batteries at the charging price determined by the RE company. In order to take advantage of the BSS’s energy storage capabilities, the BSS is allowed to sell the electricity stored in the batteries back to the RE company for a profit, and the discharging price is also determined by the RE company. Therefore, the energy flows between the RE company and the BSS in both directions. In order to guide the charging and discharging behavior of the BSS reasonably, the TOU pricing strategy is adopted by the RE company to determine the charging price and the discharging price. To facilitate the subsequent analysis, we assume that the charging price and discharging price are the same during a same time period, which are collectively referred to as charge/discharge prices. The operating mode of the system is shown in Figure 1.
Since the RE company and BSS belong to different investors, there is no subordinate relationship between them. Although the RE company has no right to directly control the charging and discharging behavior of the BSS, it can indirectly affect the charging and discharging decision of the BSS by adjusting the charge/discharge prices. After obtaining the next day’s RE purchase prices for each period of time decided by the distribution company, the RE company will set the charge/discharge price for each period of the next day accordingly. On the one hand, it could guide the BSS to operate as a controllable load to promote the consumption of RE. On the other hand, the BSS would be regarded as a special ESS, which is allowed to discharge in reverse in order to increase the electricity sales revenue of the RE company by load shifting.
The BSS will set the charge/discharge schedule according to the battery swapping demand after the charge/discharge price is decided by the RE company. The BSS could maximizes its revenue in the following ways: On the one hand, BSS will charge the batteries at low-price periods to satisfy the battery swapping demand with the charging cost as low as possible; on the other hand, the BSS will store some RE at the low-price period and sell it back to the RE company at the high-price period, using the difference between the charge/discharge prices at different times to make a profit. In order to realize the zero carbon emission of EVs, BSS signs a cooperation agreement with the RE company that BSS could only charge the batteries by RE.
Under the framework of this cooperation, the distribution company does not obtain economic benefits through direct participation in cooperation. In fact, its benefits lie in the increased controllability of RE generation through the collaboration of the RE company and BSS. Since the distribution company could indirectly adjust the output power of RE by setting the RE purchase price, the impact of randomness and uncontrollable characteristics of RE on the grid could be reduced.

3. Mathematical Modeling

There is an obvious hierarchical relationship between the RE company and BSS, which can be described as a Stackelberg game model. At first, since they are independent stakeholders, we model the strategy-decision problem of the RE company and BSS respectively. Then, taking advantage of the hierarchical relationship between the two sub-problems, the cooperation mechanism between the RE company and BSS is formulated as a Stackelberg game model.

3.1. Leader (RE Company) Model

In order to maximize its own revenue, the RE company guide the charging and discharging power of the BSS by optimizing the charge/discharge prices. The RE company’s revenue is expressed as Equation (1) below:
t = 1 N t ( P RE t P c t + P d t ) ρ RE t Δ t + t = 1 N t P c t ρ t Δ t t = 1 N t P d t ρ t Δ t
where Nt refers to the number of time frames partitioned, Δt is the length of a single time interval, P RE t is the active power output of RE at time t, ρt is the charge/discharge price that BSS buys/sells energy from/to the RE company at time t, ρ RE t is the price at which the distribution company purchases energy from the RE company at time t, P c t and P d t denotes the charging and discharging power of BSS, respectively.
Equation (1) consists of three parts: the first part is the income from the sale of electricity to the distribution company, the second part is the income from the sale of electricity to BSS, and the third part is the cost of purchasing electricity from the BSS. Under the condition that ρ RE t decided by the distribution company and the forecast value of renewable energy are known, the income from the sale of this part of the electricity is fixed. Therefore, the payoff function of the RE company can be expressed as Equation (2).
max t = 1 N t ( P c t P d t ) ρ t Δ t t = 1 N t ( P c t P d t ) ρ RE t Δ t
The strategy space is defined by the following constraints:
(1) Charge/discharge price constraint
ρ min t ρ t ρ max t
where ρ max t and ρ min t is the upper and lower limit of ρt, respectively.
(2) Average charge/discharge price constraint
1 N t t = 1 N t ρ t ρ ¯
In order to restrain the market power of the RE company, the average charge/discharge price constraint is introduced. The upper limit of the average charge/discharge price ρ ¯ is set to protect the benefits of BSS. When the RE company raises the charge/discharge price of some time periods, it needs to reduce the prices of others, and uses the price differences in different time periods to guide the charging and discharging behavior of BSS.

3.2. Follower (BSS) Model

After obtaining the charge/discharge price decided by the RE company, the BSS will optimize the charging and discharging power based on the battery-swapping demand in order to maximize its own benefit. The revenue of BSS is shown in Equation (5).
t = 1 N t s W t + t = 1 N t P d t ρ t Δ t t = 1 N t P c t ρ t Δ t
where Wt is the battery swapping demand at time t, and s is the unit price of battery swapping service charged by the BSS from EV users, and it is a fixed value decided by BSS. Equation (5) consists of three parts: the first part is the income of the battery-swapping service, charging from the EV users, the second part is the income from the sale of electricity to the RE company, and the third part is the cost of purchasing electricity from the RE company to charge the batteries. When the battery swapping demand is known, the income of the battery swapping service is fixed, so the payoff function of the BSS can be expressed as Equation (6).
max t = 1 N t ( P d t P c t ) ρ t Δ t
The decision variable is the charging and discharging power in each period of the next day. The strategy space is defined by the following constraints:
(1) Charge/discharge power constraint
0 P c t P cmax t
0 P d t P dmax t
where P cmax t and P dmax t is the upper limit of charging and discharging power of BSS, respectively, which is constrained by the rated power of the PCS in BSS.
(2) Capacity constraint of the batteries in BSS
Q t Q max
Q t = Q 0 + i = 1 t ( P c i η c Δ t P d i Δ t / η d W i )
where Qt is the energy storage of BSS at time t, Qmax is the rated capacity of BSS, Q0 is the initial energy storage of BSS, ηc and ηd denotes the efficiency of charging and discharging, respectively.
The battery-swapping demand of EVs is expressed in the form of quantity of electricity, that is, the number of batteries switched by EV users in each period multiplied by the capacity of a single battery. In order to simplify the model, we assume that the battery specifications in BSS are the same and that the charging and discharging strategies of a single battery can meet its limitations of battery capacity. Thus the iterative formula of the overall residual energy of BSS is similar to that of ESS, as shown in Equation (10). We only consider the overall energy optimization of BSS in this paper. When the overall charge/discharge strategy of BSS is given, the specific charge/discharge control of a single battery belongs to the internal energy management problem of BSS, which is not involved in this paper.
(3) BSS energy storage constraint at the end of a decision-making cycle
Q N t Q end
where Qend refers to the minimum energy storage of the BSS required at the end of the decision-making cycle. Without prejudice to the battery swapping services at the next decision-making cycle, Qend is usually equal to Q0.
(4) Battery swapping demand reserve constraint
Q t Q min + ( 1 + α ) W t + 1
where Qmin is the minimum energy stored in the BSS. In order to prevent battery life shortening from over discharge, 10%–30% of Qmax is usually taken as Qmin. Considering the uncertainty of battery-swapping demand, it is necessary to prepare a certain amount of fully charged batteries as reserve. Consequently, the reserve ratio α is introduced.
(5) Zero emission constraint over EVs
P c t P RE t
According to the contract between BSS and the RE company, BSS can only charge the battery by the power from renewable energy in order to realize zero emissions of EVs.

3.3. Stackelberg Game Model

Stackelberg game, also known as master-slave game, is a non-cooperative dynamic game, and the status of the players is different. One is the leader, who makes the decision first, and the other is the follower, who needs to make the optimal response to the leader’s decision. The optimal response strategy of the follower is predictable to the leader, therefore, the leader will consider the possible response of the follower and make the decision which is most beneficial to his own interests. The cooperative relationship between RE company and BSS described in the previous section constitutes a typical Stackelberg game.
The RE company and BSS cannot directly control each other’s decisions, but can indirectly affect the other party’s payoff through their own strategies and ultimately affect each other’s strategy. For example, on the one hand, the RE company sets charge/discharge price to guide the charging and discharging behavior of the BSS, on the other hand, the charging and discharging strategies of the BSS can affect the revenue of the RE company, and that will prompt RE company to adjust his charge/discharge price accordingly. Therefore, the pursuit of maximizing their respective interests can be modeled as a Stackelberg game model.
The RE company and BSS do not make the decision at the same time. In fact, the RE company, as the leader, sets the charge/discharge price first, and its payoff function is to maximize its own benefits. In order to maximize its own revenue, as the follower, the strategy of BSS is to optimize the charging and discharging power according to the charge/discharge price set by the RE company. In addition, since the RE company can predict the possible optimal response strategy of BSS, the strategy of the RE company will be revised dynamically accordingly to maximize its own payoff.
According to the above analysis, the Stackelberg game model of the RE company and BSS can be modeled as Equation (14).
Leader { max t = 1 N t ( P c t P d t ) ρ t Δ t t = 1 N t ( P c t P d t ) ρ RE t Δ t s . t .   ( 3 ) ~ ( 4 ) Follower { { P c t , P d t } arg max t = 1 N t ( P d t P c t ) ρ t Δ t s . t .   ( 7 ) ~ ( 13 )
As can be seen from Equation (14), the follower’s game model acts as a constraint of the leader’s game model.

4. Stackelberg Equilibrium

Stackelberg equilibrium is a refinement of Nash equilibrium, which belongs to a kind of sub-game perfect equilibrium [25]. For the same strategy of the leader, the follower may have more than one optimal response strategy, that is to say, the follower’s payoff is the same under different strategies. However, the payoff is different for the leader. In [26], Leitmann extends the Stackelberg equilibrium and proposed the concept of generalized Stackelberg equilibrium, which can guarantee the leader’s minimum profit. On this basis, Berton et al. divided Stackelberg equilibrium into strong Stackelberg equilibrium and weak Stackelberg equilibrium according to the different preference of the follower strategy [27]. When the follower has multiple optimal response strategies, in the strong Stackelberg equilibrium, the follower will choose the strategy that is most favorable to the leader; and in the weak Stackelberg equilibrium, the follower will choose the strategy that is the most unfavorable to the leader.
At the strong Stackelberg equilibrium point, if the BSS refuses to choose the strategy most favorable to the RE company, then the payoff of the RE company will be reduced. In other words, the strategy at the strong Stackelberg equilibrium is an optimistic decision for the RE company, because there is a risk of less than its expected payoff. It should be noted that in the Stackelberg game model proposed in this paper, the RE company and BSS belong to different stakeholders, and there is no subordinate relationship between them. Although the RE company is in the leading status in the game, he cannot directly control the behavior of the BSS. As a rational decision-maker, the BSS has no incentive to choose the strategy which is more favorable to the RE company when BSS’s payoff is the same under a variety of strategies. In order to guarantee the RE company’s minimum revenue, the weak Stackelberg equilibrium is more suitable to the game model in this paper.
At present, the common methods to solve Stackelberg equilibrium include KKT conditions method [28], penalty function method [29], intelligent algorithm [30] and so on.
In the strong Stackelberg equilibrium, when BSS has multiple optimal response strategies, it will choose the strategy that is most favorable to the RE company. In other words, the BSS and the RE company have the same optimization goal. As a result, the bi-level programming model can be converted to a single layer programming model to be solved directly. However, for the weak Stackelberg equilibrium solution, the BSS will choose the strategy that is most unfavorable to the RE company. In this case, the above method is no longer applicable. In this paper, an intelligent algorithm based on the backward induction method is used to solve the weak Stackelberg equilibrium.
The backward induction method starts from the last stage of a dynamic game, and gradually deduces the optimal strategy of the decision-makers in each stage.
In the last game stage, for a given charge/discharge price strategy { π t , t = 1 , 2 , , N t } of RE company, the follower’s model is a linear programming model, and the optimal strategy of BSS and its maximum payoff fBSS can be obtained by solving the model. fBSS can be expressed as Equation (15):
t = 1 N t ( P d t P c t )   ρ t Δ t = f BSS
Adding Equation (15) as an equality constraint, a new BSS model is proposed, which is expressed as Equation (16). In this model, BSS could minimize the RE company’s payoff while ensuring that its own payoff remain the same.
min t = 1 N t ( P c t P d t ) ρ t Δ t t = 1 N t ( P c t P d t ) ρ RE t Δ t s . t .   Equations   ( 7 ) ~ ( 13 ) , ( 15 )
The Equation (16) is a linear programming model, which can be solved by CPLEX to obtain the optimal strategy of BSS { P c t , P d t , t = 1 , 2 , , N t } . Furthermore, the RE company’s revenue can be calculated by Equation (1). The backward induction method can be solved by genetic algorithm, where its objective function is maximizing the revenue of the RE company and the decision variables are the charge/discharge price in different time periods.

5. Simulation Analysis

A test system is developed in this section. The test system is composed of the RE company and BSS. The RE company owns one wind farm and one photovoltaic power station with installed capacities of 49.5 MW and 20 MW, respectively. The rated capacity of battery system in the BSS is 55 MWh. The BSS entered into a contract with the RE company that BSS could only charge the batteries through RE company. At the same time, BSS is allowed to sell the energy stored in battery system back to the RE company.

5.1. Simulation Parameter Setting

According to the data of an actual BSS in Shandong Province, the parameters of BSS are set as Table 1. The BSS provides battery-swapping services for 280 electric buses. The cumulative capacity of batteries actually switched by these 280 electric buses in each period of a certain day is selected as the forecast value of battery swapping demand, as shown in Figure 2.
The predicted power of the RE company are taken from the actual output of a wind farm and a photovoltaic power station in Shandong Province, as shown in Figure 3.
The decisions are taken at the end of the day for each of the 24 h of the following day. Therefore, Nt is 24, and Δt is 1 h. The distribution company purchase price of RE is known, and the TOU price was adopted as shown in Figure 4. The division of peak and valley periods draws lessons from the division method of industrial electricity consumption price in Shandong Province. The price of wind power in Shandong Province is about 600 ¥/MWh. Therefore, we set the purchase price in the normal period as 600 ¥/MWh. The price in peak period is 1.5 times the one in normal period, and the price in valley period is half the one in normal period.
The upper limit of charge/discharge price shall be 1.5 times the RE purchase price of the distribution company, and the lower limit shall be 50% of the electricity purchase price of the distribution company. If the BSS directly charging the battery from the distribution company, the contract price ρDC is 720 ¥/MWh. In order to ensure the cooperative motivation of BSS, the average charge/discharge price ρ ¯ is the same as ρDC.

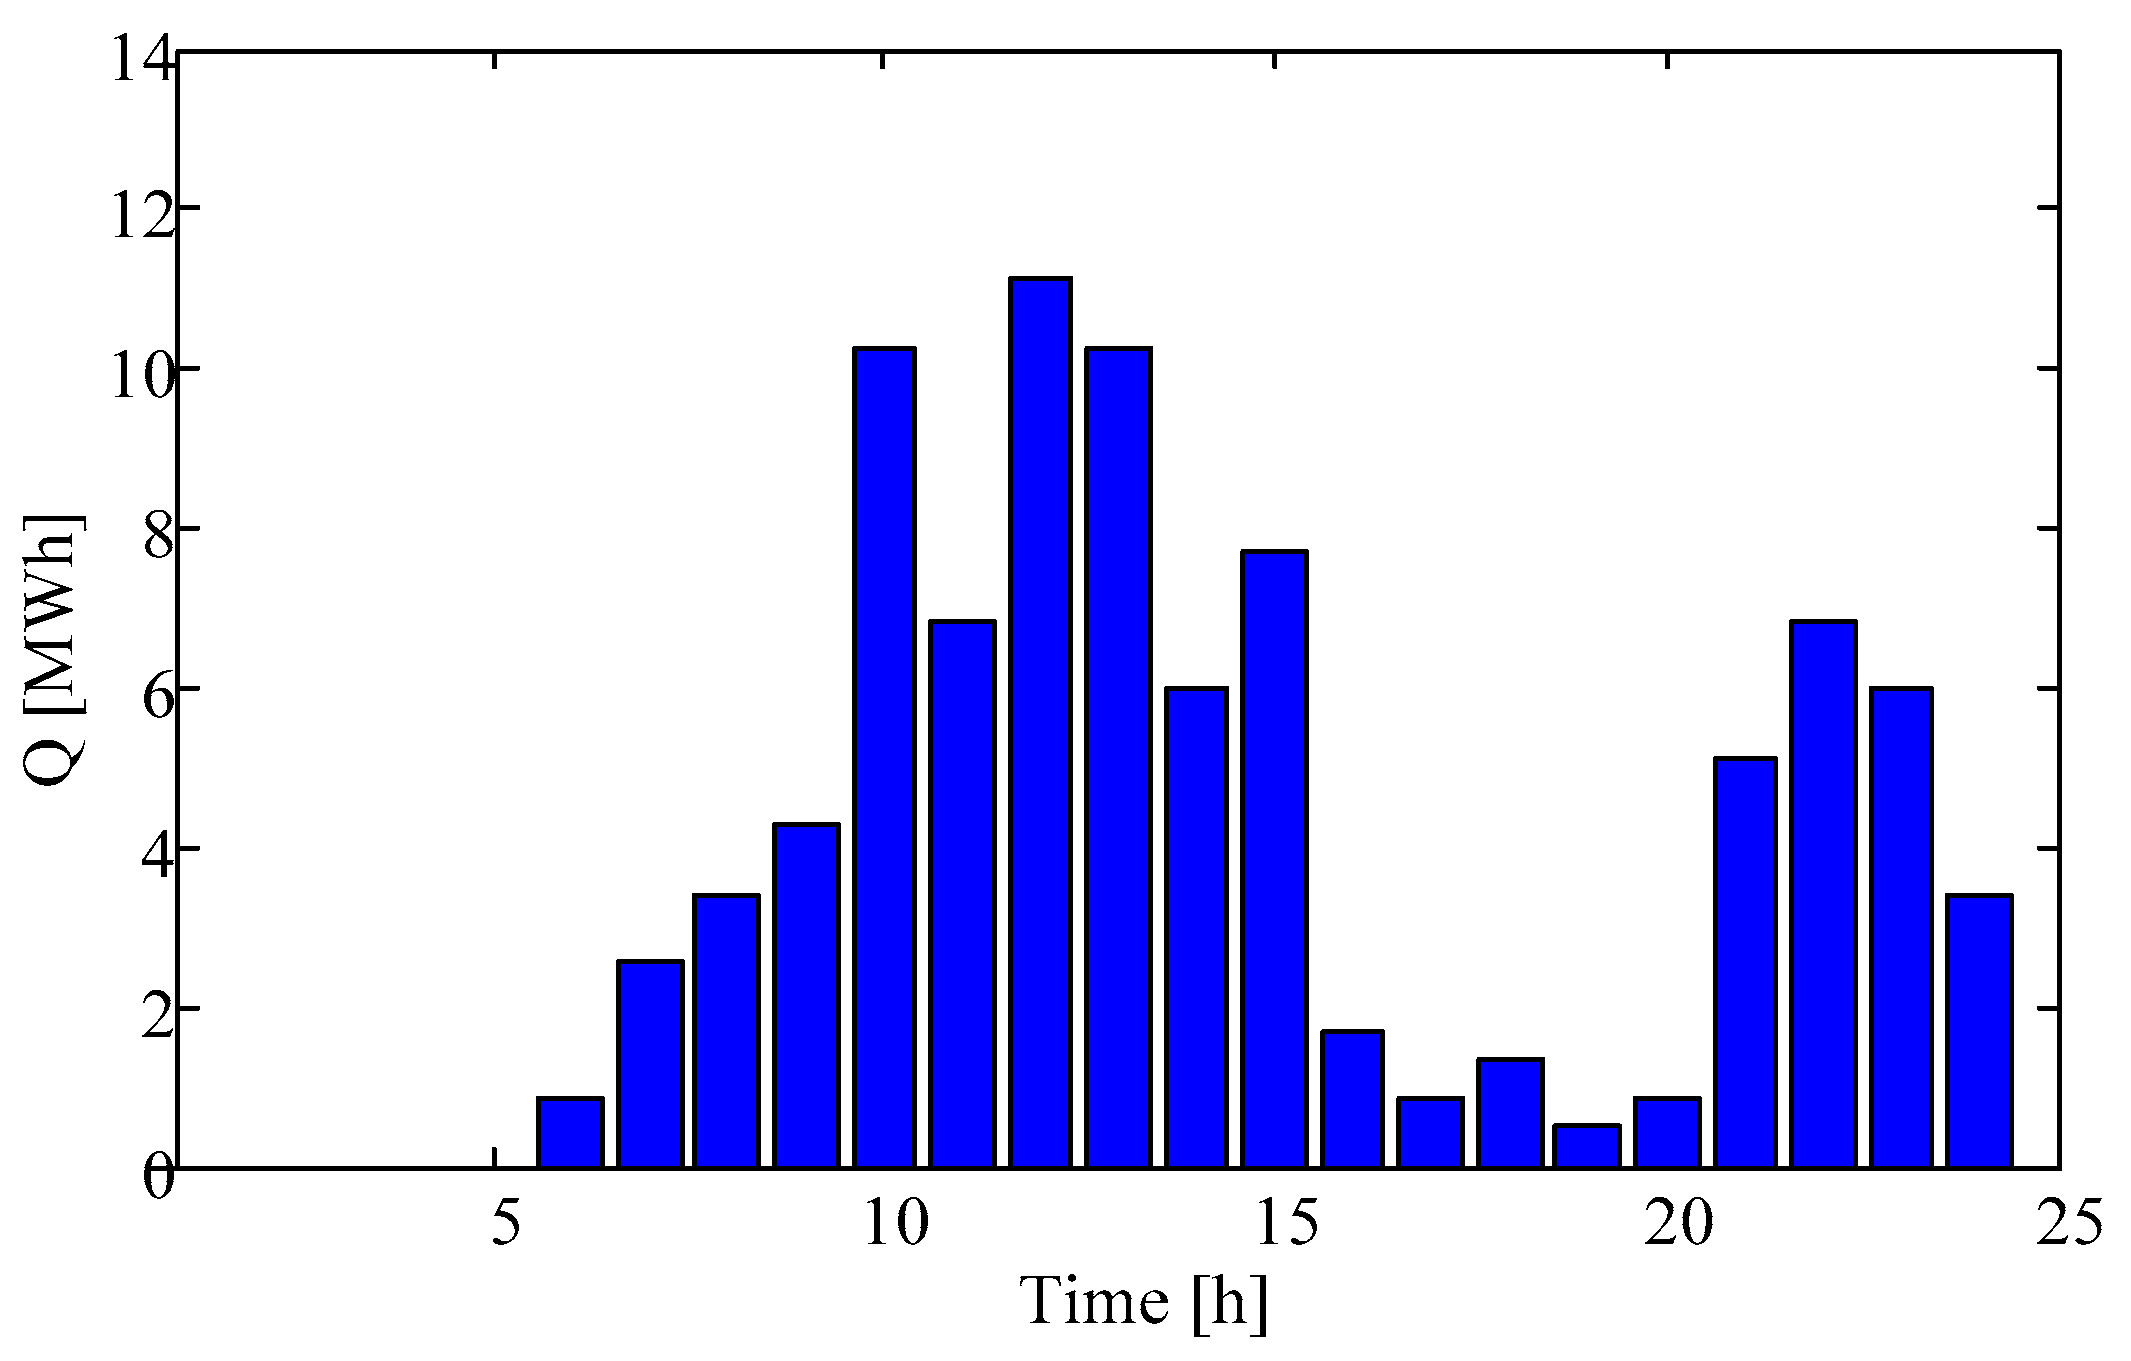
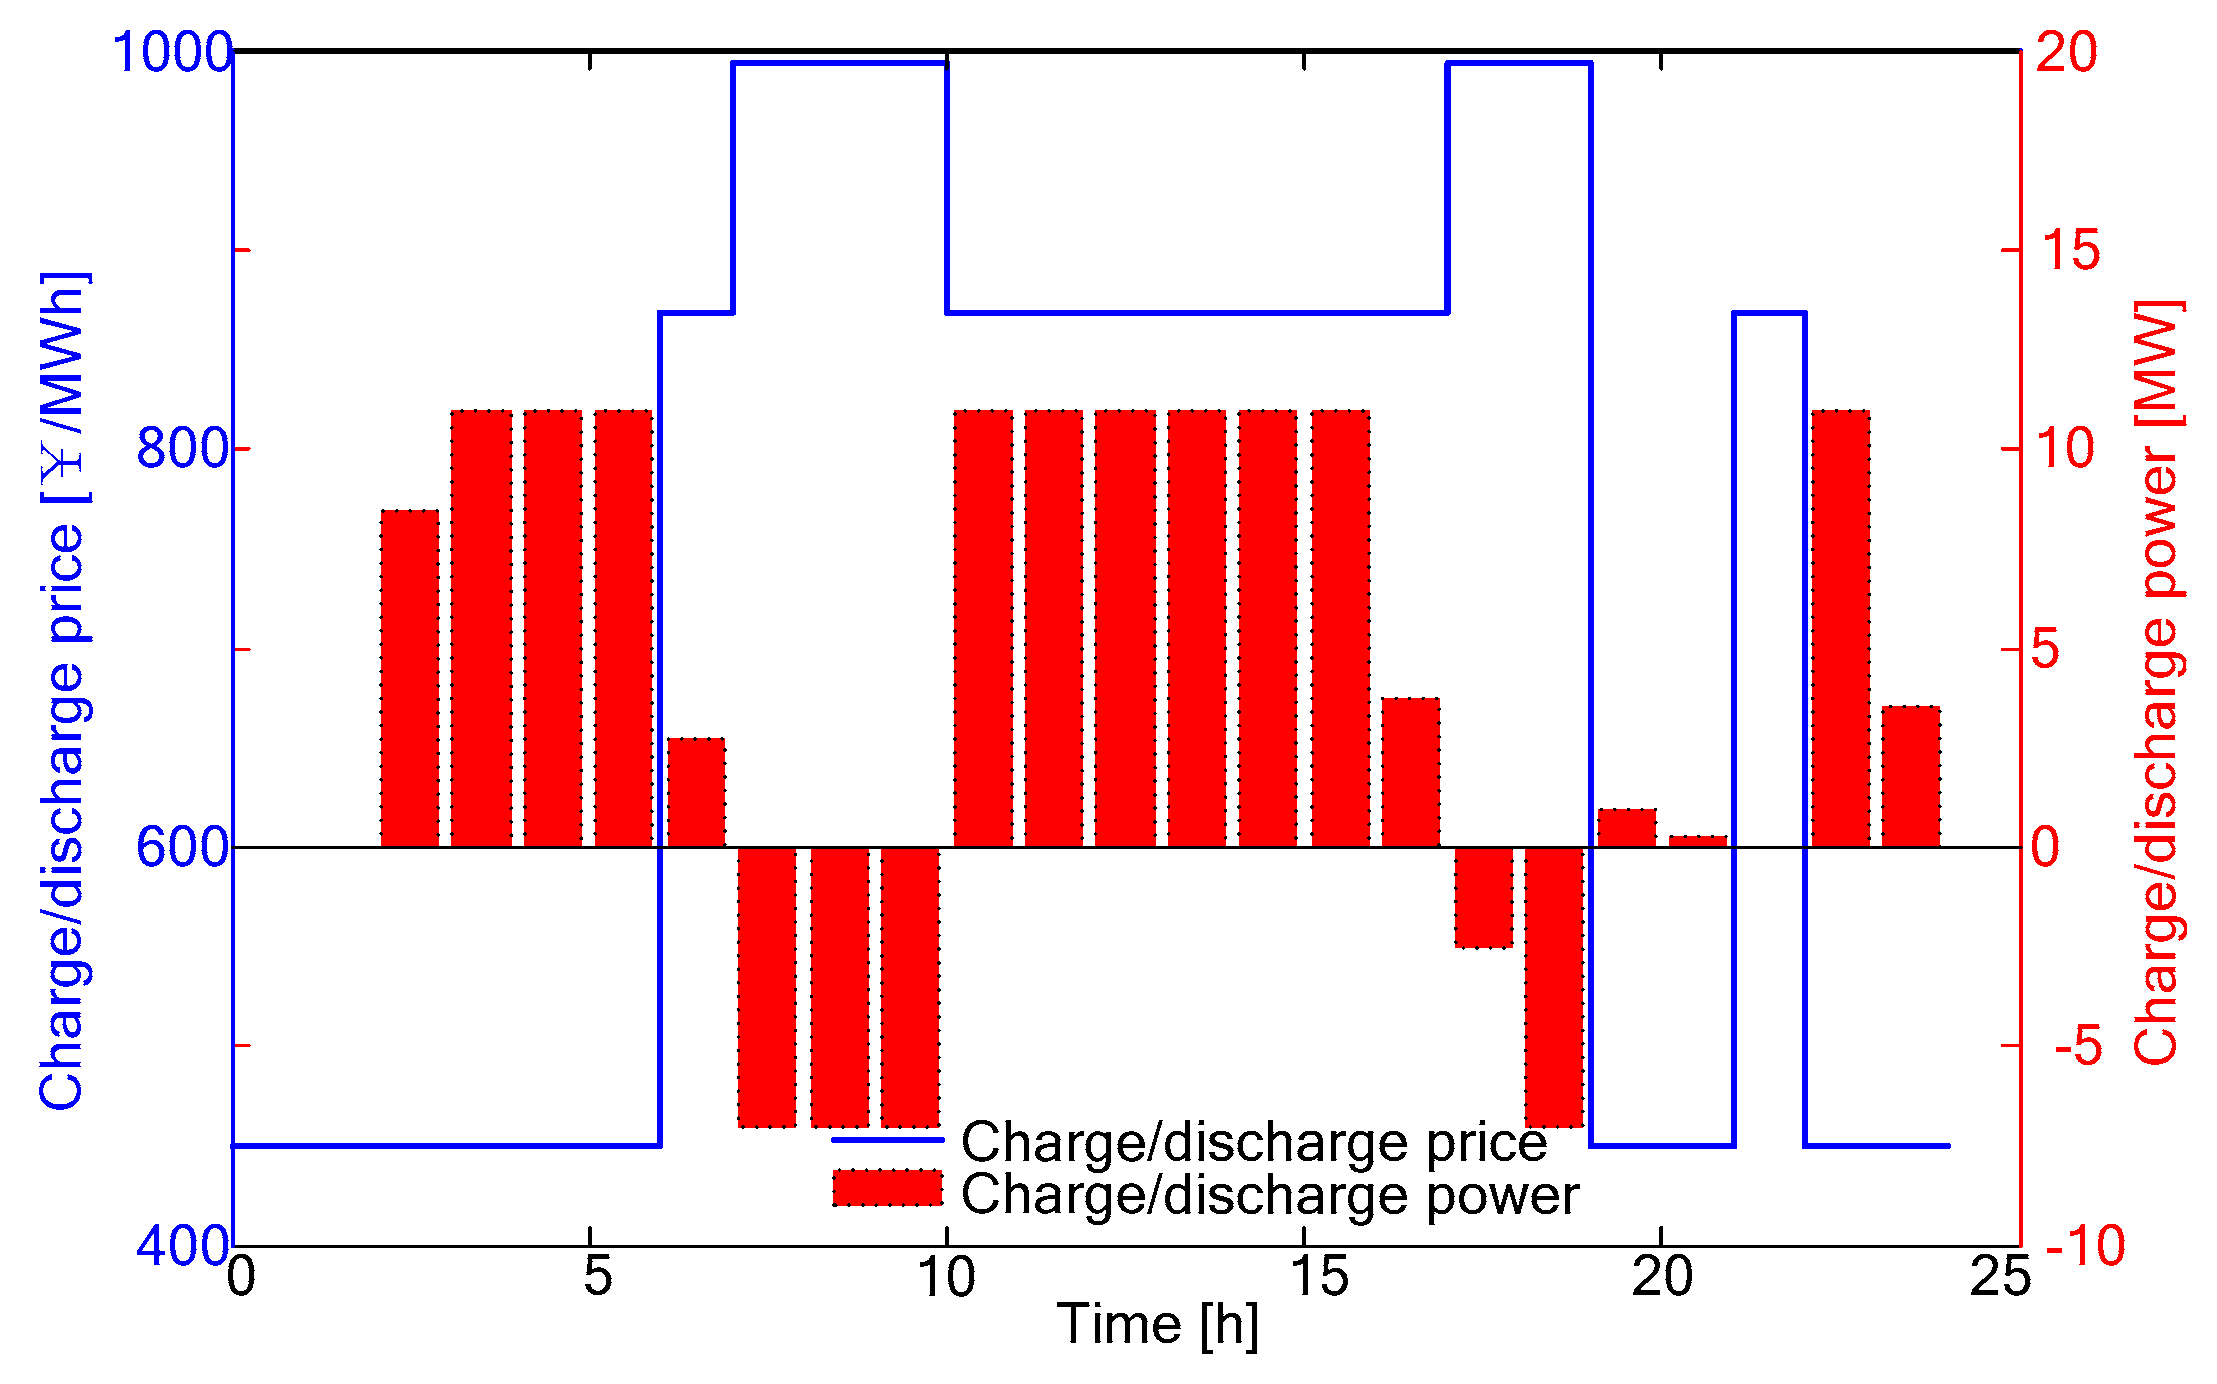
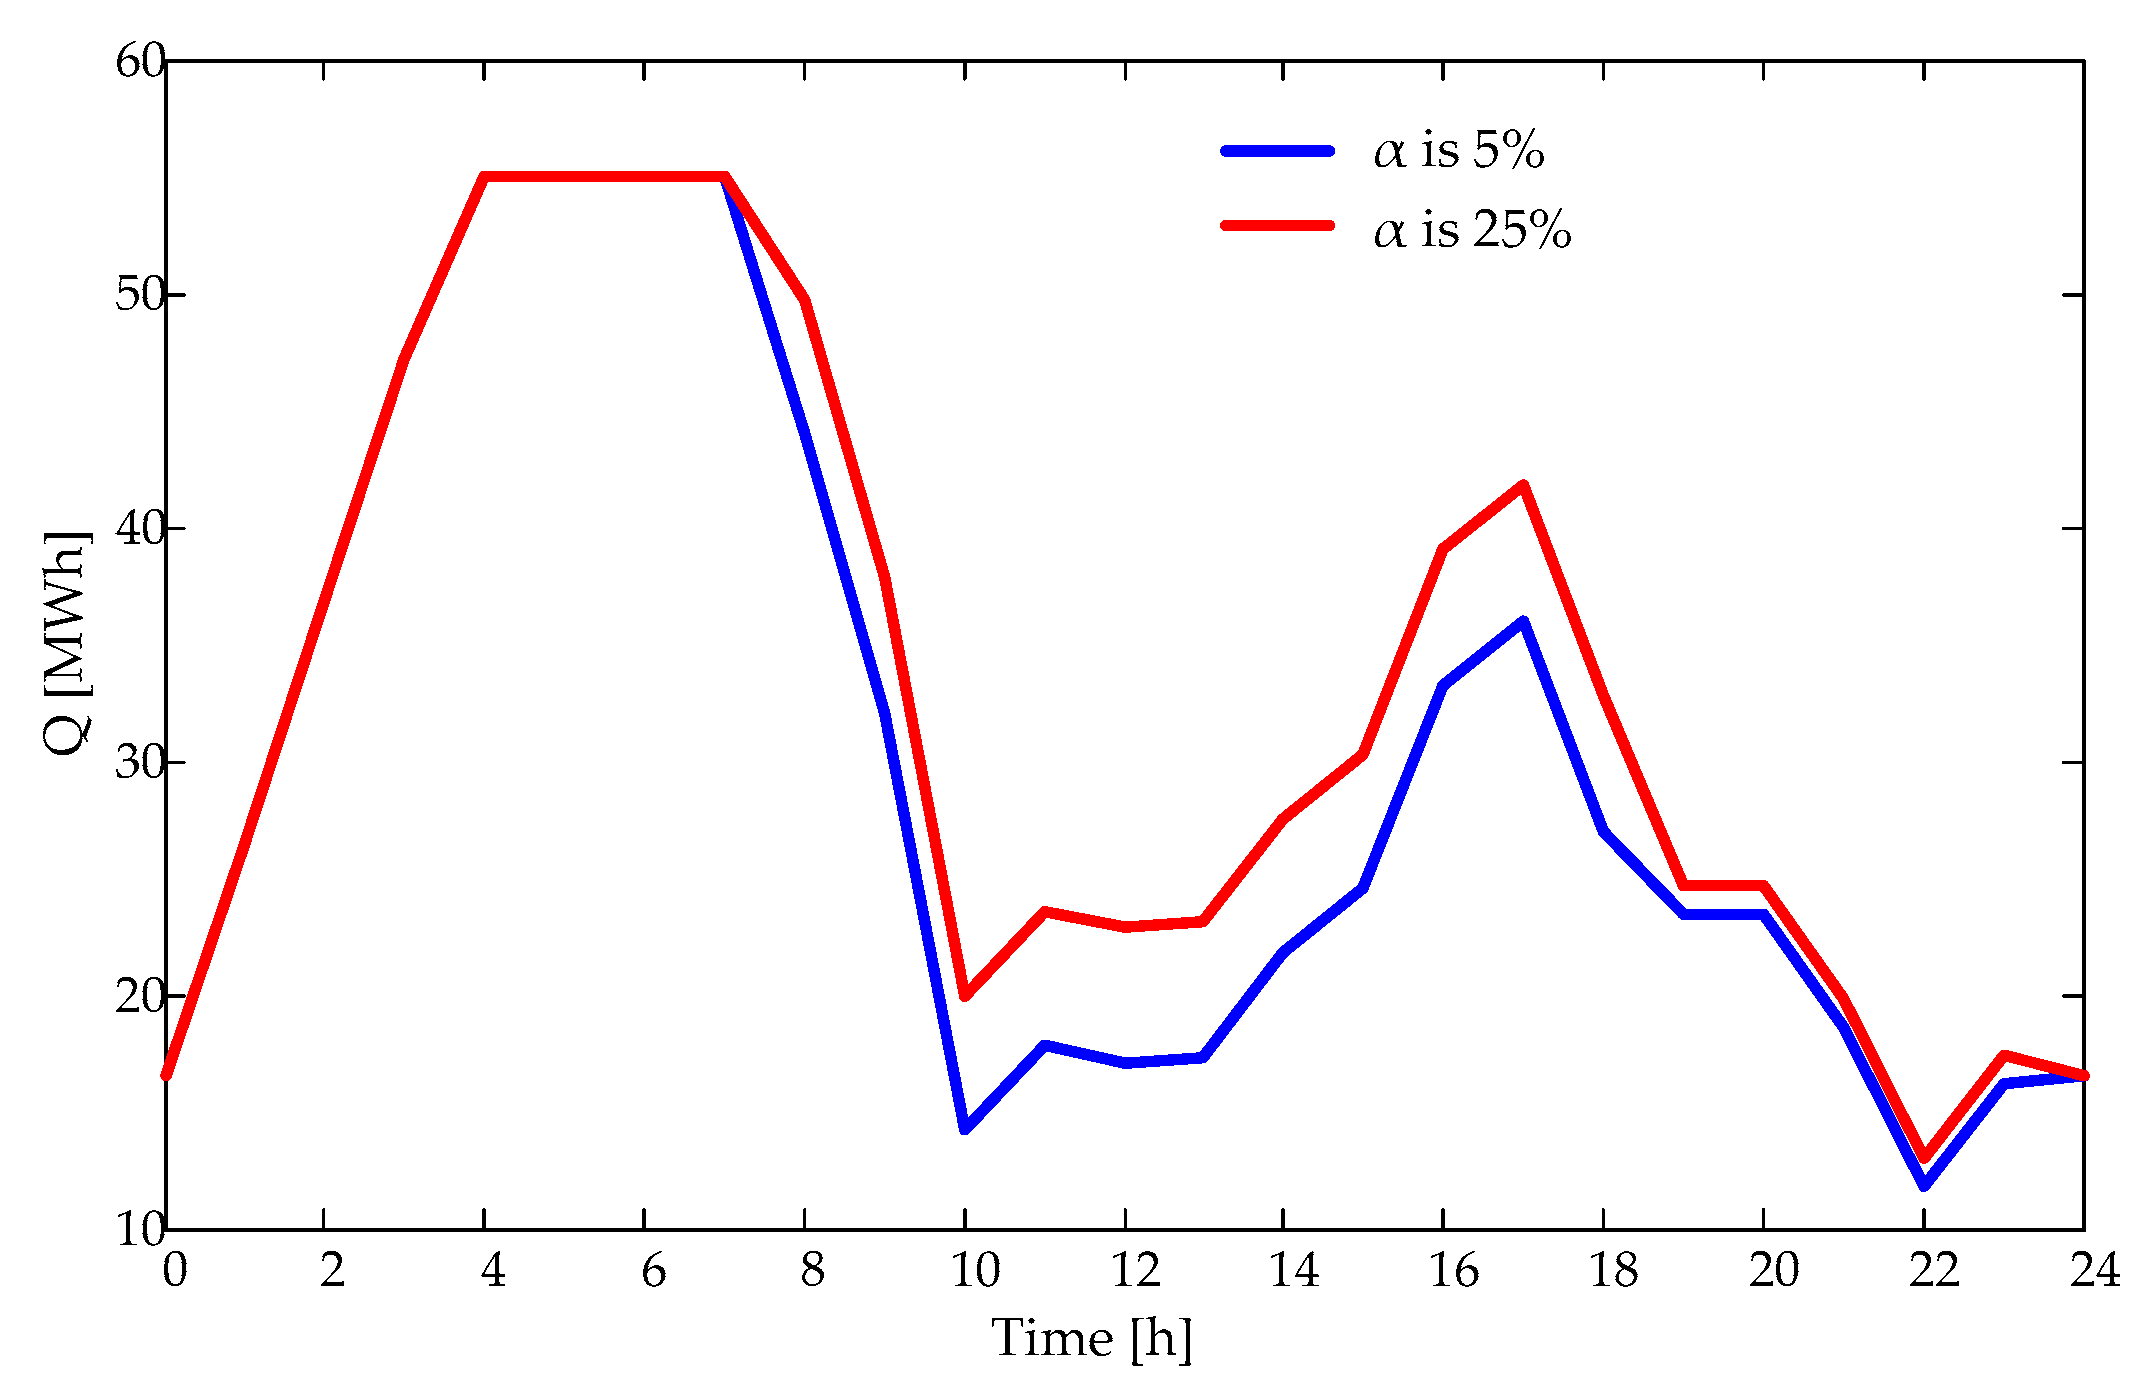
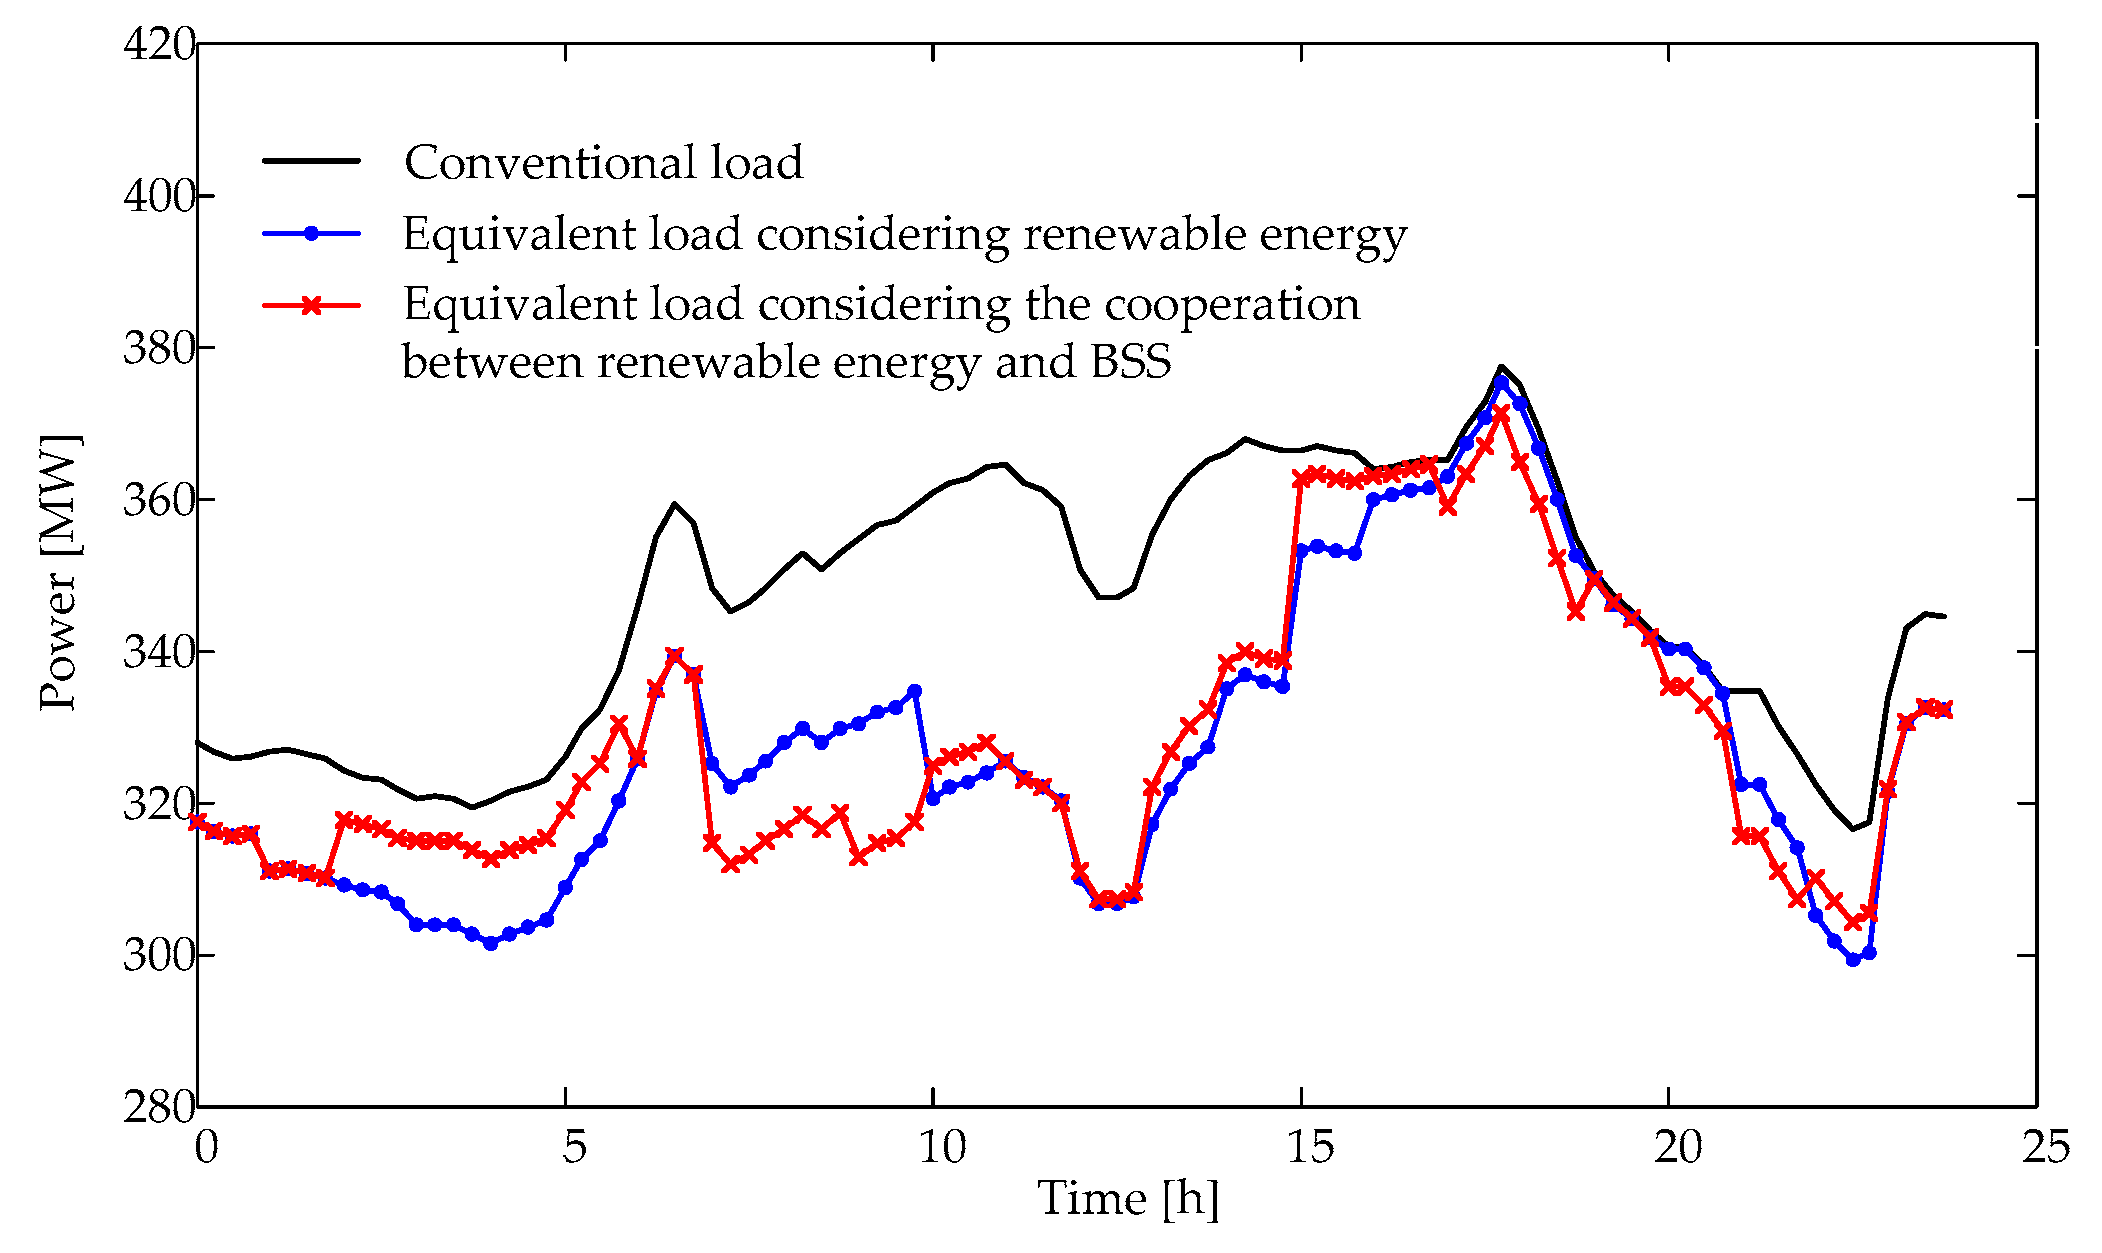
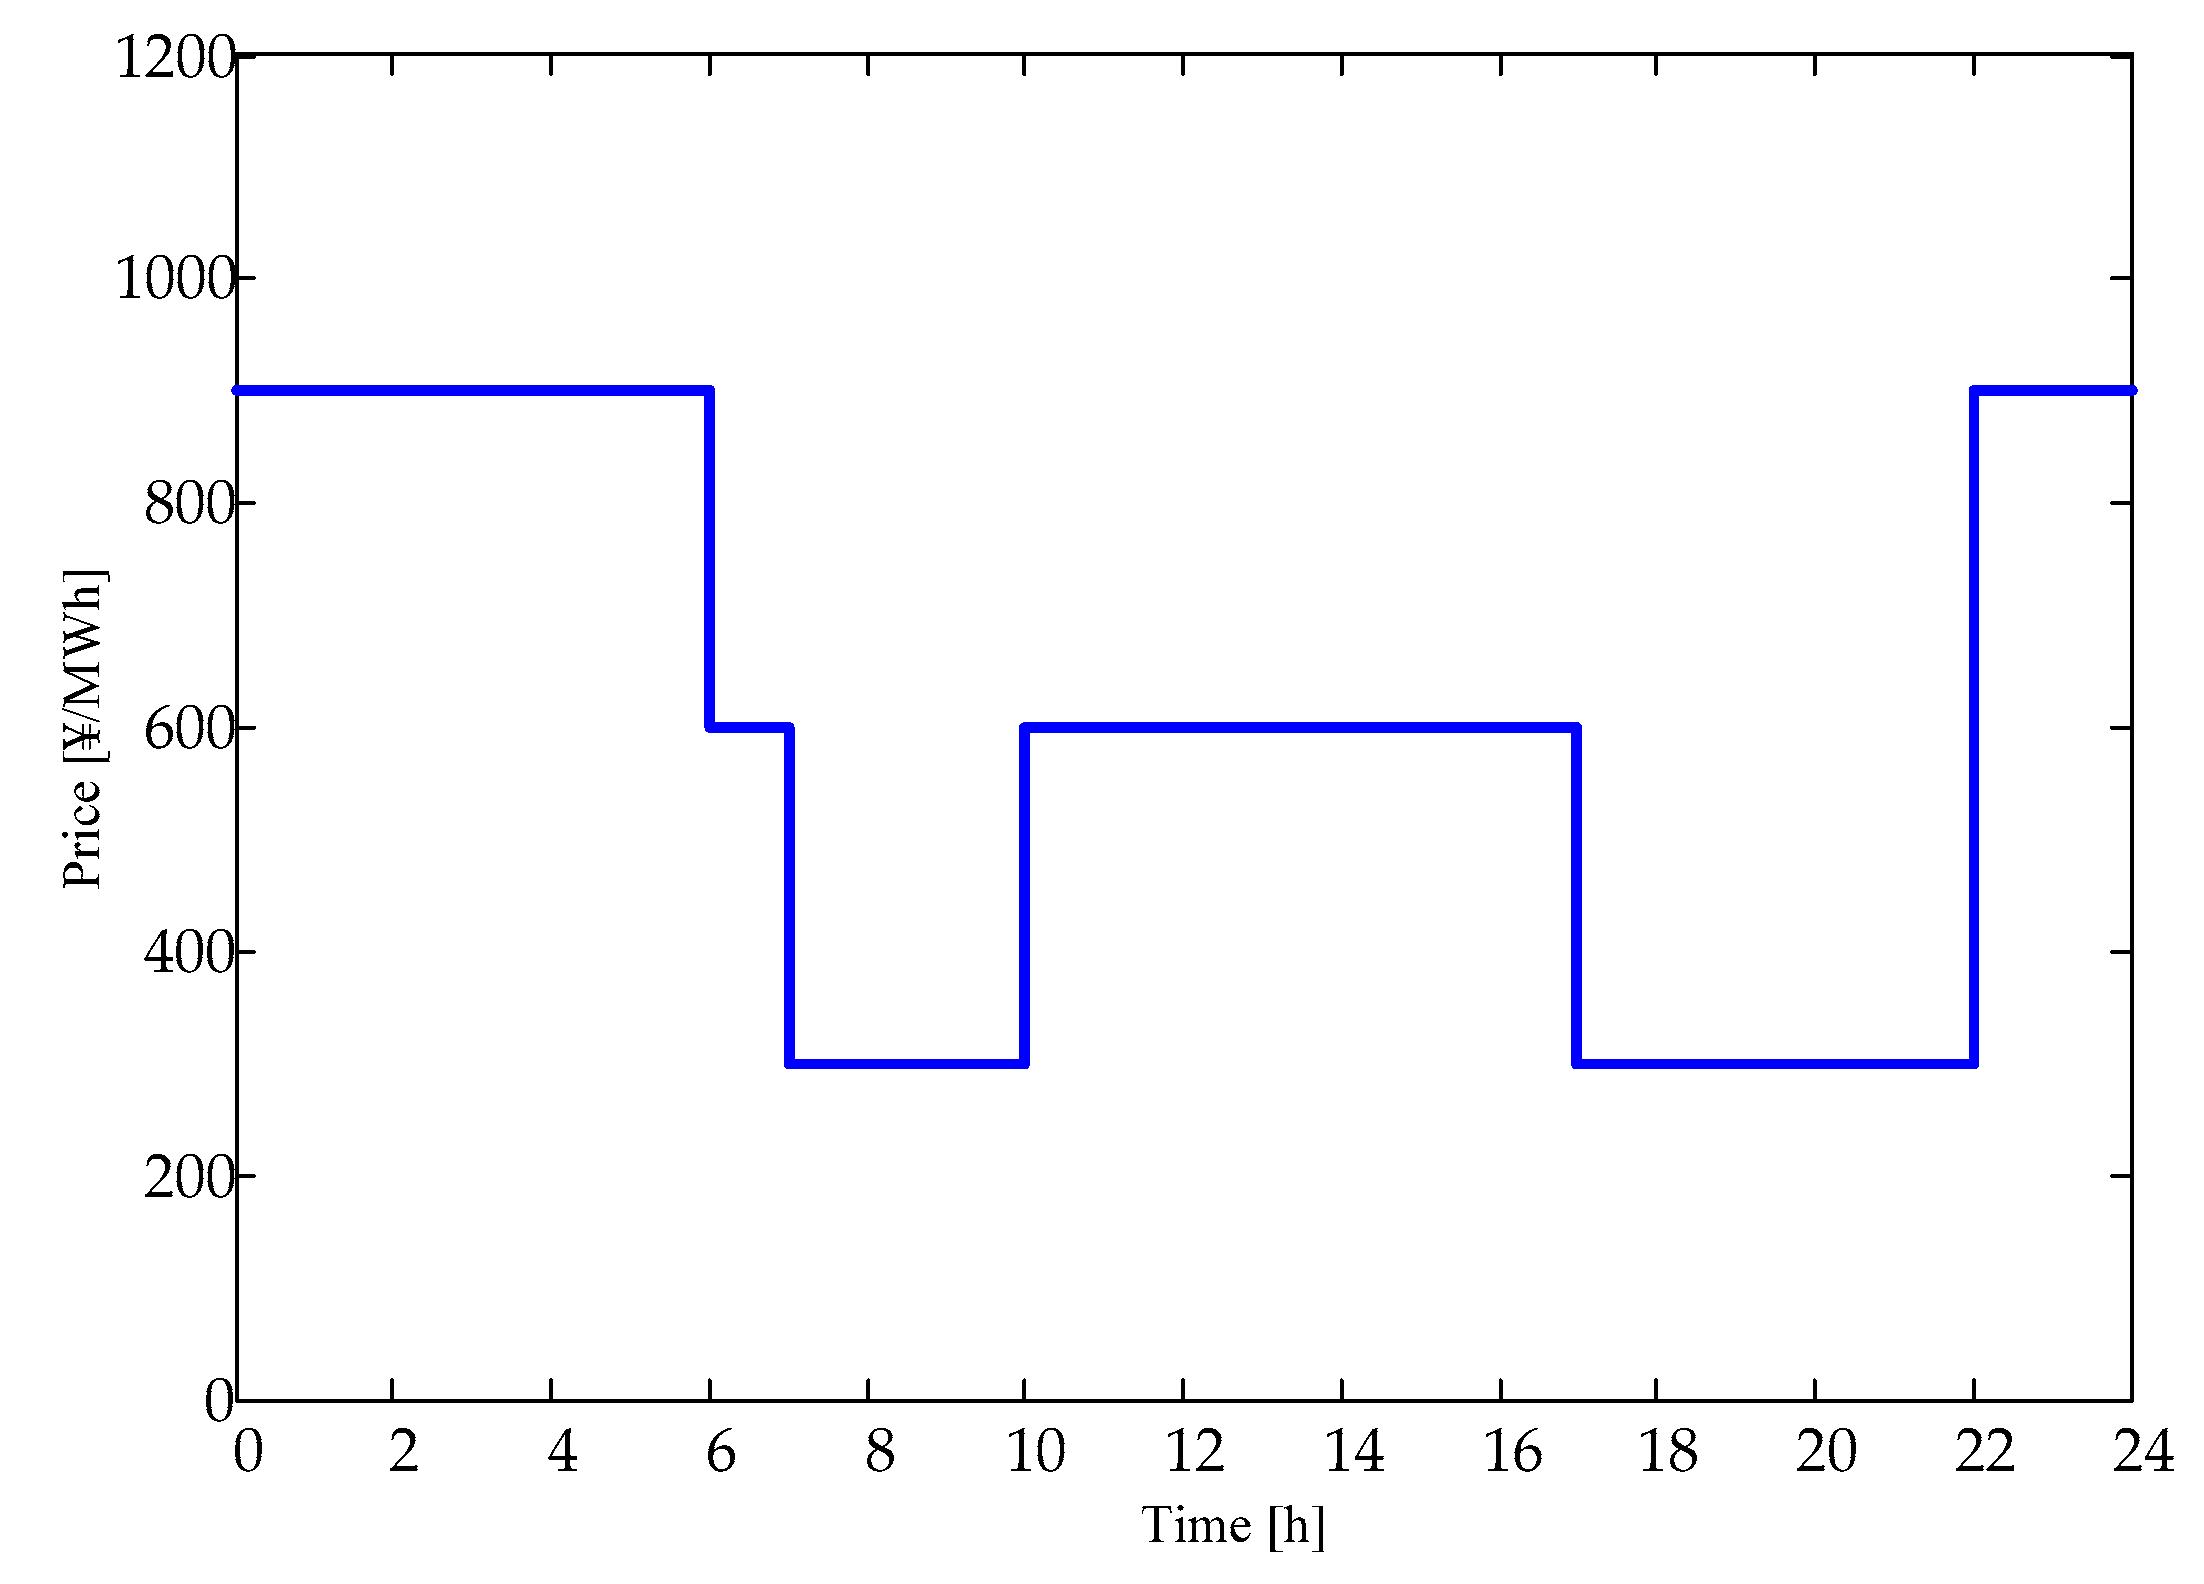
5.2. Optimization Result Analysis

● Analysis of the weak Stackelberg equilibrium solution
Based on the above conditions, the weak Stackelberg equilibrium of the game is obtained as shown in Figure 5. The payoffs of the RE company and BSS at the weak Stackelberg equilibrium are ¥276,480 and ¥58,671, respectively. When RE company adopts the strategy at the weak Stackelberg equilibrium point, no matter what kind of rational strategy BSS adopts, the income of RE company will not be lower than ¥276,480. Therefore, the weak Stackelberg equilibrium solution is a conservative decision for the RE company, and the payoff at the equilibrium point is the minimum of its payoff.
Comparing Figure 4 and Figure 5, it can be seen that the changing trend of charge/discharge price is basically consistent with that of the RE purchase price of the distribution company. During periods of low purchase price of distribution company, such as period 0–6, the RE company sets a low charge/discharge price, and directs the BSS to charge and to store power. During the period of high purchase price of the distribution company, such as period 20–21, the RE company sets a high charge/discharge price to attract BSS to discharge, so as to increase the revenue of electricity sale of the RE company.
Table 2 compares the revenue of RE and BSS under the cooperative and non-cooperative models. In the non-cooperative mode, BSS buys electricity directly from the distribution network company in accordance with the contract price ρ DC , and does not consider the sale of electricity to the power grid by BSS.
As shown in Table 2, compared to the case of non-cooperation, in the game model proposed in this paper, the revenue of both RE and BSS has increased. Therefore, both of them have the motive of cooperation.
● Sensitivity analysis of the average charge/discharge price
In the Stackelberg game, the RE company, as the leader, sets the charge/discharge price first, which has the first-mover advantage. If it is not restricted, the fairness of the game may be reduced. In this situation, the participation enthusiasm of BSS would be reduced or BSS might even refuse to cooperate. In order to protect the benefits of BSS, the upper limit constraint of the average charge/discharge price is introduced in the proposed model. Table 3 shows the effect of the average charge/discharge price on the revenue of both sides in the game. As can be seen from Table 3, although the revenue of the RE company and BSS are different at different average charge/discharge price, the total revenues of both sides remain the same (¥335,151).
The average charge/discharge price constraint could realize the redistribution of the total revenue and prevent the RE company from using its first-mover advantage to encroach on the reasonable income of BSS. In Table 3, as the average charge/discharge price ρ ¯ declines, revenue of the RE company continues to decrease, while BSS’s revenue continues to increase. It can be predicted that with the continuous decline of ρ ¯ , when the revenue of RE is less than ¥252,054 (its revenue under the non-cooperative mode given in Table 2), the RE company will not have the motivation to participate in the game. Similarly, with the increasing of ρ ¯ , when the revenue of BSS is less than ¥58,671 (its revenue under the non-cooperative mode given in Table 2), BSS will not have the motivation to participate in the cooperation. Therefore, the introduction of average charge/discharge price constraint is necessary and effective. ρ ¯ should be reasonably set to mobilize the enthusiasm of both sides of the game.
● Sensitivity analysis of the reserve ratio α of battery swapping demand
Considering the randomness of the battery-swapping demand, it is necessary to retain a certain reserve to avoid the curtailment of EV users’ demand. Table 4 shows the revenue of the RE company and BSS at different reserve levels. With the increase of α, the revenue of both sides decrease. This can be explained as the available capacity of the BSS decreases at a high demand-reserve level, since the BSS needs more fully charged batteries to meet a possible additional battery-swapping demand.
In Figure 6, we compare the remaining energy of the BSS when α is 5% and 25%. When α is 25%, the remaining energy of the BSS is higher in each period of time, which indicates that the BSS has prepared more backup batteries to satisfy the battery-swapping demand. During the high charge/discharge price periods, such as time intervals 8–10, BSS is unable to sell more energy to the RE company to raise income. Therefore, the BSS’s ability of “charging in low-price period and discharging in high-price period” is weakened, which is adverse to the interest of the RE company and the BSS.
● Sensitivity analysis of rated capacity Qmax of BSS
In addition to providing battery-switching services to EVs, the BSS also acts as an ESS to provide energy reserve for the RE company. BSS can make use of price differences of different time to earn profit. Obviously, a larger rated capacity is more conducive to the demand response of the BSS. As can be seen from Table 5, the BSS’s revenue has increased as the Qmax increases. The increasing discharged energy of the BSS in Table 5 also indicates that BSS’s ability to provide capacity backup for the RE company has been increased accordingly, resulting in the revenue increase of the RE company.
Although a higher Qmax is beneficial for increasing the operating income of BSS, exorbitant capacity will increase the investment costs, resulting in a waste of resources. Therefore, a trade-off is needed between operating income and investment cost.
● Influence of the battery-swapping demand on the BSS
In order to analyze the impact of battery swapping demand on BSS, three cases are designed.
Case 1: Swapping demand for each period of time in Figure 2 is multiplied by 0.8;
Case 2: Swapping demand is shown in Figure 2;
Case 3: Swapping demand for each period of time in Figure 2 are multiplied by 1.2.
The BSS’s income includes the fee of charging EVs user for battery switching service, and the income from selling energy to the RE company, which is positively correlated with the discharged energy of the BSS. With the increase of battery swapping demand, BSS’s ability of “charging in low-price period and discharging in high-price period” is weakened. Therefore, as can be seen from Table 6, the discharged energy of BSS decreases with the increase of swapping demand. This will result in a reduction in the second portion of the income of BSS mentioned above. However, as a result of the increase in battery swapping demand, the BSS’s income from battery switching services has increased accordingly, and the overall revenue of the BSS in Table 6 has increased as the battery swapping demand increases.
● Benefit of the distribution company
Although the cooperation between the RE company and the BSS does not bring direct economic revenue to the distribution company, the controllability of the RE is improved by the cooperation, which can reduce the adverse impact of the RE on the power grid. As a result, the distribution company can guide the output power of the RE by adjusting the purchase price, so as to reduce the peak-valley difference of the power load and reduce the peak-shaving pressure.
Figure 7 shows a comparison of the peak-valley difference of the power grid load under different conditions. It can be seen from Figure 7, when there is no RE, that the peak-valley difference of the power grid load is 61 MW. When RE is directly connected to the grid, the peak-valley difference of the equivalent load taking the RE output into account is increased to 76 MW. However, when the RE company and BSS work together, the peak-valley difference could be reduced to 67 MW by adjusting the output of different time intervals in response to the purchase price of the distribution company.
● Influence of the pricing strategy of the distribution company
The RE company improves its earnings by shifting electricity from lower-price periods to higher-price periods. Therefore, the pricing of the distribution company’s acquisition of the RE is very important. If the purchase price is unreasonable, it may lead to a further increase in the peak-valley difference of the power grid load. In order to analyze the impact of the distribution company’s pricing strategy, we selected another pricing strategy shown in Figure 8. Contrary to the pricing strategy in Figure 4, the RE purchase price of the distribution company is 300 during the peak-load period and 900 during the valley-load period in Figure 8. Figure 9 shows the load curve under this pricing strategy. Since the purchase price of the distribution company is higher during the valley-load periods, the RE company will sell as much electricity as possible during these periods in order to increase revenue. As a result of this unreasonable pricing strategy of the distribution company, the peak-valley difference of the power grid load increases from 61 MW to 90 MW.
It should be noted that the pricing strategy of the distribution company can also consider other goals, such as minimum load fluctuations.
● Influence of the RE production profile
In order to prove that the proposed model is effective under different RE production profile, two cases are designed.
Case 1: the RE production profile is shown in Figure 3;
Case 2: the RE production profile is flat. The RE power is the average value of the power curve shown in Figure 3.
Table 7 compares the revenue of the RE company and the BSS under the cooperative and non-cooperative models in case 1 and case 2.
As can be seen from Table 7, the cooperative model proposed in this paper can generate higher revenue for the RE company and BSS, both in case 1 and case 2. As a result, the RE company and BSS have the motive of cooperation in both cases. On the other hand, the power profile of the RE in case 2 is flat, which is more consistent with the purchase price curve decided by the distribution company. Therefore, whether under the cooperative or non-cooperative mechanism, the revenue of the RE company is higher in case 2 than in case 1. Because of the reverse peak-shaving characteristics of wind power, the power profile of the RE is usually inconsistent with or even opposite to the load curve of the power grid in practice, which brings a great deal of peak-shaving pressure to the distribution company. Under the cooperation mechanism proposed in this paper, through the cooperation with BSS, the RE company can increase the controllability of its output power, which is beneficial both for the RE company and the distribution company.

6. Conclusions

In the context of the rapid development of RE and EVs, the collaborative optimization problem of both is studied. In order to effectively coordinate and manage the RE company and the BSS when they belong to different investment subjects and do not want to form a joint system, a new cooperative mechanism based on the Stackelberg game is proposed. The proposed model can motivate the enthusiasm of RE company and BSS to cooperate and to achieve win-win outcomes. The main conclusions are as follows:
(1)
A Stackelberg game model with the RE company as leader and BSS as follower is proposed, which can effectively simulate the interaction between the RE company and BSS. On the one hand, the RE company does not need to directly control the charge/discharge behavior of the BSS, but only needs to optimize the charge/discharge price of each period to guide the charge/discharge behavior of the BSS. On the other hand, the BSS is not only a passive recipient of the price. The BSS could affect the revenue of the RE company by adjusting its own charge/discharge strategy, so as to urge the RE company to adjust the charge/discharge price.
(2)
The proposed model no longer requires that the RE company and BSS belong to a same interest subject, and there is no need for unified coordinated control between them. While pursuing the maximization of their own interests, the RE company and the BSS could automatically realize the optimal allocation of resources, and a win-win situation is achieve as well.
(3)
The comparative analysis of the two Stackelberg equilibriums shows that the weak Stackelberg equilibrium is more in line with the cooperation mechanism proposed in this paper. In addition, the simulation results show that the revenue of the RE company and BSS in the model proposed in this paper is higher than their revenue when they operate alone, which proves that both of them have the motivation to participate in the game.
In this paper, the randomness of battery-swapping demand is only roughly considered by a pattern of fixed reserve ratio. Through simulation analysis, it is found that the reserve ratio has an impact on the revenue both of the BSS and the RE company. Therefore, in order to consider the randomness of battery swapping demand and RE power precisely, it is necessary to extend the proposed pure-strategy game model to a mixed-strategy game model. This will be our next research direction.

Author Contributions

Z.J. completed major research tasks and wrote the paper. W.L. gave important suggestions and participated in the writing work as well. C.M., B.Z. and L.M. contributed to the simulation analysis. K.L. and W.L. revised the paper.

Funding

This research was funded by State Grid Shandong Electric Power Research Institute. The APC was funded by State Grid Shandong Electric Power Research Institute.

Conflicts of Interest

The authors declare no conflict of interest.

Nomenclature

NtNumber of time intervals
Δ t Length of a single time interval
P RE t Active power output of renewable energy at time t
ρ RE t Pool purchase price of RE generation at time t
P c t Charging power of BSS at time t
P d t Discharging power of BSS at time t
ρ t Charge/discharge price of BSS at time t
ρ min t Minimum Charge/discharge price of BSS at time t
ρ max t Maximum Charge/discharge price of BSS at time t
ρ ¯ Average Charge/discharge price
ρ DC Contract price for the direct charging of BSS from the distribution company
sUnit price of battery swapping
W t Battery swapping demand at time t
P cmax Maximum charging power of BSS
P dmax Maximum discharging power of BSS
Q t Energy storage of BSS at time t
Q max Rated capacity of BSS
Q min Minimum energy storage of the BSS
Q 0 Initial energy storage of BSS
Q end Energy storage at the end of a decision-making cycle
η c Charge efficiency of BSS
η d Discharge efficiency of BSS
α Reserve ratio of the battery swapping demand

References

  1. Min, C.-G. Analyzing the impact of variability and uncertainty on power system flexibility. Appl. Sci. 2019, 9, 561. [Google Scholar] [CrossRef]
  2. Golovanov, N.; Lazaroiu, G.C.; Roscia, M.; Zaninelli, D. Power quality assessment in small scale renewable energy sources supplying distribution systems. Energies 2013, 6, 634–645. [Google Scholar] [CrossRef]
  3. Bizuayehu, A.; Nieta, A.; Contreras, J.; Catalao, J. Impacts of stochastic wind power and storage participation on economic dispatch in distribution systems. IEEE Trans. Sustain. Energy 2017, 7, 1336–1345. [Google Scholar] [CrossRef]
  4. Lu, S.-D.; Wang, M.-H.; Kuo, M.-T.; Tsou, M.-C.; Liao, R.-M. Optimal unit commitment by considering high penetration of renewable energy and ramp rate of thermal units-a case study in Taiwan. Appl. Sci. 2019, 9, 421. [Google Scholar] [CrossRef]
  5. Zhao, H.; Wu, Q.; Hu, S.; Xu, H.; Rasmussen, C. Review of energy storage system for wind power integration support. Appl. Energy 2015, 137, 545–553. [Google Scholar] [CrossRef]
  6. Torres-Moreno, J.L.; Gimenez-Fernandez, A.; Perez-Garcia, M.; Rodriguez, F. Energy management strategy for micro-grids with PV-battery systems and electric vehicles. Energies 2018, 11, 522. [Google Scholar] [CrossRef]
  7. Chan, K.; Luo, X.; Qin, M.; Wu, T.; Chung, C. Optimal planning and operation of energy storage systems in radial networks for wind power integration with reserve support. IET Gener. Transm. Distrib. 2016, 10, 2019–2025. [Google Scholar]
  8. Barton, J.; Infield, D. Energy storage and its use with intermittent renewable energy. IEEE Trans. Energy Convers. 2004, 19, 441–448. [Google Scholar] [CrossRef]
  9. Hu, X.; Wang, K.; Liu, X.; Sun, Y.; Guo, S. Energy management for EV charging in software-defined green vehicle-to-grid network. IEEE Commun. Mag. 2018, 56, 156–163. [Google Scholar] [CrossRef]
  10. Xue, F.; Lei, X.; Zhang, Y.; Liu, H.; Gao, C. A brand-new approach of connecting electrical vehicles with smart grid from vehicle-to-grid mode to battery-to-grid mode. Power Syst. Technol. 2012, 36, 29–34. [Google Scholar]
  11. Jiang, Z.; Han, X.; Li, Z.; Li, W. Dependent chance goal programming of wind-EVBSS considering its multiple benefits. Power Syst. Technol. 2016, 40, 1134–1139. [Google Scholar]
  12. Miao, Y.; Jiang, Q.; Cao, Y. Operation strategy for battery swap station of electric vehicles based on microgrid. Autom. Electr. Power Syst. 2012, 36, 33–38. [Google Scholar]
  13. Liu, F.; Yang, X.; Shi, S.; Zhang, M.; Deng, H.; Guo, P. Economic operation of microgrid containing charging-swapping-storage integrated station under uncertain factors of wind farm and photovoltaic generation. Power Syst. Technol. 2015, 39, 669–676. [Google Scholar]
  14. Tian, Y.; Liao, Q.; Xue, Y.; Chen, Y. Multi-scenario coordinated planning method of EV battery-swapping station and distributed generation based on coordinated charging strategy. Electr. Power Autom. Equip. 2017, 37, 62–69. [Google Scholar]
  15. Fu, H.; Liu, M.; Chen, Z. Multi-objective optimization of battery swapping station with wind photovoltaic and energy storage. In Proceedings of the CSU-EPSA, Brussels, Belgium, 23–25 June 2016; Volume 28, pp. 38–43. [Google Scholar]
  16. Chen, Z.; Liu, N.; Xiao, X.; Zhang, J. Energy exchange model of PV-based battery switch stations based on battery swap service and power distribution. In Proceedings of the IEEE Energytech Conference, Cleveland, OH, USA, 21–23 May 2013. [Google Scholar]
  17. Liu, N.; Chen, Q.; Lu, X.; Liu, J.; Zhang, J. A charging strategy for pv-based battery switch stations considering service availability and self-consumption of PV energy. IEEE Trans. Ind. Electr. 2015, 62, 4878–4889. [Google Scholar] [CrossRef]
  18. Jiang, Z.; Han, X.; Li, Z.; Wang, M.; Liu, G.; Wang, M.; Li, W.; Ollis, T.B. Capacity optimization of a centralized charging station in joint operation with a wind farm. Energies 2018, 11, 1164. [Google Scholar] [CrossRef]
  19. Jiang, Z.; Han, X.; Li, Z.; Li, W.; Wang, M.; Wang, M. Two-stage multi-objective collaborative scheduling for wind farm and battery switch station. Energies 2016, 9, 886. [Google Scholar] [CrossRef]
  20. Suo, L.; Xiang, C.; Tang, W.; Liu, Z.; Zhao, H. Multi-objective Bi-level programming of centralized charging station considering benefits balance for different subjects. Autom. Electr. Power Syst. 2016, 40, 100–107. [Google Scholar]
  21. Wang, K.; Ouyang, Z.; Krishnan, R.; Shu, L.; He, L. A game theory based energy management system using price elasticity for smart grids. IEEE Trans. Ind. Inform. 2015, 11, 1607–1616. [Google Scholar] [CrossRef]
  22. Lu, Q.; Chen, L.; Mei, S. Typical applications and prospects of game theory in power System. Proc. CSEE 2014, 34, 5009–5017. [Google Scholar]
  23. Schneider, I.; Roozbehani, M. Energy market design for renewable resources: Imbalance settlements and efficiency-robustness tradeoffs. IEEE Trans. Power Syst. 2017, 3757–3767. [Google Scholar] [CrossRef]
  24. Mei, S.; Wang, Y.; Liu, F.; Zhang, X.; Sun, Z. Game approaches for hybrid power system planning. IEEE Trans. Sustain. Energy 2012, 3, 506–517. [Google Scholar]
  25. Wang, Z.; Yuan, Y.; An, B.; Li, M.; Wang, F. An overview of security games. J. Command Control 2015, 1, 121–149. [Google Scholar]
  26. Leitmann, G. On generalized Stackelberg strategies. J. Optim. Theory Appl. 1978, 26, 637–643. [Google Scholar] [CrossRef]
  27. Breton, M.; Alj, A.; Haurie, A. Sequential stackelberg equilibria in two-person games. J. Optim. Theory Appl. 1988, 59, 71–97. [Google Scholar] [CrossRef]
  28. Wei, W.; Chen, Y.; Liu, F.; Mei, S.; Tian, F.; Zhang, X. Stackelberg game based retailer pricing scheme and EV charging management in smart residential area. Power Syst. Technol. 2015, 39, 939–945. [Google Scholar]
  29. Anandalingam, G.; White, D. A solution method for the linear static stackelberg problem using penalty functions. IEEE Trans. Autom. Control 1990, 35, 1170–1173. [Google Scholar] [CrossRef]
  30. Song, Y.; Zhang, J. Multi-objective cuckoosearch algorithm for Bi-level programming problems. Oper. Res. Manag. Sci. 2017, 26, 1–10. [Google Scholar]
Figure 1. Block diagram of cooperation between renewable energy (RE) company and battery switch station (BSS).
Applsci 09 01679 g001
Figure 2. Prediction of battery-swapping demand.
Applsci 09 01679 g002
Figure 3. Prediction of wind power and photovoltaic power.
Applsci 09 01679 g003
Figure 4. Price of electricity purchased by the distribution company.
Applsci 09 01679 g004
Figure 5. The weak Stackelberg equilibrium.
Applsci 09 01679 g005
Figure 6. The remaining energy of the BSS.
Applsci 09 01679 g006
Figure 7. The load curve under different conditions.
Applsci 09 01679 g007
Figure 8. Price of electricity purchased by the distribution company.
Applsci 09 01679 g008
Figure 9. The load curve with different pricing strategy.
Applsci 09 01679 g009
Table 1. Parameters of the BSS.
No.ParametersQuantity
1 Q max 55 MWh
2 Q min 5.5 MWh
3 Q 0 16.5 MW
4 Q end 16.5 MW
5 P cmax 11 MW
6 P dmax 7 MW
7s1300 ¥/MWh
8 η c 95%
9 η d 92%
10 α 10%
Table 2. The revenue of both sides in different scenario.
ScenarioRE CompanyBSS
Cooperative scenario¥276,480¥58,671
Non-cooperative scenario¥252,054¥52,200
Revenue increase9.7%12.4%
Table 3. The revenue of both sides with different average charge/discharge price.
Average Charge/Discharge Price
¥/MWh
RE Company
¥
BSS
¥
Total Revenue
¥
750277,91157,240335,151
720276,48058,671335,151
650272,19662,955335,151
600269,13666,015335,151
550266,07669,075335,151
Table 4. The revenue of both sides with different α.
αRE Company
¥
BSS
¥
5%276,502 58,803
10%276,480 58,671
15%276,458 58,539
20%276,437 58,407
25%276,415 58,276
Table 5. The influence of Qmax on the RE company and BSS.
Qmax MWhRE Company Revenue
¥
BSS Revenue
¥
Discharged Energy of BSS
MWh
55276,480 58,671 30.5
60276,819 60,872 35.0
65276,973 63,300 39.7
Table 6. The influence of swapping demand on BSS.
Swapping Demand
MWh
BSS Revenue
¥
Discharged Energy of BSS
MWh
Case 151,851 45.1
Case 258,671 30.5
Case 358,539 14.0
Table 7. The revenue of the RE company and the BSS in different scenario.
ScenarioCooperative ScenarioNon-Cooperative Scenario
Case 1Case 2Case 1Case 2
Revenue of the RE company¥276,480¥286,791¥252,054¥262,467
Revenue of the BSS¥58,671¥60,100¥52,200¥52,200

