Article

Molecular Mechanism Research into the Replication Capability of Nanostructures Based on Rapid Heat Cycle Molding

1
College of Mechanical and Electrical Engineering, Nanchang University, Nanchang 330031, China
2
School of Mechanical & Materials Engineering, Jiujiang University, Jiujiang 332005, China
*
Author to whom correspondence should be addressed.
Appl. Sci. 2019, 9(8), 1683; https://doi.org/10.3390/app9081683
Submission received: 28 March 2019 / Revised: 18 April 2019 / Accepted: 22 April 2019 / Published: 24 April 2019
(This article belongs to the Section Chemical and Molecular Sciences)

Abstract

:
Aimed at the molding of polymer nanostructure parts, the interface model between long- and short-chain polycarbonates (PC) and nickel mold inserts was established by the molecular dynamics method. The molecular mechanism of the replication capability of polymer nanostructure part molding was discussed by analyzing the migration and diffusion of the molecular chain, concentration profile, filling morphology evolution, interface binding energy, and filling rate of conventional injection molding (CIM) and rapid heat cycle molding (RHCM). The results show that nanostructures are filled mainly during the packing stage. A short-chain PC system has a low glass transition temperature (Tg) and viscosity, good fluidity, and a high filling rate, so the replication capability of its nanostructures is good. A long-chain PC system has a fast cooling rate in CIM, its molecular chain motion is blocked, the filling rate is low, and the interface binding energy is small, and so its nanostructures have poor replication capability. However, the high temperature at the nanostructures can be maintained for a long time in RHCM, which promotes Brownian motion in the molecular chains. Under the action of packing pressure, molecular chains can overcome entanglement barriers and viscous resistance. Thus, the polymer concentration profile and filling rate increase with increasing packing pressure, which can produce more van der Waals energy. Furthermore, the evolution process of polymer filling morphology is realized by the Brownian motion of chain segments under packing pressure; that is, the diffusion motion of the molecular chain along the direction of a tube composed of other chains around it. With the increase of temperature or pressure, the migration and diffusion of the molecular chain can be promoted; thus, the replication capability of nanostructure parts for mold cavities can be enhanced.

1. Introduction

Injection molding technology has become one of the main methods of mass polymer material molding due to the advantages of its short molding cycle, low-cost, and high precision [1,2,3]. However, with the wide application of polymer parts with micro–nano structure features, higher molding requirements are put forward. In CIM, the retention phenomenon and the condensation layer effect at the nanostructure make the cavity filling insufficient [4], and the replication capability of the product is poor. Therefore, it is particularly difficult to produce nanostructure products by the CIM method. Molding nanostructures parts with a good replication capability is developing into a hot research topic [5,6,7,8,9]. Macintyre et al. made characteristic structures smaller than 100 nm on an optical disk for the first time by using injection molding technology, which improves storage space [10]. Pranov et al. studied the effect of injection rate, mold temperature, melt temperature, and other process parameters on the filling of nanostructures [11]. With the continuous development of RHCM technology in recent years, the mold temperature can be precisely controlled, and the mold cavity temperature can be rapidly heated to near polymer Tg until rapid cooling during the late packing stage [12]. Hattori and Lin et al. used rapid heating technology to heat the mold surface, and nanostructures with a higher replication rate were obtained [13,14]. However, it is difficult to directly characterize the evolution process of the polymer molecular chain-filling morphology in the mold cavity and the molecular mechanism of nanostructure replication capabilities under limited experimental conditions. In recent years, molecular simulation methods have been applied to study the microscopic mechanism, such as the fluidity of polymer molecular chains [15], the interfacial diffusion of multilayer polymer films [16], the simulation analysis of nanoimprint lithography technology [17], polymer glass transition [18], nanoinjection molding [19,20], and so on. Zhou et al. used PMMA as research materials, applied molecular dynamics method to study the polymer filling into nanocavity by injection molding, and elucidated the effects of molecular weight and cavity size on the filling behavior and final replication quality of nanostructures [19]. Furthermore, they also applied molecular dynamics method to study the interfacial interaction and joining properties of PP-Al hybrid structures in nanoinjection molding [20]. The molecular simulation technique can be used not only to explain the macroscopic experimental phenomenon from the microscopic perspective, but also visually to analyze the filling dynamic process in the nanostructures, which is difficult to observe due to the limitation of experimental equipment at the molecular size.
In this paper, based on the molecular dynamics method, the interface model between the PC and nickel mold insert was established by using amorphous long- and short-chain polycarbonates as research materials. Firstly, glass transition temperatures of different PC systems were studied to determine their mold temperature in RHCM. Then, the nanostructure molding mechanism of long and short-chain polymer systems in CIM and RHCM was discussed, and the filling morphology evolution in nanostructures and the reason for the high–low filling rate were analyzed to provide a theoretical basis for further improving the replication capability of nanostructures and improving the quality of nanostructure parts.

2. Establishment of Interface Model and Simulation Experiment

2.1. Establishment of Interface Model

Firstly, Ni crystal cell was imported and cleaved along the (1 0 0) surface, and then the constructed crystal cell was optimized. The thickness of the Ni layer is 3.4 nm. The super cell was established by extending the optimized structure along the direction of U and V. Then, a three-dimensional periodic cell with a vacuum layer thickness of 0 Å was established, and its lattice parameters were a = 5.0 nm, b = 7.5 nm, c = 3.4 nm, and α = β = γ = 90°. After full energy optimization, a circular arc groove was cut with a depth of 1.2 nm.
Secondly, two PC all-atomistic molecular chain models with different chain lengths (N = 5, 25) were established. The chemical formula for PC is (C16H14O3)n. After structure optimization, two amorphous crystal cell models with the same total number of atoms and chain numbers of 50 and 10, respectively, were constructed with a density of 1.2 g/cm3. The crystal cell parameters were adjusted to be equal to the Ni crystal cell a and b values, so that the interface model could be established later. Thirdly, the smart method structure optimization [15] of PC crystal cell models was carried out at a temperature of 0 K to find the lowest energy structure adjacent to it. The smart method structure optimization combines three energy minimization methods: the steepest descent method, the conjugate gradient method, and the Newton method. Then, the temperature factor was added to search for the lowest energy conformation of the system through energy disturbance; that is, 5 cycles of annealing were conducted to cause the system to be in an equilibrium state. Furthermore, 20 PS preheating was conducted at 500 K to bring the polymer to a molten state. Finally, the interface models of the two PC systems and Ni layers were established, respectively, as shown in Figure 1. In order to avoid the influence of 3d periodic boundary conditions on the height, a vacuum layer of 2.0 nm was set above the model.

2.2. Molecular Dynamics Simulation

In the filling stage of injection molding, the pressure decreases rapidly after the plastic melt enters the mold cavity, and the pressure at the material flow front reaches the minimum value, thus the pressure in the mold cavity is negligible compared with the packing pressure. Moreover, the polymer melt cools faster at the nanostructure, and the polymer molecular chain temperature is approximately equal to the temperature of the mold cavity. Thus, the filling process of the PC melt was simulated with the NVT ensemble (constant-number, constant-volume, and constant-temperature), with a total of 50,000 steps [21]. In the subsequent packing stage, the polymer is under the steady pressure of the screw. The final conformation of the filling process was taken as the initial conformation of the packing stage, and the NPT ensemble (constant-number, constant-pressure, and constant-temperature) was used for the simulation calculation of 120,000 steps. Meanwhile, the laws were statistically analyzed, such as the concentration profile of polymer atoms, interface interaction energy, the migration and diffusion of molecular chains, and so on. The calculation process was performed by Material studio software. The COMPASS force field [22] and Velocity Verlet integral algorithm with excellent performance were adopted in the system, and the time step was set as 1 fs. Additionally, the Nose–Hoover temperature control method and Berendsen pressure control method were adopted.

3. Results and Discussion

3.1. Determination of RHCM Mold Temperature

The mold temperature is to be heated to around the polymer glass transition temperature in RHCM. The glass transition is an inherent property of amorphous polymer material, and it is also a macroscopic reflection of the transformation of macromolecular motion forms. According to Fox and Flory’s free volume theory [23,24], below Tg, the volume expansion of the polymer is only the expansion of the occupied volume as the temperature increases, while above Tg, the free volume begins to expand. Therefore, Tg can be obtained by measuring the inflection point on the polymer-specific volume–temperature curve. Between 525 and 250 K, the NPT ensemble was used to simulate the phase-cooling of long-chain and short-chain PC systems. The data of the PC-specific volume changing with temperature was extracted for linear fitting to obtain two straight lines, whose intersection point was Tg.
As can be seen from Figure 2, the glass transition temperatures of long-chain and short-chain PC materials are significantly different. The molecular weight of the N = 25 system has exceeded the critical molecular weight, and the Tg reaches 417 K, which is close to the experimental value [25]. However, the Tg of the N = 5 system is only about 358 K, which is because the system with low molecular weight contains more chain ends, and the chain end has a larger free volume and stronger activity than the chain middle, and so the glass transition of low molecular weight polymer takes place at a lower temperature. As the molecular weight increases, the Tg increases. When the critical molecular weight is exceeded, the chain end concentration is already very small, and Tg will not change obviously. Thus, it can be seen that the simulation results are reliable, and the mold temperature in RHCM is set to 415 K.

3.2. Concentration Profile

During injection molding, the position distribution of polymer atoms in the nanostructures can be characterized by their concentration profile, which represents the ratio of the density of PC atoms in a tiny region to its average density in the whole interface system. When the polymer density of the system is the initial set density of 1.2 g/cm3, the relative concentrations of the long-chain and short-chain polymer systems in their respective interface systems are 6 and 4, respectively. Figure 3 shows the concentration profile of PC atoms at the end of the filling stage. It can be seen that the polymer cannot overcome the viscous resistance and entanglement barrier to fill the nanocavity, and there is only a small concentration profile near the interface.
As shown in Figure 4, the concentration profile of PC atoms at the end of the packing stage can directly reflect the distribution degree of the polymer in the nanostructure cavity. The atomic concentration of the long-chain PC system is the lowest in CIM—especially, it is close to zero at the bottom of the cavity—while the atomic concentration increases apparently in RHCM. When the pressure is set to 40 MPa, the concentration dose not reach the ideal value. However, with the increase of the packing pressure, the concentration dramatically improves, and the concentration profile in the whole cavity is even and almost close to the maximum value. For the short-chain system, the atomic distribution is better and there is no obvious difference. As mentioned above, the glass transition temperature obviously decreases, so the polymer has better fluidity. Driven by pressure, PC molecular chains easily overcome resistance and fill the nanocavity.

3.3. Interface Binding Energy

Interface binding energy is a measure of the interaction energy between different systems at the interface, which can be used to measure the strong and weak interaction between PC molecular chains and nickel mold inserts. The binding energy between the two systems is defined as the negative number of the interaction energy:
E b i n d = E i n t e r = [ E P C / N i ( E P C + E N i ) ]
where E b i n d is the interface binding energy of the system, E i n t e r is the interface interaction energy of the system, E P C / N i is the total energy of the system, E P C is the energy of the polymer, and E N i is the energy of the mold insert.
Figure 5 shows the change of interface binding energy between PC molecular chains and nickel mold inserts with time during the injection molding process. The binding energy grows slowly in the filling stage and rapidly in the packing stage, then tends to be flat in the later packing stage. As shown in Table 1, the interaction energy between the PC system and Ni system is equal to the nonbond interaction energy between the two systems, which shows that interface atoms interact with each other through nonbond interaction. Furthermore, the electrostatic force of the interface system is zero, so the contribution of the atomic binding energy comes from the van der Waals force.
As described in the concentration profile, only a few atoms near the interface are absorbed into the cavity under van der Waals attraction in the filling stage. Thus, the binding energy is lower. Driven by the packing pressure in RHCM, the long-chain PC polymer fills into the cavity, and the binding energy is large. Especially when the packing pressure is increased, the atomic concentration at the nanostructures increases accordingly. This means that more PC atoms are close to Ni atoms, so the van der Waals attraction increases, and the interface binding energy increases greatly. However, the binding energy of the long-chain PC system in CIM is very low, which indicates that the polymer has a fast cooling rate at room temperature for the mold. Thus, the viscosity increases, and the resistance of the filled cavity increases also. For the short-chain system with low molecular weight, the filling effect is good and the interface binding energy is large, which is due to its low viscosity and good fluidity.

3.4. Replication Capability of Nanostructures

In order to analyze the replication capability of nanostructures, the filling rate is introduced; that is, the ratio of the polymer density in the nanocavity to the initial set density of the PC system. It can be seen from Figure 6 that the filling rate of the short-chain polymer system rises sharply during the packing stage and tends to balance rapidly, with the filling rate exceeding 95%. This further indicates that the short-chain polymer can easily overcome resistance under the action of pressure and fill the cavity quickly, with a high filling rate and good replication capability.
Under different molding conditions, the filling rate of the long-chain PC in the nanostructures fluctuates greatly. Moreover, the filling rate grows slowly in CIM, which shows that the polymer cools quickly during the filling process at a low temperature of the mold and molecular chain motion ability is low. Therefore, the filling effect is poor with low replication capability. Under the RHCM process, the filling rate grows rapidly, but the difference is obvious at the pressure of 40 MPa and 80 MPa. In order to more intuitively analyze the replication capability of nanostructures under different pressures, it can be further characterized by its molding morphology [26]. Figure 7 shows the filling morphological evolution process of the polymer in the nanostructures at different pressures during the packing stage, which can directly reflect the filling situation of the polymer in the nanocavity. PC molecular chains are driven by pressure to overcome the entanglement resistance and fill the cavity. Especially at a pressure of 80 MPa, the long molecular chains are closely arranged and there is almost no void in the cavity. Furthermore, the filling rate reaches 94%, with a good replication capability of nanostructures. Although the long molecular chains have filled the cavity at a pressure of 40 MPa, there are still obvious voids between the molecular chains and the filling rate can only reach 70%. This shows that the packing pressure plays an important role in filling the nanostructures and is the main driving force of filling the nanostructures. The high packing pressure can obviously improve the filling effect of the nanostructures, improving the molding replication capability of the products. It is worth noting that the morphological evolution of the filling process of the short-chains at a pressure of 40 MPa is faster than that of the long-chains, which further indicates that the short-chains overcome more easily the viscous resistance due to their lower viscosity, and the filling effect is better.

3.5. Molecular Chain Motion

The migration and movement behavior of molecular chains in the polymer system can be characterized by mean square displacement (MSD), namely, the average of the squared displacement of all the atoms within a period of time [27], which can be expressed by the following formula.
M S D = | r i ( t ) r i ( 0 ) | 2
where r i ( t ) and r i ( 0 ) represent the position of the ith atom at time t and the initial time, respectively [28].
The change trend of the long-chain PC system’s MSD with time in the packing stage is shown in Figure 8. It is observed that the MSD increases slowly in CIM. According to the free volume theory, the free volume of the polymer decreases at low temperature [29,30]. Meanwhile, there is insufficient transition energy for the molecular chains. Thus, the molecular chains have difficulty overcoming the entanglement barrier and do not migrate in a wide range, whereas the MSD increases rapidly under the RHCM process. This indicates that the free volume and system energy rise with temperature increasing. Under a certain pressure, molecular chain segments cross the high potential energy region, overcome the viscous flow activation energy, and jump to the adjacent “holes”. That is to say, the entirety of the chain motion of the macromolecule is realized by the successive transition and segmental displacement of chain segments. Furthermore, the motion morphology of molecular chains can be described by the Reptation model [31,32]; that is, the molecular chain is restricted to move within a virtual tube composed of adjacent chains, and its motion is limited by the topology of other chains around it [33]. Its Reptation is realized by the Brownian motion of the chain segment. When a molecular chain wriggles along one end of a tube, a new section of tube is formed; meanwhile, a section of tube at the other end disappears. Thus, the chain moves completely to a new position, forming a new entanglement and completing the diffusion motion.
D = 1 6 lim t d d t | r i ( t ) r i ( 0 ) | 2
The slope of the MSD curve becomes larger when the pressure of RHCM increases. According to the Einstein equation shown in Formula (3) [34,35], the diffusion coefficient D is proportional to the slope of the MSD curve, which shows that increasing pressure can accelerate the migration and diffusion of polymer molecular chains and make the polymer flow better. As mentioned above, its filling rate is higher, and the replication capability of nanostructures is greatly improved. Therefore, the filling process of the polymer can be understood as a diffusion motion of the molecular chain along the direction of a tube under the combined action of Brownian motion and packing pressure. With the increase of temperature or pressure, the migration and diffusion of the molecular chain can be promoted, and the replication capability of nanostructure parts for mold cavities can be improved.

4. Conclusions

(1)
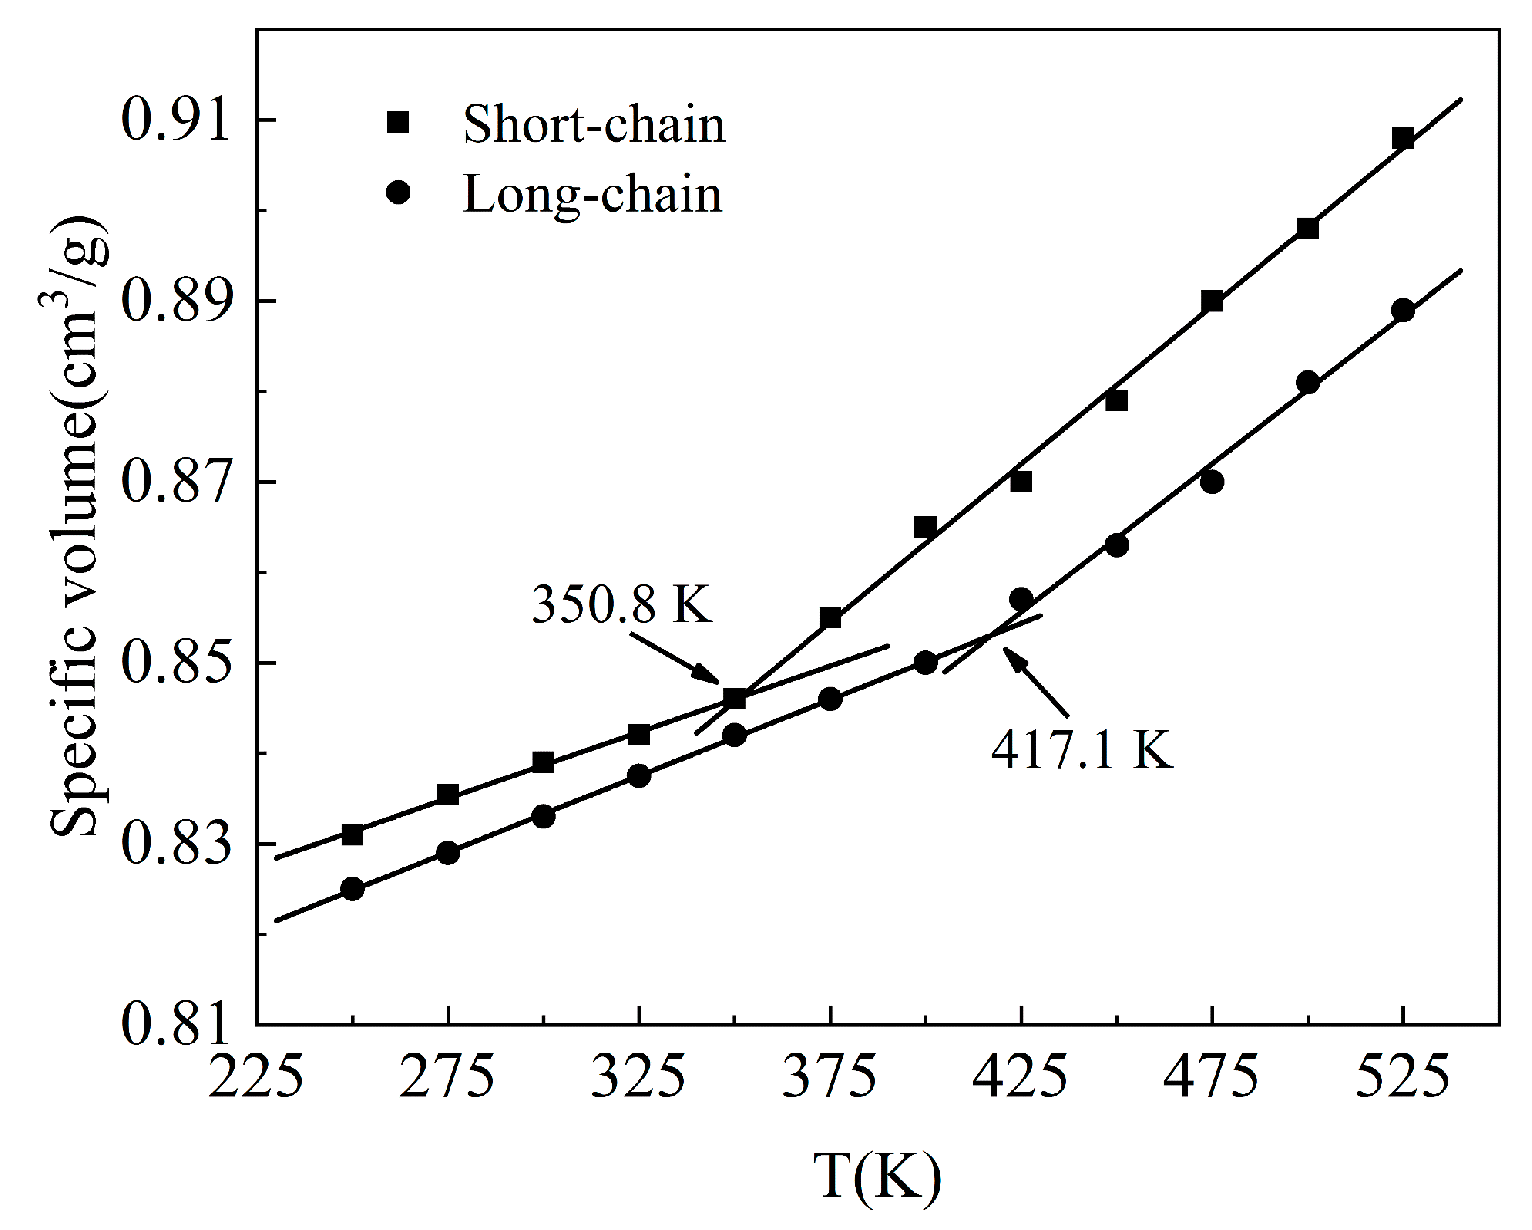
The Tg of the amorphous PC long-chain simulation system is 417 K, which is basically consistent with the experimental result. Moreover, the Tg of the short-chain system is greatly reduced. Thus, the Tg results of the two simulation systems conform to Flory free volume theory, indicating that the simulation results are reliable.
(2)
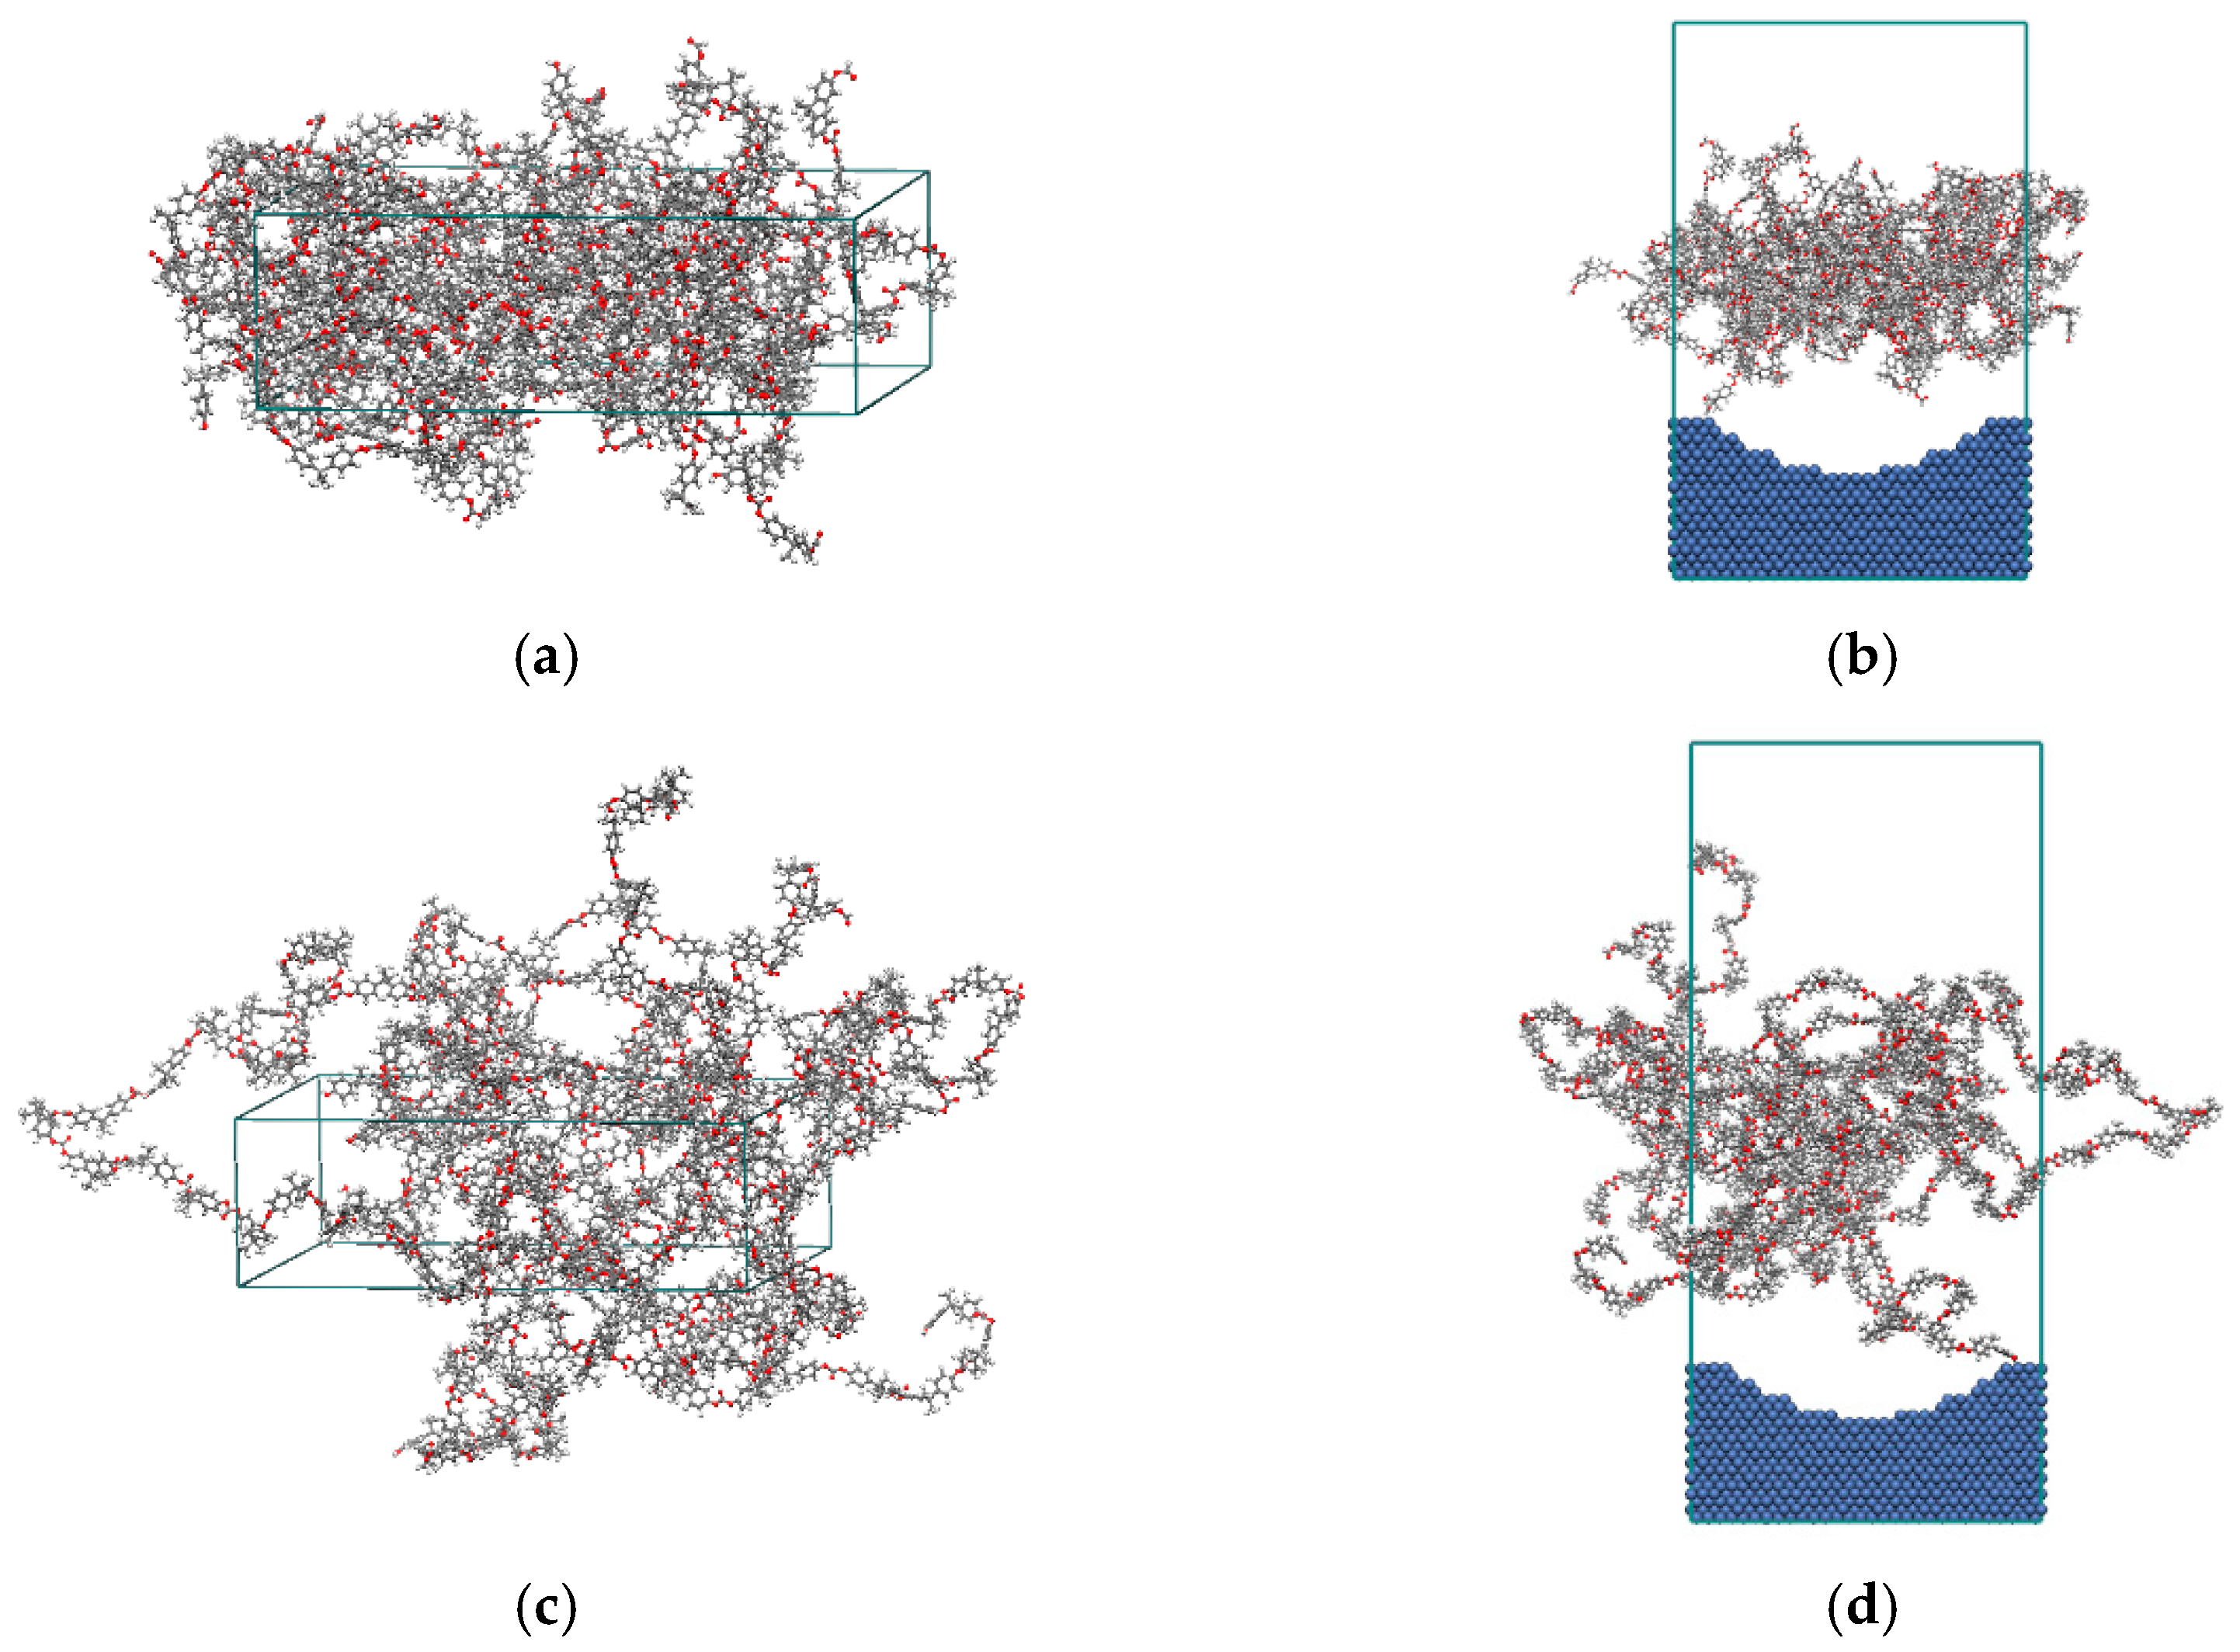
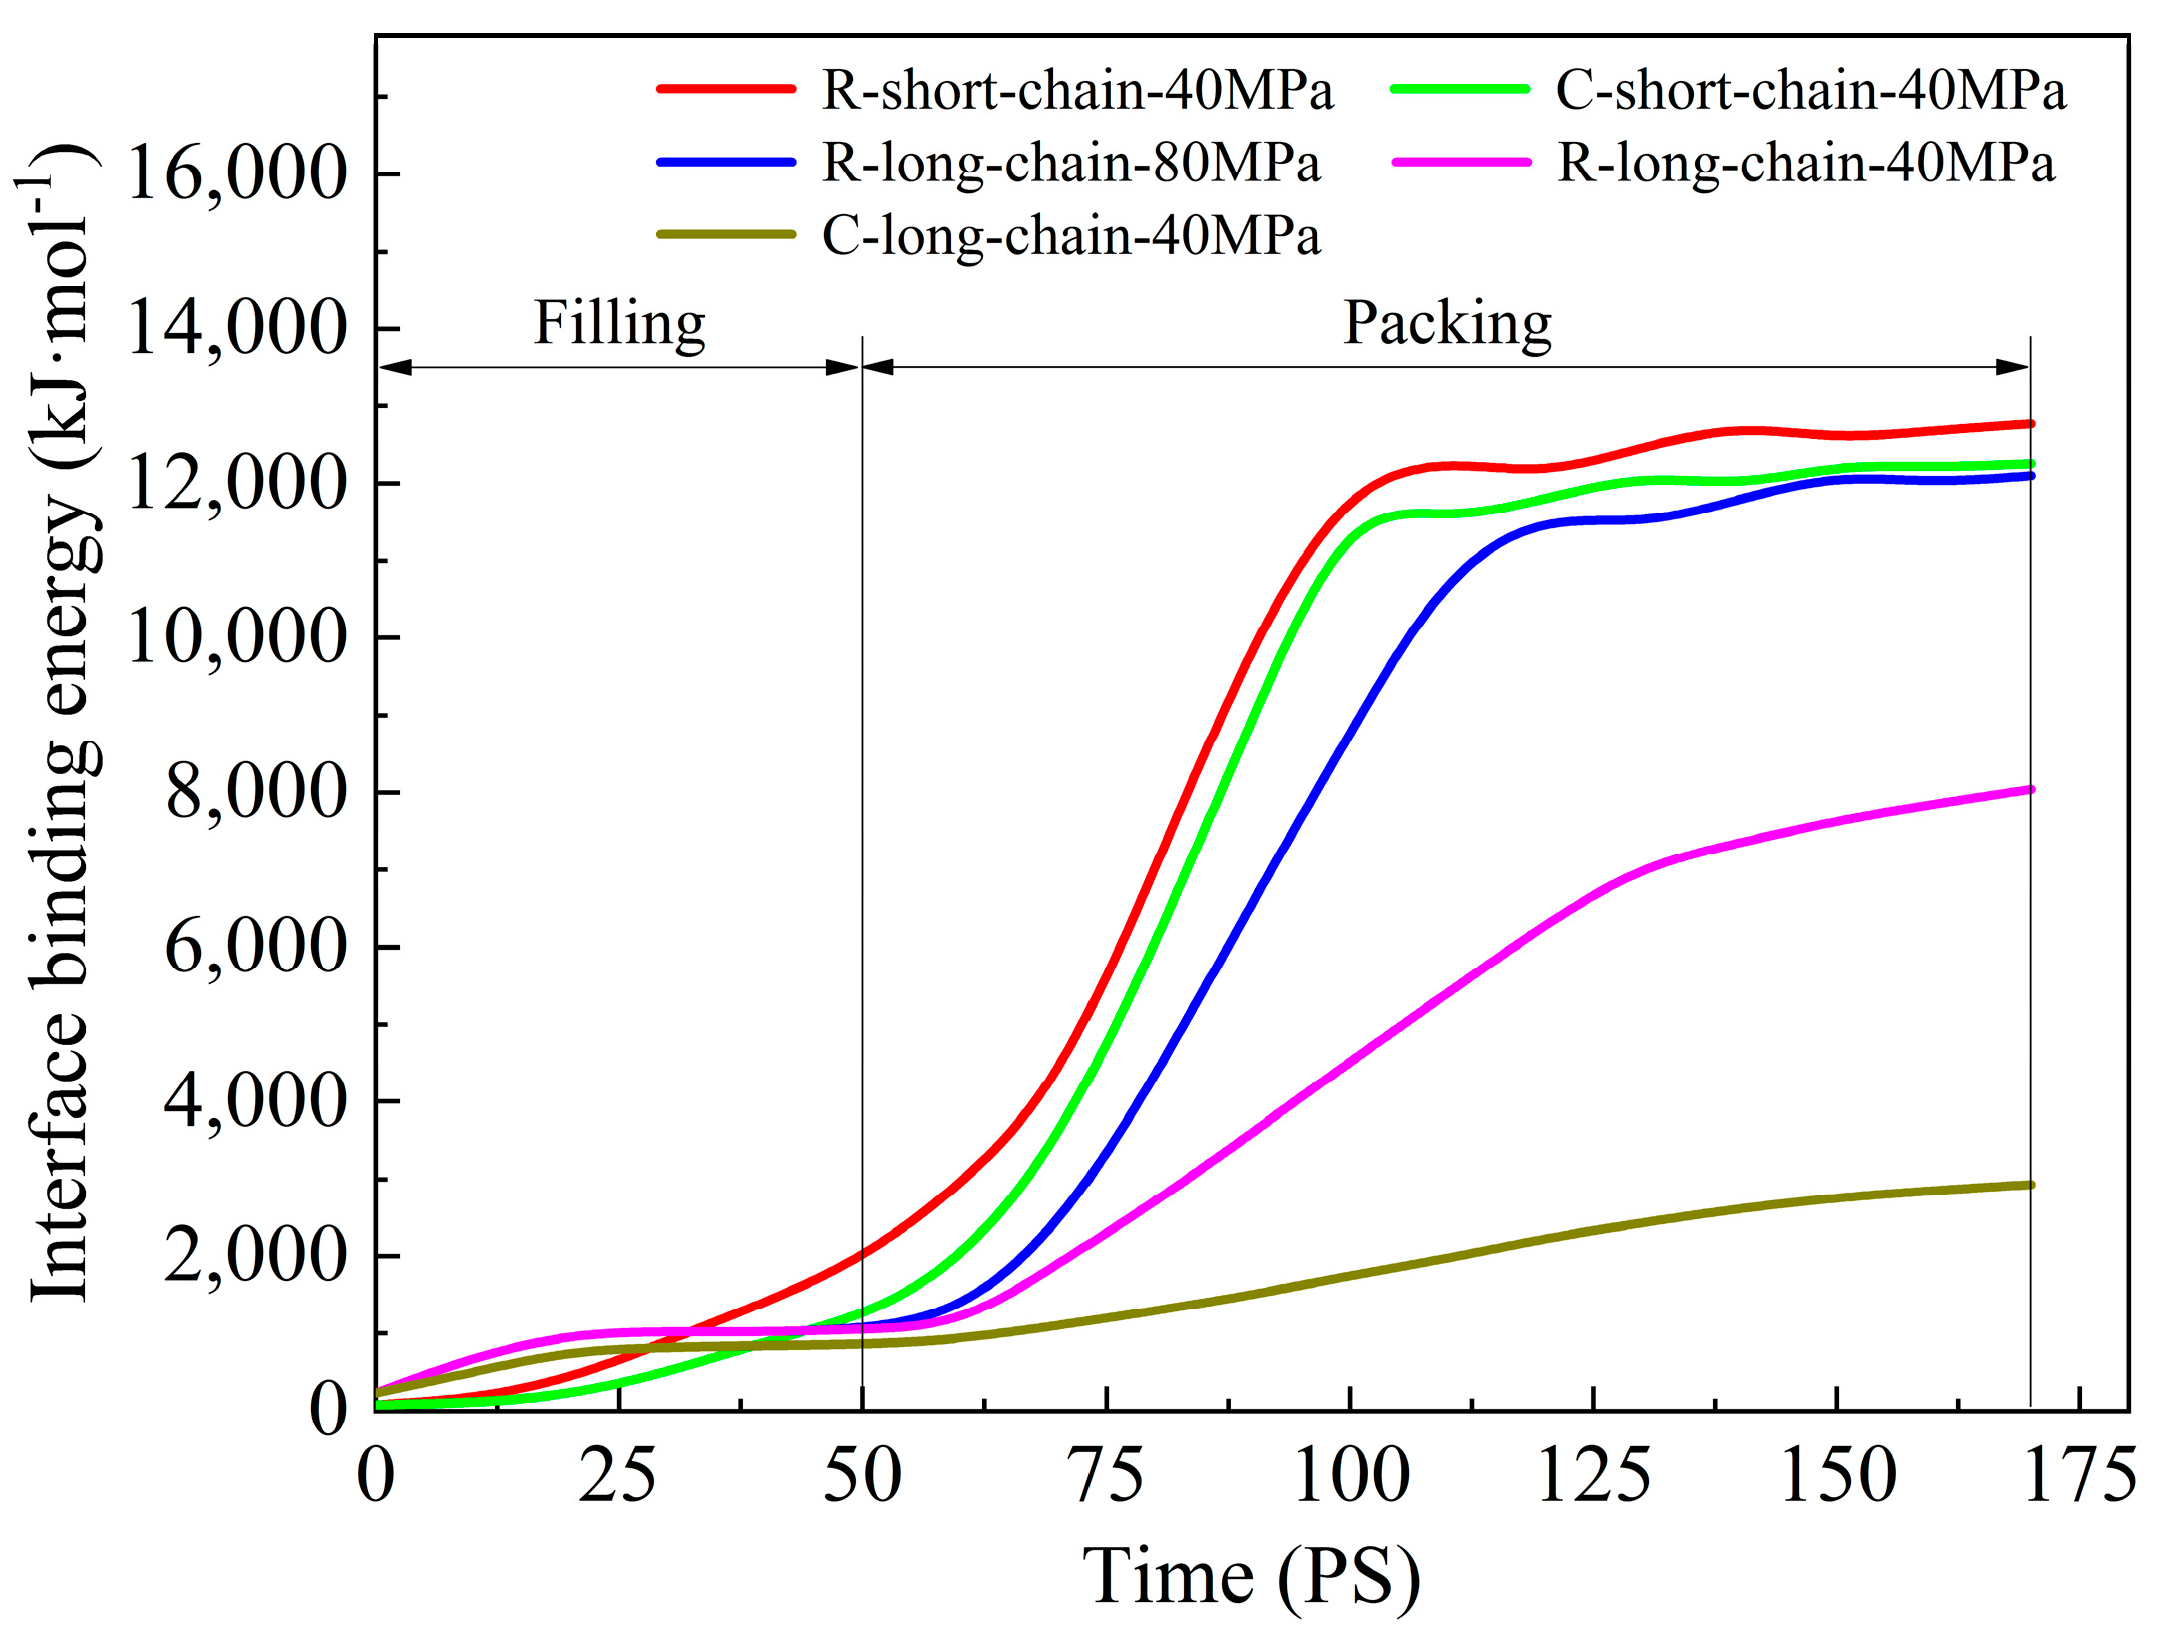
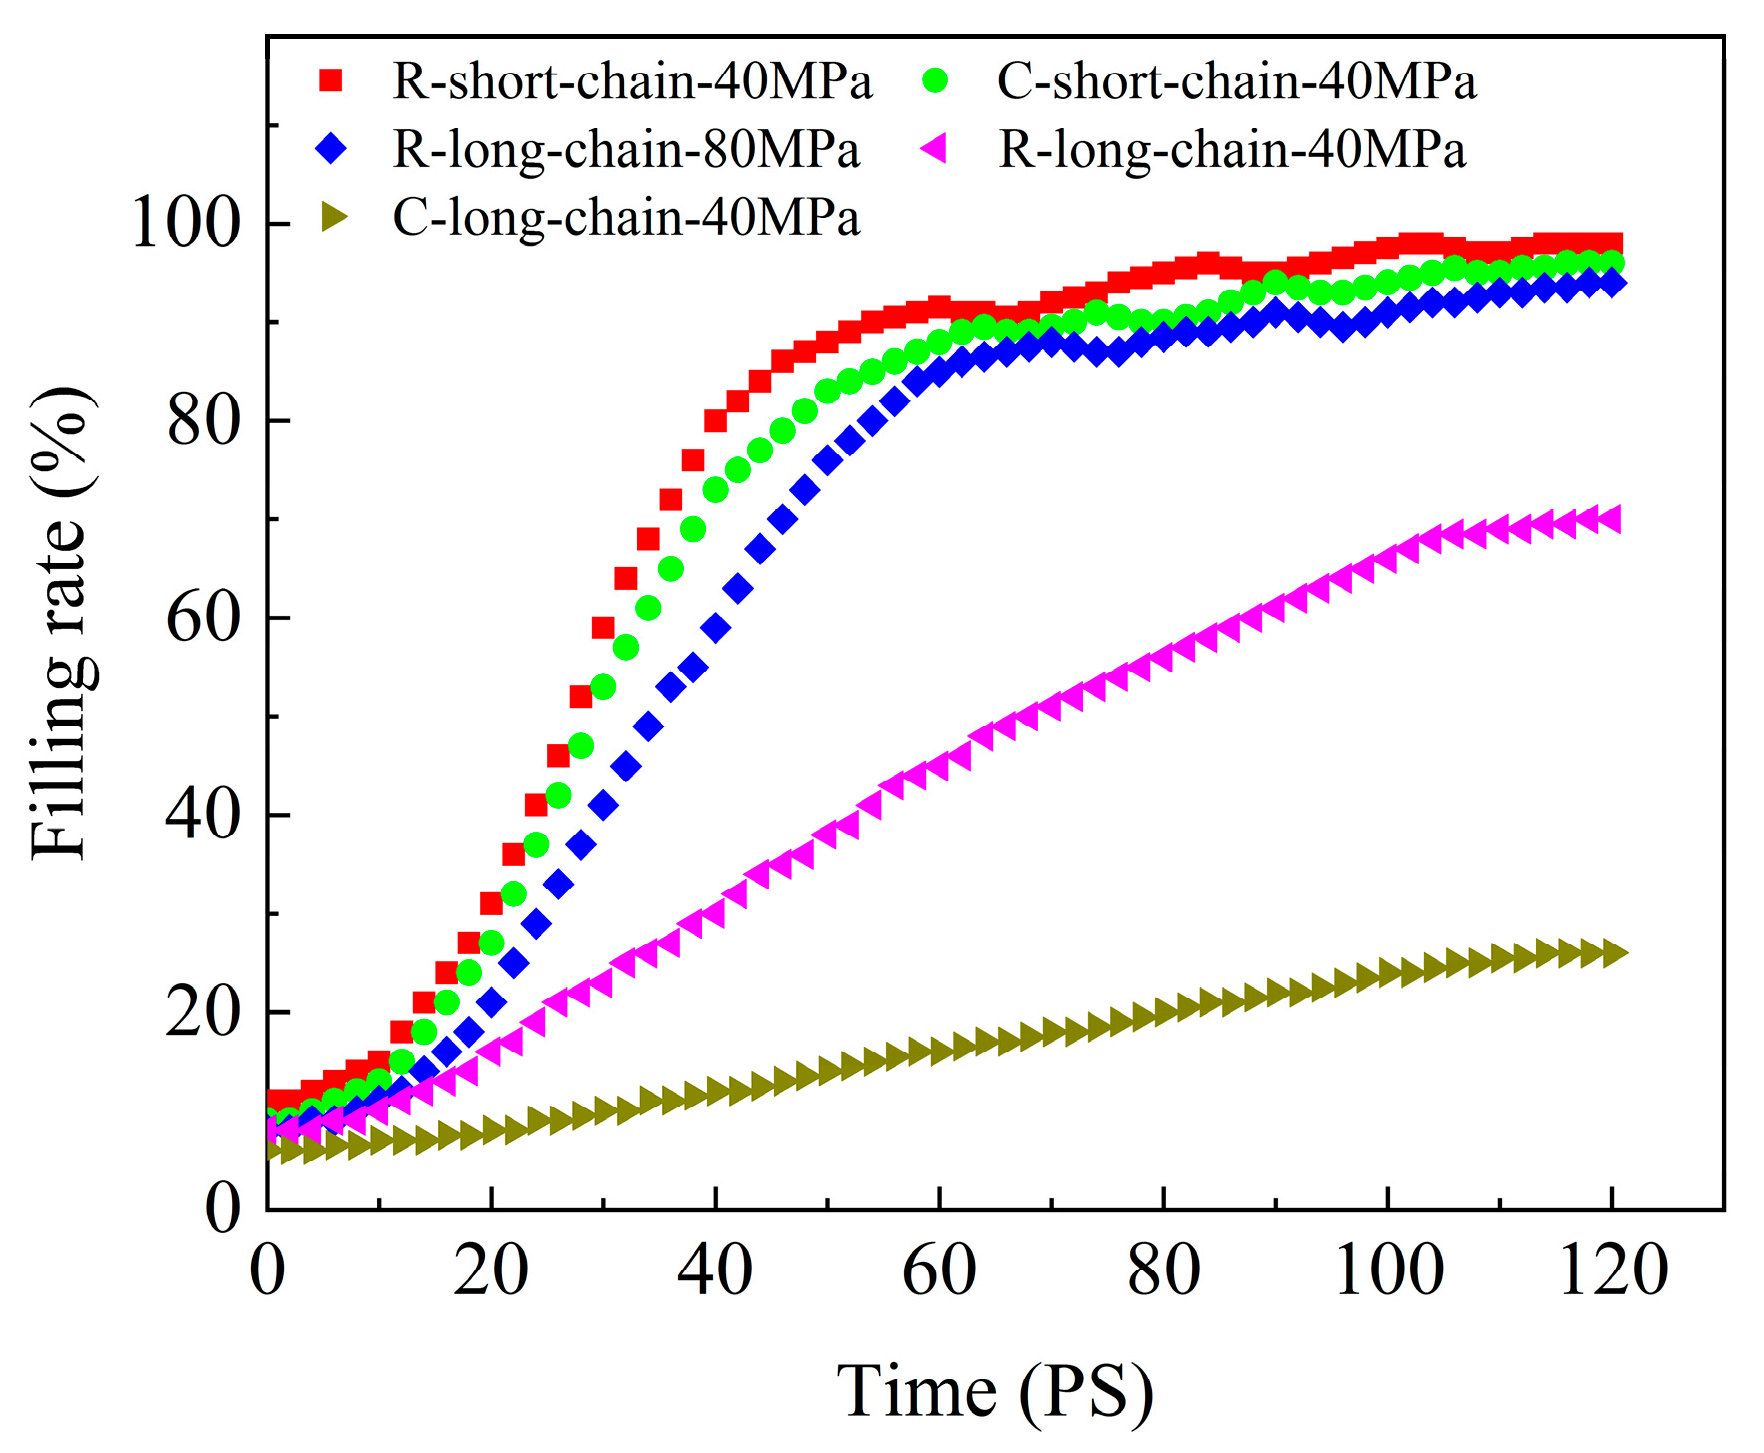
In the filling stage, it is difficult for PC molecular chains to overcome the resistance, and only a few atoms fill a short distance into the nanostructures. The filling is mainly in the packing stage. Since the mold temperature is low in CIM, the long-chain PC system at the nanostructures cools rapidly and the viscosity increases. Thus, the molecular chain motion is blocked, the migration motion becomes weak, and it is difficult to cross the high potential energy region. The result is that the filling effect is poor, with low replication capability. However, for the short-chain system, the glass transition temperature and viscosity are lower, and it is easy to overcome resistance under a certain pressure, with a high filling rate and good replication capability.
(3)
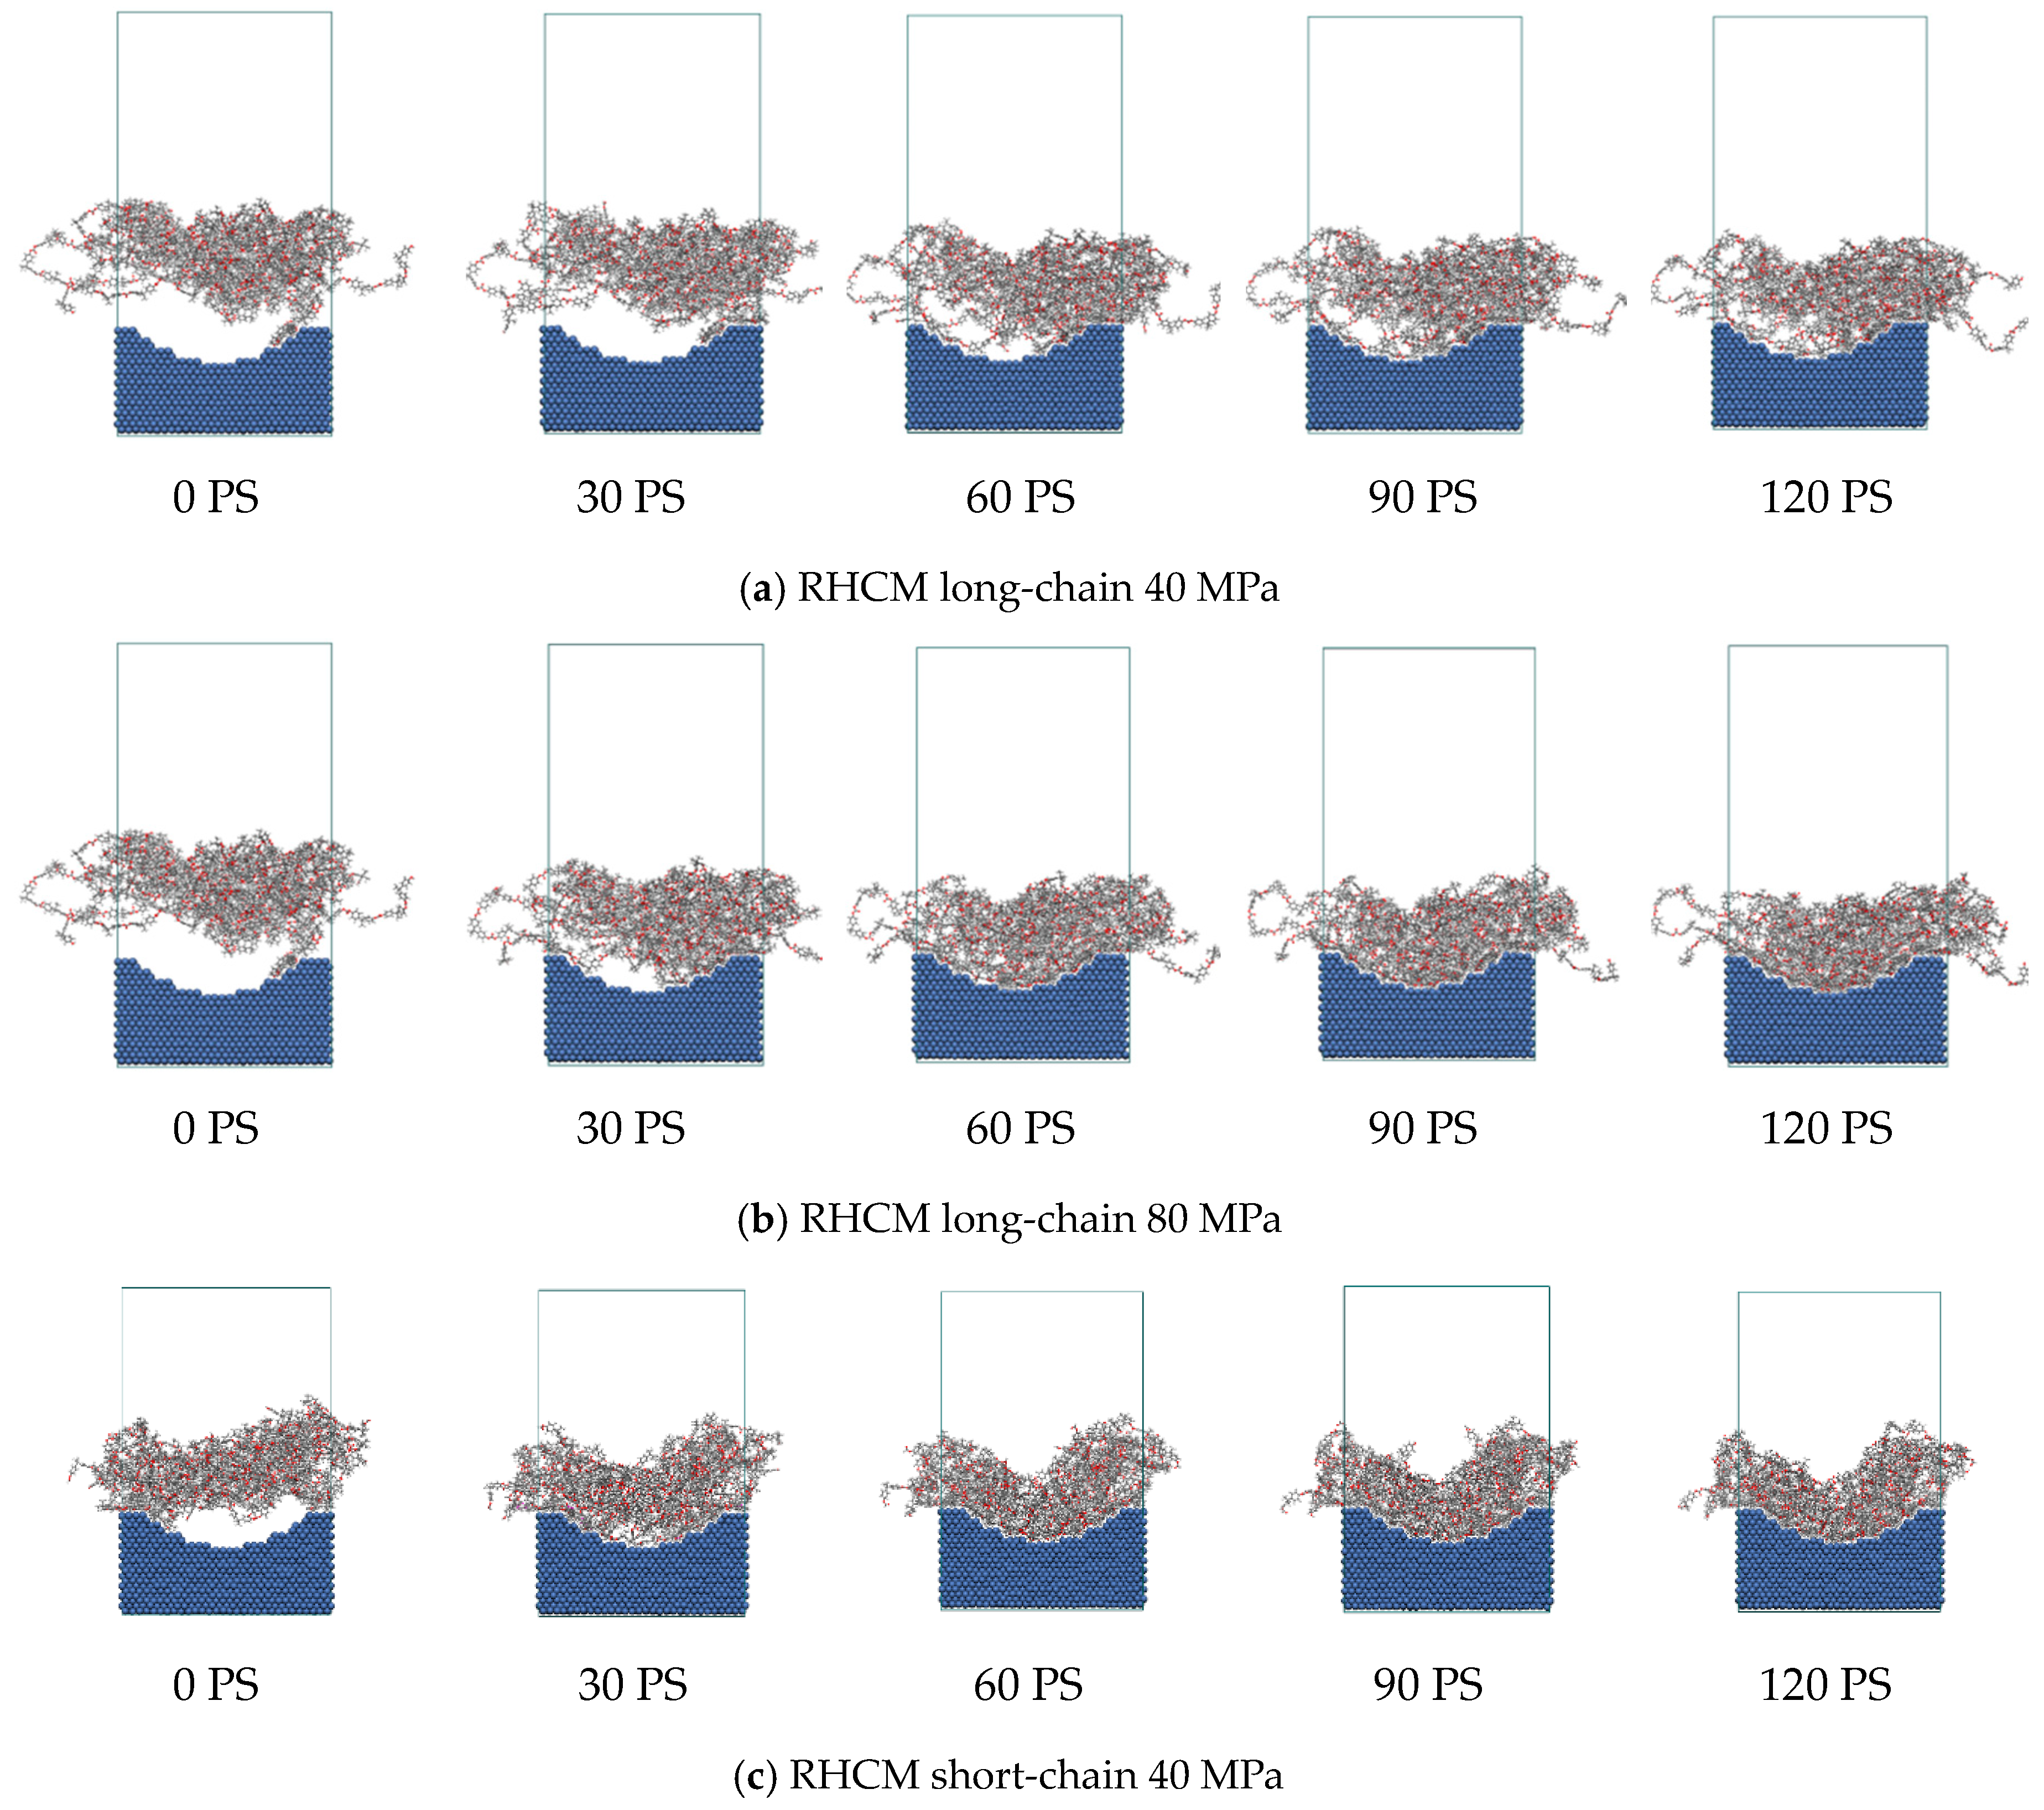
The high temperature of the mold in RHCM can enable the polymer to maintain a high temperature for a long time, and the Brownian motion of the molecular chains is active. Under the packing pressure, molecular chains can overcome the restriction of the entanglement barrier and viscous flow activation energy, and realize the transition of position, with a good filling effect.
(4)
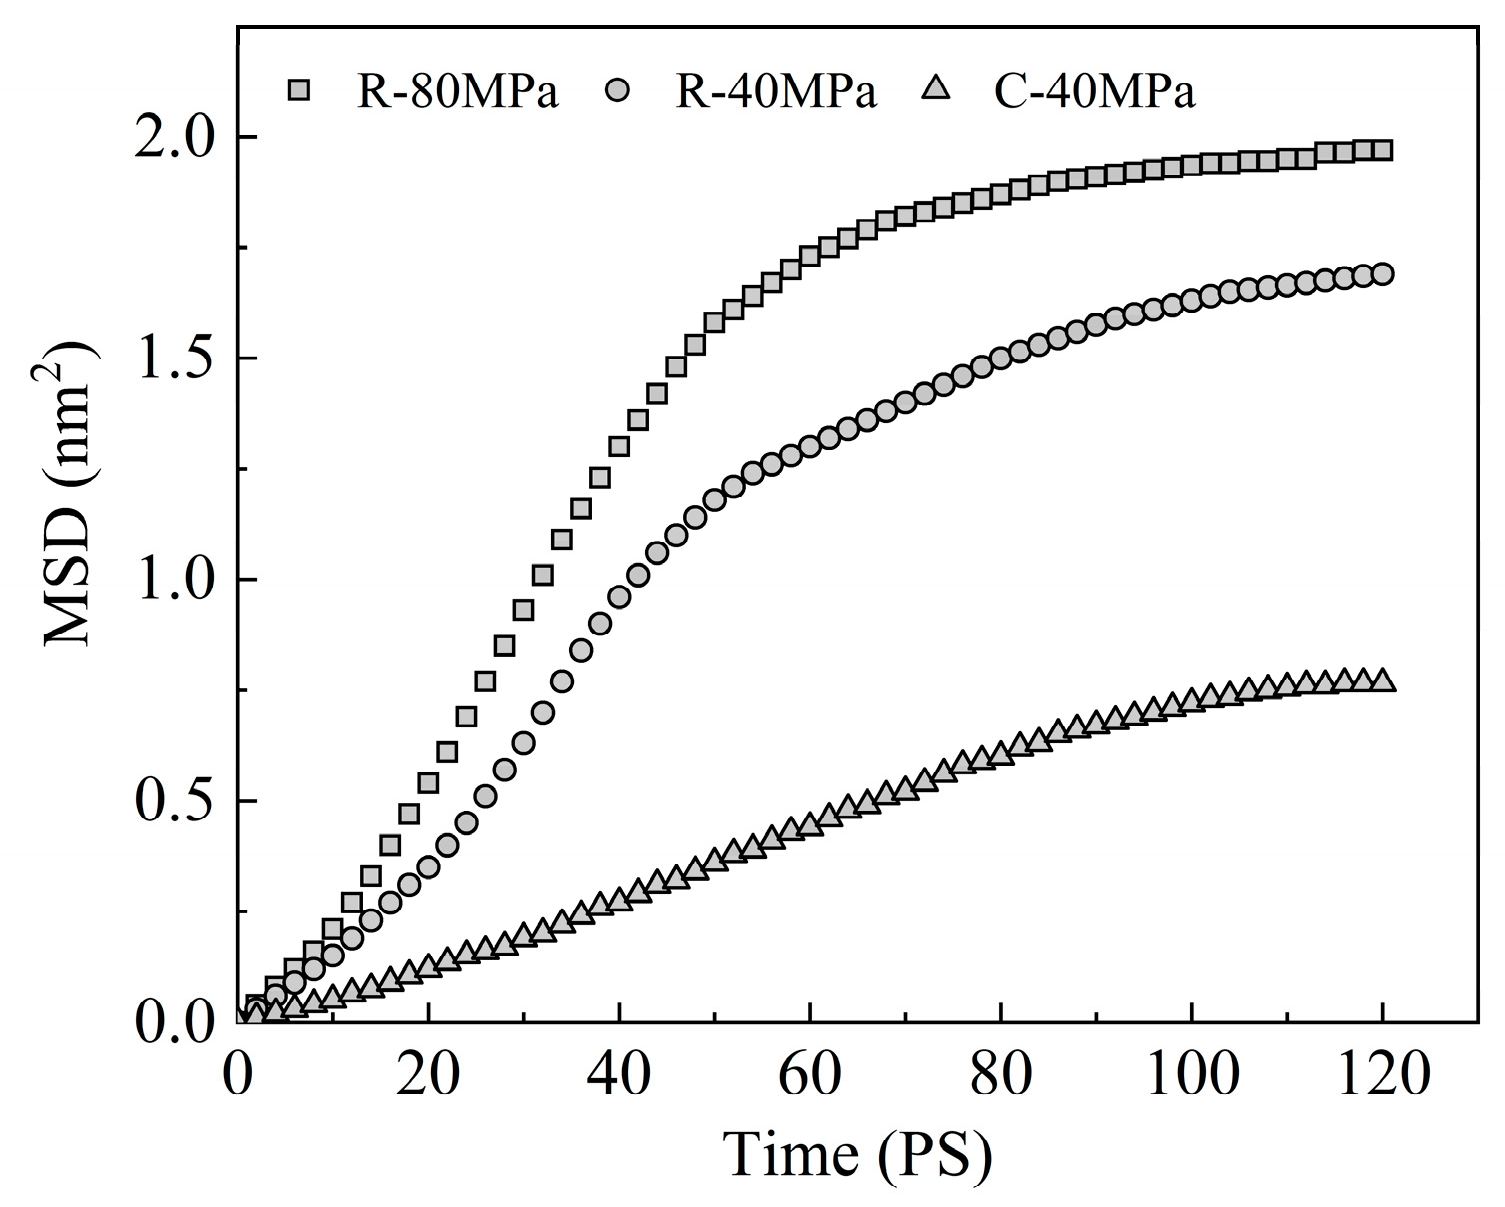
The evolution process of the polymer filling morphology can be regarded as the diffusion motion of the molecular chain along the direction of a tube composed of other chains around it, which is realized by the Brownian motion of chain segments under the packing pressure. Temperature and pressure play a key role in this process. In RHCM, increasing the pressure can promote the migration and diffusion of the molecular chains and enhance the filling degree of the polymer to the nanostructure. Consequently, the replication capability of nanostructure parts for mold cavities can be enhanced, and the molding precision of nanostructure parts is guaranteed.

Author Contributions

Conceptualization, M.Z.; Data Curation, M.Z.; Formal Analysis, M.Z.; Funding Acquisition, Y.X.; Investigation, M.Z.; Methodology, M.Z.; Project Administration, Y.X.; Supervision, Y.X.; Visualization, M.Z.; Writing—Original Draft, M.Z. and Y.X.; Writing—Review & Editing, M.Z. and Y.X.

Funding

This study was supported by the National Natural Science Funds of China (No. 51365038) and the College Science and Technology Project of the Government of Jiangxi Province (No. KJLD12058).

Acknowledgments

The financial support from the National Natural Science Funds of China (No. 51365038) and College Science and Technology Project of the Government of Jiangxi Province (No. KJLD12058) are gratefully acknowledged. We would like to express our gratitude to the Shenzhen Cloud computing center for computing support and help. We also appreciate the efforts by the Journal Editor for editing this paper.

Conflicts of Interest

The authors declare no conflict of interest.

References

  1. Jiang, B.; Zhou, M.; Weng, C.; Zhang, L.; Lv, H. Fabrication of nanopillar arrays by combining electroforming and injection molding. Int. J. Adv. Manuf. Technol. 2016, 86, 1319–1328. [Google Scholar] [CrossRef]
  2. Yang, C.; Su, L.; Huang, C.; Huang, H.-X.; Castro, J.M.; Yi, A.Y. Effect of packing pressure on refractive index variation in injection molding of precision plastic optical lens. Adv. Polym. Technol. 2011, 30, 51–61. [Google Scholar] [CrossRef]
  3. Wang, X.; Gu, J.; Shen, C.; Wang, X. Warpage optimization with dynamic injection molding technology and sequential optimization method. Int. J. Adv. Manuf. Technol. 2015, 78, 177–187. [Google Scholar] [CrossRef]
  4. Lin, H.Y.; Chang, C.H.; Young, W.B. Experimental and analytical study on filling of nano structures in micro injection molding. Int. Commun. Heat Mass Transf. 2010, 37, 1477–1486. [Google Scholar] [CrossRef]
  5. Rytka, C.; Kristiansen, P.M.; Neyer, A. Iso- and variothermal injection compression moulding of polymer micro- and nanostructures for optical and medical applications. J. Micromech. Microeng. 2015, 25, 065008. [Google Scholar] [CrossRef]
  6. Stormonth-Darling, J.M.; Saeed, A.; Reynolds, P.M.; Gadegaard, N. Injection Molding Micro- and Nanostructures in Thermoplastic Elastomers. Macromol. Mater. Eng. 2016, 301, 964–971. [Google Scholar] [CrossRef] [Green Version]
  7. Maghsoudi, K.; Jafari, R.; Momen, G.; Farzaneh, M. Micro-nanostructured polymer surfaces using injection molding: A review. Mater. Today Commun. 2017, 13, 126–143. [Google Scholar] [CrossRef]
  8. Madsen, J.S.; Jensen, S.A.; Nakotte, L.; Vogelsang, A.; Thamdrup, L.H.; Czolkos, I.; Johansson, A.; Garnaes, J.; Nielsen, T.; Nygard, J.; et al. Scatterometry for optimization of injection molded nanostructures at the fabrication line. Int. J. Adv. Manuf. Technol. 2018, 99, 2669–2676. [Google Scholar] [CrossRef]
  9. Zhou, M.; Xiong, X.; Jiang, B.; Weng, C. Fabrication of high aspect ratio nanopillars and micro/nano combined structures with hydrophobic surface characteristics by injection molding. Appl. Surf. Sci. 2018, 427, 854–860. [Google Scholar] [CrossRef]
  10. Macintyre, D.; Thoms, S. The fabrication of high resolution features by mould injection. Microelectron. Eng. 1998, 41–42, 211–214. [Google Scholar] [CrossRef]
  11. Pranov, H.; Rasmussen, H.K.; Larsen, N.B.; Gadegaard, N. On the injection molding of nanostructured polymer surfaces. Polym. Eng. Sci. 2006, 46, 160–171. [Google Scholar] [CrossRef]
  12. Wang, G.; Hui, Y.; Zhang, L.; Zhao, G. Research on temperature and pressure responses in the rapid mold heating and cooling method based on annular cooling channels and electric heating. Int. J. Heat Mass Transf. 2018, 116, 1192–1203. [Google Scholar] [CrossRef]
  13. Hattori, S.; Nagato, K.; Hamaguchi, T.; Nakao, M. Rapid injection molding of high-aspect-ratio nanostructures. Microelectron. Eng. 2010, 87, 1546–1549. [Google Scholar] [CrossRef]
  14. Lin, H.Y.; Chang, C.H.; Young, W.B. Experimental Study on the Filling of Nano Structures with Infrared Mold Surface Heating. Int. Polym. Proc. 2011, 26, 73–81. [Google Scholar] [CrossRef]
  15. Ling, C.; Liang, X.; Fan, F.; Yang, Z. Diffusion behavior of the model diesel components in different polymer membranes by molecular dynamic simulation. Chem. Eng. Sci. 2012, 84, 292–302. [Google Scholar] [CrossRef]
  16. Shi, M.; Zhang, Y.; Cheng, L.; Jiao, Z.; Yang, W.; Tan, J.; Ding, Y. Interfacial Diffusion and Bonding in Multilayer Polymer Films: A Molecular Dynamics Simulation. J. Phys. Chem. B 2016, 120, 10018–10029. [Google Scholar] [CrossRef]
  17. Yang, S.; Yu, S.; Cho, M. Influence of mold and substrate material combinations on nanoimprint lithography process: MD simulation approach. Appl. Surf. Sci. 2014, 301, 189–198. [Google Scholar] [CrossRef]
  18. Paul, W. Molecular dynamics simulations of the glass transition in polymer melts. Polymer 2004, 45, 3901–3905. [Google Scholar] [CrossRef]
  19. Zhou, M.; Jiang, B.; Weng, C. Molecular dynamics study on polymer filling into nano-cavity by injection molding. Comput. Mater. Sci. 2016, 120, 36–42. [Google Scholar] [CrossRef]
  20. Zhou, M.; Xiong, X.; Drummer, D.; Jiang, B. Interfacial interaction and joining property of direct injection-molded polymer-metal hybrid structures: A molecular dynamics simulation study. Appl. Surf. Sci. 2019, 478, 680–689. [Google Scholar] [CrossRef]
  21. Jiang, B.; Zhou, M.; Lu, L.; Weng, C. Molecular dynamic simulation of injection molded nanostructures. Polym. Mater. Sci. Eng. 2015, 31, 122–126. [Google Scholar]
  22. Sun, H. COMPASS: An ab Initio Force-Field Optimized for Condensed-Phase Applications Overview with Details on Alkane and Benzene Compounds. J. Phys. Chem. B 1998, 102, 7338–7364. [Google Scholar] [CrossRef]
  23. Fox, T.G.; Flory, P.J. Second-Order Transition Temperatures and Related Properties of Polystyrene. I. Influence of Molecular Weight. J. Appl. Phys. 1950, 21, 581–591. [Google Scholar] [CrossRef]
  24. Fox, T.G.; Flory, P.J. The glass temperature and related properties of polystyrene. Influence of molecular weight. J. Polym. Sci. 1954, 14, 315–319. [Google Scholar] [CrossRef] [Green Version]
  25. Rohling, J.H.; Medina, A.N.; Bento, A.C.; Pereira, J.R.D.; Rubira, A.F.; Baesso, M.L.; Miranda, L.C.M. Differential thermal lens temperature scanning approach to glass transition analysis in polymers: Application to polycarbonate. J. Phys. D Appl. Phys. 2001, 34, 407–412. [Google Scholar] [CrossRef]
  26. Sha, B.; Dimov, S.; Griffiths, C.; Packianather, M.S. Investigation of micro-injection moulding: Factors affecting the replication quality. J. Mater. Process. Technol. 2007, 183, 284–296. [Google Scholar] [CrossRef]
  27. Zhang, L.; Tian, S.; Peng, T. Molecular Simulations of Sputtering Preparation and Transformation of Surface Properties of Au/Cu Alloy Coatings Under Different Incident Energies. Metals 2019, 9, 259. [Google Scholar] [CrossRef]
  28. Pan, F.; Peng, F.; Jiang, Z. Diffusion behavior of benzene/cyclohexane molecules in poly (vinyl alcohol)-graphite hybrid membranes by molecular dynamics simulation. Chem. Eng. Sci. 2007, 62, 703–710. [Google Scholar] [CrossRef]
  29. Abiad, M.G.; Carvajal, M.T.; Campanella, O.H. A review on methods and theories to describe the glass transition phenomenon: Applications in food and pharmaceutical products. Food Eng. Rev. 2009, 1, 105–132. [Google Scholar] [CrossRef]
  30. Fang, X.; Vitrac, O. Predicting diffusion coefficients of chemicals in and through packaging materials. Crit. Rev. Food Sci. Nutr. 2015, 57, 275–312. [Google Scholar] [CrossRef]
  31. De Gennes, P.G. Kinetics of diffusion-controlled processes in dense polymer systems. II. Effects of entanglements. J. Chem. Phys. 1982, 76, 3322–3326. [Google Scholar] [CrossRef]
  32. De Gennes, P.G. Reptation of a Polymer Chain in the Presence of Fixed Obstacles. J. Chem. Phys. 1971, 55, 572–579. [Google Scholar] [CrossRef]
  33. Li, Y.; Abberton, B.C.; Kroeger, M.; Liu, W.K. Challenges in Multiscale Modeling of Polymer Dynamics. Polymers 2013, 5, 751–832. [Google Scholar] [CrossRef] [Green Version]
  34. Reis, R.A.; Silva, F.C.; Nobrega, R.; Oliveira, J.V.; Tavares, F.W. Molecular dynamics simulation data of self-diffusion coefficient for Lennard–Jones chain fluids. Fluid Phase Equilib. 2004, 221, 25–33. [Google Scholar] [CrossRef]
  35. Durand, M.; Meyer, H.; Benzerara, O.; Baschnagel, J.; Vitrac, O. Molecular dynamics simulations of the chain dynamics in monodisperse oligomer melts and of the oligomer tracer diffusion in an entangled polymer matrix. J. Chem. Phys. 2010, 132, 194902. [Google Scholar] [CrossRef]
Figure 1. Simulation models. The blue lines indicate the simulation cell. (a) Short-chain polycarbonate (PC) model; (b) interface model between short-chain polymer and nickel mold insert; (c) long-chain PC model; and (d) interface model between long-chain polymer and nickel mold insert.
Applsci 09 01683 g001
Figure 2. Specific volume versus temperature for chain polycarbonates (PCs) of different chain lengths.
Applsci 09 01683 g002
Figure 3. Concentration profile of PC atoms in conventional injection molding (CIM) and rapid heat cycle molding (RHCM) at the end of the filling stage. The distance between 2.2 and 3.4 nm is the depth of mold cavity. C and R in graphs indicate CIM and RHCM, respectively.
Applsci 09 01683 g003
Figure 4. Concentration profile of PC atoms in CIM and RHCM at the end of the packing stage. The distance between 2.2 and 3.4 nm is the depth of mold cavity. C and R in graphs indicate CIM and RHCM, respectively.
Applsci 09 01683 g004
Figure 5. The change curve of interface binding energy with time.
Applsci 09 01683 g005
Figure 6. Filling rate of nanostructures during the packing stage.
Applsci 09 01683 g006
Figure 7. The filling morphological evolution of polymers in the nanostructures at different pressures during the packing stage.
Applsci 09 01683 g007
Figure 8. The mean square displacement (MSD) curve of the long-chain PC system in the packing stage.
Applsci 09 01683 g008
Table 1. Energy between long-chain PC and the nickel mold insert at the end of the filling stage (kJ·mol−1).
ECIMRHCM
PC/NiPCNiEinterPC/NiPCNiEinter
Etotal−1,801,3557602−1,808,100−857−1,775,84019,366−1,794,160−1046
Enonbond−1,820,032−11,075−1,808,100−857−1,804,925−9719−1,794,160−1046
EvdW−1,803,1365821−1,808,100−857−1,788,2136993−1,794,160−1046
Eelectrostatic−16,897−16,89700−16,712−16,71200

