Article

Investigation of Properties Alternation during Super-Critical CO2 Injection in Shale

1
Department of Petroleum Engineering, University of North Dakota, Grand Forks, ND 58202, USA
2
Department of Chemistry, University of North Dakota, Grand Forks, ND 58202, USA
3
Department of Chemical and Petroleum Engineering, University of Kansas, Lawrence, KS 66045, USA
*
Author to whom correspondence should be addressed.
Appl. Sci. 2019, 9(8), 1686; https://doi.org/10.3390/app9081686
Submission received: 2 April 2019 / Revised: 20 April 2019 / Accepted: 22 April 2019 / Published: 24 April 2019
(This article belongs to the Section Earth Sciences)

Abstract

:
The low recovery of oil from tight liquid-rich formations is still a major challenge for a tight reservoir. Thus, supercritical CO2 flooding was proposed as an immense potential recovery method for production improvement. While up to date, there have been few studies to account for the formation properties’ variation during the CO2 Enhanced Oil Recovery (EOR) process, especially investigation at the micro-scale. This work conducted a series of measurements to evaluate the rock mechanical change, mineral alteration and the pore structure properties’ variation through the supercritical CO2 (Sc-CO2) injection process. Corresponding to the time variation (0 days, 10 days, 20 days, 30 days and 40 days), the rock mechanical properties were analyzed properly through the nano-indentation test, and the mineralogical alterations were quantified through X-ray diffraction (XRD). In addition, pore structures of the samples were measured through the low-temperature N2 adsorption tests. The results showed that, after Sc-CO2 injection, Young’s modulus of the samples decreases. The nitrogen adsorption results demonstrated that, after the CO2 injection, the mesopore volume of the sample would change as well as the specific Brunauer–Emmett–Teller (BET) surface area which could be aroused from the chemical reactions between the CO2 and some authigenic minerals. XRD analysis results also indicated that mesopore were altered due to the chemical reaction between the injected Sc-CO2 and the minerals.

1. Introduction

The boom of Bakken formation in North America is limited by the effective recovery method even with the recent advancement of hydraulic fracturing and horizontal drilling technology utilization [1]. Since then, the CO2 flooding method has been proposed as the potential way to increase the recovery factor for the unconventional shale reservoir in the Bakken formation, especially combined with the advanced water-alternating-gas (CO2-WAG) and CO2 huff and puff technologies [2,3,4,5,6,7]. Meanwhile, the injection of the supercritical CO2 into the shale and coal bed methane reservoir would assist the emission reduction of greenhouse gases [8,9,10]. However, the Sc-CO2 injection process may change the mechanical properties such as the Young’s modulus and hardness [11,12,13]. Meanwhile, the physical nature of the rock such as pore structure and pore size will alter with CO2 adsorption [12], let alone the mineral components varied mainly due to the chemical reaction [14]. Therefore, it is critical to investigate and evaluate the properties’ alteration of the Bakken shale which is being treated with Sc-CO2 injection.
To date, many researches had focused on the investigation of the effect of Sc-CO2 to the shale. Raza et al. [14] examined the shale from Gippslan Basin, Australia, and characterized the shale sealing efficiency as the caprock. They found that several chemical reactions between the rock-forming minerals and the brine-Sc-CO2 system occurred. Busch et al. [15] also investigated the shale from Australia and stated that the geophysical properties, such as the shale porosity, permeability and diffusion nature were significantly affected by the carbonate dissolution behavior by Sc-CO2 adsorption. Qiao et al. [16] conducted several lab tests to investigate the mechanical properties alteration of a low-clay shale which acquired from Sichuan Basin, China. They illustrated that both the subcritical and supercritical CO2 soaking processes can decrease the rock strength while enhancing the shale ductility. Lahann et al. [17] investigated the variation in pore structure of the shale treated with Sc-CO2. They identified that the temperature will have the positive effect on the specific surface area increment of shale under the Sc-CO2 environment. Xiang et al. [18] studied the structural and chemical properties of the shale by conducting four types of instrumental analysis after the Sc-CO2 soaking procedure. They believed that the Sc-CO2 treatment reduced the shale strength and altered the mineral content of the shale. Jiang et al. [19] demonstrated the specific surface area and porosity of the shale samples were changed with the Sc-CO2 treatment, which relies heavily on the variation of pore structure and permeability caused by the Sc-CO2 adsorption.
To the best of our knowledge, research on the corrosion effect in Middle Bakken shale by Sc-CO2 injection is very scarce, and the pore structure and strength of shale under Sc-CO2 treatment is not well understood. Therefore, the main objective of this research was to assess mechanical, physical and mineralogical alteration of Middle Bakken shale samples exposed to Sc-CO2 under various adsorption durations. Instead of the macroscale tests that most researchers applied to analyze the mechanical property changes during the Sc-CO2 adsorption, in this study, the advanced nano-indentation test was applied to test the Young’s Modulus. The low-temperature N2 adsorption test was conducted to analysis the pore structure and pore size properties. X-ray diffraction (XRD) was utilized to investigate the mineral content of the samples. This study is significant for the CO2 storage and migration after being injected into reservoir. Chemical reactions among CO2, water, and minerals change the pore systems and thus alter rock petrophysical and geomechanical properties, which are not only crucial to the storage capacity of reservoirs but also are vital to the rocks’ ability to trap CO2 over a long geological time. The study can provide a guideline for storage sites or reservoir selection and can be a reference to predict the evolution of trap capacity. Therefore, necessary measures can be taken to limit or alleviate possible CO2 seepage.

2. Materials and Methods

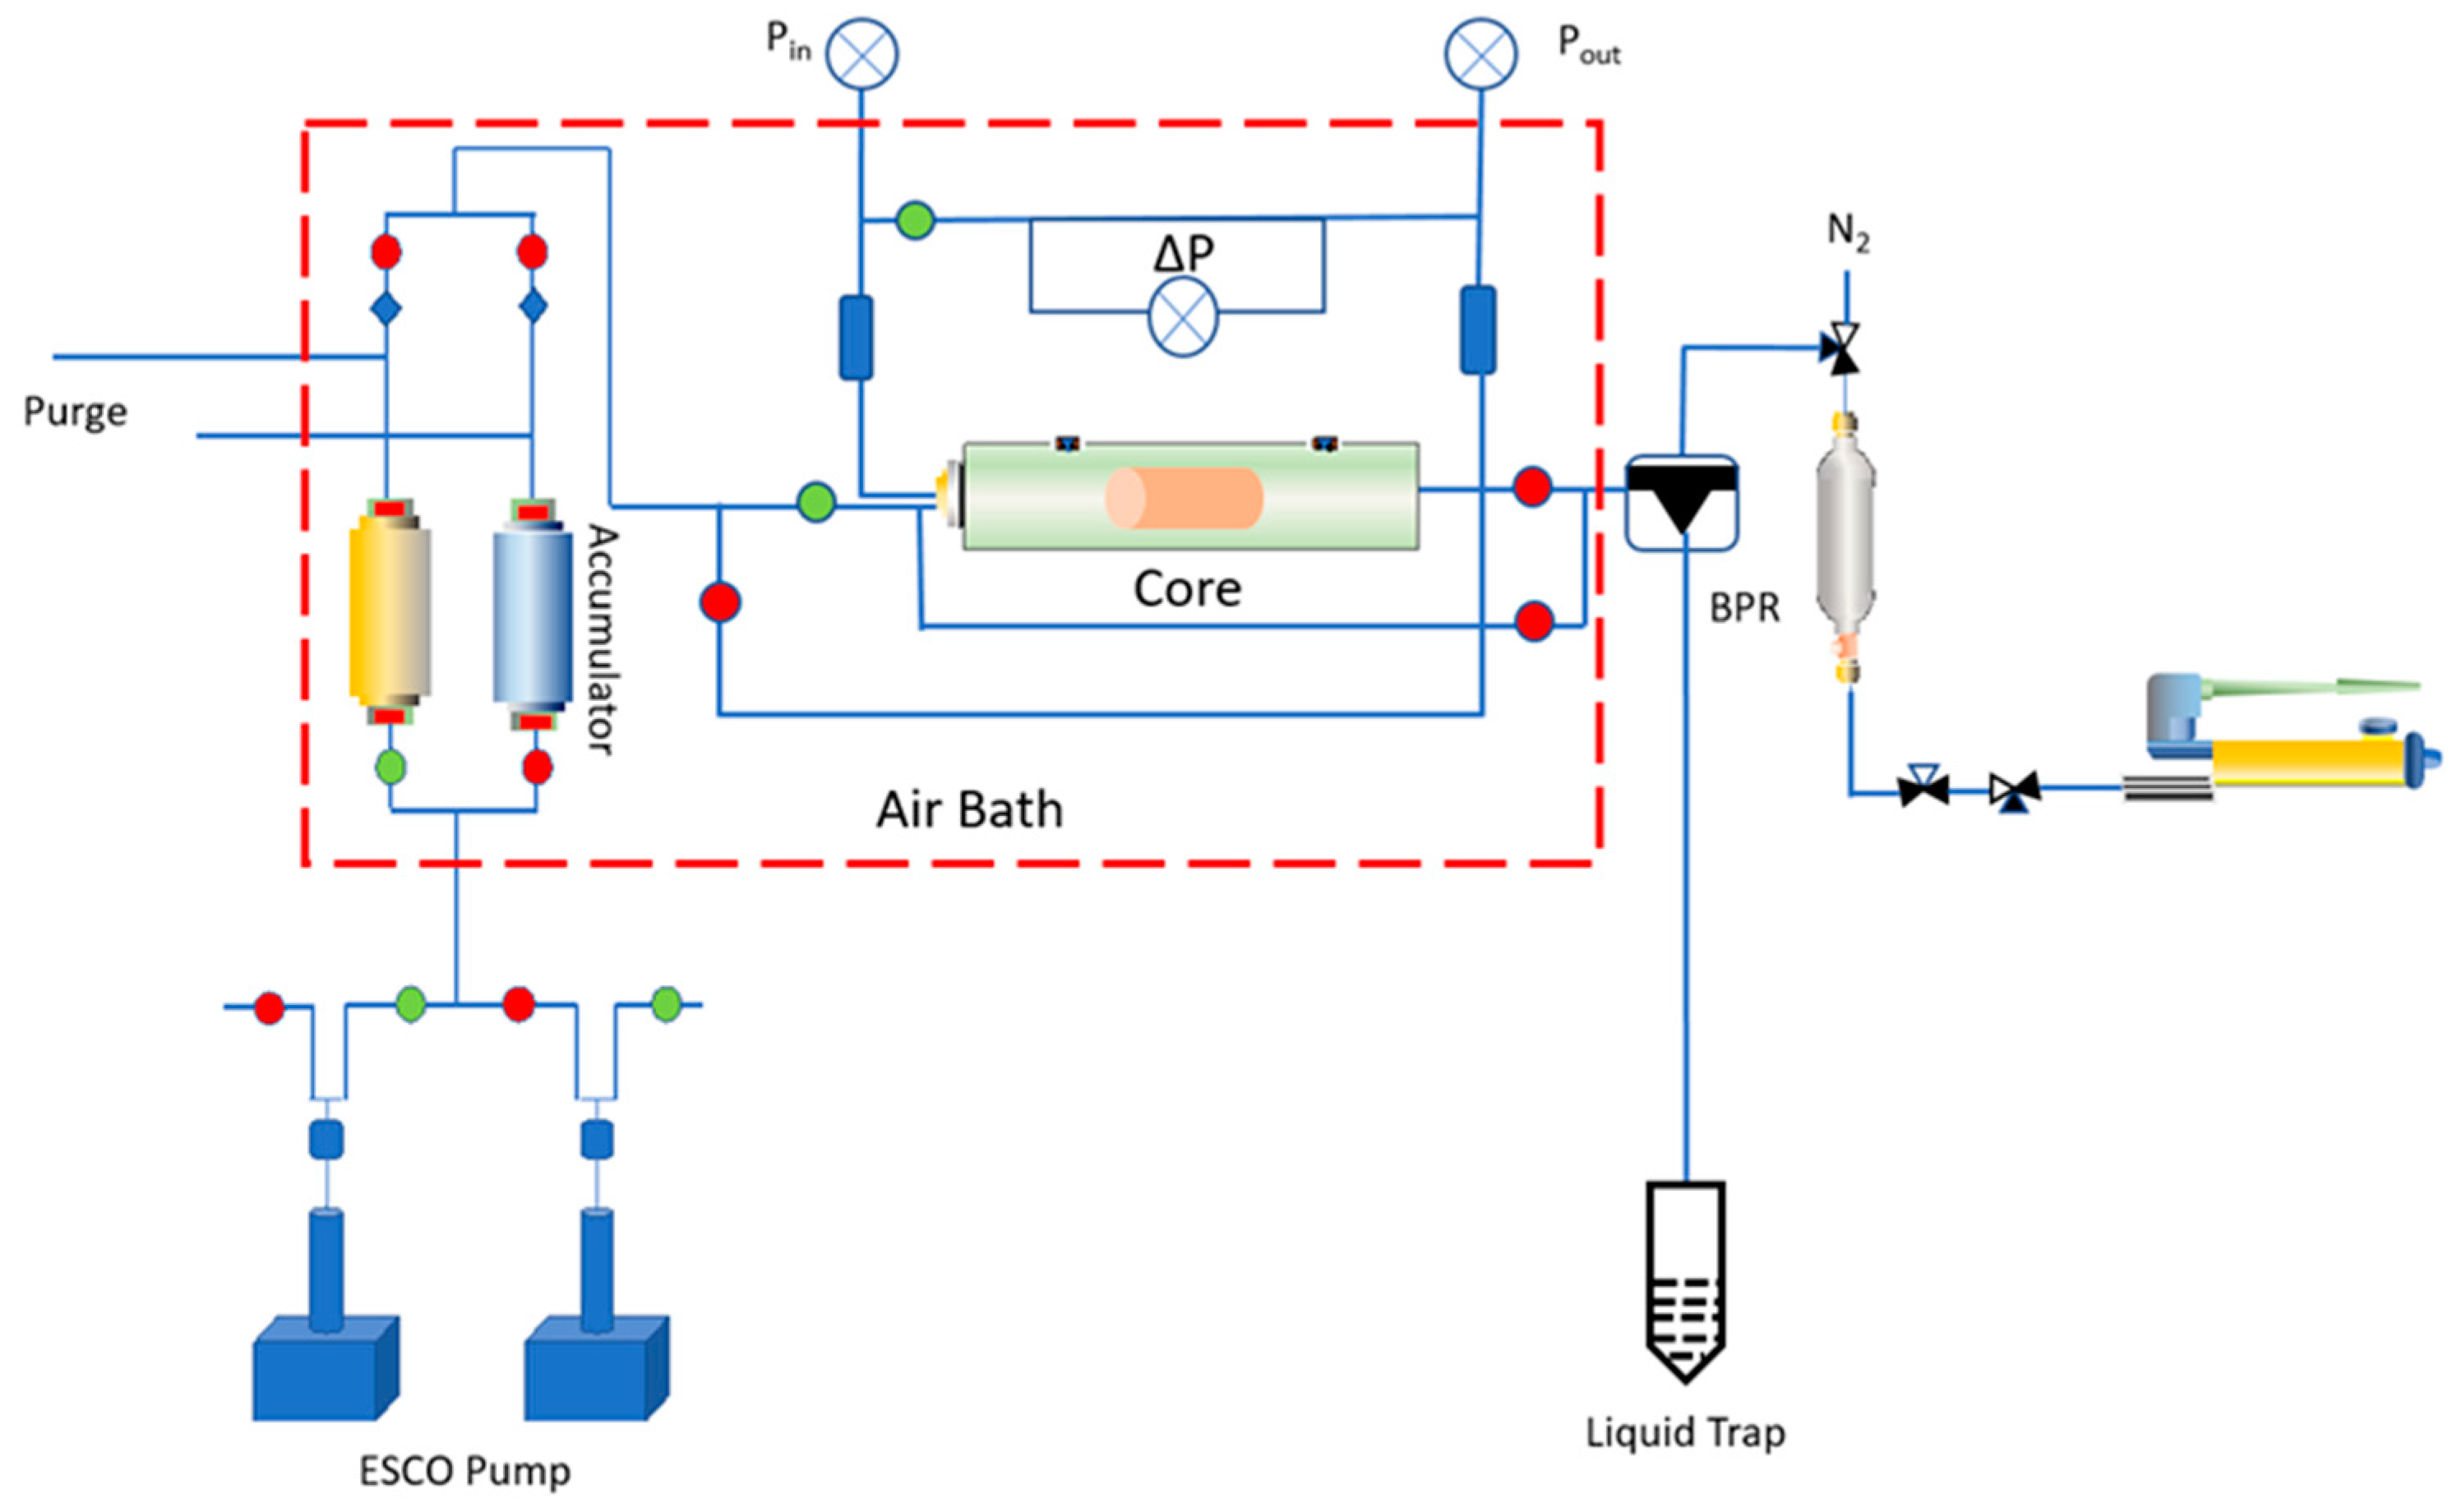
2.1. Sample Preparation

The main production unit in Bakken formation was location in the Middle Bakken layer. In this study, two core plugs with different depth (9848 ft and 9850 ft) (as received) were collected from the Middle Bakken formation in order to conduct the primary supercritical CO2 flooding test. The core samples are from the well located in the Sanish field, North Dakota. Those samples we collected are in the low porosity and permeability range. The porosity values of Sample 1 and Sample 2 are 6.3% and 5.1%, respectively, while the permeability of these two samples was less than 0.01 mD before the test. The schematic diagram of the Sc-CO2 flooding system is shown in Figure 1. The core plug covered with sleeve was placed into the core holder, then the syringeESCO pump supplied the pressure source to maintain the constant injection pressure (1500 psi) through the core plug from upstream to the downstream. The N2 was applied to maintain the function of the back-pressure regulator (BPR), which is control the back pressure above capillary pressure (Pc). The operating temperature was set to 40 °C in order to assure that the CO2 passing through core holder was in the super-critical phase when the operating pressure was maintained at 1500 psi. The different injection durations were set as 0 (Before the CO2 injection), 10, 20, 30, and 40 days. In each time slot, some small chips were sliced from the Sc-CO2 treated core plug for the further analysis.

2.2. Properties Analysis Test

Pieces of the core chips were pretreated for the following properties analysis. The nano-indentation test was run to study the rock mechanical properties alteration. In this paper, we applied the TI-700 Ubi1 Nano-mechanical indenter (Hysitron, INC., Minneapolis, MN, USA, 2016) equipped with the fused quartz calibration plaque to conduct the nano-indentation tests. To prepare the sample specimens for the nano-indentation test, the chosen chips were immersed into the resin liquid until the resin get solidified under vacuum conditions. The smoothness of the specimens’ surface is vital for obtaining the accurate results. Since then, the sample surface was rubbed by different grit size sandpaper, then followed with polishing the rough surface by diamond polisher under different grain sizes (6, 3, 1 microns). After being polished, the samples are dried for a few hours. Before the nanoindentation, the air gun was applied to clean the sample surface. Based on our previous experiments, after following these procedures, the surface roughness of the sample surface will be small which can be applied for the nanoindentation. Figure 2b represents the pretreated sample specimens ready for the Nano-indentation test.
The X-ray diffraction test was used to analyze the composition deformation of the Middle Bakken sample. Those series of samples analysis under different injection times were performed by using the Rigaku intelligent X-ray diffraction (XRD) system with the copper X-ray source. The samples were crushed by the McCrone micronising mill which can rapidly reduce samples size by a unique vibratory grinding action. The sample particles within the grinding vessel moves with respect to their neighbors to produce linear contact blows and planar shearing in the vessel. The samples were milled in to the powder-like status to pass through the 80-mesh screen for the future XRD analysis. Figure 2d presents the prepared sample powder after the pretreatments.
The evaluation of surface area, average pore size, pore volume, and pore size distribution of the analytic samples of powders and other porous solids can be characterized through studying gas adsorption and desorption behavior. Thus, the low-temperature N2 adsorption tests were conducted and the Quantachrome Autosorb-IQ used for this purpose. Table 1 illustrates the analysis parameters through the low-temperature N2 adsorption tests. During the test, samples were degassed at a relatively high temperature that can efficiently degas and evaporate the moisture from the samples and will not cause structural change. The evaporates were drawn out by a vacuum pump and condensed in a cold trap tube immersed in liquid nitrogen. A sample can be considered ready for analysis when the sample passes the degas test of no more than 10 microns Hg per minute. Figure 2f shows the sample powder ready for low-temperature N2 adsorption tests.

3. Results and Discussion

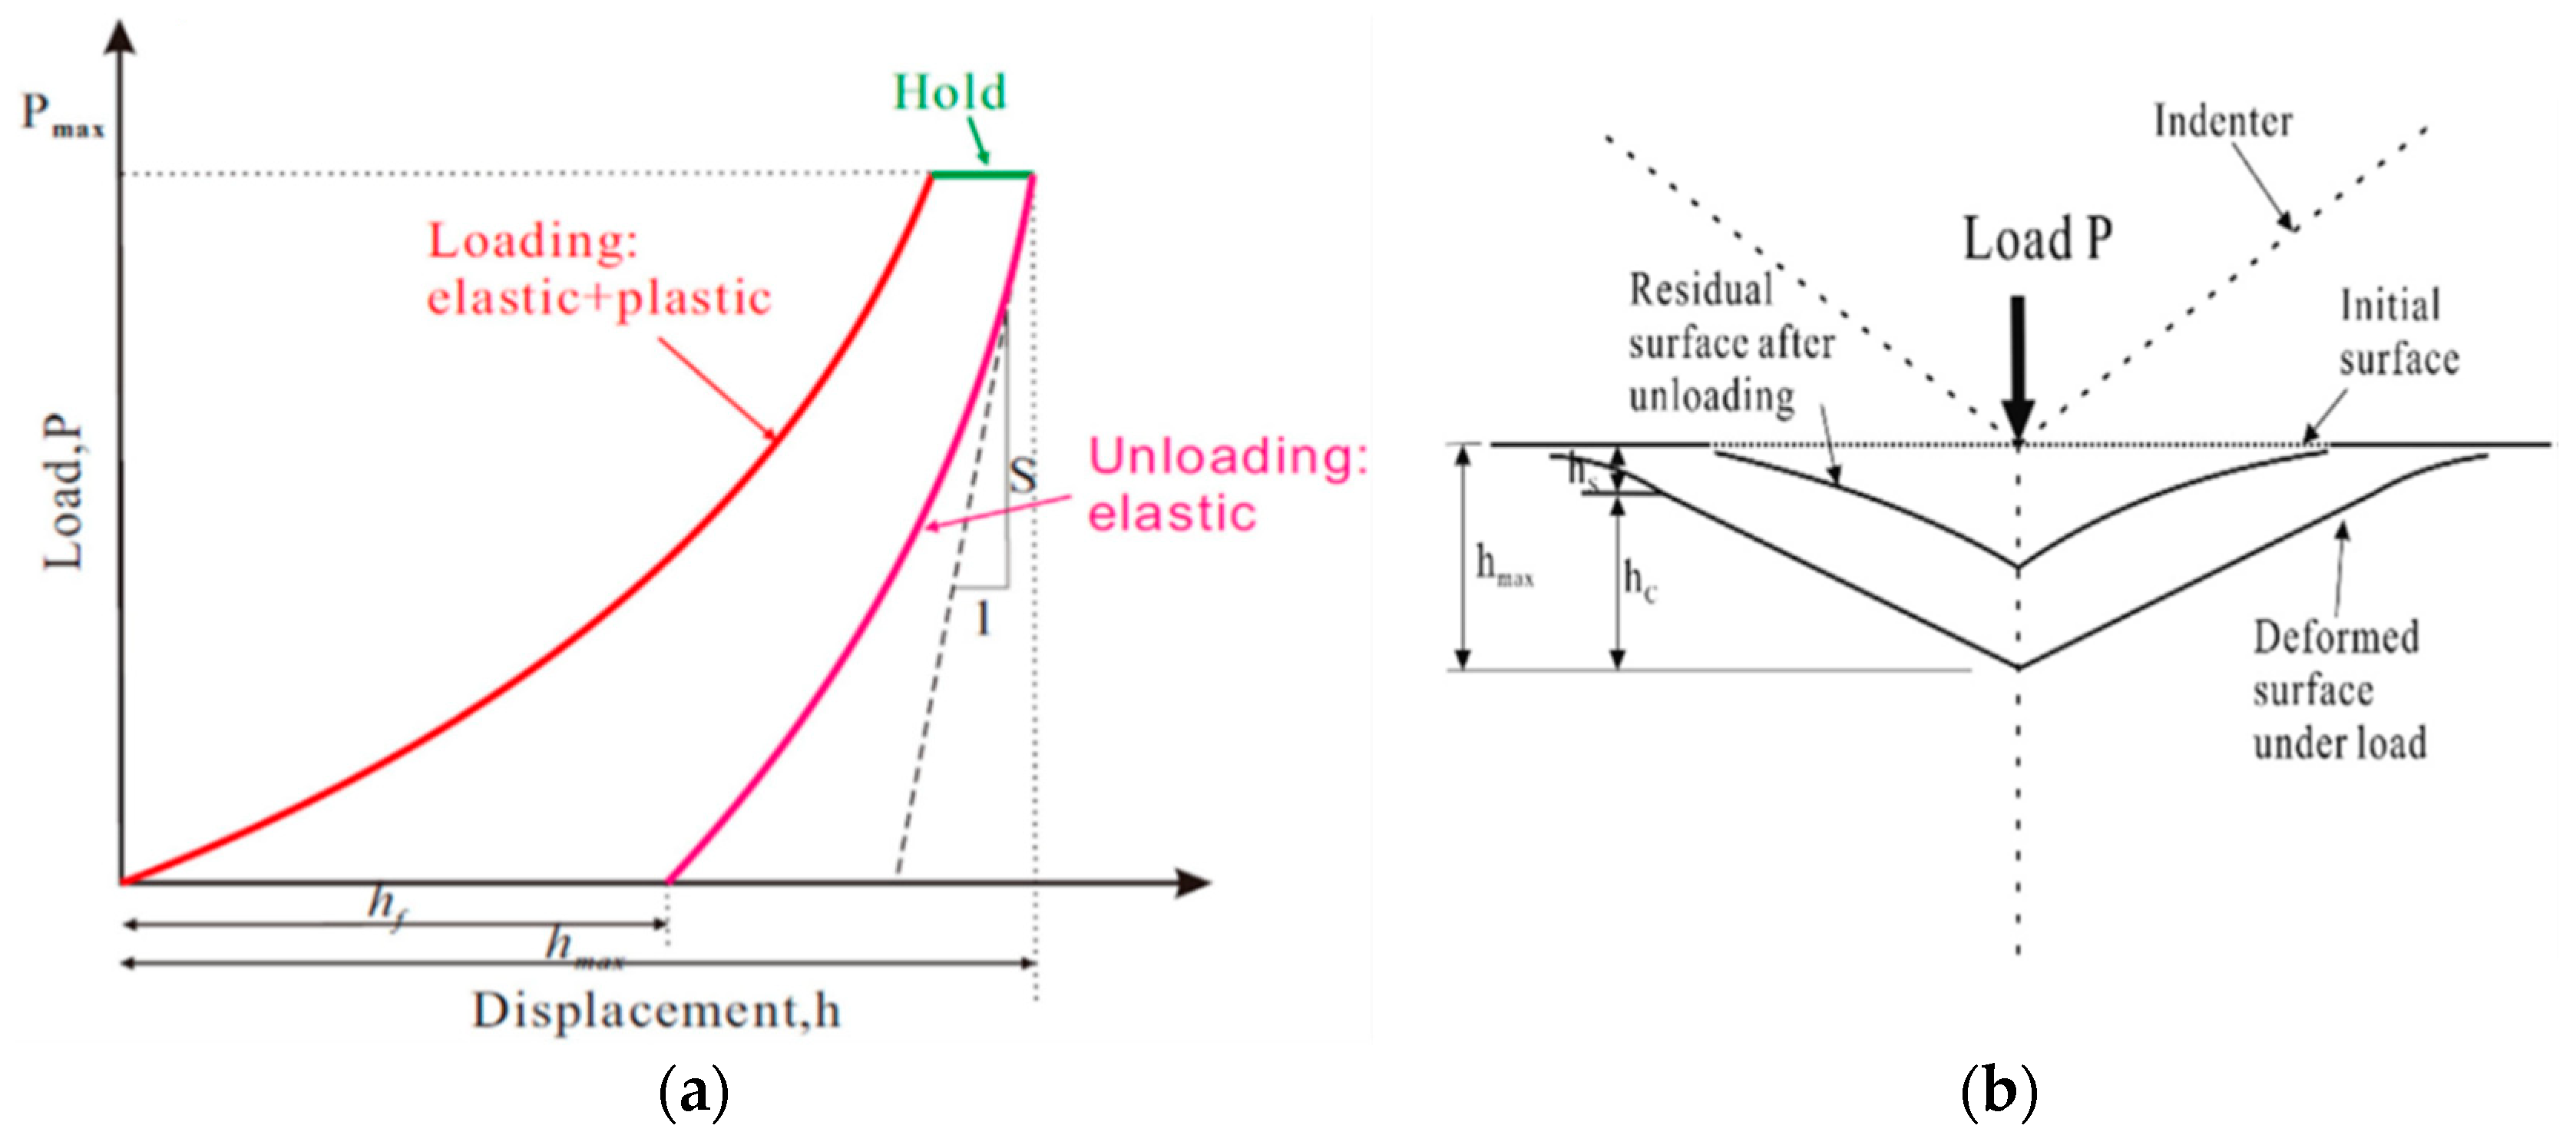
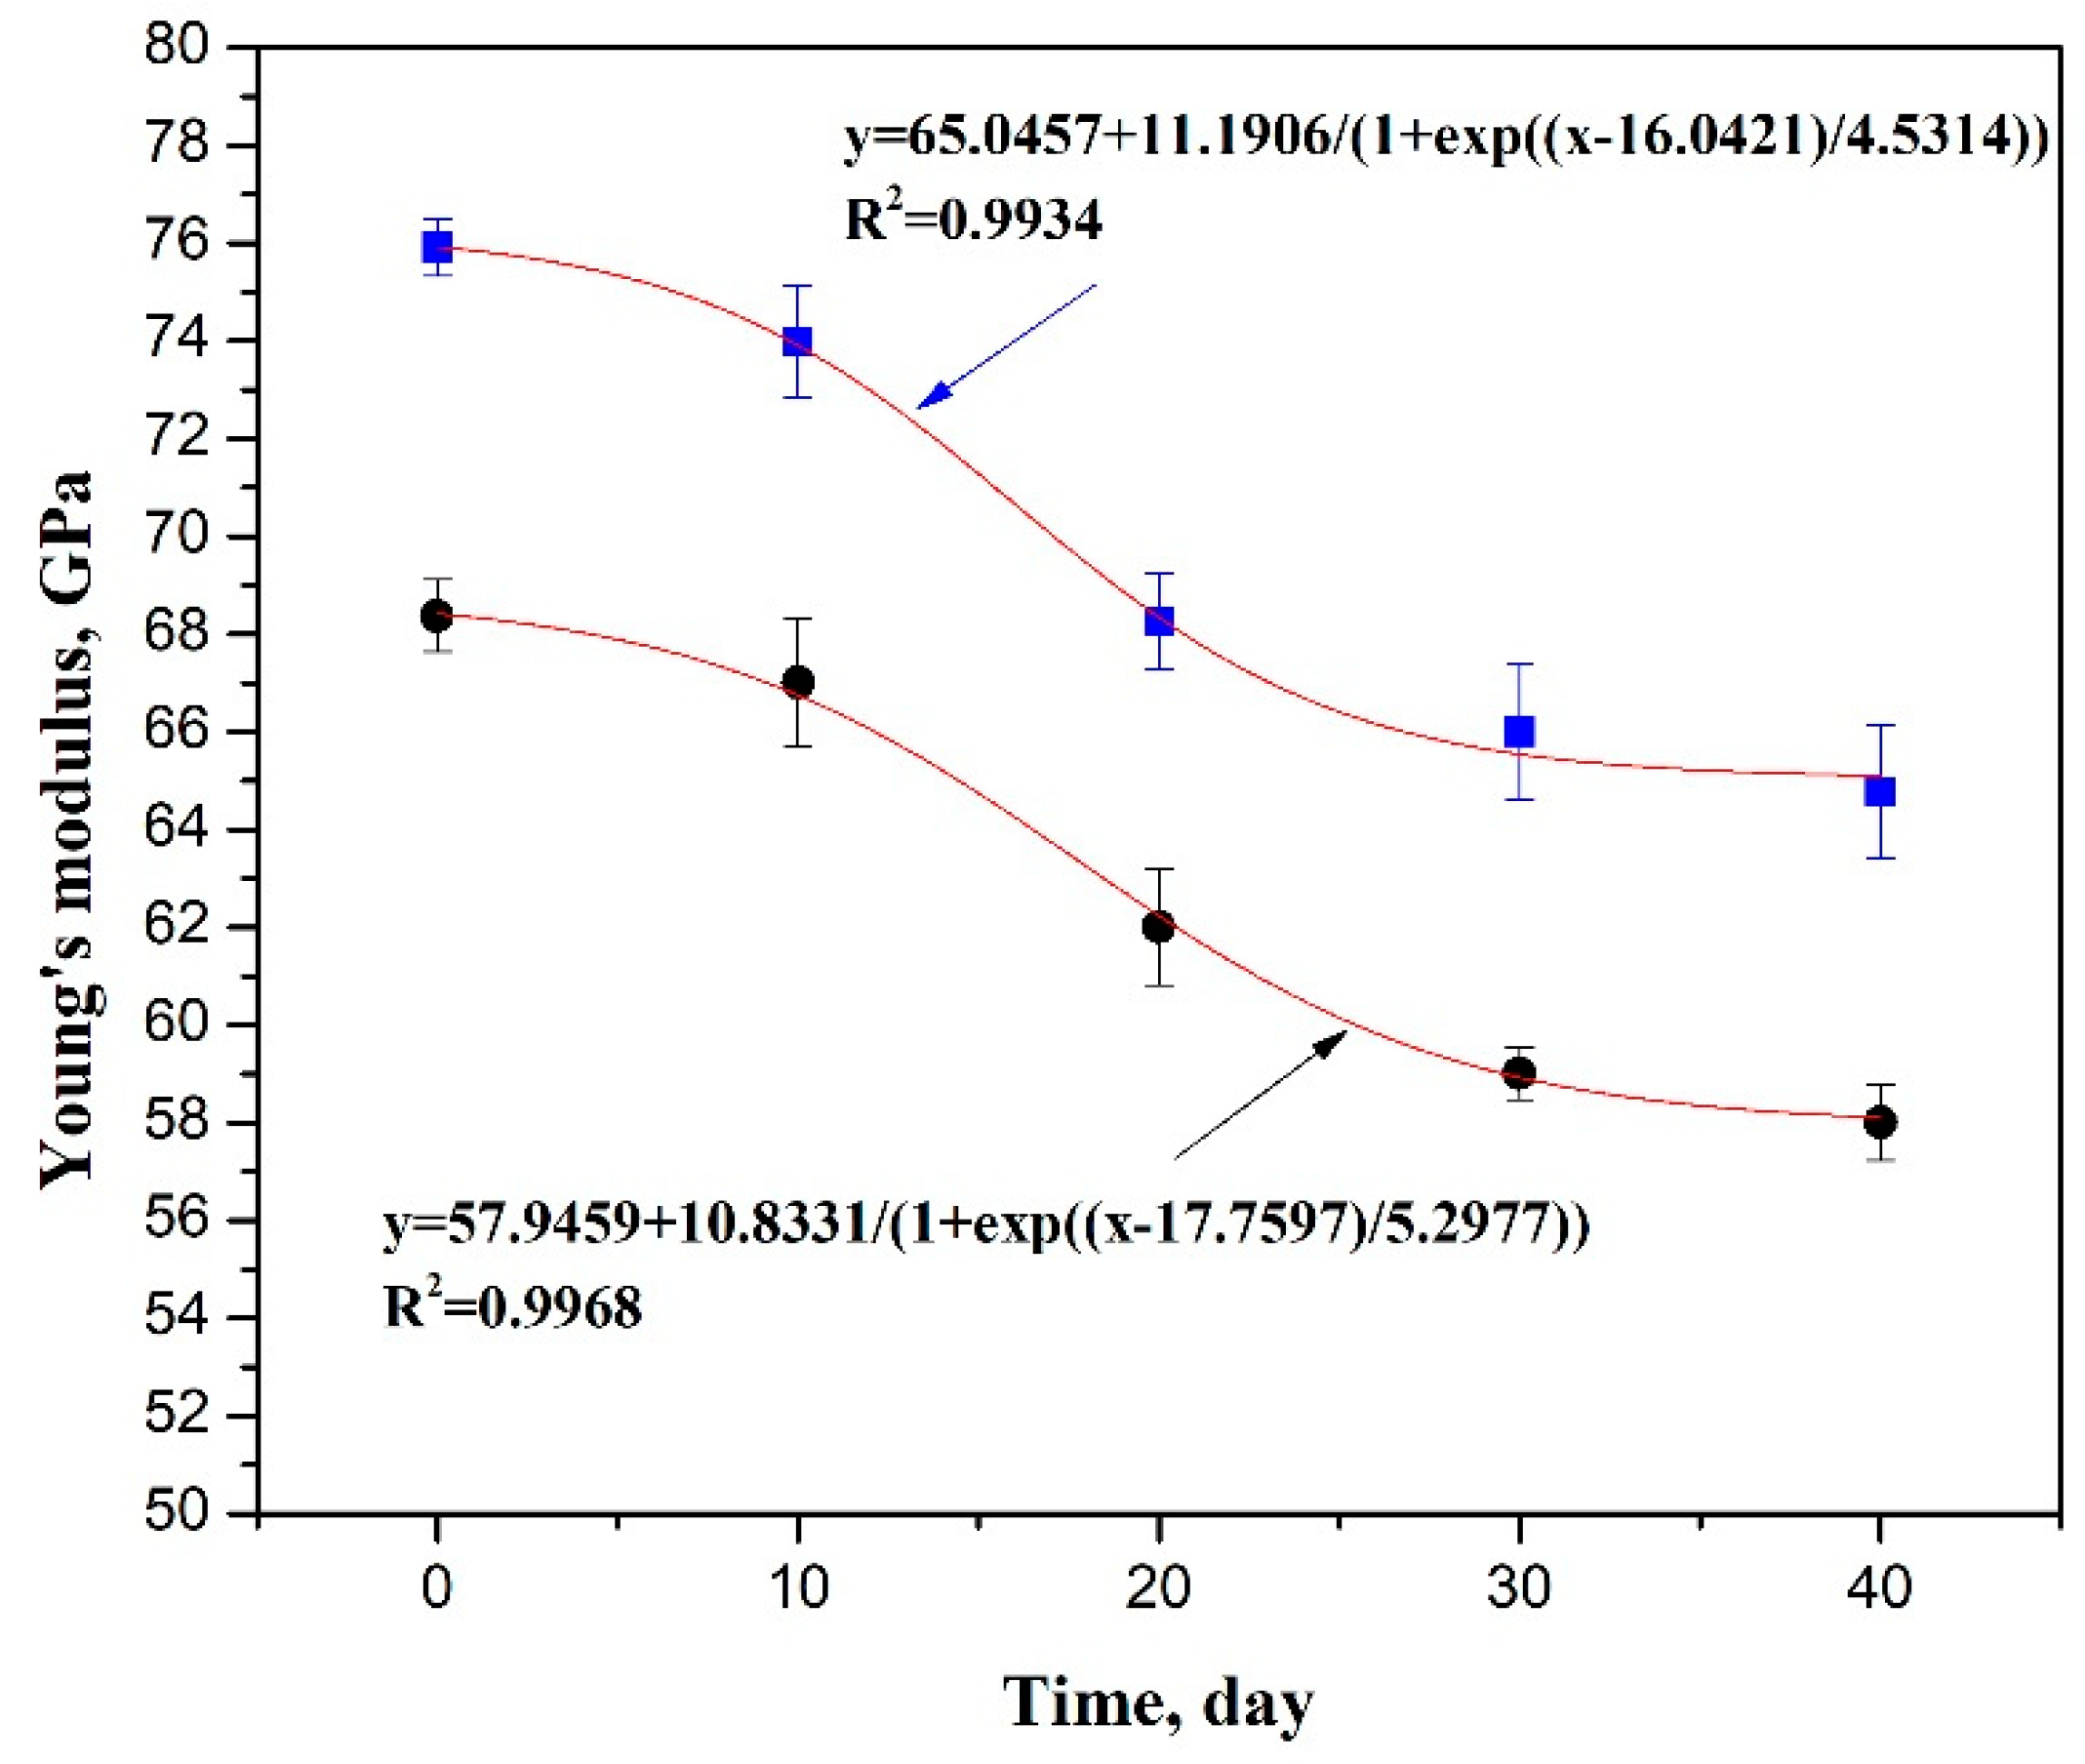
3.1. Mechanical Property Deformation

The mechanical properties alteration during the variable Sc-CO2 injection times is crucial for the formation of the evaluation process. Since that, we applied a most advanced equipment, the nano-indenter, to measure the Young’s modulus of the samples, which are the main mechanical properties for the rock. Nanoindentation test is considered as a unique technique whereby a sharp indenter tip is used to touch the smooth surface of the sample with a certain mode, then the penetration depth will be recorded along with the applied load [20]. Figure 3a illustrates the typical curve of the indentation test. Generally, the curve consists of three stages, which are the initial loading stage, medium-term holding stage, and following the unloading stage. For the initial loading stage, since the penetration depth get increased with the applied load increases it can be regarded as the association of elastic and plastic deformation; whereas at the unloading stage, it was assumed that the elastic deformation is the only recoverable parameter, which was applied to conduct the following calculation procedure of the rock mechanical properties. Figure 3b identified the standard unloading process of the nano-indentation test. In our test, the peak force that we applied is 6000 uN. The loading time, holding time and unloading time will be 5 s, 5 s, 5 s, respectively.
Figure 4 presents the effect of the Sc-CO2 injection time on the samples’ Young’s modulus value. It can be observed that the Young’s modulus tends to decrease gradually with the injection time increasing. The original sample from the two different depths, 9848 ft and 9850 ft, had the highest Young’s modulus of 75.91 GPa and 68.37 GPa, respectively. When the samples were flooded in the Sc-CO2 for 10 days, 20 days, 30 days and 40 days, for the first sample, the Young’s modulus value reduced 2.54% to 73.98 GPa, 10.082% to 68.26 GPa, 14.379% to 65.00 GPa, and 15.446% to 64.03 GPa, respectively. While for the second sample, the Young’s modulus value reduced 2.42% to 68.37 GPa, 10.274% to 61.35 GPa, 13.693% to 59.00 GPa, and 14.429% to 58.50 GPa, respectively. This may be caused by the Sc-CO2 adsorption behavior. As the samples adsorb more and more Sc-CO2 through the pore throat, the pore will get swelled, which contributes to the rock strength decrease. With the Sc-CO2 flooding time increase, the decline in the strength of the two core samples slacks off, which is mainly due to the ultra-low permeability of the Middle Bakken sample. By the curves interpreting, after 30 days of Sc-CO2 adsorption, both curves were observed to reach a stable status.
Some researchers obtained the relationship between the Young’s modulus (E) and the adsorption time for the Sc-CO2 injection to the sample with variable lithological character [16,23]. Based on the previous research, we fitted the data for the two samples with a Boltzmann sigmoid relationship between the Young’s modulus (E in GPa) and the Sc-CO2 injection time (t in days) by the curving fitting tool of OriginPro:
E = 65.0457 + 11.1906 / ( 1 + e t 16.0421 4.5314 )   ( Sample   Depth :   9848   ft )
E = 57.9459 + 10.8331 / ( 1 + e t 17.7597 5.2977 )   ( Sample   Depth :   9850   ft )
The R-squares are 0.9934 for the sample at depth of 9848 ft and 0.9968 for the sample at depth of 9850 ft, which shows the models and the experimental data are fitting very well. In general, a universal relationship between the Young’s modulus and Sc-CO2 injection time is organized as the following equation:
E = b + ( a b ) / ( 1 + e t c d t )
where, E is the Young’s modulus, t is the Sc-CO2 injection time. a, b and c are the constant which can be derived from curve fitting.

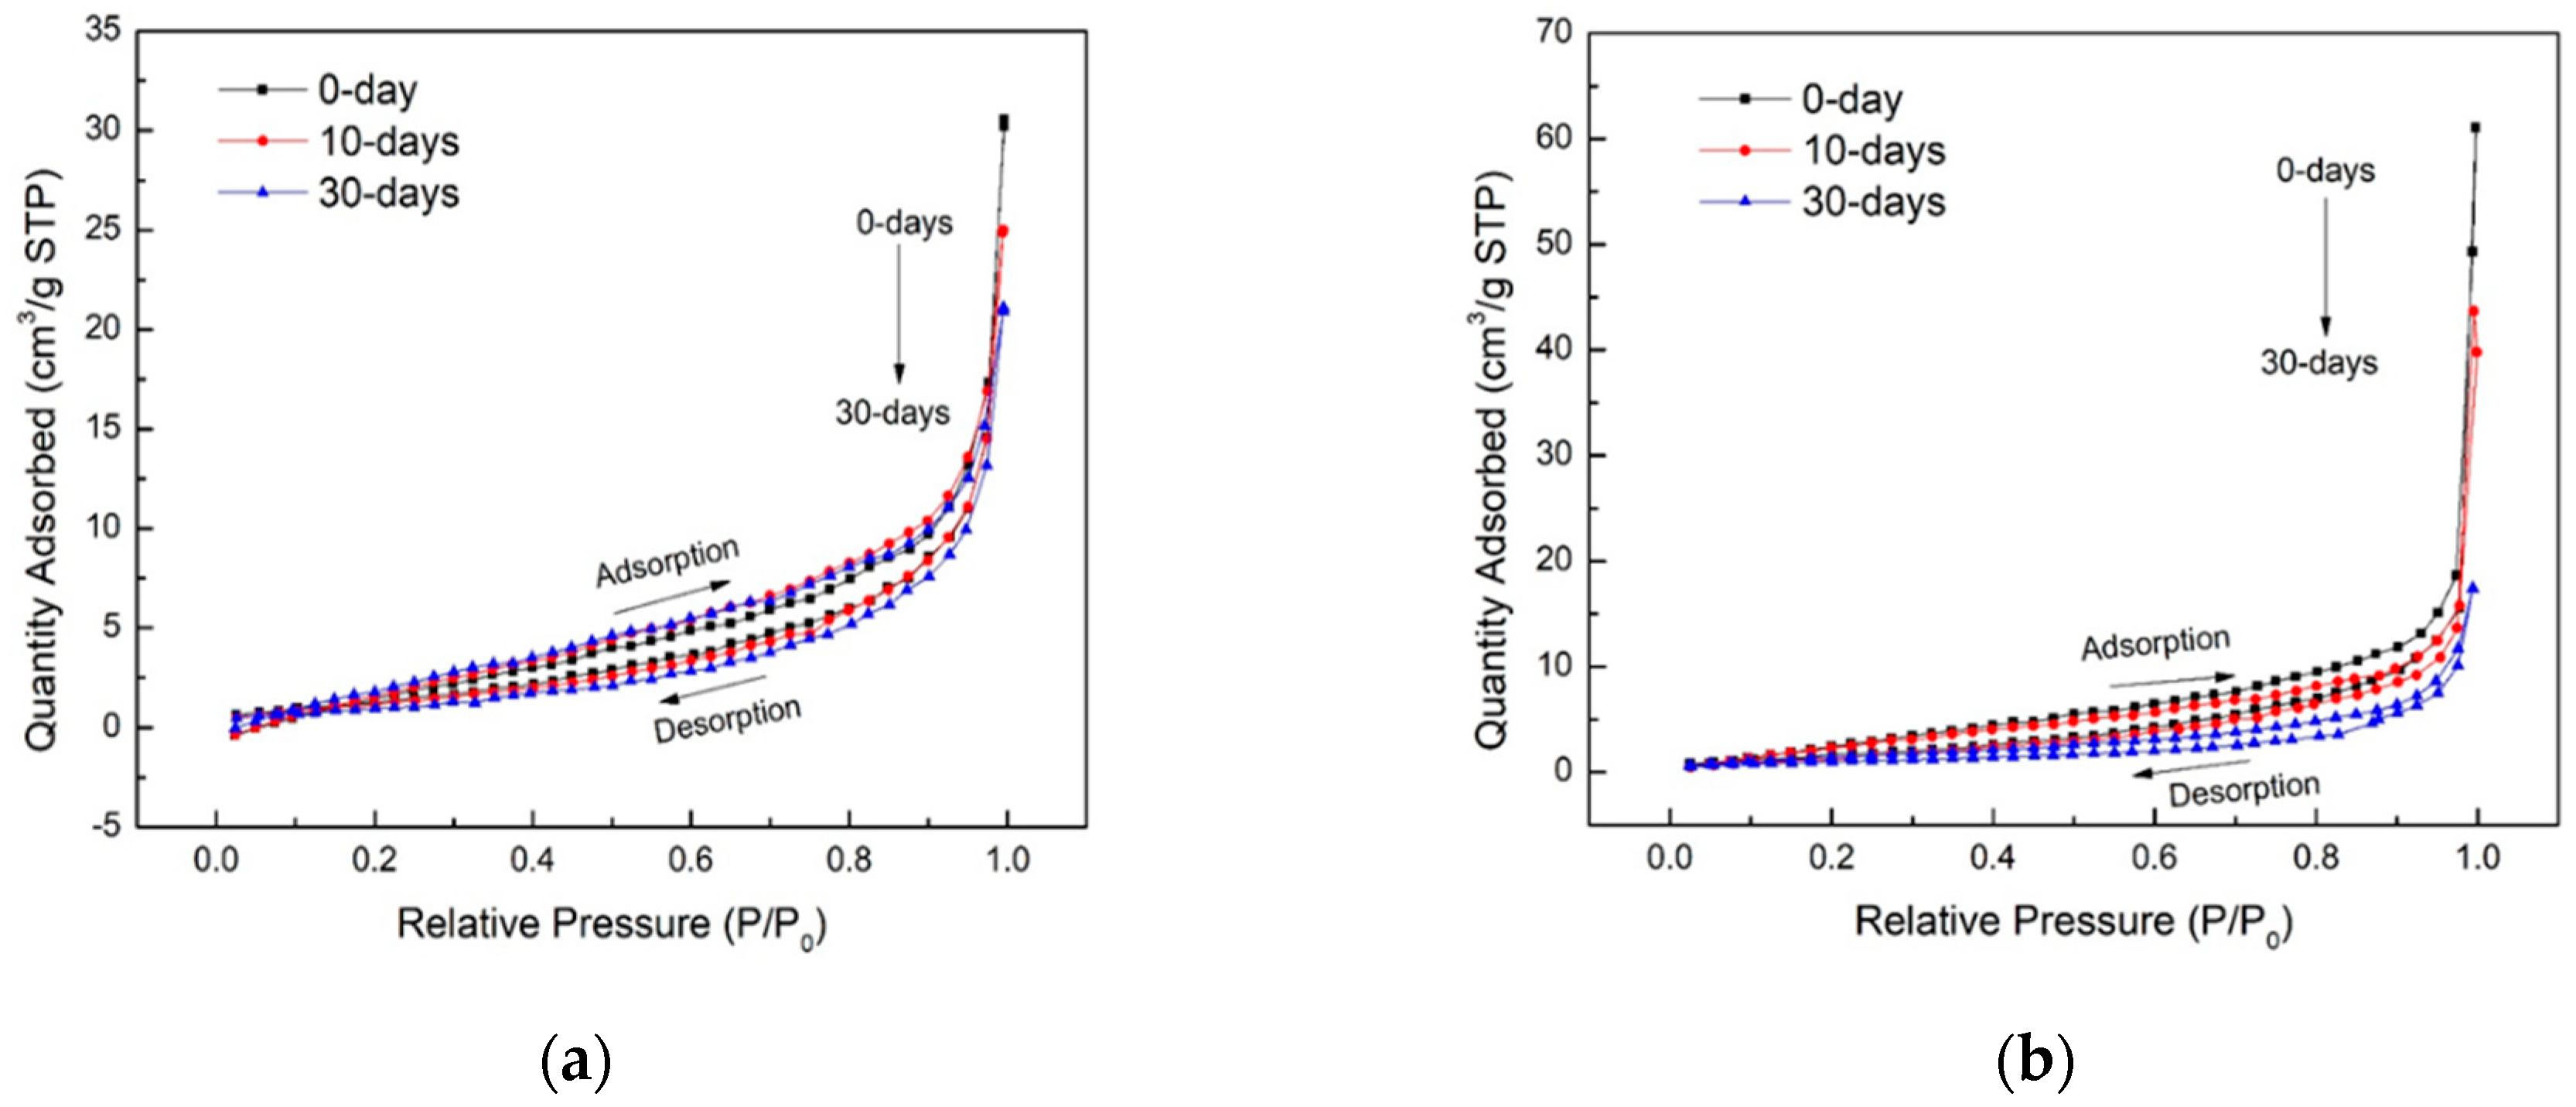
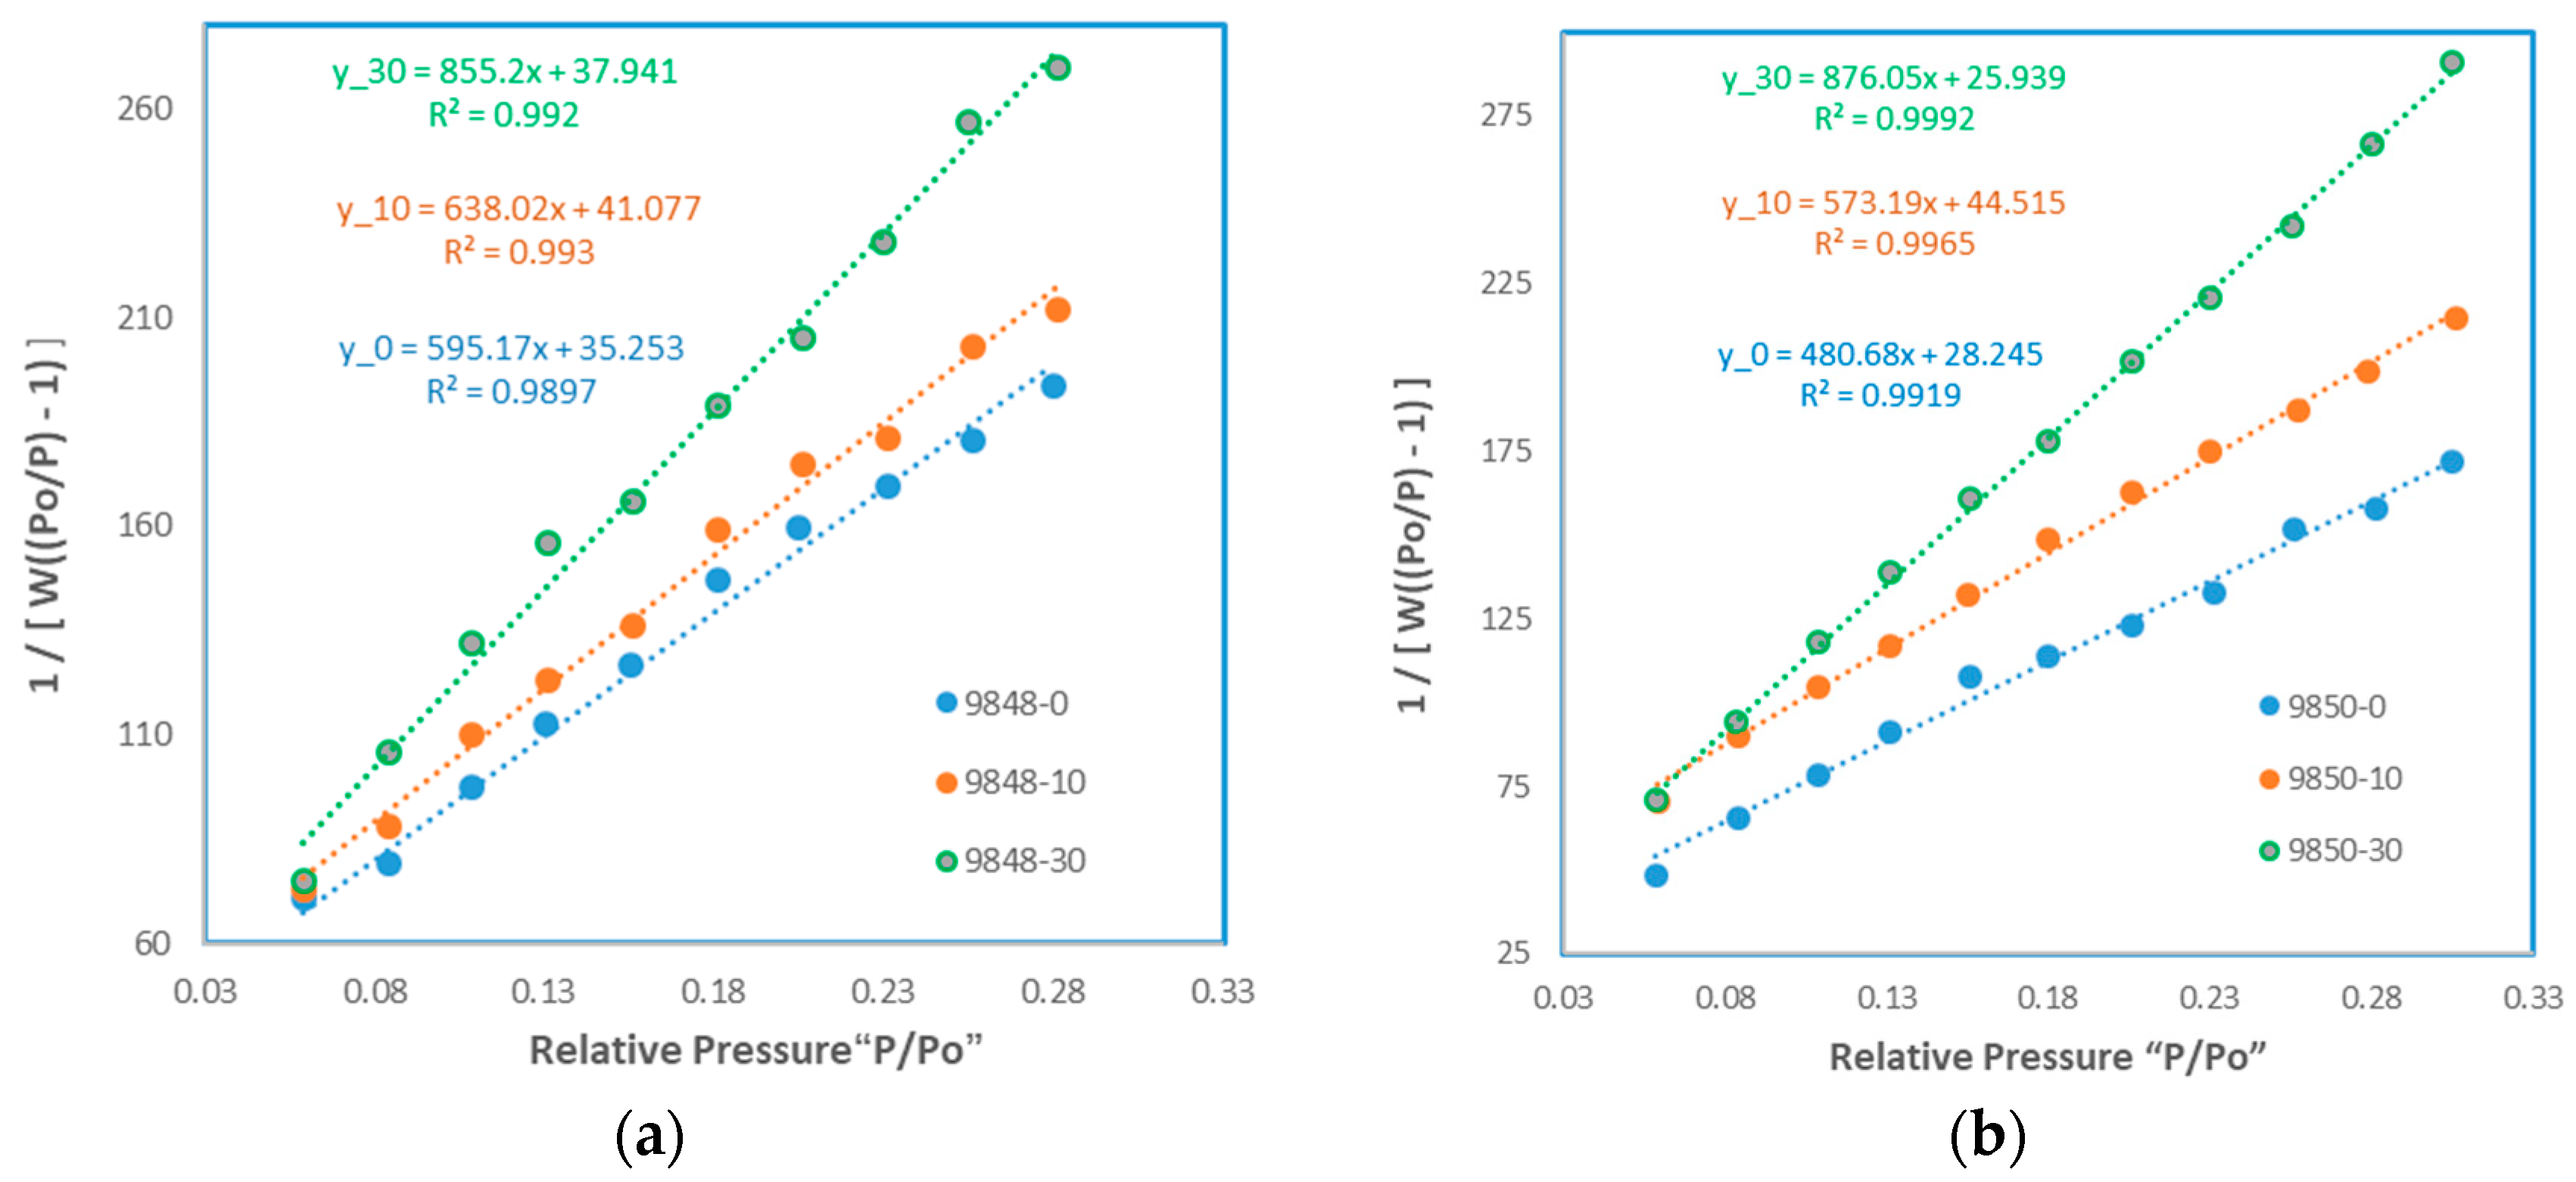
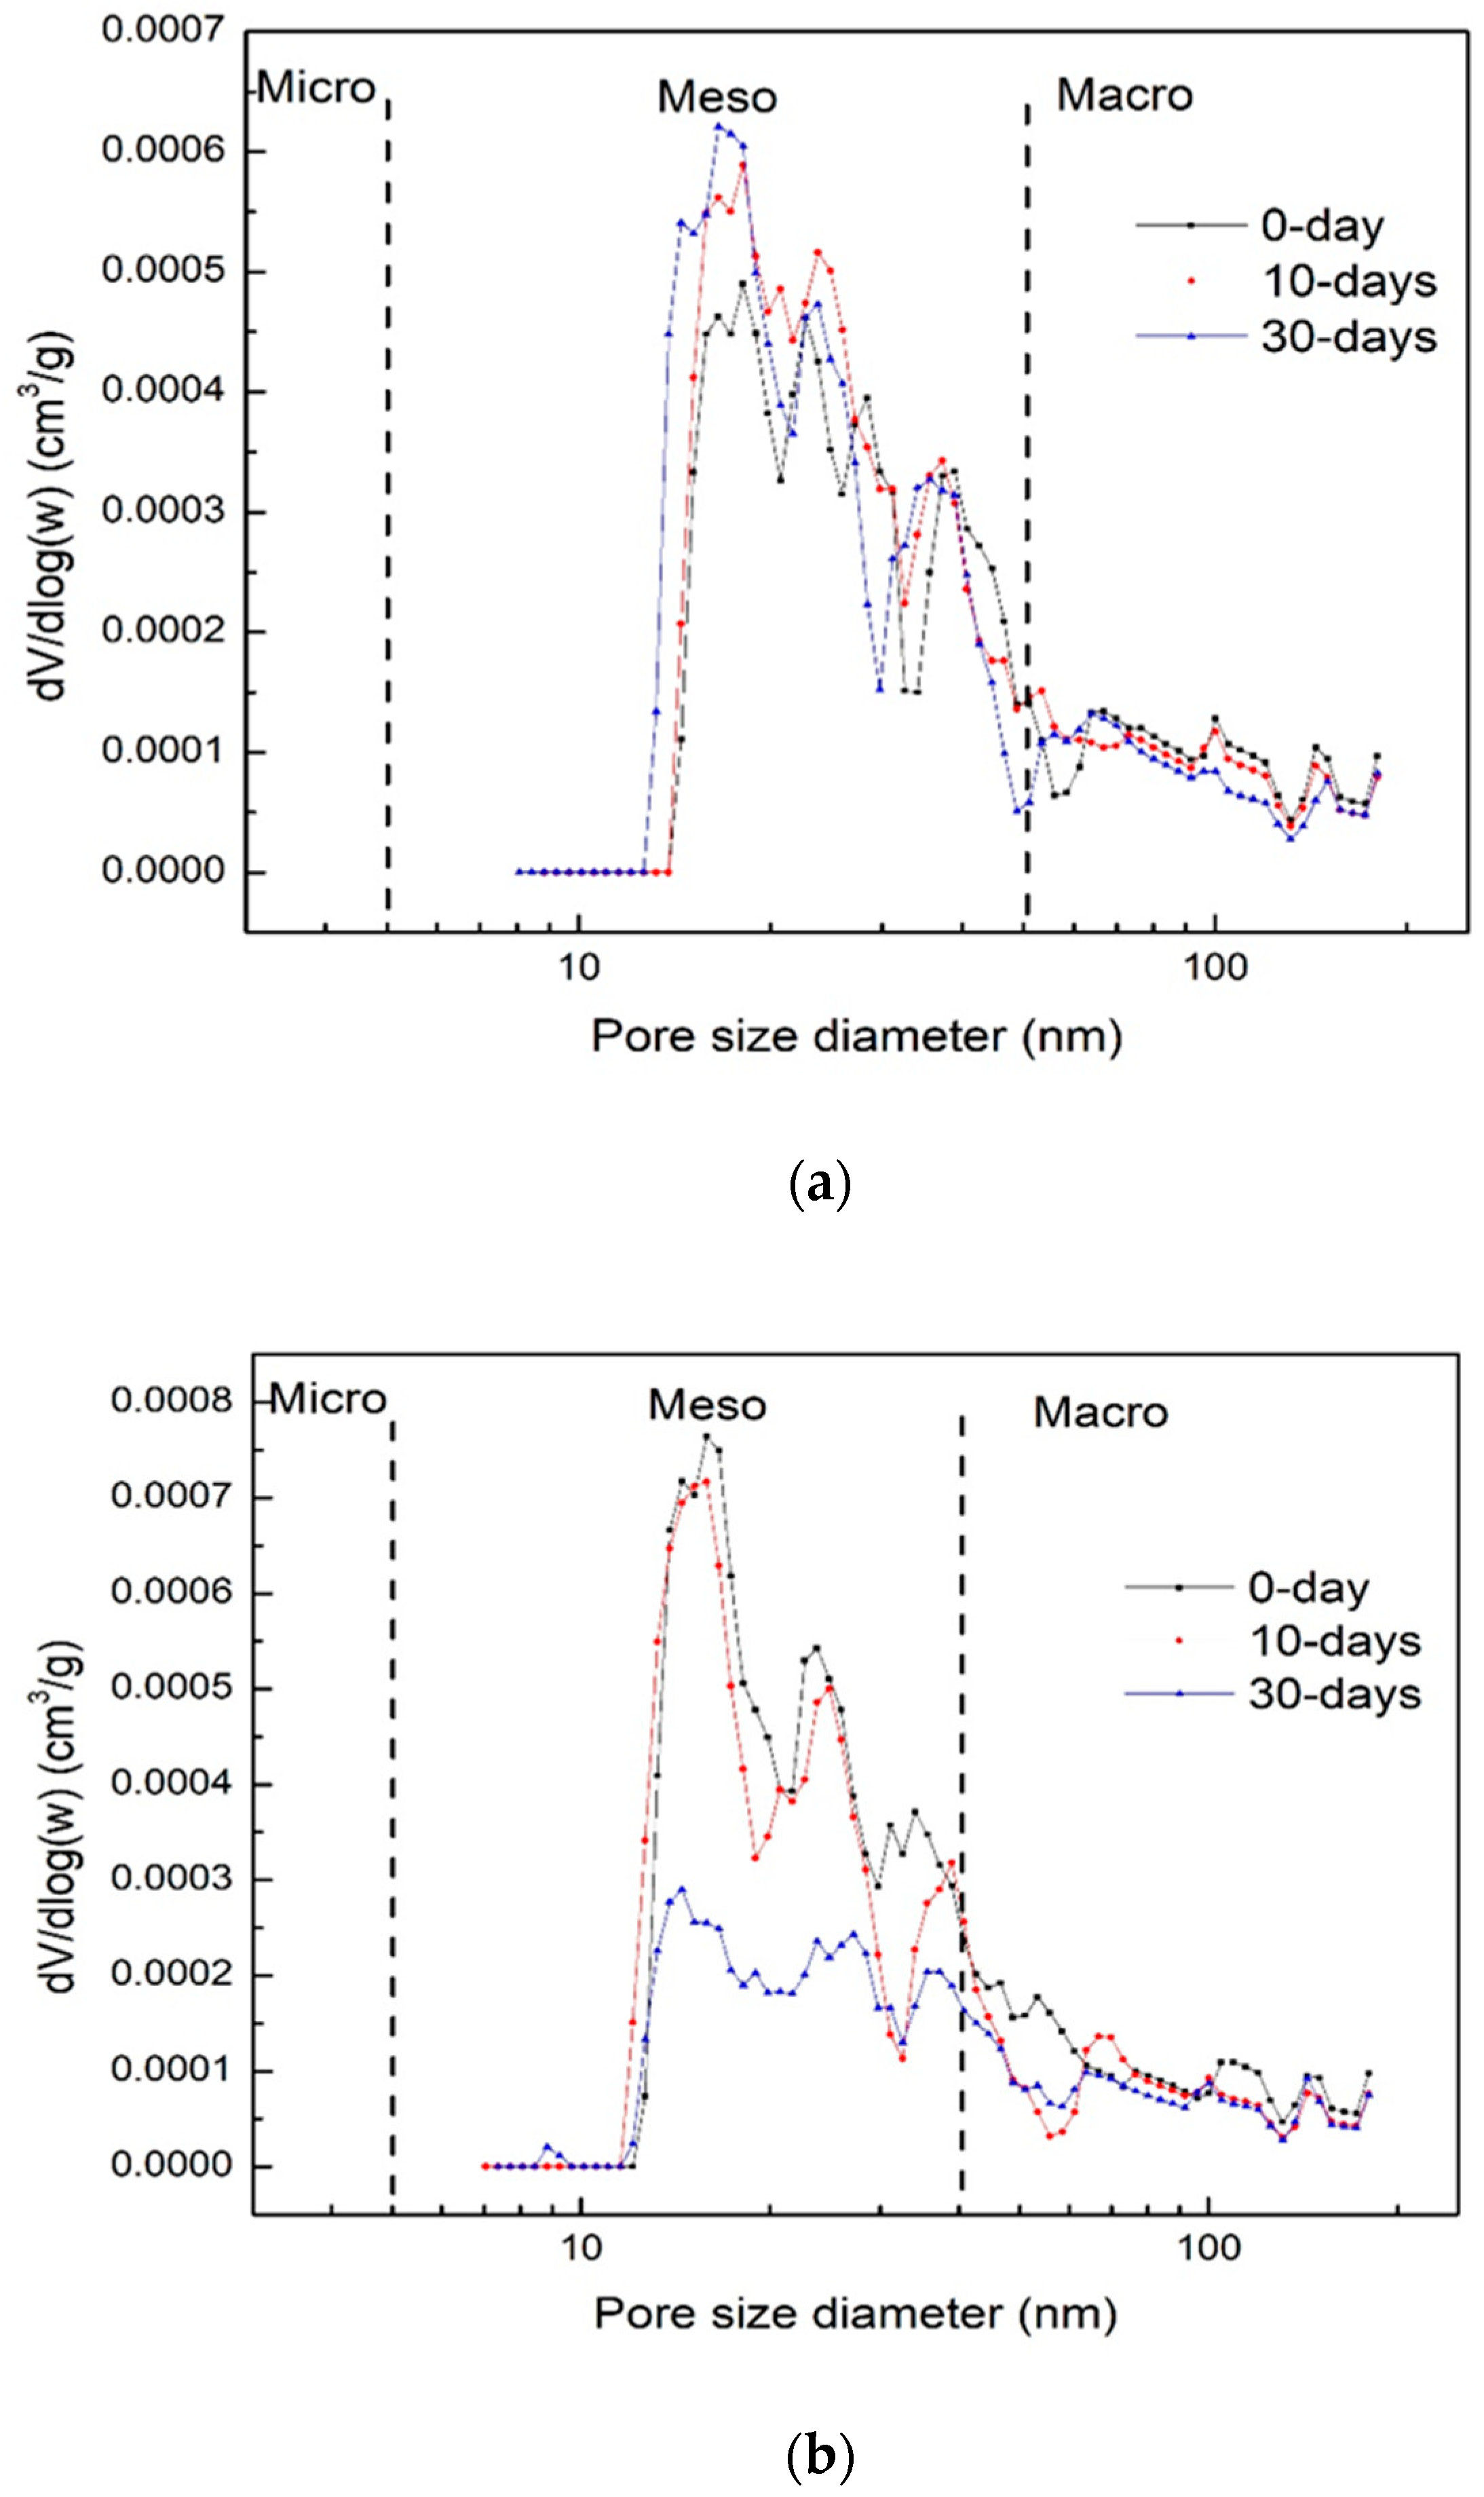
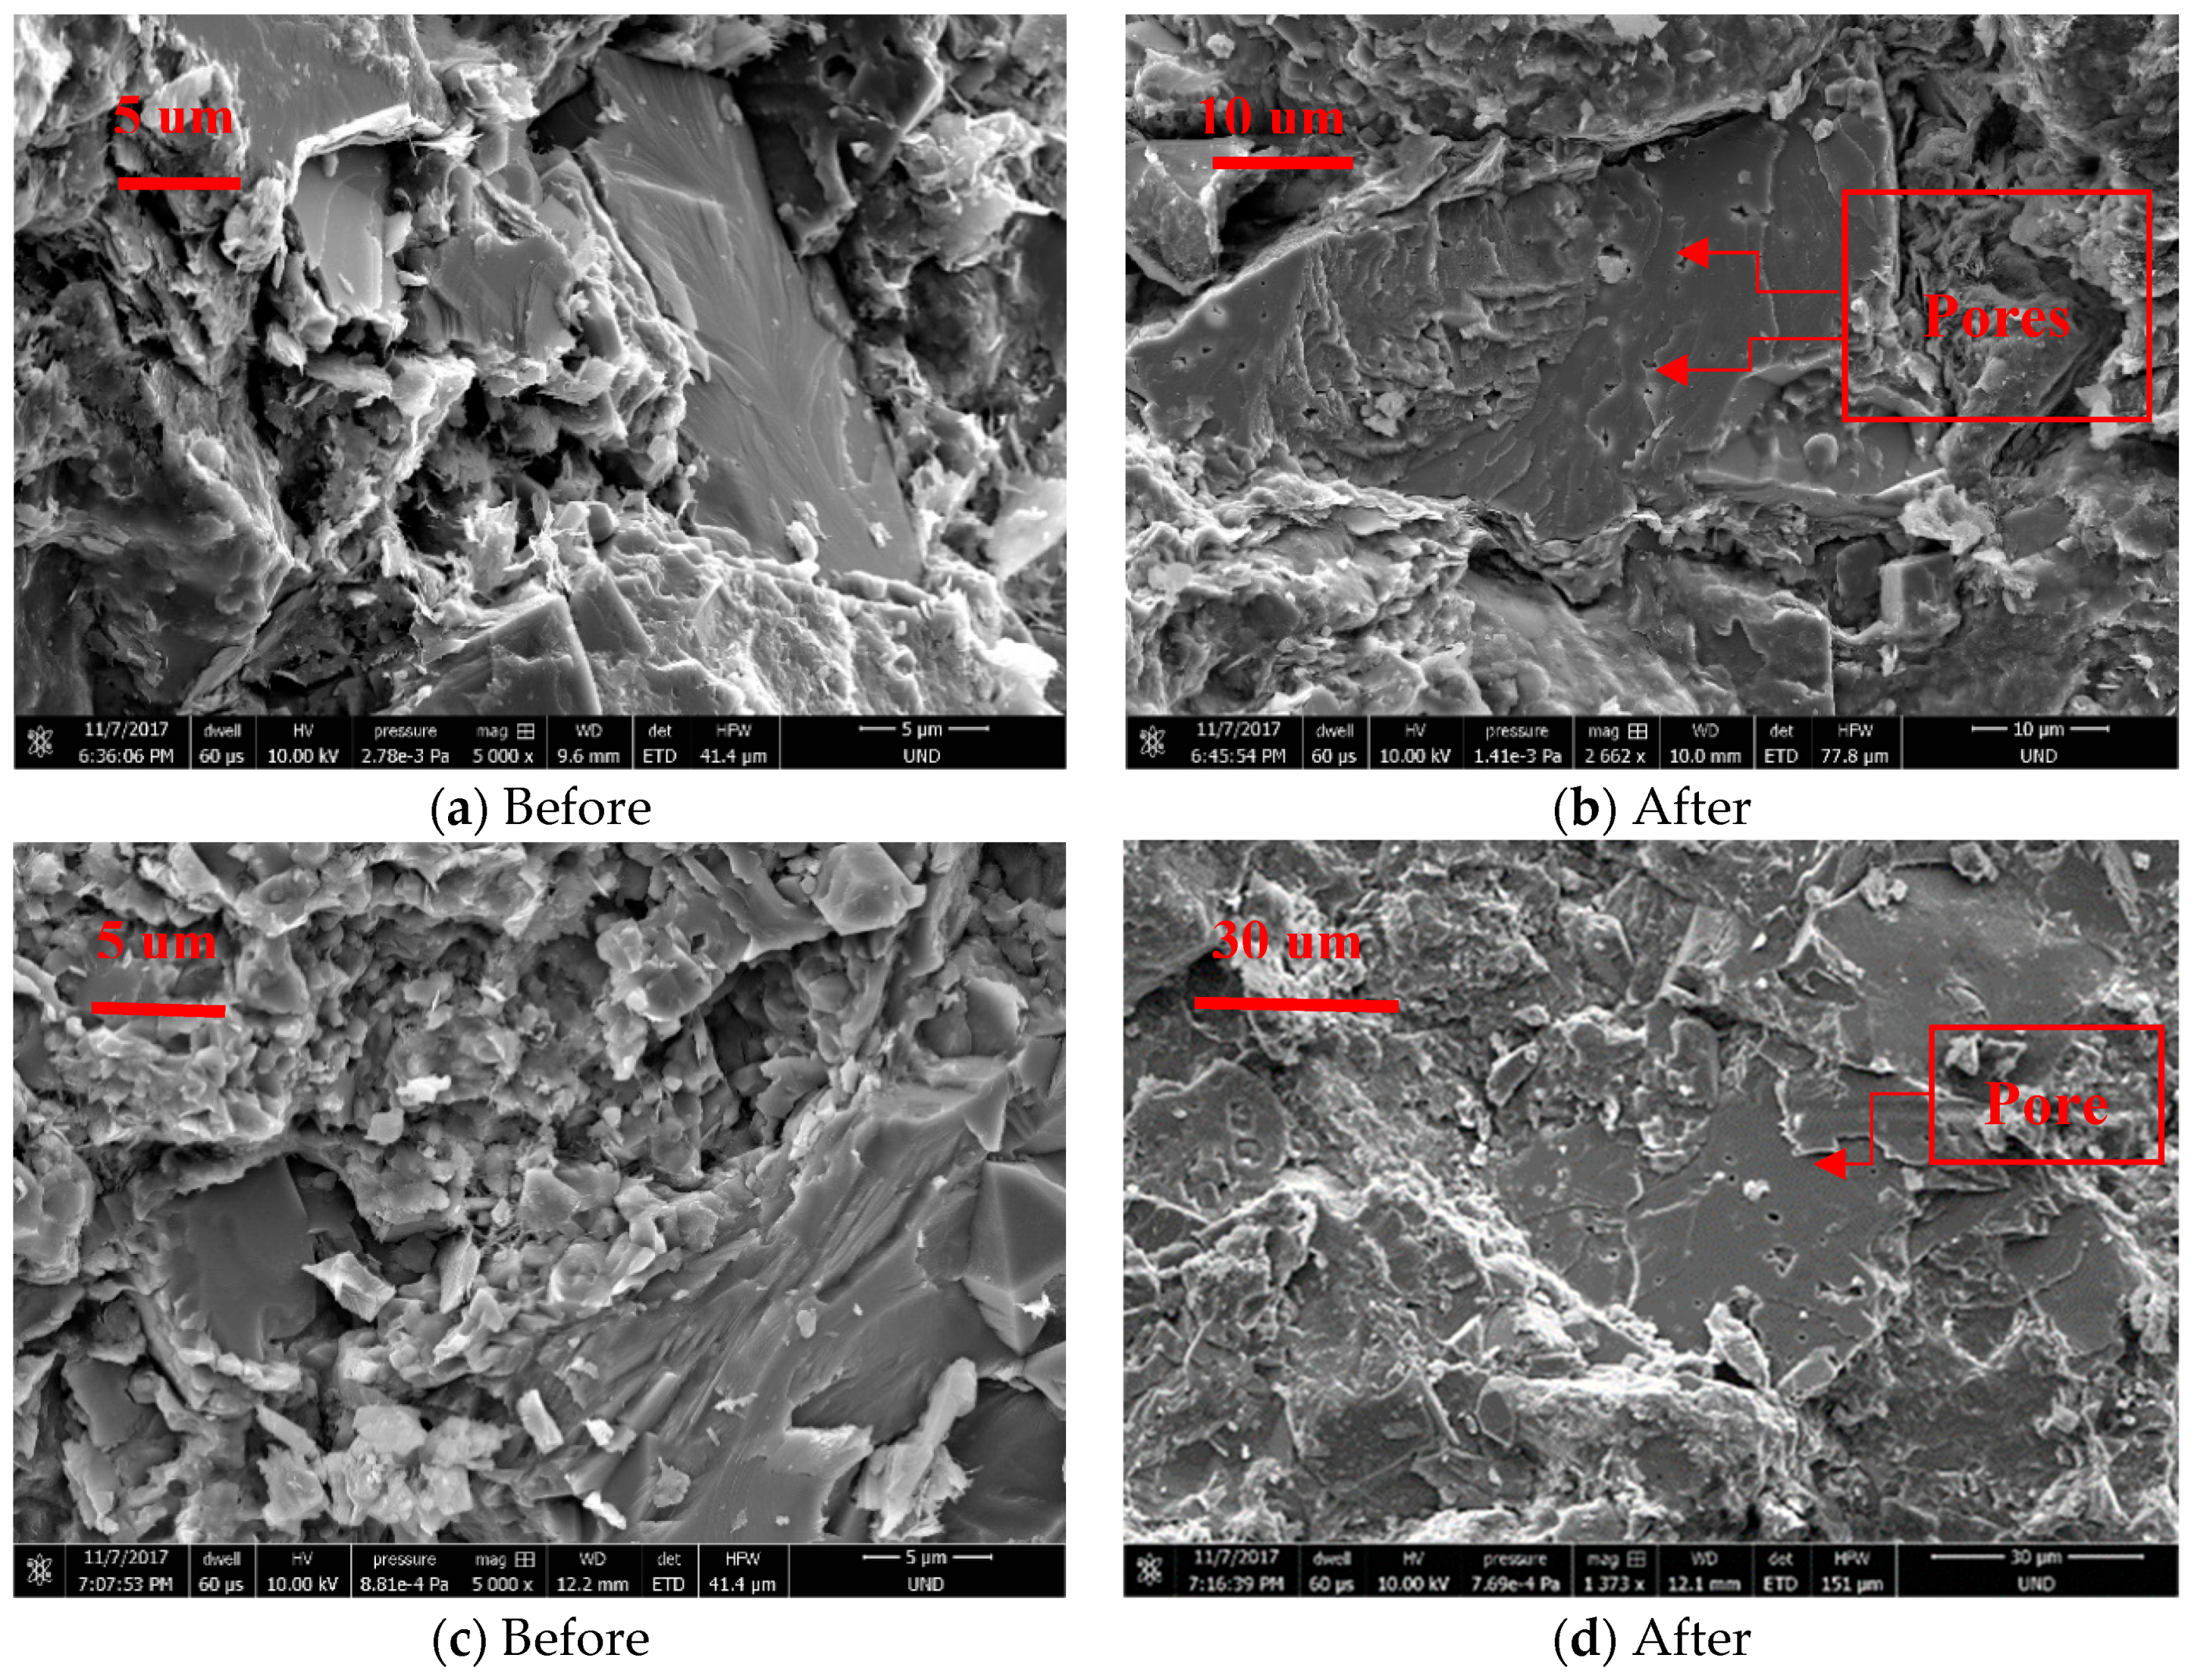
3.2. Pore Structure Alteration

The low-temperature N2 adsorption isotherms of the samples with varied Sc-CO2 injection time (0 day, 10 days, 30 days) are shown in Figure 5. According to the isotherm classification from the International Union of Pure and Applied Chemistry (IUPAC) [24,25], all the curves obtained are following the Type III Adsorption Isotherm curve. At the beginning under the extremely low P/Po applied, the pores of the both samples present micro-pore filling behavior and micro pore volume is related to the adsorption amount. Then, with the relative pressure(P/Po) building up, the isotherm adsorption curve illustrates that the multi-molecular layer adsorption occurred. At higher P/Po, the fluid is at the liquid phase and thus the capillary condensation exists. Comparing the isotherm curves under different Sc-CO2 injection times for the two samples separately, we proposed several interpretations of the effect on the pore structure. Firstly, with the Sc-CO2 flooding time increasing, the adsorption amount trend to increase for the first depth sample while the reverse tendency occurred for the sample at the depth of 9850 ft. Also, the similar isotherm curve for all time slots means that the pore shape did not vary significantly during the CO2 injection, and the slit pore and cylindrical pore dominate the main pore shapes. While the hysteresis loop which illustrated the meso-pore existence, was divided into two scenarios dramatically. For the samples from the depth at 9848 ft (Figure 5a), the width of the hysteresis loop gets wider with the Sc-CO2 injection time extension, which means that after the Sc-CO2 treatment, the presentation of the meso-pore becomes abundant. Meanwhile, the wideness tendency represents that the other pore type shapes intent to the silt pore conversion. For the samples from the depth at 9850 ft (Figure 5b), the hysteresis loop starts to narrow with the Sc-CO2 treatment time increasing, which reservedly indicated that the percentage of the meso-pore tends to reduce. It is also indicated that the pore shape tends to be converted to the plate core from the other types of the pore shape. The plate-shape pores in the Middle Bakken and the slit-shape pores in the Upper and Lower Bakken is advantageous for the flow of the hydrocarbon due to their excellent openness. Both the plate pore and slit pore are advantageous for the hydrocarbon flow in the porous media due to their excellent openness.
The Brunauer–Emmett–Teller (BET) method was applied to characterize the surface area change during the varied Sc-CO2 treatment period. The BET equation is:
1 W ( ( P o P ) 1 ) = 1 W m C + C 1 W m C ( P P o )
In order to acquire the surface area, two main parameters were required. The slope, which is,
s = C 1 W m C
and the intercept, which is,
i = 1 W m C
Combining the Equations (5) and (6), we have
W m = 1 s + i
Then the BET surface area can be calculated as:
S t = W m   N   A c s M
where:
  • N: Avogadro’s number (6.0221415 × 10²³ molecules/mol);
  • Wm: weight of adsorbate constituting a monolayer of surface coverage;
  • Acs: molecular cross section of the adsorbate molecule, (16.2 Å2 for N2 at 77 K);
  • M: molar mass (molecular weight) of the adsorbate N2 gas (28.0123).
Figure 6 clearly demonstrates the parameters acquired for the surface area calculation. It is obvious that the slope gets increase with the Sc-CO2 treatment time increasing. Furthermore, the surface of the sample after the CO2 treatment tends to decrease with the flooding time increasing. Table 2 lists the detailed surface area alteration corresponding to the varied Sc-CO2 injection time. For the test sample from the depth of 9848 ft, the surface area was 5.595 m2/g initially, while decreases to 5.238 m2/g for the 10 days’ treatment, then to 4.055 m2/g as the Sc-CO2 flooding time up to 30 days. For the test sample from the depth of 9850 ft, the surface area value deducted 27.04% to 4.998 m2/g for 10 days’ treatment, and 43.58% deduction to 3.865 m2/g with the 30 days’ Sc-CO2 injection. The main reason for the surface area deduction gradually with the Sc-CO2 flooding time increment may due to the corrosive property of dissolved CO2. The acidizing behavior of some minerals will connect some micro pore to the meso-pore type.
The pore size distribution (PSD) was analyzed for the samples with different Sc-CO2 flooding times. In this paper, based on density functional theory (DFT), the adsorption branch of the isotherm curve was chosen for the PSD analysis. Figure 7 represent the PSD vibration corresponding to the Sc-CO2 flooding time variation. It was observed that the PSD curves of all samples present the multimodal characteristic. Several observations were obtained through the comparison of the PSD curve via time duration.
The Sc-CO2 injection mainly affect the meso-pore volume rather than the micro and macro pore. The PSD vibration mostly located at the meso-pore zone, where the pore diameter is from 10 nm to 50 nm roughly.
The Sc-CO2 flooding time variation has a significant effect on the meso-pore size distribution. Figure 7a illustrates that with the Sc-CO2 injection time increases, the percentage of the meso-pore accrescent, and the porosity was increased from 6.3% to 8.5% roughly. While for the samples from the depth of 9850 ft (Figure 7b), the increment of the injection time demonstrated a negative effect on the meso-pore size distribution, and the porosity dropped slightly from 5.1% to 4%.
In order to prove that the pore structures of the shale samples changed after the injection. Some SEM images were taken before and after the injection. Figure 8 shows some images. We can clear see some pores appeared after the CO2 injection (Figure 8b,d) compared with the images before the injection (Figure 8a,b)

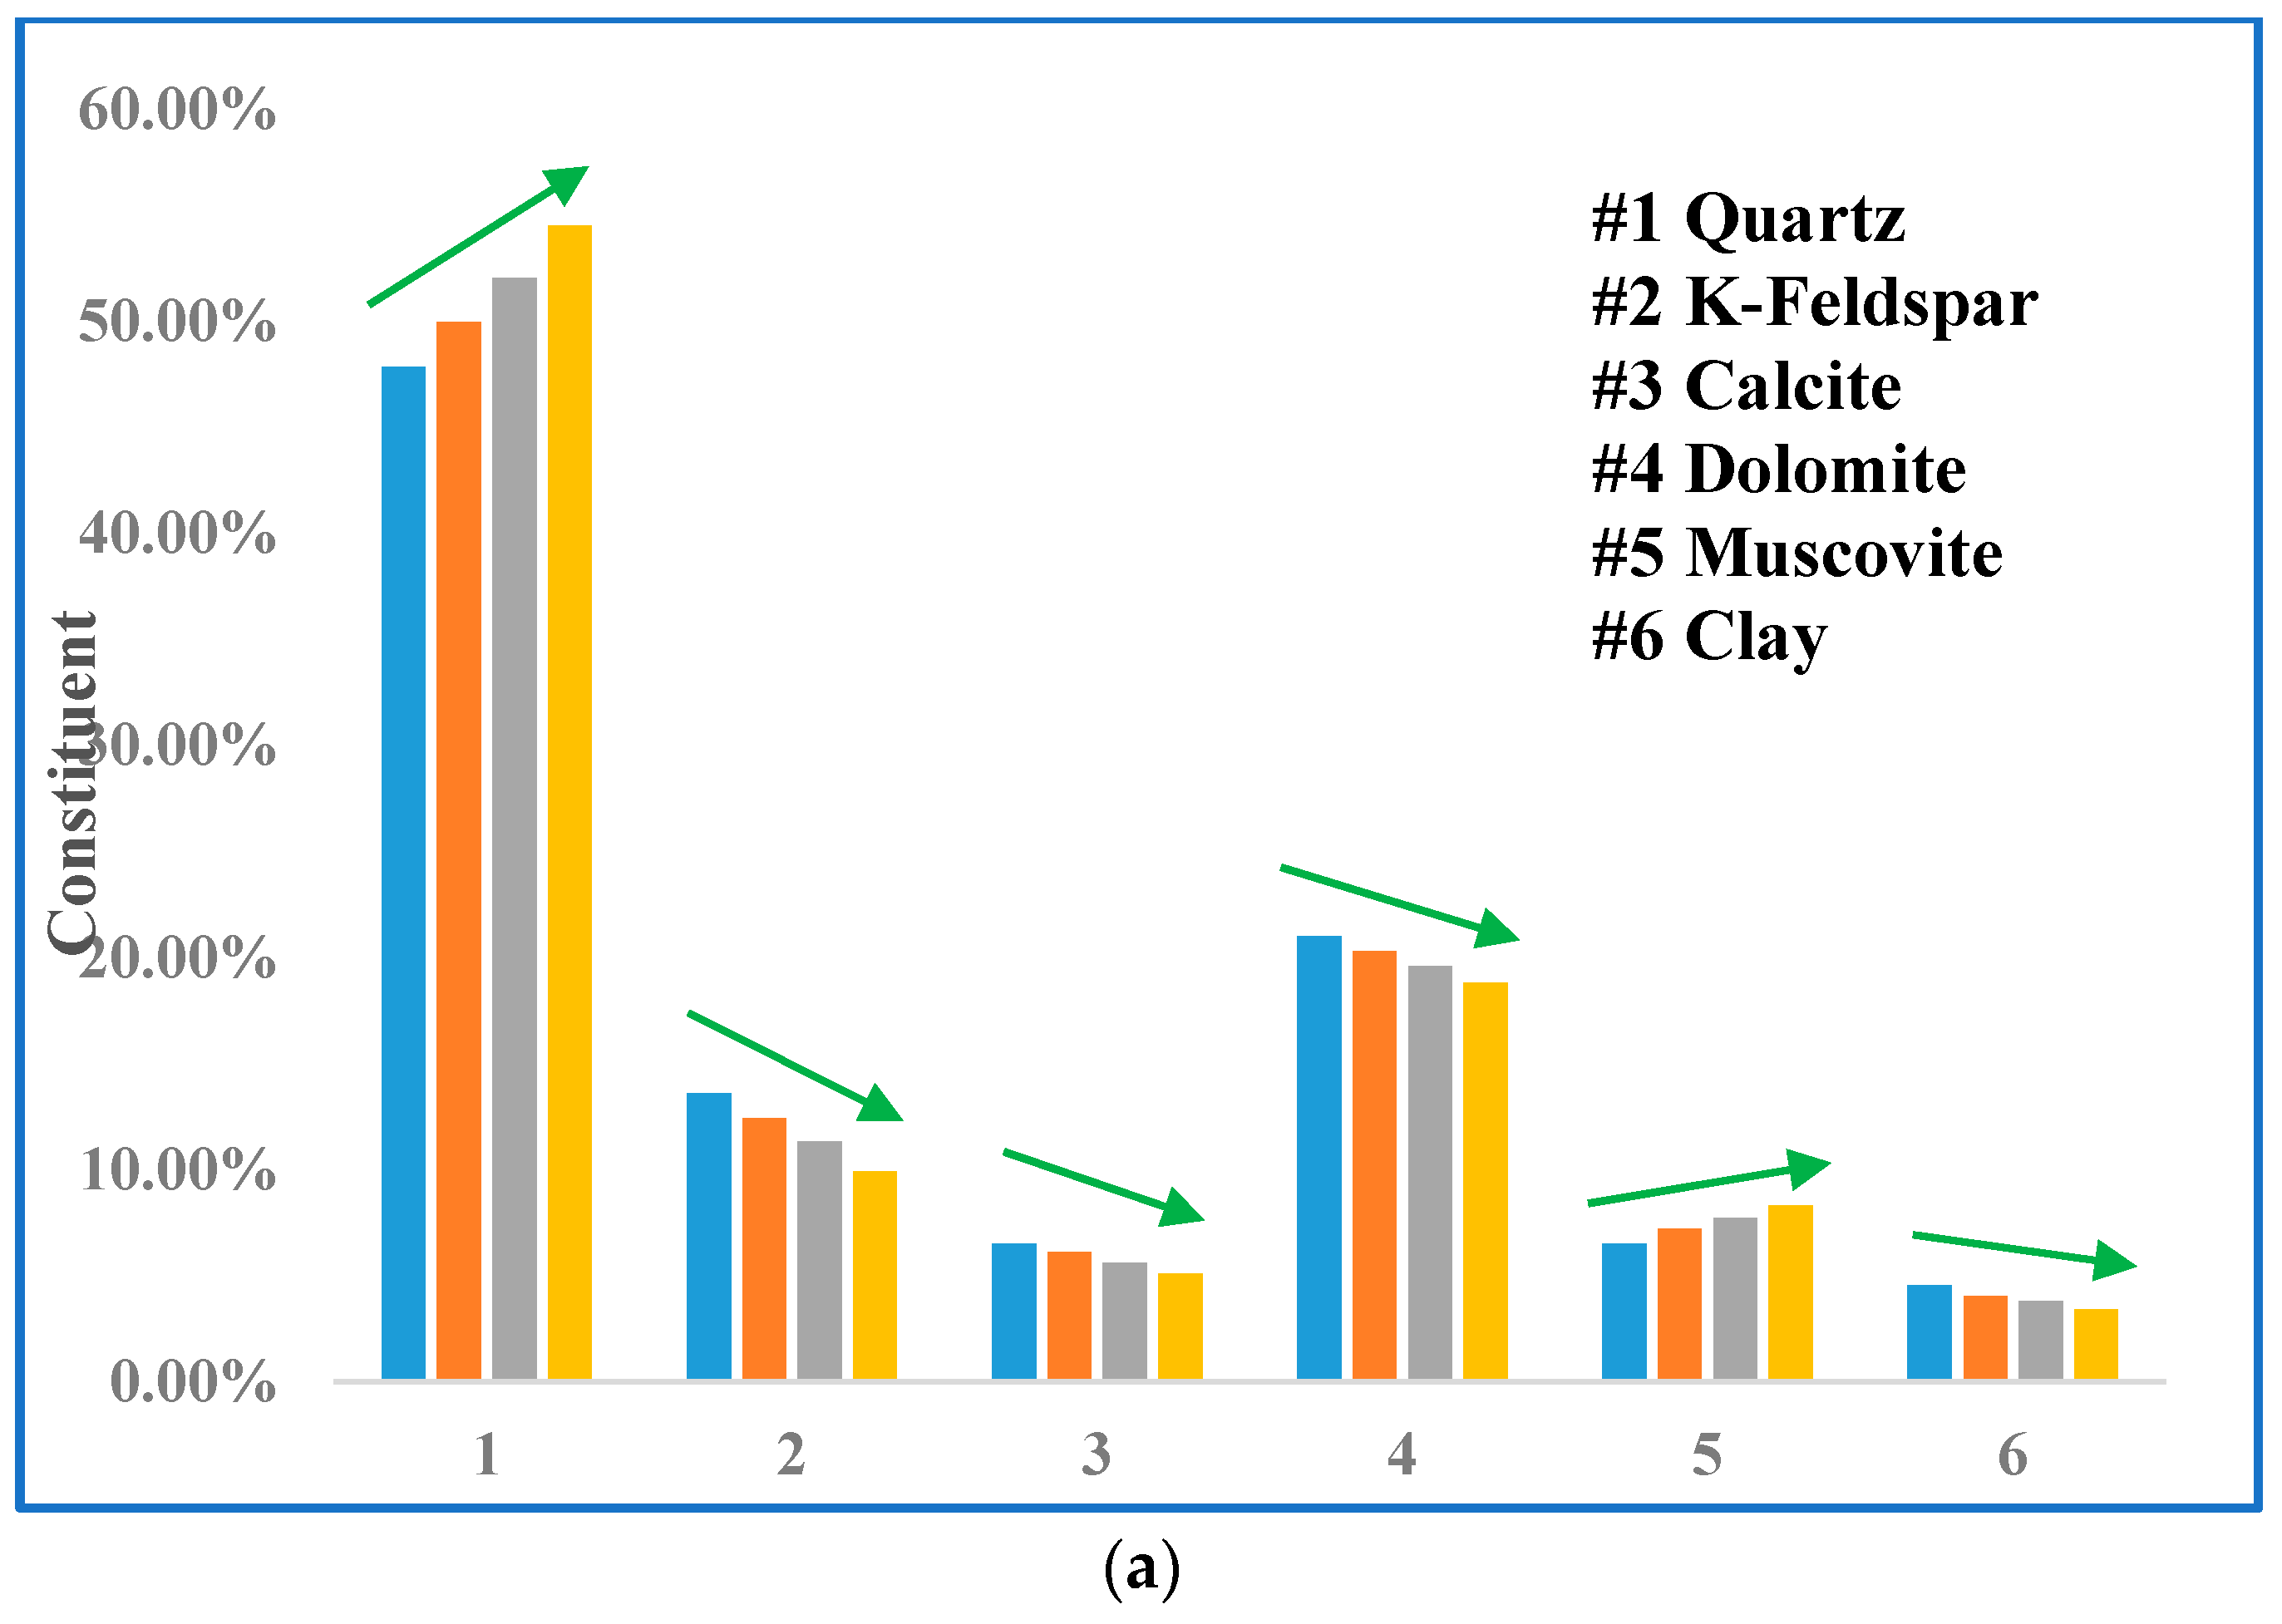
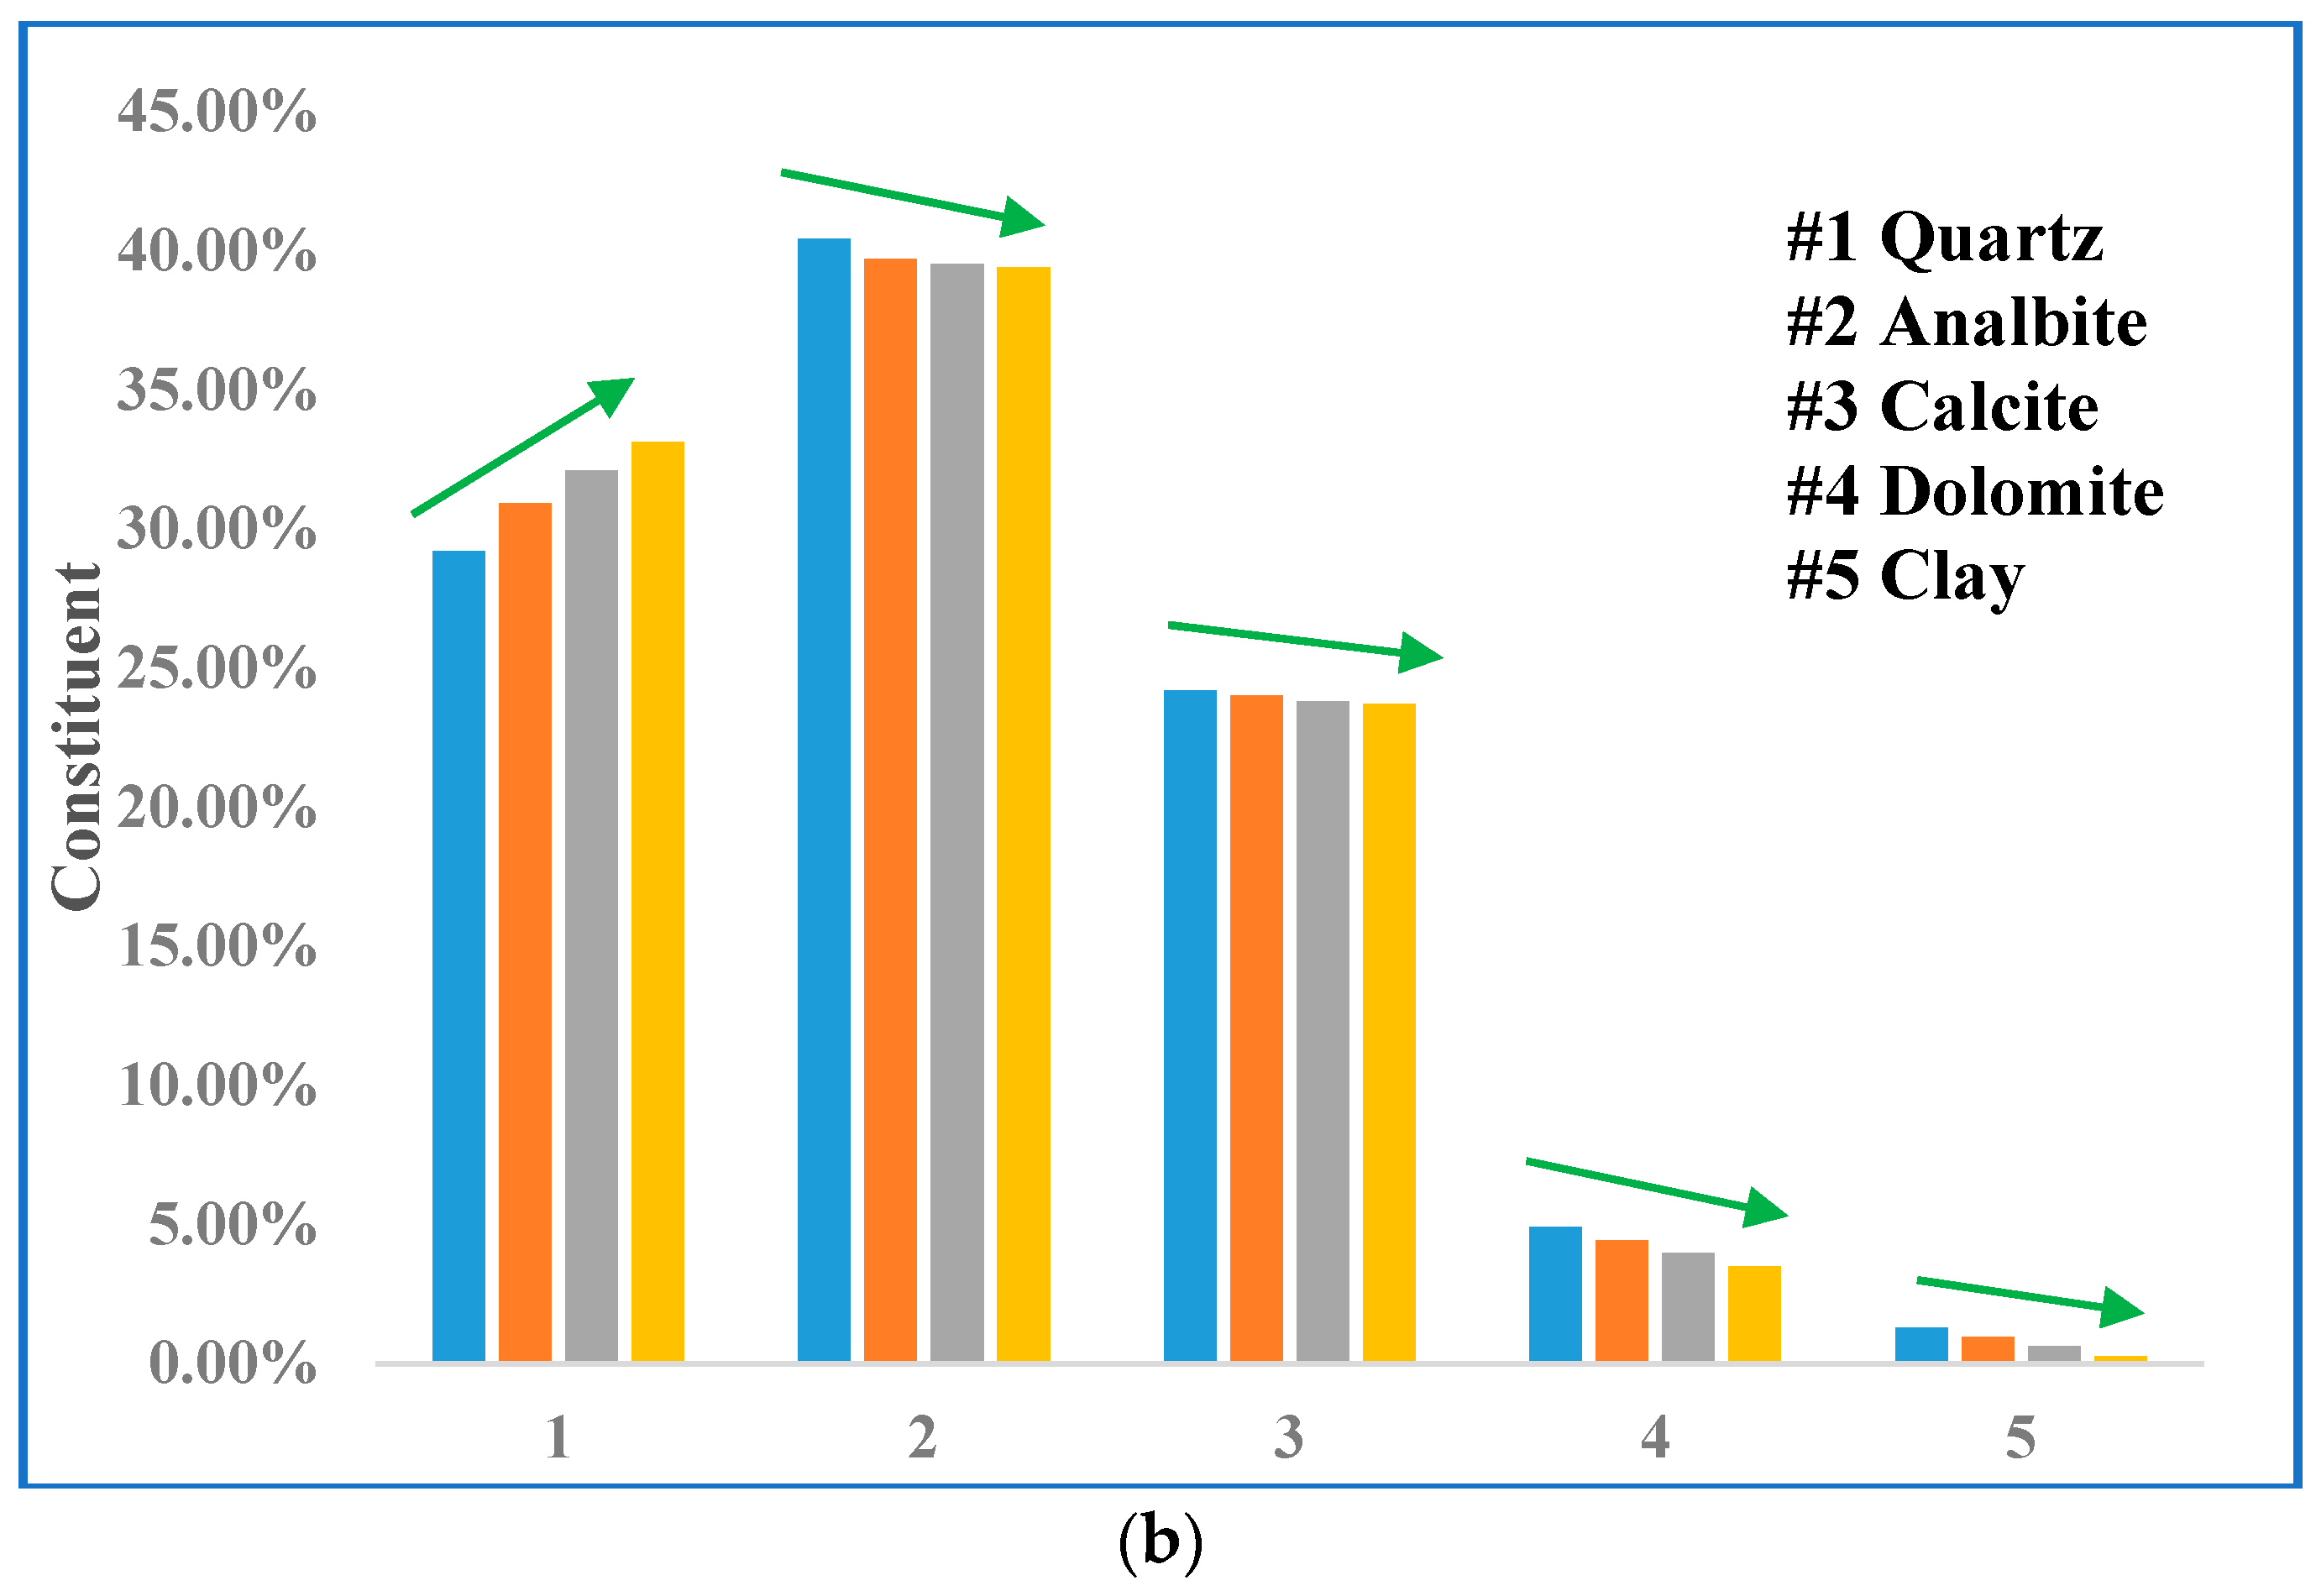
3.3. Mineralogical Alterations

The whole-rock XRD analysis was applied to detect the composition of the initial and Sc-CO2 treated samples individually. We assume that the samples hold the similar mineral components since the chips were sliced from the same core plug and then powdered. Table 3 presents the constituent alteration with the varied Sc-CO2 exposure duration. From the list, the major mineral components are quartz, with around 50%. Dolomite and K-Feldspar also account for a large proportion for the samples from the depth at 9848 ft, weighing 21% and 13.6 respectively. While for the samples from the depth at 9850 ft, the following minerals, analbite and calcite, weigh heavily on the mineral constituent. Minor amounts of other clays were observed in the samples. Comparing two different depth samples, we note that the sample at the depth of 9848 ft has the extra muscovite component with a proportion of 6.5% initially.
As shown in Figure 9, the mineral compositions tend to change due to the varied Sc-CO2 adsorption duration treatment. the concentrations of some certain type of minerals, such as K-Feldspar, calcite, dolomite and clay, start to decrease with the Sc-CO2 flooding time increasing. While the quartz content gets increased with the duration extension, mainly due to the weigh portion of other minerals decrease and some amount of transformation from other components. Another characteristic phenomenon is that the percentage of muscovite get increase dramatically with the Sc-CO2 flooding time increasing. It was believed that the generation of muscovite occurred during the solid-liquid contact process. The mineral components alteration was supported by the chemical reaction between the contents and the carbonic acid. When the Sc-CO2 is dissolved into the water in the pore, the weaken carbonic acid will generate and then start to react with some minerals, then alternate the weight proportion in the sample. A series of chemical reaction between the minerals and carbonic acid were initiated and mainly included as follows:
CO2 (aq) + H2O ↔ H2CO3 ↔ H+ + HCO3
2NaAlSi3O8 + H2CO3 → Na2CO3 + 2HAlSi3O8
CaCO3 + H2CO3 ↔ Ca2+ + 2HCO3
CaxMg1−xCO3 + H2CO3 ↔ xCa2+ + (1 − x)Mg2+ + 2HCO3
3K[AlSi3O8](s) + 2H2CO3 + 12H2O ↔ K+ + 2HCO3 + 6H4[SiO4] + KAl2[OH]2/AlSi3O10](s)

4. Conclusions

In this paper, the mechanical, pore structure and mineralogical alternation that occur in the Middle Bakken sample injected with Sc-CO2 were investigated and analyzed. A series of tests including the nano-indentation test, low-temperature N2 adsorption test, and whole-rock XRD analysis were conducted to evaluate the properties change of the samples with varied Sc-CO2 injection duration. Some conclusions were drawn as follows:
The nano-indentation test illustrated that the Young’s modulus of the samples tends to decrease gradually with the injection time incrementally which agrees with the results by Qiao et al. [16]. and Xiang et al. [18]. The Sc-CO2 adsorption behavior was noted as the main reason for the pore swelling, which contributes to the rock strength decrease. Also, a universal relation between the Young’s modulus and the Sc-CO2 injection time was proposed.
Low-temperature N2 adsorption results showed that Sc-CO2 treatment affects the meso-pore volume efficiently rather than the micro and macro pore, and the PSD results also give evidence of the dominating meso-pore alteration. The surface area of the samples with the varied Sc-CO2 treatment was observed as tending to deduct with the Sc-CO2 treatment time increasing.
The whole-rock XRD analysis revealed that the mineral components of the sample except quartz and muscovite were decreasing corresponding to the Sc-CO2 flooding duration increasing. The chemical reaction between the minerals and carbonic acid explained the mineralogical alteration of the samples which has also been proved by Raza et al. [14].
This fundamental research investigated the effect of the Sc-CO2 injection process to the shale formation from the aspect of geomechanical variation, geophysical alteration and geochemical vibration, and can provide a guide for CO2 injection to tight shale formation and the CO2 storage process.

Author Contributions

Conceptualization, methodology and experiments, S.W. and K.L. (Kouqi Liu); data analysis, J.H.; Supervision, K.L. (Kegang Ling); software, H.W.; writing—original draft preparation, S.W.; writing—review and editing, B.J.

Funding

This research received no external funding.

Acknowledgments

The authors would like thank the Advanced Analytical Characterization Laboratory at the University of North Dakota (UND), for the permission to use their equipment and especially the assistance from Xiaodong Hou.

Conflicts of Interest

The authors declare no conflict of interest.

References

  1. Wang, H.; Rabiei, M.; Wang, S.; Cui, G. Fracture Quantification Method with 3D X-ray Image—Entropy-assisted Indicator Kriging Method. In SPE Western Regional Meeting, 22–26 April, Garden Grove, CA, USA, Garden Grove, CA, USA; Society of Petroleum Engineers: Richardson, TX, USA, 26 April 2018. [Google Scholar]
  2. Ren, B. Local capillary trapping in carbon sequestration: Parametric study and implications for leakage assessment. Int. J. Greenhouse Gas Control 2018, 78, 135–147. [Google Scholar] [CrossRef]
  3. Ling, K.; Wu, X.; Han, G.; Wang, S. Optimizing the Multistage Fracturing Interval for Horizontal Wells in Bakken and Three Forks Formations. In SPE Asia Pacific Hydraulic Fracturing Conference, 24–26 August 2016, Beijing, China; Society of Petroleum Engineers: Richardson, TX, USA, 26 August 2016. [Google Scholar]
  4. Jia, B.; Tsau, J.; Barati, R. Role of Molecular Diffusion in Heterogeneous, Naturally Fractured Shale Reservoirs During CO2 Huff-n-puff. J. Pet. Sci. Eng. 2018, 164, 31–42. [Google Scholar] [CrossRef]
  5. San, J.; Wang, S.; Yu, J.; Liu, N.; Lee, R. Nanoparticle-Stabilized Carbon Dioxide Foam Used. In Enhanced Oil Recovery: Effect of Different Ions and Temperatures. SPE J. 2017, 22, 1416–1423. [Google Scholar] [CrossRef]
  6. Amirian, E.; Leung, J.Y.; Zanon, S.; Dzurman, P. Integrated cluster analysis and artificial neural network modeling for steam-assisted gravity drainage performance prediction in heterogeneous reservoirs. Expert Syst. Appl. 2015, 42, 723–740. [Google Scholar] [CrossRef]
  7. Fedutenko, E.; Yang, C.; Card, C.; Nghiem, L.X. Time-Dependent Neural Network Based Proxy Modeling of SAGD Process. In SPE Heavy Oil Conference-Canada, 10–12 June, Calgary, AB, Canada; Society of Petroleum Engineers: Richardson, TX, USA, 12 June 2014. [Google Scholar]
  8. Li, H.; Lau, H.C.; Huang, S. Coalbed Methane Development in China: Engineering Challenges and Opportunities. In SPE/IATMI Asia Pacific Oil & Gas Conference and Exhibition, 17–19 October, Jakarta, Indonesia; Society of Petroleum Engineers: Richardson, TX, USA, 19 October 2014. [Google Scholar]
  9. Wang, S.; San, J.; Yu, J.; Lee, R.; Liu, N. A Downhole CO2 Sensor to Monitor CO2 Movement In situ for Geologic Carbon Storage. Int. J. Greenhouse Gas Control 2016, 55, 202–208. [Google Scholar] [CrossRef]
  10. Jia, B.; Tsau, J.; Barati, R. A Review of the Current Progress of CO2 Injection EOR and Carbon Storage in Shale Oil Reservoirs. Fuel 2019, 236, 404–427. [Google Scholar] [CrossRef]
  11. Akrad, O.M.; Miskimins, J.L.; Prasad, M. The Effects of Fracturing Fluids on Shale Rock Mechanical Properties and Proppant Embedment. In SPE Annual Technical Conference and Exhibition, 30 October–2 November, Denver, CO, USA; Society of Petroleum Engineers: Richardson, TX, USA, 2 November 2014. [Google Scholar]
  12. Liu, Q.-Y.; Tao, L.; Zhu, H.-Y.; Lei, Z.-D.; Jiang, S.; McLennan, J.D. Macroscale Mechanical and Microscale Structural Changes in Chinese Wufeng Shale with Supercritical Carbon Dioxide Fracturing. SPE J. 2018, 23, 691–703. [Google Scholar] [CrossRef]
  13. Blasingame, T.; Maxwell, S.; Valleau, D. Petrophysical Characterization of the Bakken Shale for Carbon Storage Investigation. In Unconventional Resources Technology Conference, Austin, Texas, 24–26 July 2017; Unconventional Resources Technology Conference: Tulsa, OK, USA, 26 July 2017. [Google Scholar]
  14. Rezaee, R.; Saeedi, A.; Iglauer, S.; Evans, B. Shale Alteration after Exposure to Supercritical CO2. Int. J. Greenhouse Gas Control 2017, 62, 91–99. [Google Scholar] [CrossRef]
  15. Busch, A.; Alles, S.; Gensterblum, Y.; Prinz, D.; Dewhurst, D.N.; Raven, M.D.; Stanjek, H.; Krooss, M.B. Carbon dioxide storage potential of shales. Int. J. Greenhouse Gas Control 2008, 2, 297–308. [Google Scholar] [CrossRef]
  16. Lyu, Q.; Long, X.; Ranjith, P.G.; Tan, J.; Kang, Y.; Wang, Z. Experimental Investigation on the Mechanical Properties of a Low-clay Shale with Different Adsorption Times in Sub-/super-critical CO2. Energy 2018, 147, 1288–1298. [Google Scholar] [CrossRef]
  17. Lahann, R.; Mastalerz, M.; Rupp, J.A. Influence of CO2 on New Albany Shale Composition and Pore Structure. Int. J Coal Geol. 2013, 108, 2–9. [Google Scholar] [CrossRef]
  18. Ao, X.; Lu, Y.; Tang, J.; Chen, Y.; Li, H. Investigation on the Physics Structure and Chemical Properties of the Shale Treated by Supercritical CO2. J. CO2 Utilization 2017, 20, 274–281. [Google Scholar] [CrossRef]
  19. Jiang, Z.; Zhang, W.; Liang, C.; Wang, Y.; Liu, H.; Chen, X. Basic Characteristics and Evaluation of Shale Oil Reservoirs. Pet. Res. 2016, 1, 149–163. [Google Scholar] [CrossRef]
  20. Hu, C.; Li, Z. A review on the Mechanical Properties of Cement-based Materials Measured by Nanoindentation. Constr. Build. Mater. 2015, 90, 80–90. [Google Scholar] [CrossRef]
  21. Liu, K.; Ostadhassan, M.; Bailey, B. Applications of Nano-indentation Methods to Estimate Nanoscale Mechanical Properties of Shale Reservoir rocks. J. Nat. Gas Sci. Eng. 2016, 35, 1310–1319. [Google Scholar] [CrossRef]
  22. Oliver, W.C.; Pharr, G.M. An Improved Technique for Determining Hardness and Elastic Modulus Using Load and Displacement Sensing Indentation Experiments. J. Mater. Res. 1992, 7, 1564–1583. [Google Scholar] [CrossRef]
  23. Shalabi, F.I.; Cording, E.J.; Al-Hattamleh, O.H. Estimation of Rock Engineering Properties Using Hardness Tests. Eng. Geol. 2007, 90, 138–147. [Google Scholar] [CrossRef]
  24. Rouquerolb, J.; Avnir, D.; Fairbridge, C.W.; Everett, D.H.; Haynes, J.H.; Pernicone, N.; Ramsay, J.D.F.; Sing, K.S.W.; Unger, K.K. Recommendations for the Characterization of Porous Solids (Technical Report). Pure Appl. Chem. 2009, 66, 1739–1758. [Google Scholar] [CrossRef]
  25. Jia, B.; Tsau, J.-S.; Barati, R. A Workflow to Estimate Shale Gas Permeability Variations during the Production Process. Fuel 2018, 220, 879–889. [Google Scholar] [CrossRef]
Figure 1. The schematic diagram of the Sc-CO2 flooding system.
Applsci 09 01686 g001
Figure 2. Analysis instruments and samples preparation for the miscellaneous test. (a) Nano-indenter; (b) Sample specimens for the nano-indentation test; (c) X-ray diffraction (XRD); (d) Samples for XRD; (e) Quantachrome Autosorb-IQ; (f) Sample powder for low-temperature N2 adsorption.
Applsci 09 01686 g002
Figure 3. Schematic illustration of the nano-indentation test. (a) Typical indentation load-displacement curve, Reproduced with permission from [20,21], Elsevier, 2019; (b) unloading process, Reproduced with permission from [22], Cambridge University Press, 2019.
Applsci 09 01686 g003
Figure 4. Young’s modulus with variable Sc-CO2 injection time. The upper curve is for the sample with depth at 9848 ft, the lower curve is for the sample with depth at 9850 ft.
Applsci 09 01686 g004
Figure 5. Isotherm curves with different Sc-CO2 injection time. (a) sample at depth of 9848 ft, (b) sample at depth of 9850 ft.
Applsci 09 01686 g005
Figure 6. BET plot of 1/[W((P0 / P) − l)] versus P0/P. (a) sample at depth of 9848 ft; (b) sample at depth of 9850 ft.
Applsci 09 01686 g006
Figure 7. Pore size distribution (PSD) with Sc-CO2 injection time variation. (a) sample at depth of 9848 ft; (b) sample at depth of 9850 ft.
Applsci 09 01686 g007
Figure 8. The scanning electron microscope (SEM) images of the sample before and after the CO2 injection (a), (b) show the images of Sample 1 while (c), (d) show the images for Sample 2.
Applsci 09 01686 g008
Figure 9. Mineral content alteration with varied Sc-CO2 injection time. (a) sample at depth of 9848 ft; (b) sample at depth of 9850 ft.
Applsci 09 01686 g009aApplsci 09 01686 g009b
Table 1. Parameters.
Weight of sample taken (g)0.1
AdsorbateN2
Bath temperature (K)77.00
Outgas temperature (°C)120
Outgas time (h)10
Relative pressure (P/Po)0.01–0.99
Table 2. Surface area vs. various Sc-CO2 injection time.
Sample ID
9848 ft9850 ft
Time, DaySurface Area, m2/gDeduction Per., %Surface Area, m2/gDeduction Per., %
05.595-6.85-
105.2386.38%4.99827.04%
304.05527.52%3.86543.58%
Table 3. Mineral content vs. the varied Sc-CO2 flooding time.
Sample IDTreatment Time (day)Mineral Content (%)
QuartzAnalbiteCalciteDolomiteMuscoviteClay
9850029.2140.424.24.9-1.29
1030.9339.7244.41-0.96
2032.1139.523.83.96-0.63
3033.1339.423.73.5-0.27
9848047.8513.66.5216.54.55
1049.9612.46.120.37.24.04
2052.0311.35.619.67.73.77
3054.519.95.118.88.33.39

