Article

Nonlinearity of Microwave Electric Field Coupled Rydberg Electromagnetically Induced Transparency and Autler-Townes Splitting

1
State Key Laboratory of Quantum Optics and Quantum Optics Devices, Institute of Laser Spectroscopy, Shanxi University, Taiyuan 030006, China
2
Collaborative Innovation Center of Extreme Optics, Shanxi University, Taiyuan 030006, China
*
Author to whom correspondence should be addressed.
Appl. Sci. 2019, 9(8), 1720; https://doi.org/10.3390/app9081720
Submission received: 20 March 2019 / Revised: 14 April 2019 / Accepted: 19 April 2019 / Published: 25 April 2019
(This article belongs to the Special Issue Recent Advances in Statistical Optics and Plasmonics)

Abstract

:
An electromagnetically induced transparency (EIT) of a cascade-three-level atom involving Rydberg level in a room-temperature cell, formed with a cesium 6 S 1 / 2 -6 P 3 / 2 -66 S 1 / 2 scheme, is employed to detect the Autler-Townes (AT) splitting resulted with a 15.21-GHz microwave field coupling the 66 S 1 / 2 →65 P 1 / 2 transition. Microwave field induced AT splitting, f A T , is characterized by the distance of peak-to-peak of an EIT-AT spectrum. The f A T dependence on the microwave Rabi frequency, Ω M W , demonstrates two regions, the strong-coupling linear region, f A T Ω M W and the weak-coupling nonlinear region, f A T Ω M W . The f A T dependencies on the probe and coupling Rabi frequency are also investigated. Using small probe- and coupling-laser, the Rabi frequency is found to enlarge the linear regime and decrease the uncertainty of the microwave field measurements. The measurements agree with the calculations based on a four-level atomic model.

1. Introduction

Atom-based measurements are receiving increasing attention, such as time [1], gravity [2] and electromagnetic fields [3,4,5], due to their invariable level structures that can be used as self calibrating criterions for measurements of these quantities. Atoms have also been successfully used for magnetometry due to their sensitivity to magnetic field [6,7]. Rydberg atom, highly excited atom with principal quantum number n > 10, has a large electric polarizability (∝ n 7 ) and a big microwave-transition dipole moments (∝ n 2 ) [8], which make it a good candidate for measuring external electric fields [9,10,11,12,13,14,15]. Rydberg electromagnetically induced transparency (EIT) [16,17], providing a nondestructive detection of Rydberg states, has been investigated in recent years. Rydberg EIT can be used to measure a large dynamic range of the electric fields of electromagnetic radiation, including microwave fields [10,11,12], millimeter waves [13], static electric fields [14,15] and subwavelength imaging of microwave electric-field distributions [18,19] and field inhomogeneities [20].
Measurement of the microwave field for frequency larger than 1 GHz is mainly based on an Autler-Townes (AT) effect [21] that is induced by the microwave field coupling nearby Rydberg levels [10]. Rydberg-EIT is employed to measure the AT splitting ( f A T ) that is proportional to the microwave electric field, i.e., f A T = Ω M W = μ M W E , with Ω M W the Rabi frequency of microwave field, μ M W the dipole matrix element microwave field coupled and reduced Planck constant. The Rydberg EIT-AT spectrum leads to a direct International System of Units (SI) traceable, self-calibration and broadband measurement of microwave electric fields, that has the capability to realize measurements on a fine spatial resolution. The approach of EIT/AT-based electric-field measurement is recently investigated by several groups around the world [9,10,11,12,13]. However, the AT splitting shows the nonlinear dependence on the coupling Ω M W at a weak electric-field range, which yield a large deviation of the microwave electric-field measurement. Here, we present the measurements of f A T , induced by a 15.21-GHz microwave field coupling the 66 S 1 / 2 -65 P 1 / 2 Rydberg transition in a cesium room-temperature vapor cell. We investigate the dependences of the f A T on the Ω M W and the coupling (probe) Rabi frequency Ω c ( p ) . The results are in accord with the theoretical simulation of the density matrix theory.

2. Experimental Setup

A schematic of an experimental setup and relevant Rydberg EIT-AT four-level ladder diagram are shown in Figure 1a,b. A weak probe beam, with 1 / e 2 waist 90 μ m and wavelength λ p = 852 nm, and a strong coupling laser, with 1 / e 2 waist 135 μ m and wavelength λ c = 510 nm, are overlapped and counter-propagated through a room-temperature cylindrical cesium vapor cell. Both length and diameter of the cell are 25 mm. Cesium ground state | 6 S 1 / 2 F = 4 , excited state | 6 P 3 / 2 F = 5 , and Rydberg state | 66 S 1 / 2 consist of a three-level EIT system. The coupling laser couples the transition, | 6 P 3 / 2 F = 5 | 66 S 1 / 2 . The probe laser is frequency-locked to the transition | 6 S 1 / 2 F = 4 | 6 P 3 / 2 F = 5 using a polarization spectrum method. The microwave electric field with a frequency ∼15.21 GHz is emitted from an antenna that is placed at a distance of 86 cm from the vapor cell, see Figure 1a. The microwave field couples the Rydberg transition | 66 S 1 / 2 | 65 P 1 / 2 , yielding a Rydberg EIT-AT spectrum.
The probe and coupling lasers have the same linear polarization along z-axis. The antenna is set such that the polarization of microwave field is paralleled to the laser-beam polarizations. This configuration leads to the two-peak EIT-AT spectral profile. The Rydberg EIT-AT signal is observed by measuring the transmission of the probe laser using a photodiode detector (PD) after a dichroic mirror (DM).
The Rabi frequency of probe (coupling) laser is expressed as, Ω p ( c ) = μ p ( c ) 2 P p ( c ) π ω p ( c ) 2 c ε 0 , with probe (coupling) laser power P p ( c ) , beam waist ω p ( c ) , permittivity in vacuum ε 0 and light speed c. μ p ( c ) is the transition dipole moment corresponding to the probe (coupling) laser coupled transition, which can be calculated accurately [22]. We change the laser Rabi frequency by varying the laser power with a λ /2 plate that is placed in front of a polarized beam splitter (PBS). Microwave field E M W = 30 P M W g / d [23], with P M W power of the microwave source, g gain of the antenna and d distance to the cell. The microwave field is in far-field regime, the distance d is set to 86-cm far from cell, which is larger than the far-field condition, d 0 = 65 cm here.

3. Results and Discussion

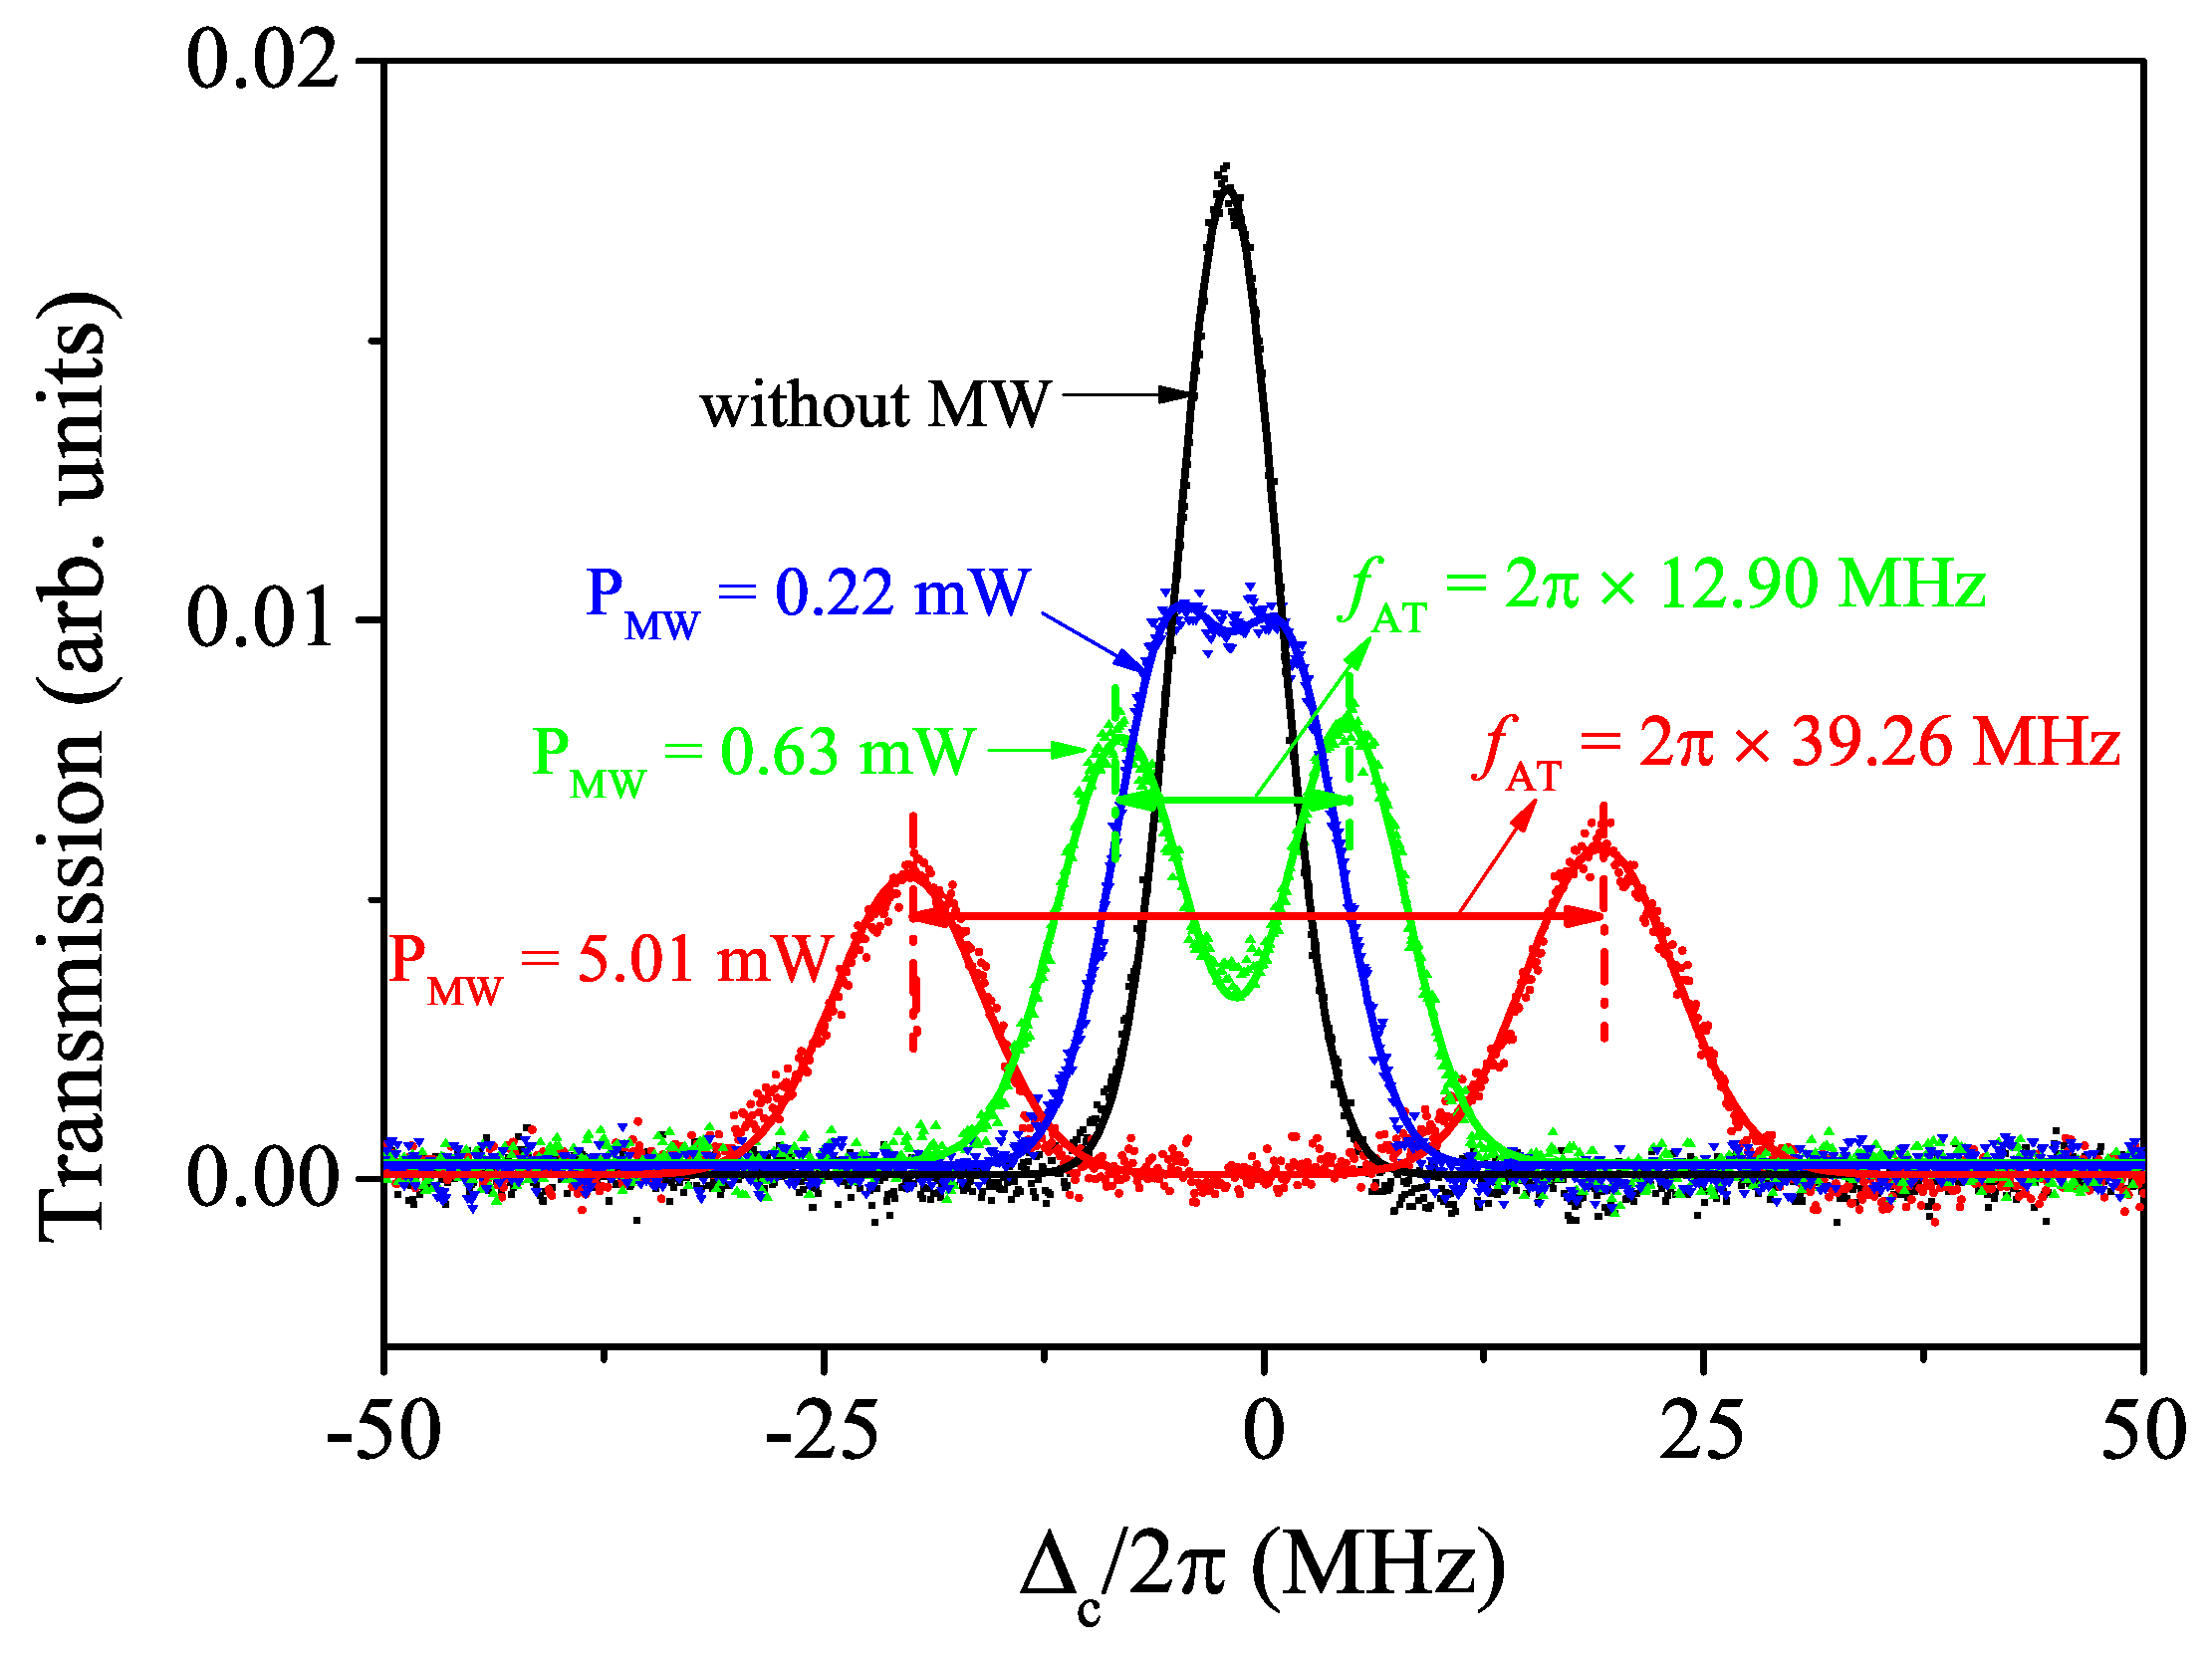
In Figure 2, we present the measurements of four-time averaged Rydberg EIT-AT spectra with an up level 66 S 1 / 2 Rydberg state, and a 15.21-GHz microwave electric field coupling | 66 S 1 / 2 | 65 P 1 / 2 transition. The Rabi frequencies for the probe and coupling beams are Ω p = 2 π × 4.00 MHz and Ω c = 2 π × 4.11 MHz, respectively. The black curve in Figure 2 shows a field-free Rydberg EIT spectrum. EIT linewidth 2 π × (5.83 ± 0.2) MHz (close to the natural linewidth 2 π × 5.2 MHz of intermediate state) is extracted by Lorentz fitting to the EIT spectrum. EIT spectrum is calibrated with the hyperfine level | 6 P 3 / 2 F = 4 Rydberg EIT signal, not shown in here, see ref [14]. It is noted that the observed hyperfine EIT interval of 6 P 3 / 2 ( F = 5 ) and ( F = 4 ) is η × 251 MHz = 168 MHz, here η = λ p / λ c 1 is the Doppler factor. The EIT line splits into two-peak spectra, known as AT effect, when we apply a microwave electric field that couples | 66 S 1 / 2 | 65 P 1 / 2 transition. AT splitting, f A T , defined as the peak-to-peak separation of the line pair, is extracted using the multipeak Lorentz fittings to the spectrum, as denoted with the solid lines in Figure 2. The measured f A T are 2 π × 12.90 MHz and 2 π × 39.26 MHz for microwave power of 0.63 mW and 5.01 mW, respectively. The measured AT splitting, f A T , shows increasing with the microwave electric field.
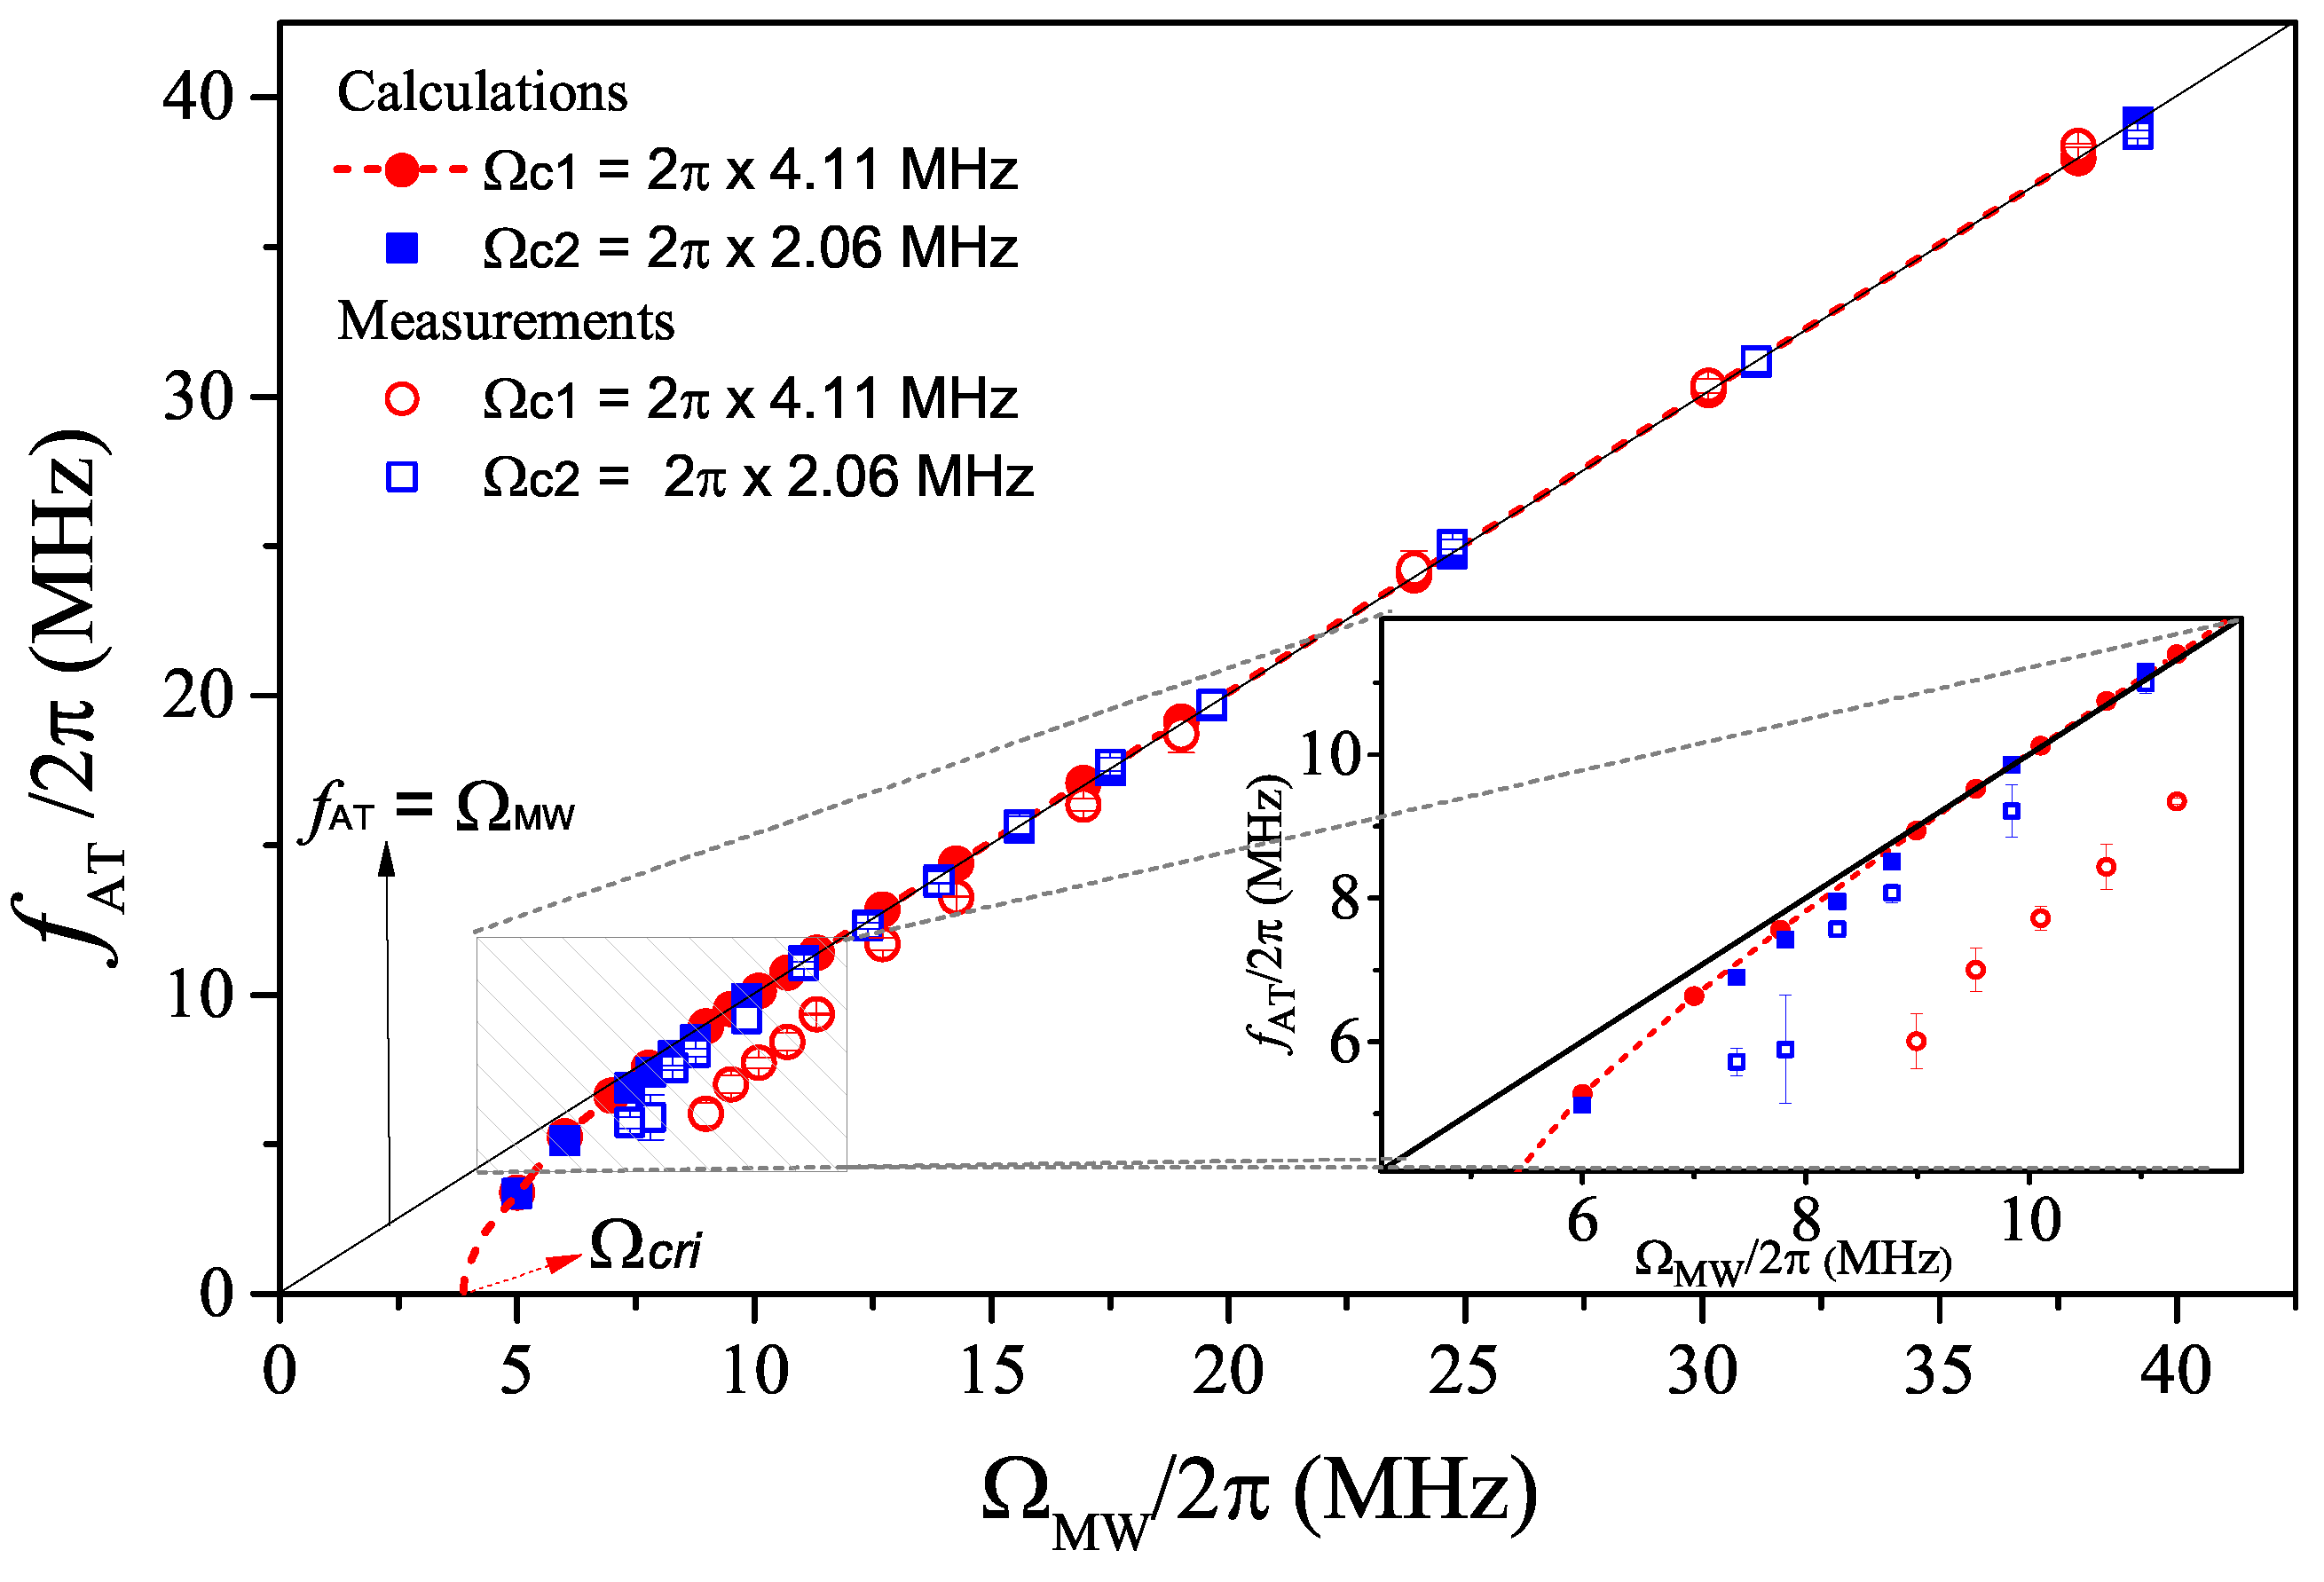
For further investigating the dependence of EIT-AT splitting f A T on the microwave field, we do a series of measurements by varying the microwave power. Figure 3 demonstrates f A T dependence on the microwave Rabi frequency Ω M W with probe Ω p = 2 π × 4.00 MHz and two coupling Rabi frequency Ω c 1 = 2 π × 4.11 MHz (red circles) and Ω c 2 = 2 π × 2.06 MHz (blue squares). It is seen that f A T Ω M W and linearly increases with microwave at the region Ω M W ≳ 2 π × 17 MHz, in a strong field region, for both cases. According to f A T Ω M W and Ω M W = μ M W E , the microwave electric field E can be measured [10]. However, in a weak region, measured f A T is less than Ω M W and denotes a nonlinear dependence, see the inset of Figure 3. The nonlinear behavior is attributed to the EIT effect when probe and coupling fields interact with atoms at a weak-coupling region [24,25].
It is found, from Figure 3’s inset, that the nonlinearity of f A T strongly depends on the microwave-free Rydberg EIT condition, i.e., the EIT linewidth. γ E I T is expressed as ( Ω c 2 + Ω p 2 ) / Γ e g with Γ e g the spontaneous decay rate of intermediate state. EIT linewidth depends on the probe and coupling laser Rabi frequency. For the case Ω c 1 = 2 π × 4.11 MHz in the inset of Figure 3, the γ E I T = 2 π × 5.83 MHz, the f A T begins to show the nonlinear effect at Ω M W ⋍ 2 π × 17 MHz, that is ∼3 γ E I T , and demonstrate the highly nonlinear behavior at Ω M W γ E I T . For the smaller coupling Rabi frequency, Ω c 2 = 2 π × 2.06 MHz and γ E I T = 2 π × 4.35 MHz, we see the nonlinear effect appear at Ω c 1 ⋍ 2 π × 12.0 MHz (∽3 γ E I T ). At a weak-field region, the AT peaks are artificially pulled closer together for simultaneously that leads to f A T < Ω M W . The phenomenon about nonlinear dependence are similar with the theoretical simulation in Ref. [12]. At a nonlinear region, f A T Ω M W , yielding large uncertainty and prevents the precise measurement of the microwave field.
To explain the experimental results in Figure 3, we numerically solve the master equation,
ρ ˙ = i [ H , ρ ] + L
where H is the Hamiltonian of the four-level atomic system in Figure 1b, and L is the Lindblad operator that accounts for the decay processes of the atom, the details of the decay are described in Refs. [12,24].
H = 2 0 Ω p 0 0 Ω p 2 Δ p Ω c 0 0 Ω c 2 ( Δ p + Δ c ) Ω M W 0 0 Ω M W 2 ( Δ p + Δ c + Δ M W ) ,
where Δ p , Δ c , Δ M W are the detunings of the probe laser, couple laser, and the MW field, respectively. Lindblad operator, L , is denoted as
L = Γ 2 ρ 22 γ 12 ρ 12 γ 13 ρ 13 γ 14 ρ 14 γ 21 ρ 21 Γ 3 ρ 33 Γ 2 ρ 22 γ 23 ρ 23 γ 24 ρ 24 γ 31 ρ 31 γ 32 ρ 32 Γ 4 ρ 44 Γ 3 ρ 33 γ 34 ρ 34 γ 41 ρ 41 γ 42 ρ 42 γ 43 ρ 43 Γ 4 ρ 44 ,
where γ i j =( Γ i + Γ j )/2 and Γ i ( j ) is the spontaneous decay rate. We find the steady-state solution for various values of Ω c , Ω p and Ω M W by setting ρ ˙ = 0 and obtain the matrix element ρ 12 that is proportional to the absorption coefficient of the probe laser [25]. The Beer’s absorption coefficient for the probe is α = 2 π I m ( χ ) λ p , with χ the susceptibility of the medium seen by the probe laser. Considering atomic velocity distribution at temperature T, χ is written as χ ( υ )d( υ ) ∝ ρ 12 N( υ )d( υ ), and N( υ ) is the Maxwellian velocity distribution function at T. In Figure 3, we also present calculated f A T with filled circles ( Ω c 1 ) and squares ( Ω c 2 ). We note that the calculations show agreement well with measurements at a large Ω M W region for two coupling Rabi frequency cases; whereas at a weak Ω M W region, the calculated f A T display a nonlinear dependence, but measurements for the small Rabi frequency ( Ω c 2 ) is closer to the calculations than the large ( Ω c 1 ) case. Furthermore, the calculated f A T is almost the same at an interested Ω M W range for two Ω c cases, this is attributed to the coupling-laser induced EIT line broadening that is not taken into account in our calculations.
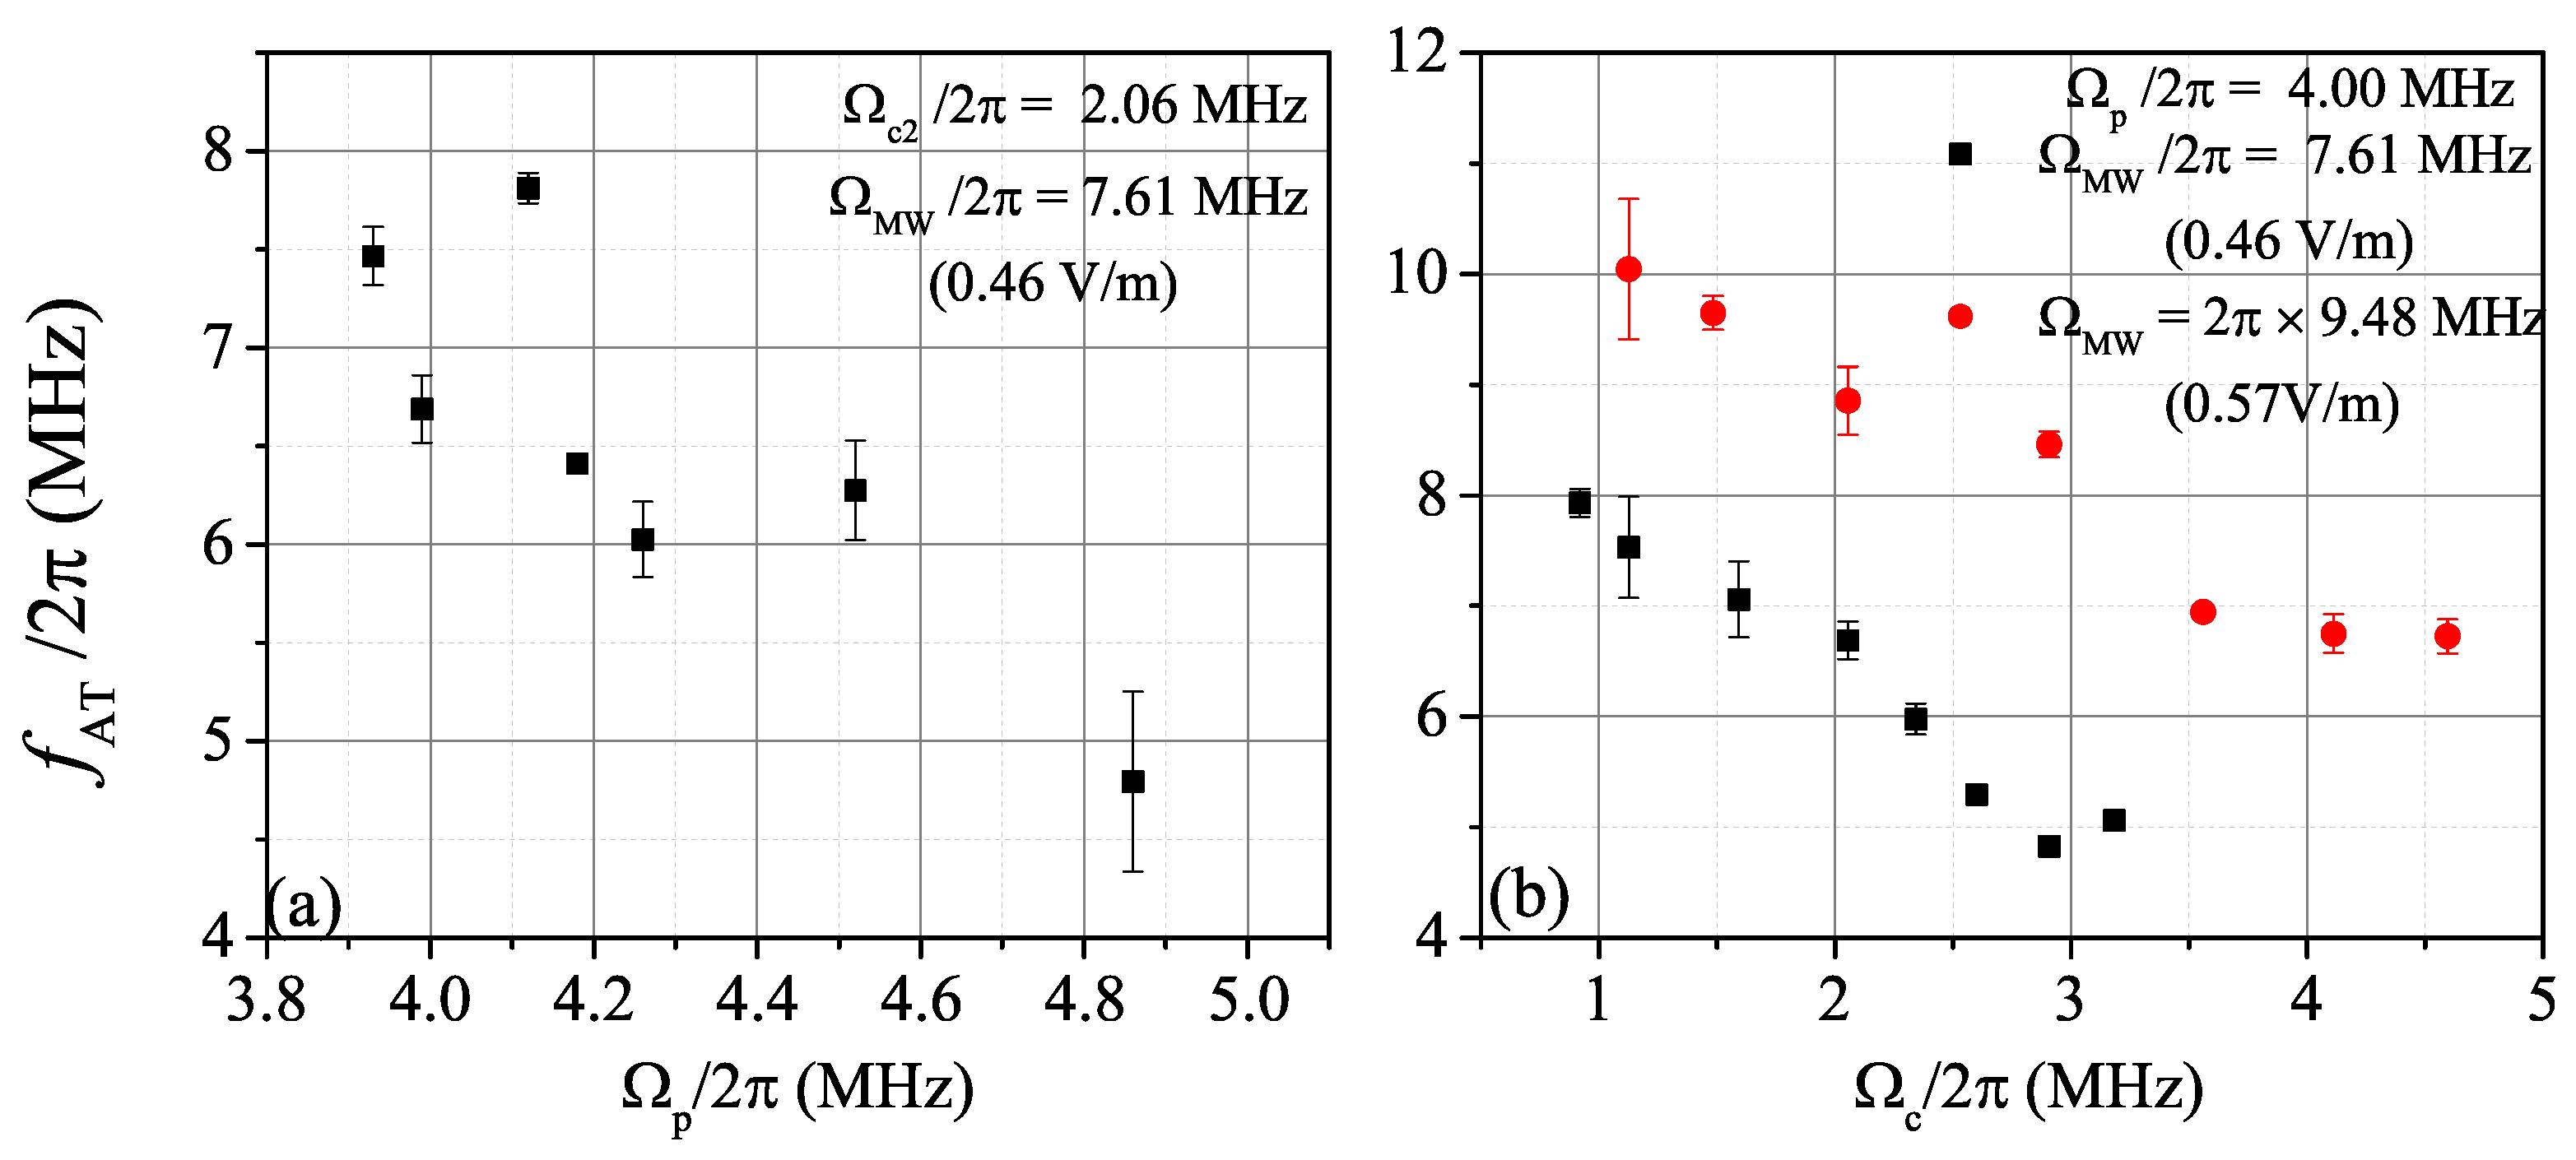
To verify the assumption of EIT line broadening, we keep microwave Ω M W fixed and vary the probe/coupling laser Rabi frequency and do a series of measurements of f A T . In Figure 4, we display the f A T dependence on Ω p in Figure 4a and Ω c in Figure 4b with Ω M W = 2 π × 7.61 MHz (corresponding to E M W = 0.46 V/m) and Ω M W = 2 π × 9.48 MHz ( E M W = 0.57 V/m). It is seen that the f A T shows different value as Ω c or Ω p varies. For the range Ω c and Ω p we used in Figure 4, microwave-free EIT linewidth γ E I T 2 π × 6.5 MHz. The f A T is located in the nonlinear region due to microwave Ω M W = 2 π × 7.61 MHz (9.48 MHz) that is smaller than 3 γ E I T , which result in f A T less than Ω M W . The error bars in Figure 4 display the standard error of four times measurements. The error bar of Figure 4a is less than ±0.18 for Ω p / 2 π < 4 MHz, and increases with Ω p , this is because the large probe Rabi frequency leads to an EIT linewidth that approaches to Ω M W . The f A T fluctuation below Ω p / 2 π = 4 MHz may due to the inhomogeneous of the microwave field in the cell. In Figure 4b, the error bar decrease with coupling Rabi frequency, which is attributed to the large Ω c yielding enhanced EIT-AT spectrum. The deviations coming from the nonlinear behavior for the cases in Figure 3 and Figure 4 would result in a measurement uncertainty.
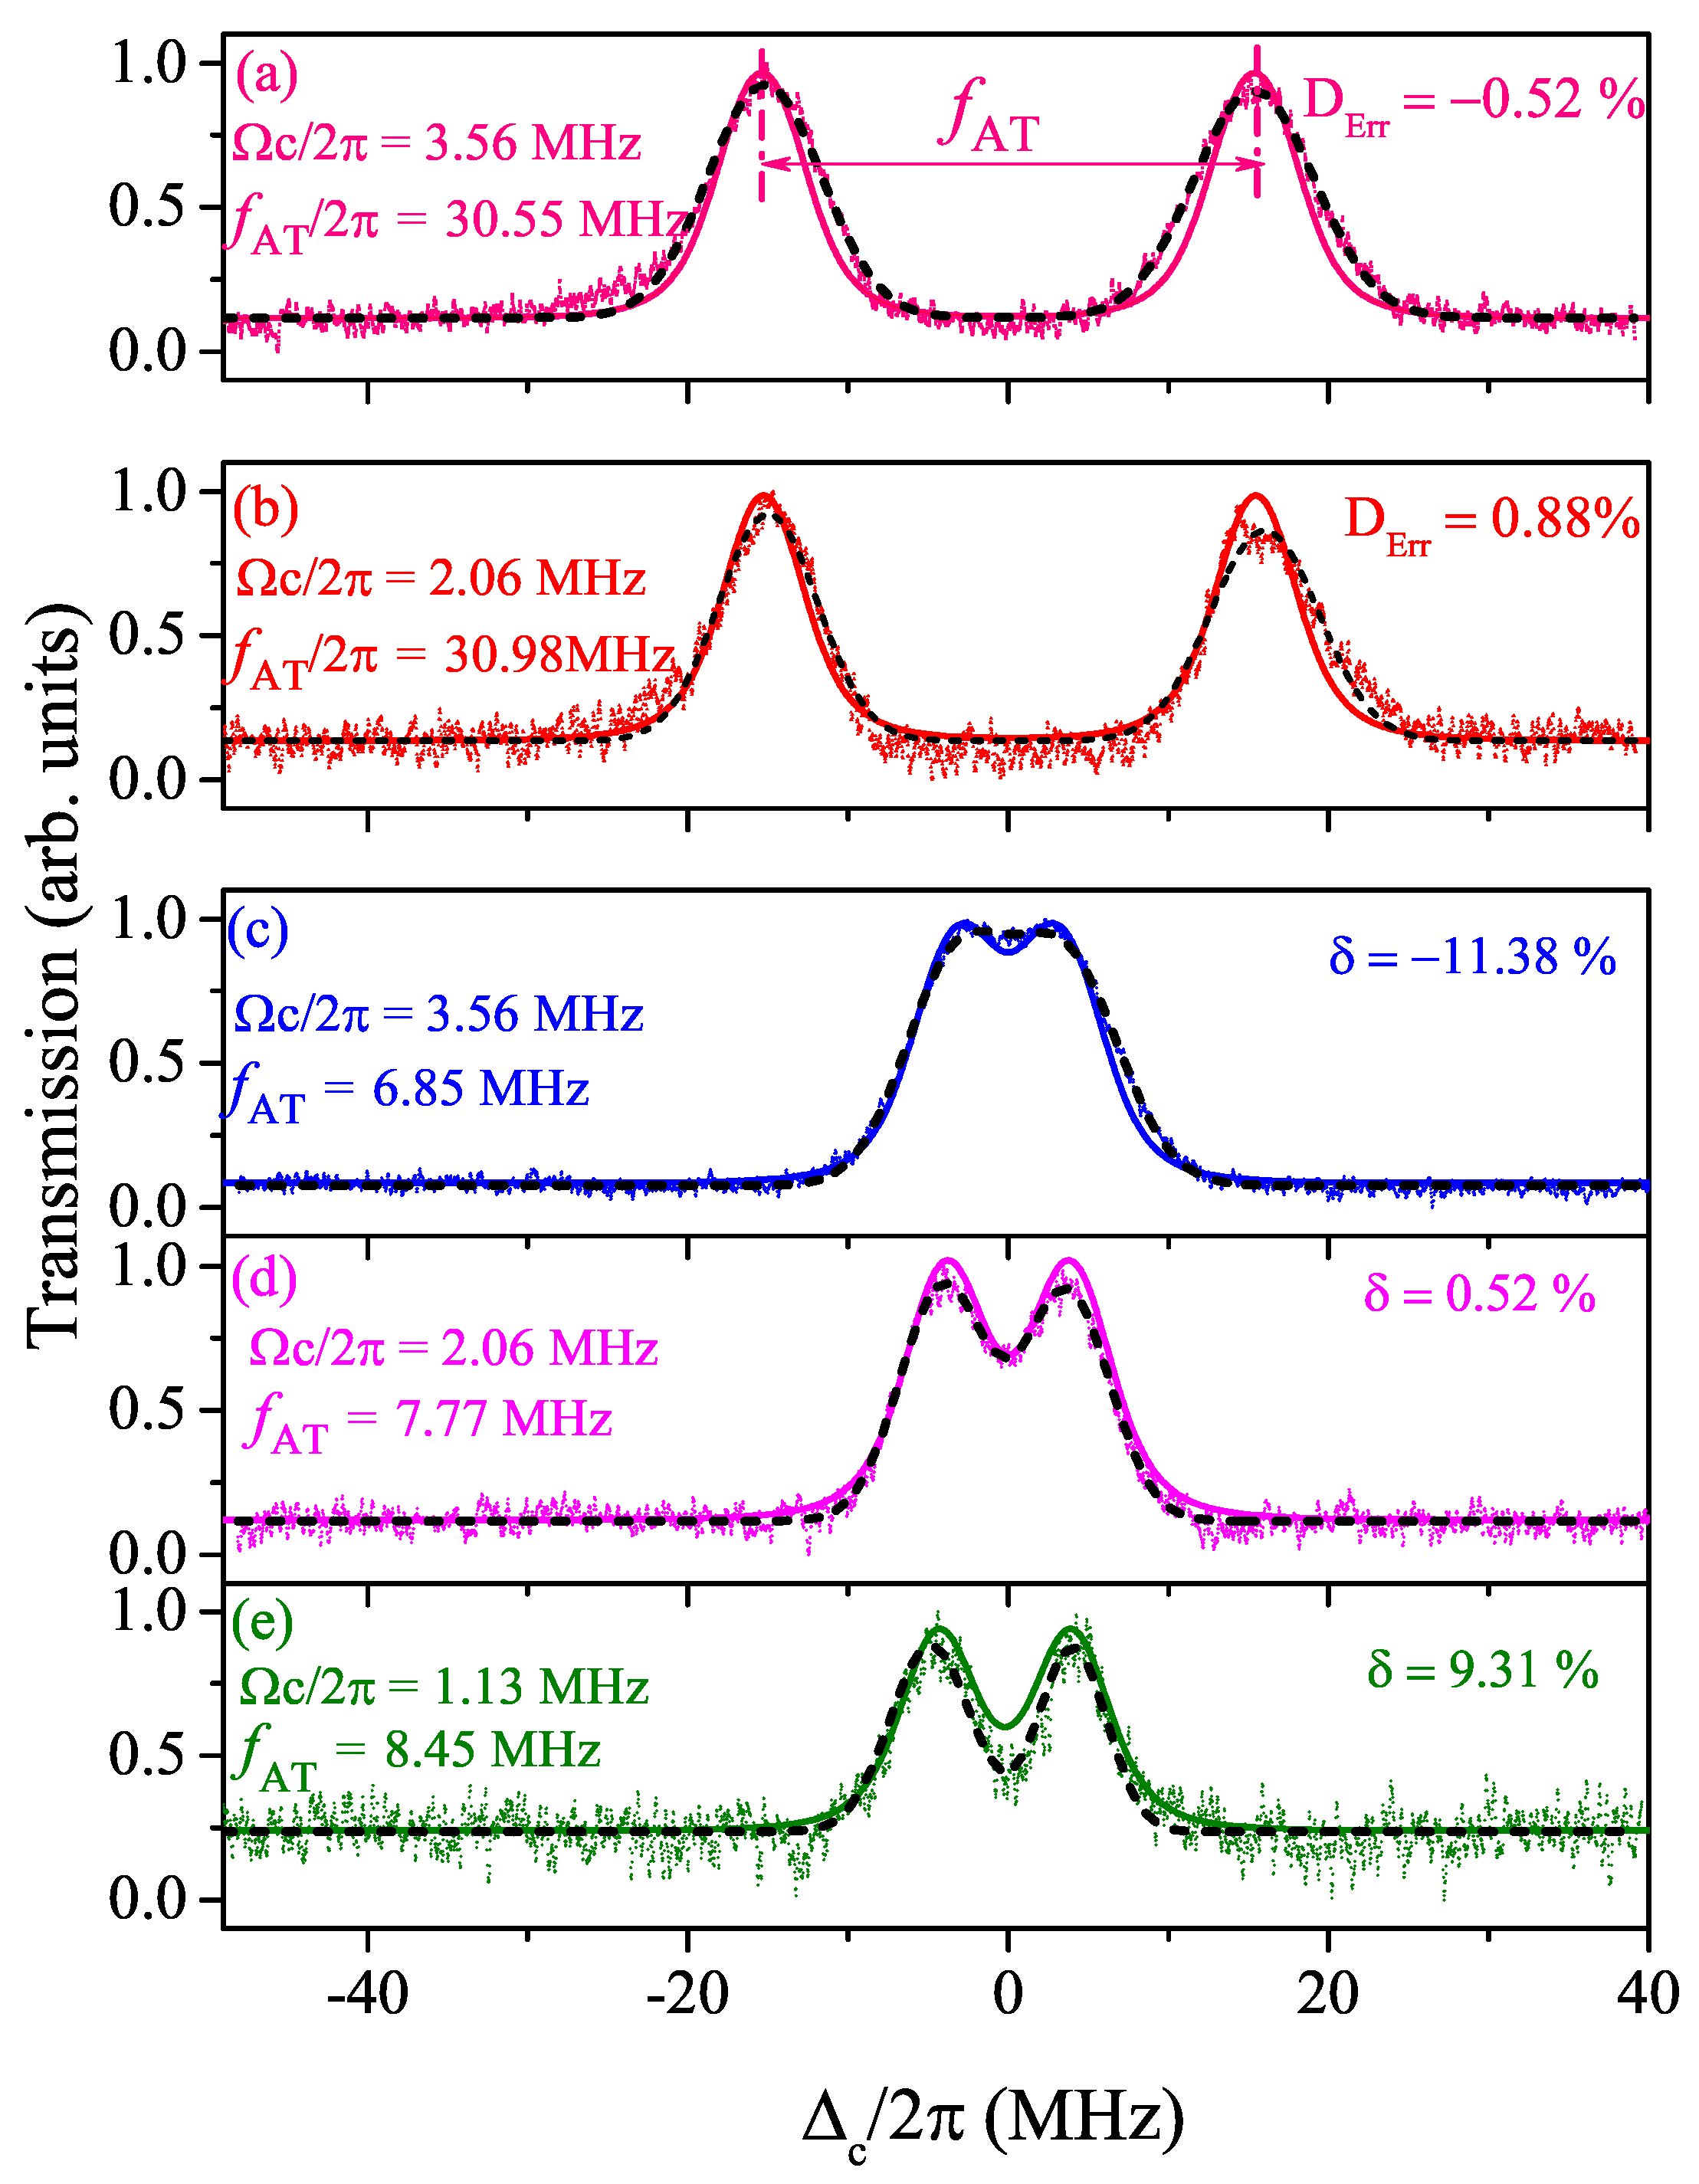
In order to investigate how the probe/coupling laser affect the microwave electric field measurement for f A T at a linear and nonlinear regions, we do the measurements and analysis the field-measurements uncertainty. In Figure 5, we present four-time averaged EIT-AT spectra for the f A T at a linear region with Ω M W = 2 π × 30.71 MHz (Figure 5a,b) and a nonlinear region with Ω M W = 2 π × 7.73 MHz (Figure 5c–e) and indicated coupling Ω c . For comparison, we also plot the calculations based on the four-level model, see solid lines in Figure 5. The microwave Rabi frequency Ω M W used in calculations are same as f A T for linear regime in Figure 5a,b, the calculations reproduce the EIT-AT spectra well. The small difference at shoulder of the AT peak is due to the inhomogeneous of MW field in the cell that yields the AT line broaden [23]. In Figure 5c–e, the microwave Rabi frequency Ω M W in calculations has a tiny difference with the measured f A T . Below we analysis the relative deviation, D E r r , that is defined as the ratio ( f A T Ω M W )/ Ω M W . In the linear region, the measured f A T Ω M W and independent of the coupling Rabi frequency. The extracted D E r r is −0.52% and 0.88%, see Figure 5a,b, which are smaller than 1%. However, in the nonlinear region, for the same microwave field the measured f A T display different value and varies with the coupling laser Rabi frequency leading to large deviations of field measurements. The resultant uncertainty D E r r in Figure 5c–e are −11.38%, 0.52% and 9.31% for Ω c /2 π = 3.56 MHz, 2.06 MHz and 1.13 MHz, respectively. The results of Figure 4 and Figure 5 provide experimental evidence for the theoretical simulations in Ref. [12].
From the results of Figure 3, Figure 4 and Figure 5, it is seen that the f A T shows two regions, the strong microwave Ω M W linear region and the weak field nonlinear region. At the linear region, f A T Ω M W , which can be used to measure precisely the microwave electric field with uncertainty less than 1%, see Figure 5a,b, one orders of magnitude better than the conventional microwave field measurements. At the nonlinear region, f A T strongly depends on the microwave-free EIT linewidth, relying on the probe and coupling laser Rabi frequency. From Figure 3 and Figure 5c–e, the smaller the coupling Ω c is, the narrower the microwave-free EIT linewidth is and the smaller the f A T can be separated, see Figure 5c,d. However, when the coupling Ω c is further decreased, the EIT-AT spectrum shows good two-peak profile but with low signal-noise ratio, which also leads to the large measurement uncertainty in Figure 5c. For the electric field measurement using EIT-AT, the narrow EIT linewidth is expected to obtain a large f A T linear region and precise microwave field measurements.
From Figure 3, we note that this nonlinear behavior also leads to a critical value for Ω c r i before AT splitting occurs. The critical value corresponds to the minimum splitting that can be detected and is given by the locations where the curves cross the x-axis, Ω c r i , see the short-dashed arrow in Figure 3. For Ω M W Ω c r i , the microwave electric field cannot be measured with this EIT-AT method. The Ω c r i is relative to the EIT linewidth, γ E I T . The narrower the γ E I T is, the smaller Ω c r i is. The narrow linewidth EIT spectrum can be obtained with a weak coupling(probe) laser beam (small Rabi frequency). However, this strategy to reduce EIT linewidth has a limitation that is limited by the Doppler broadening. For reducing the EIT linewidth further, it need to lower the temperature of the atomic vapor and using the laser trapped atoms. In other hand, using weak probe(coupling) laser Rabi frequency will increase the background noise and reducing the sensitivity, see Figure 5c.

4. Conclusions

In conclusion, we have investigated Rydberg EIT-AT spectra employing cesium ladder four-level system involving Rydberg | 66 S 1 / 2 , where a 15.21-GHz microwave field coupling the transition of | 66 S 1 / 2 | 65 P 1 / 2 . Microwave induced AT splitting f A T is proportional to coupled Rabi frequency Ω M W = μ M W E , providing a self-calibrated and broadband measurement of microwave electric field [10]. The f A T dependence on Ω M W at a weak microwave field region shows a nonlinear effect, f A T < Ω M W . We find that the nonlinear region depends on the microwave-free EIT linewidth. When Ω M W 3 γ E I T , the measured f A T displays a good linear behavior, the uncertainty of the measured microwave field is less than 1%, while Ω M W 3 γ E I T , f A T enter the nonlinear region, yielding the large measurement uncertainty using this technology. When Ω M W γ E I T , it shows a highly nonlinear effect, corresponding uncertainty even up to 40%. Figure 4 and Figure 5 demonstrate that using the weak probe and coupling laser beams, forming the narrow linewidth EIT spectrum, can enlarge the linear region and decrease the measurement uncertainty. The narrow linewidth EIT spectrum also can be obtained with a three-photon EIT scheme [26]. To observe a narrow EIT linewidth, one must decrease the probe and coupling laser power. This will increase the background noise as in Figure 5c. We need to balance the linewidth and spectrum sensitivity in experiments. It is noted that this kind of nonlinear presented in this work and Ref. [12] is inevitable result of the quantum effect, when the Ω M W decrease to the critical value, the system become the quantum interference region, as discussed in our previous work [24]. In future work, the modulation and demodulation technique will be used to improve the Rydberg-atom-based field measurements.

Author Contributions

Conceptualization, J.Z., Y.J. and L.H.; investigation, J.Z., Y.J. and L.H.; software, Y.J. and Y.X.; validation, L.H., Y.X. and J.F.; formal analysis, L.H., Y.X. and J.F.; Writing—original draft, L.H.; writing—review and editing, J.Z.; project administration, S.J., J.Z. and Y.J.; funding acquisition, S.J., J.Z. and Y.J.

Funding

The work was supported by the National Key R&D Program of China (Grant No. 2017YFA0304203), the National Natural Science Foundation of China (Grants No. 61675123, No. 61775124 and 11804202), Changjiang Scholars and Innovative Research Team in University of Ministry of Education of China (Grant No. IRT13076), and the State Key Program of National Natural Science of China (Grant No. 11434007 and 61835007).

Conflicts of Interest

The authors declare no conflict of interest.

References

  1. Martin, M.J.; Bishof, M.; Swallows, M.D.; Zhang, X.; Benko, C.; von-Stecher, J.; Gorshkov, A.V.; Rey, A.M.; Ye, J. A quantum many-body spin system in an optical lattice clock. Science 2013, 341, 632–636. [Google Scholar] [CrossRef]
  2. Biedermann, G.W.; Wu, X.; Deslauriers, L.; Roy, S.; Mahadeswaraswamy, C.; Kasevich, M.A. Testing gravity with cold-atom interferometers. Phys. Rev. A 2015, 91, 033629. [Google Scholar] [CrossRef]
  3. Savukov, I.M.; Seltzer, S.J.; Romalis, M.V.; Sauer, K.L. Tunable atomic magnetometer for detection of radio-frequency magnetic fields. Phys. Rev. Lett. 2005, 95, 063004. [Google Scholar] [CrossRef]
  4. Horsley, A.; Du, G.-X.; Pellaton, M.; Affolderbach, C.; Mileti, G.; Treutlein, P. Imaging of relaxation times and microwave field strength in a microfabricated vapor cell. Phys. Rev. A 2013, 88, 063407. [Google Scholar] [CrossRef]
  5. Horsley, A.; Du, G.-X.; Treutlein, P. Widefield microwave imaging in alkali vapor cells with sub-100 μm resolution. New J. Phys. 2015, 17, 112002. [Google Scholar] [CrossRef]
  6. Patton, B.; Versolato, O.O.; Hovde, D.C.; Corsini, E.; Higbie, J.M.; Budker, D. A remotely interrogated all-optical 87Rb magnetometer. Appl. Phys. Lett. 2012, 101, 083502. [Google Scholar] [CrossRef]
  7. Budker, D.; Romalis, M. Optical magnetometry. Nat Phys. 2007, 3, 227–234. [Google Scholar] [CrossRef]
  8. Gallagher, T.F. Rydberg Atoms; Cambridge University Press: New York, NY, USA, 1994. [Google Scholar]
  9. Holloway, C.L.; Gordon, J.A.; Jefferts, S.; Schwarzkopf, A.; Anderson, D.A.; Miller, S.A.; Thaicharoen, N.; Raithel, G. Broadband Rydberg Atom-Based Electric-Field Probe for SI-Traceable,Self-Calibrated Measurements. IEEE Trans. Antennas Propag. 2014, 62, 6169–6182. [Google Scholar] [CrossRef]
  10. Sedlacek, J.A.; Schwettmann, A.; Kübler, H.; Löw, R.; Pfau, T.; Shaffer, J.P. Microwave electrometry with Rydberg atoms in a vapour cell using bright atomic resonances. Nat. Phys. 2012, 8, 819–824. [Google Scholar] [CrossRef]
  11. Fan, H.Q.; Kumar, S.; Sedlacek, J.; Kübler, H.; Karimkashi, S.; Shaffer, J.P. Atom based RF electric field sensing. J. Phys. B At. Mol. Opt. Phys. 2015, 48, 202001. [Google Scholar] [CrossRef]
  12. Holloway, C.L.; Simons, M.T.; Gordon, J.A.; Dienstfrey, A.; Anderson, D.A.; Raithel, G. Electric field metrology for SI traceability: Systematic measurement uncertainties in electromagnetically induced transparency in atomic vapor. J. Appl. Phys. 2017, 121, 233106. [Google Scholar] [CrossRef]
  13. Gordon, J.A.; Holloway, C.L.; Schwarzkopf, A.; Anderson, D.A.; Miller, S.; Thaicharoen, N.; Raithel, G. Millimeter wave detection via Autler-Townes splitting in rubidium Rydberg atoms. Appl. Phys. Lett. 2014, 105, 024104. [Google Scholar] [CrossRef]
  14. Jiao, Y.C.; Han, X.X.; Yang, Z.W.; Li, J.K.; Raithel, G.; Zhao, J.M.; Jia, S.T. Spectroscopy of cesium Rydberg atoms in strong radio-frequency fields. Phys. Rev. A 2016, 94, 023832. [Google Scholar] [CrossRef]
  15. Jiao, Y.C.; Hao, L.P.; Han, X.X.; Bai, S.Y.; Raithel, G.; Zhao, J.M.; Jia, S.T. Atom-based radio-frequency field calibration and polarization measurement using cesium nDJ Floquet States. Phys. Rev. Appl. 2017, 8, 014028. [Google Scholar] [CrossRef]
  16. Fleischhauer, M.; Imamoglu, A.; Marangos, J.P. Electromagnetically induced transparency: Optics in coherent media. Rev. Mod. Phys. 2005, 77, 633–673. [Google Scholar] [CrossRef]
  17. Mohapatra, A.K.; Jackson, T.R.; Adams, C.S. Coherent optical detection of highly excited Rydberg states using electromagnetically induced transparency. Phys. Rev. Lett. 2007, 98, 113003. [Google Scholar] [CrossRef]
  18. Fan, H.Q.; Kumar, S.; Daschner, R.; Kübler, H.; Shaffer, J.P. Sub-wavelength microwave electric field imaging using Rydberg atoms inside atomic vapor cells. Opt. Lett. 2014, 39, 3030–3033. [Google Scholar] [CrossRef]
  19. Holloway, C.L.; Gordon, J.A.; Schwarzkopf, A.; Anderson, D.A.; Miller, S.A.; Thaicharoen, N.; Raithel, G. Sub-wavelength imaging and field mapping via electromagnetically induced transparency and Autler-Townes splitting in Rydberg atoms. Appl. Phys. Lett. 2014, 104, 244102. [Google Scholar] [CrossRef]
  20. Fan, H.Q.; Kumar, S.; Sheng, J.T.; Shaffer, J.P.; Holloway, C.L.; Gordon, J.A. Effect of vapor-cell geometry on Rydberg-atom-based measurements of radio-frequency electric fields. Phys. Rev. Appl. 2015, 4, 044015. [Google Scholar] [CrossRef]
  21. Autler, S.H.; Townes, C.H. Stark effect in rapidly varying fields. Phys. Rev. 1955, 100, 703–722. [Google Scholar] [CrossRef]
  22. Simons, M.T.; Gordon, J.A.; Holloway, C.L. Simultaneous use of Cs and Rb Rydberg atoms for dipole moment assessment and RF electric field measurements via electromagnetically induced transparency. J. Appl. Phys. 2016, 120, 123103. [Google Scholar] [CrossRef]
  23. Fan, J.B.; Jiao, Y.C.; Hao, L.P.; Xue, Y.M.; Zhao, J.M.; Jia, S.T. Microwave electromagnetically induced transparency and Aulter-Townes spectrum of cesium Rydberg atom. Acta Phys. Sin. 2018, 67, 093201. [Google Scholar]
  24. Hao, L.P.; Jiao, Y.C.; Xue, Y.M.; Han, X.X.; Bai, S.Y.; Zhao, J.M.; Raithel, G. Transition from electromagnetically induced transparency to Autler-Townes splitting in cold cesium atoms. New J. Phys. 2018, 20, 073024. [Google Scholar] [CrossRef]
  25. Scully, M.O.; Zubairy, M.S. Quantum Optics; Cambridge University Press: Cambridge, UK, 1997. [Google Scholar]
  26. Kumar, S.; Fan, H.Q.; Kübler, H.; Sheng, J.T.; Shaffer, J.P. Atom-based sensing of weak radio frequency electric fields using homodyne readout. Sci. Rep. 2017, 7, 42981. [Google Scholar] [CrossRef] [PubMed]
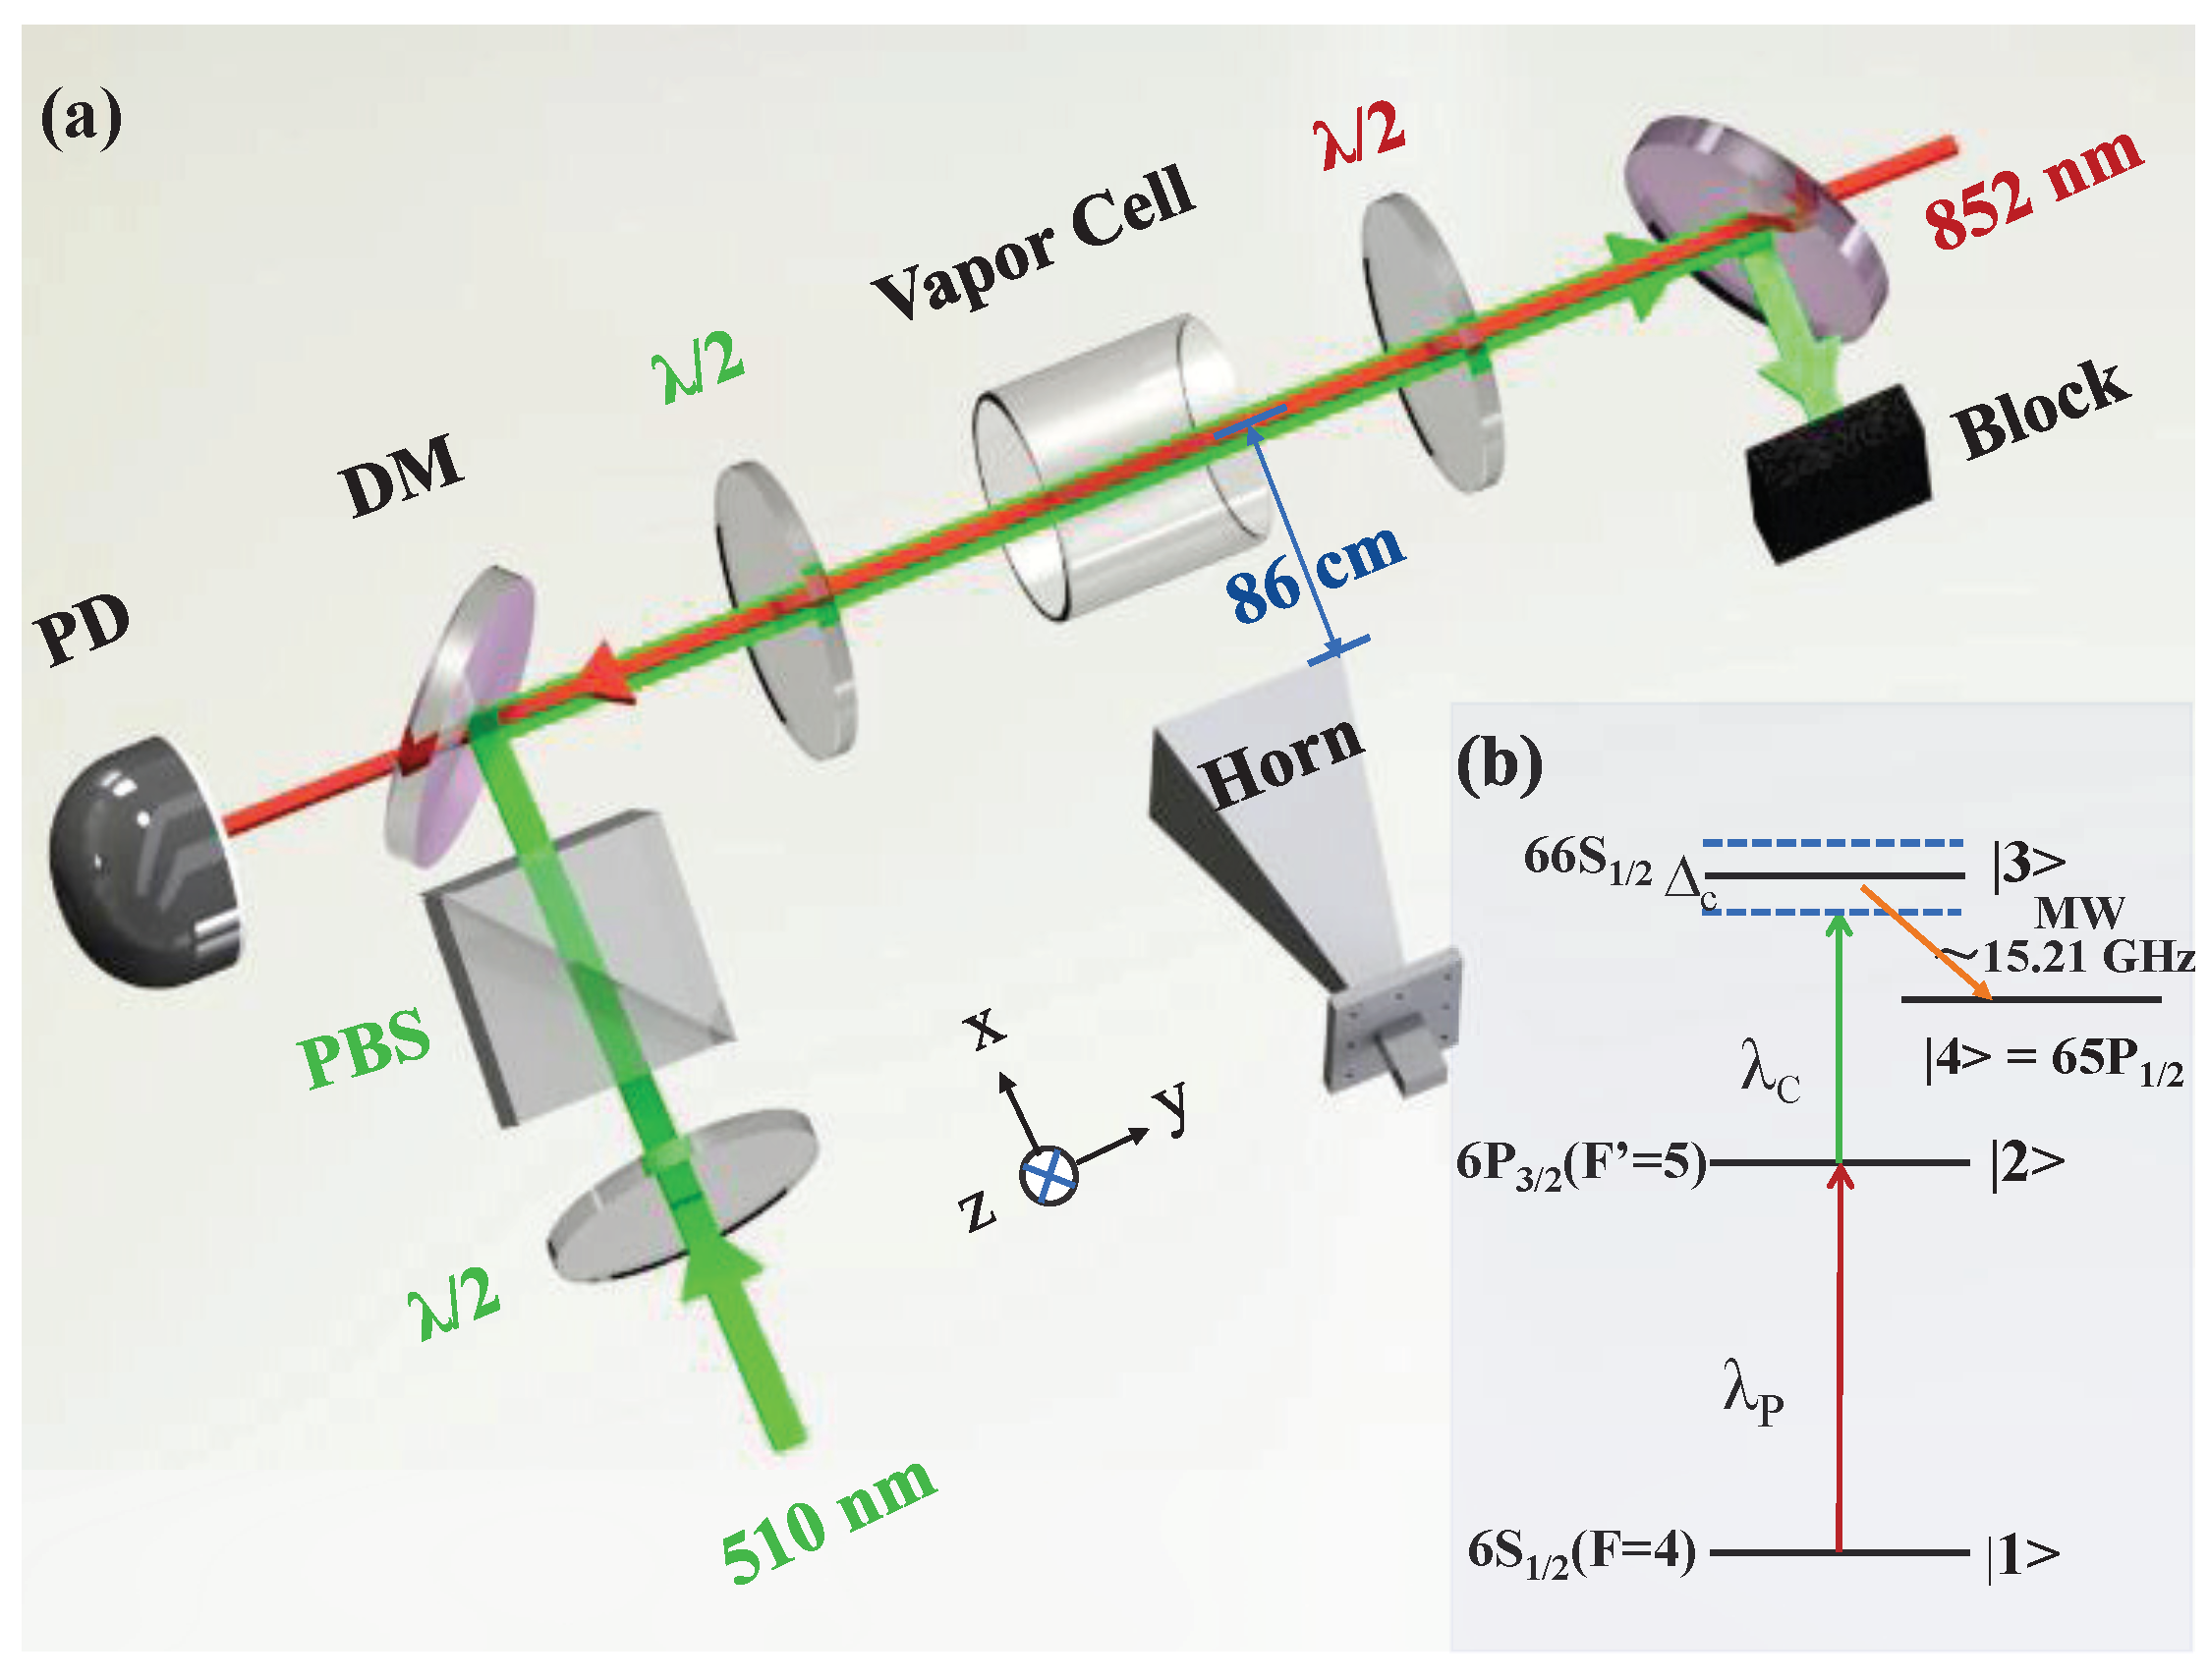
Figure 1. (color online) (a) Sketch of an experimental setup. The coupling, λ c = 510 nm, and probe, λ p = 852 nm, lasers counter-propagate through a cesium room-temperature vapor cell along the y-axis. The horn antenna, placed 86 cm far from the cell (not scaled), emits the microwave electric field with the frequency ∼ 15.21 GHz coupling Rydberg transition, producing an EIT-AT spectrum. The polarization of the microwave field is set to parallel to the polarization of probe and coupling beams. The probe beam is passed through a dichroic mirror (DM) and is detected with a photodiode detector (PD). PBS: polarized beam splitter; (b) Energy level diagram of cesium cascade four-level system. The probe laser is resonant with the lower transition, | 6 S 1 / 2 F = 4 | 6 P 3 / 2 F = 5 , and the coupling laser is scanned through the Rydberg transitions, | 6 P 3 / 2 F = 5 | 66 S 1 / 2 . Δ c is the coupling laser detuning. The applied microwave electric field couples the transition, | 66 S 1 / 2 | 65 P 1 / 2 , that forms Rydberg EIT-AT spectrum.
Applsci 09 01720 g001
Figure 2. (color online) Measurements of Rydberg EIT-AT spectra as a function of the coupling laser detuning Δ c with the probe/coupling Rabi frequency Ω p = 2 π × 4.00 MHz and Ω c = 2 π × 4.11 MHz and the indicated microwave power P = 0.22 mW (blue), 0.63 mW (green) and 5.01 mW (red). The frequency of microwave field is set to 15.21 GHz coupling Rydberg transition | 66 S 1 / 2 | 65 P 1 / 2 . The microwave induced AT splitting, f A T , is extracted with the multipeak Lorentz fittings to the EIT-AT spectra (solid lines). The microwave-free EIT signal (black) is obtained with 6 S 1 / 2 -6P S 3 / 2 -66 S 1 / 2 three-level scheme, corresponding EIT linewidth γ E I T = 2 π × (5.83 ± 0.2) MHz.
Applsci 09 01720 g002
Figure 3. (color online) Measurements (hollow) and calculations (solid) of f A T as a function of microwave Rabi frequency Ω M W for the probe Rabi frequency Ω p = 2 π × 4.00 MHz and two different coupling Rabi frequency Ω c 1 = 2 π × 4.11 MHz (red circles) and Ω c 2 = 2 π × 2.06 MHz (blue squares). f A T shows linear increase as microwave field, and f A T Ω M W in a strong microwave coupling range, when Ω M W 2 π × 17 MHz for the case Ω c 1 and 2 π × 10 MHz for the case Ω c 2 ; whereas f A T < Ω M W , demonstrating the nonlinear dependence on the microwave field. Inset: a room-in of nonlinear region indicated by the gray rectangle. The black thin line indicates the reference f A T = Ω M W .
Applsci 09 01720 g003
Figure 4. (color online) Measurements of f A T as a function of probe Rabi frequency Ω p (a) and coupling Rabi frequency Ω c (b) for fixed microwave electric field Ω M W / 2 π = 7.61 MHz and 9.48 MHz, corresponding to electric field E = 0.46 V/m and 0.57 V/m, respectively. The error bars show the standard error of four times measurements.
Applsci 09 01720 g004
Figure 5. (color online) Measurements (symbols) and calculations (solid lines) of Rydberg EIT-AT spectra as a function of the coupling laser detuning Δ c and indicated coupling Rabi frequencies for fixed probe Ω p = 2 π × 4.00 MHz and two microwave field Ω M W = 2 π × 30.71 MHz (a,b) and 2 π × 7.73 MHz (ce). The black dashed lines display multipeak Lorentz fittings to the EIT-AT spectra for extracting f A T . The deviation D E r r is defined as the ratio ( f A T Ω M W )/ Ω M W . In (a,b), f A T locates in the linear region where the measured microwave electric field is independent on the coupling laser, corresponding D E r r is smaller than 1%. In (ce), f A T is in the nonlinear region where measured microwave electric field strongly dependent on the coupling laser Ω c .
Applsci 09 01720 g005