Article

A Microcrack Location Method Based on Nonlinear S0 Mode Lamb Wave and Probability Scan Positioning Imaging Matrix

1
State Key Laboratory of Precision Measurement Technology and Instrument, Tianjin University, Tianjin 300072, China
2
Department of Materials Science and Engineering, The Ohio State University, 2041 N. College Road, Columbus, OH 43210, USA
*
Author to whom correspondence should be addressed.
Appl. Sci. 2019, 9(9), 1874; https://doi.org/10.3390/app9091874
Submission received: 2 April 2019 / Revised: 22 April 2019 / Accepted: 26 April 2019 / Published: 7 May 2019

Abstract

:

Featured Application

Our discoveries have great potential for early damage location, engineering safety assessment and structural life assessment.

Abstract

Early damage, such as microcrack, occupies most of the fatigue life of materials, and timely detection of early damage and positioning has great engineering and economic value. In this paper, a matrix scanning and positioning imaging method based on a probabilistic algorithm is proposed. Cooperating with the single-mode (S0) lamb wave, the microcrack in the thin plate material can be efficiently positioned. Taking the S0 mode lamb wave as the fundamental wave can effectively reduce the influence of the dispersion effect on the signal analysis. Meanwhile, in order to reduce the noise interference, the signal is reconstructed by empirical mode decomposition (EMD) to achieve the filtering effect. Then, the ABAQUS finite element simulation software is used to compare the positioning results under different locations of microcrack and different arrangements of probe. Finally, the feasibility of the localization algorithm is verified by the RAM-5000 SNAP nonlinear ultrasound system. The experimental results are consistent with the simulation theory, and the microcrack is effectively positioned. This facilitates our timely remedial action or further assessment of the remaining value of the material.

1. Introduction

Metallic materials are widely used in aerospace, transportation, construction, and other fields. However, the metal materials may generate defects due to fatigue loading. Studies have shown that the degradation of metal material performance has obvious stage characteristics [1,2]. Due to cyclic loading, a large number of dislocation groups are generated inside the material, and the damage accumulates, which in turn causes the resident slip zone and microcracks to be generated. For well-designed engineering components, early damage to the materials accounts for the majority of their life, and the early performance degradation accounts for approximately 85% of the total fatigue life [3,4,5]. Eventually, the microcracks expand into macrocracks until the material is completely destroyed. In practical engineering applications, due to the harsh working environment of the material, micro-cracks that are not discovered in time will greatly affect the overall response of the structure, making the material brittleness increase, and partial or global rebound is unstable. The probability of occurrence of the fracture accident increases, which may result in irretrievable loss [6].
In order to ensure the safety of engineering structures, microcrack detection technology has received more and more attention. Non-destructive testing (NDT) technology is widely used because it has a larger detection range, faster detection speed, and causes no damage to the structure. Destructive testing is only for manufacturing raw materials and is clearly inappropriate for structures that are being processed or in service. However, NDT can achieve full participation and, because there is no harm to the structure, a 100% full inspection can be achieved if necessary [7,8,9]. Among the NDT methods, the permeation detection (PT) cannot quantitatively evaluate defects, the radiographic testing (RT) is slow and harmful to the human body, and the magnetic particle testing (MT) cannot detect non-ferromagnetic material; in ultrasonic testing (UT), the traditional linear ultrasonic is severely attenuated at high frequencies, and the wavelength becomes longer at low frequencies. It is not suitable for detecting sheet materials and is not sensitive to small damage. Laser ultrasonic is a non-contact, high-precision, and non-invasive ultrasonic detection technology. However, due to its complicated operation, low convenience, and the immature detection technology of hard and brittle materials, its application is limited [10,11]. The nonlinear ultrasonic testing technology is based on nonlinear characteristics such as harmonics and subharmonics for damage identification. It not only easily detects, but is also sensitive to early damage such as microcrack. Therefore, this paper uses nonlinear ultrasonic testing technology to detect microcracks in sheet materials. Since the higher harmonic signal is weaker and easily submerged in the noise, proper filtering means facilitates the signal analysis. Empirical mode decomposition (EMD) is an adaptive signal decomposition algorithm for nonlinear, non-stationary signals. By decomposing the signal into intrinsic mode functions (IMF) of different frequencies, it can screen out the obvious high-frequency noise and finally get a signal with a higher signal to noise ratio.
Lamb wave is an elastic wave, and is attenuated less than the traditional longitudinal wave during propagation. Lamb waves can travel longer distances and are more efficient. Therefore they are suitable for large area inspection and have been proven to be suitable for the detection of plate-shaped or tubular structures [12,13,14,15,16]. In this paper, lamb wave is chosen as the fundamental wave for nonlinear ultrasonic testing to detect early damage in the sheet. It is affected by microcrack and other defects during the propagation process [17]. When a large value and high energy lamb wave reaches the crack, the elastic wave opens and closes the crack by stretching and compression. Partial cracks will undergo a change in stiffness [18], then will generate higher harmonics and have nonlinear characteristics [19,20,21,22,23]. Structural reliability and remaining life can be evaluated by analyzing nonlinear lamb wave signals [23,24]. However, due to the dispersion effect, the lamb wave complicates the received signals, which is detrimental to signal analysis. It is hoped that an effective way to detect early damage from single-mode lamb waves can be found. The single-mode (S0) lamb wave has high energy and is easily excited [25,26]. Ashish Kumar Singh et al. and Youxuan Zhao et al. have analyzed the effects of microcrack on nonlinear parameters by simulation when the S0 mode lamb wave is the fundamental wave [21,27]. Ding X. et al. also verified by experiments that the nonlinear Lamb wave of the low-frequency S0 mode can quantitatively identify the weak nonlinearity of the sheet materials [28]. However, there have been few studies to apply nonlinear S0 mode lamb waves to microcrack localization [8,9,14,15,16]. In this paper, the S0 mode lamb wave is used as the detection fundamental wave, and it is expected to reduce the difficulty of signal analysis and improve the positioning accuracy.
In engineering applications, the microcrack needs to be located. Thereby, maintenance personnel can repair or carry out a further evaluation of the remaining life in time. At present, damage imaging algorithms mainly include the elliptical positioning method, the time inversion method, and the delay superposition algorithm [13,29,30,31,32]. These algorithms are needed to determine accurate wave velocity and modal information. However, lamb wave has multiple modes of different wave velocities at any excitation frequency because of the dispersion effect. The dispersion effect greatly interferes with the accuracy of these algorithms. At present, the positioning algorithms for sheet material rarely consider the influence of the dispersion effect and have not noticed the value of using a single mode to detect damage. In this paper, the single mode lamb wave is used as the detection fundamental wave, so the excitation signal is pure, the wave velocity information is clear, and the damage information is easier to extract. Moreover, most of these algorithms focus on macroscopic damage. The author believes that detecting and locating early microcracks is more meaningful. Especially when the material is in a harsh working environment, microcracks can cause function failure of structure. In this paper, it is expected that fewer sensors will be arranged on the surface of the sheet materials to scan closed microcracks. It is expected that fast and accurate positioning will be achieved by cooperating with the nonlinear single mode lamb wave.
This paper presents a method for locating microcracks using a probability scan matrix. Through simulation and experiment, the positioning result is analyzed in detail when the microcrack is in different positions in the scanning area and the arrangement of the excitation and reception probes are different. Compared with the traditional study of macroscopic damage, this paper is more meaningful for the study of early damage. At the same time, this paper pays attention to the influence of the lamb wave dispersion effect on the signal analysis and positioning results, so the S0 single-mode lamb wave is used as the detection fundamental wave. The remainder of this paper is organized as follows. Section 2 explains the principle of a probabilistic scanning and positioning imaging matrix and how to obtain an S0 single mode lamb wave, and at the same time proposes ways to evaluate the positioning results. Section 3 compares the positioning results of microcracks by simulation when the microcrack is in different positions and the probe arrangement is different. In Section 4, the experiment is conducted to demonstrate its performance. The conclusions are presented in Section 5.

2. Theory and Analysis

2.1. Probability Hypothesis

The probabilistic scanning and positioning imaging theory is based on the method of piezoelectric ceramics exciting the plate wave in the sheet materials. It is a method associated with the excitation end and the receiving end. Damage identification can be thought of as the probability of a microcrack appearing at a location in the structure. Because the ultrasonic wave will attenuate during the propagation process, when scanning the damage, the center line of the path from excitation to reception is the direction of propagation of the lamb wave. It is considered that the microcrack has the highest probability of occurrence on the propagation path. The farther away from the propagation centerline, the more severe the ultrasonic attenuation, and the lower the probability of occurrence. The distribution law is consistent with the normal distribution function.
P i j ( d ) = 1 2 π σ e d 2 2 σ 2
where d is the distance from the coordinate point Zij to the center line of the path from excitation to reception. It is considered that the microcrack has the highest probability of occurrence on the paths’ center line [11,24]. The scale parameter σ is set to 0.006. The (−σ, +σ) interval is approximately equal to the transducer size of 0.013 m.
As shown in Figure 1a, a scan path can be formed from the excitation probe T to the reception probe R. In the path, the darker the color, the higher the probability of existence of a microcrack. The lighter the color, the lower the probability of existence. The corresponding three-dimensional probability distribution is shown in Figure 1b. An X×Y matrix is created in the scan area, the magnitude of each point representing the imaging index at which the microcrack appears. The scanning surface is formed by a normal distribution function. A plurality of scanning surfaces can cover the area inspected and turn discretization into continuation.

2.2. Lamb Excitation

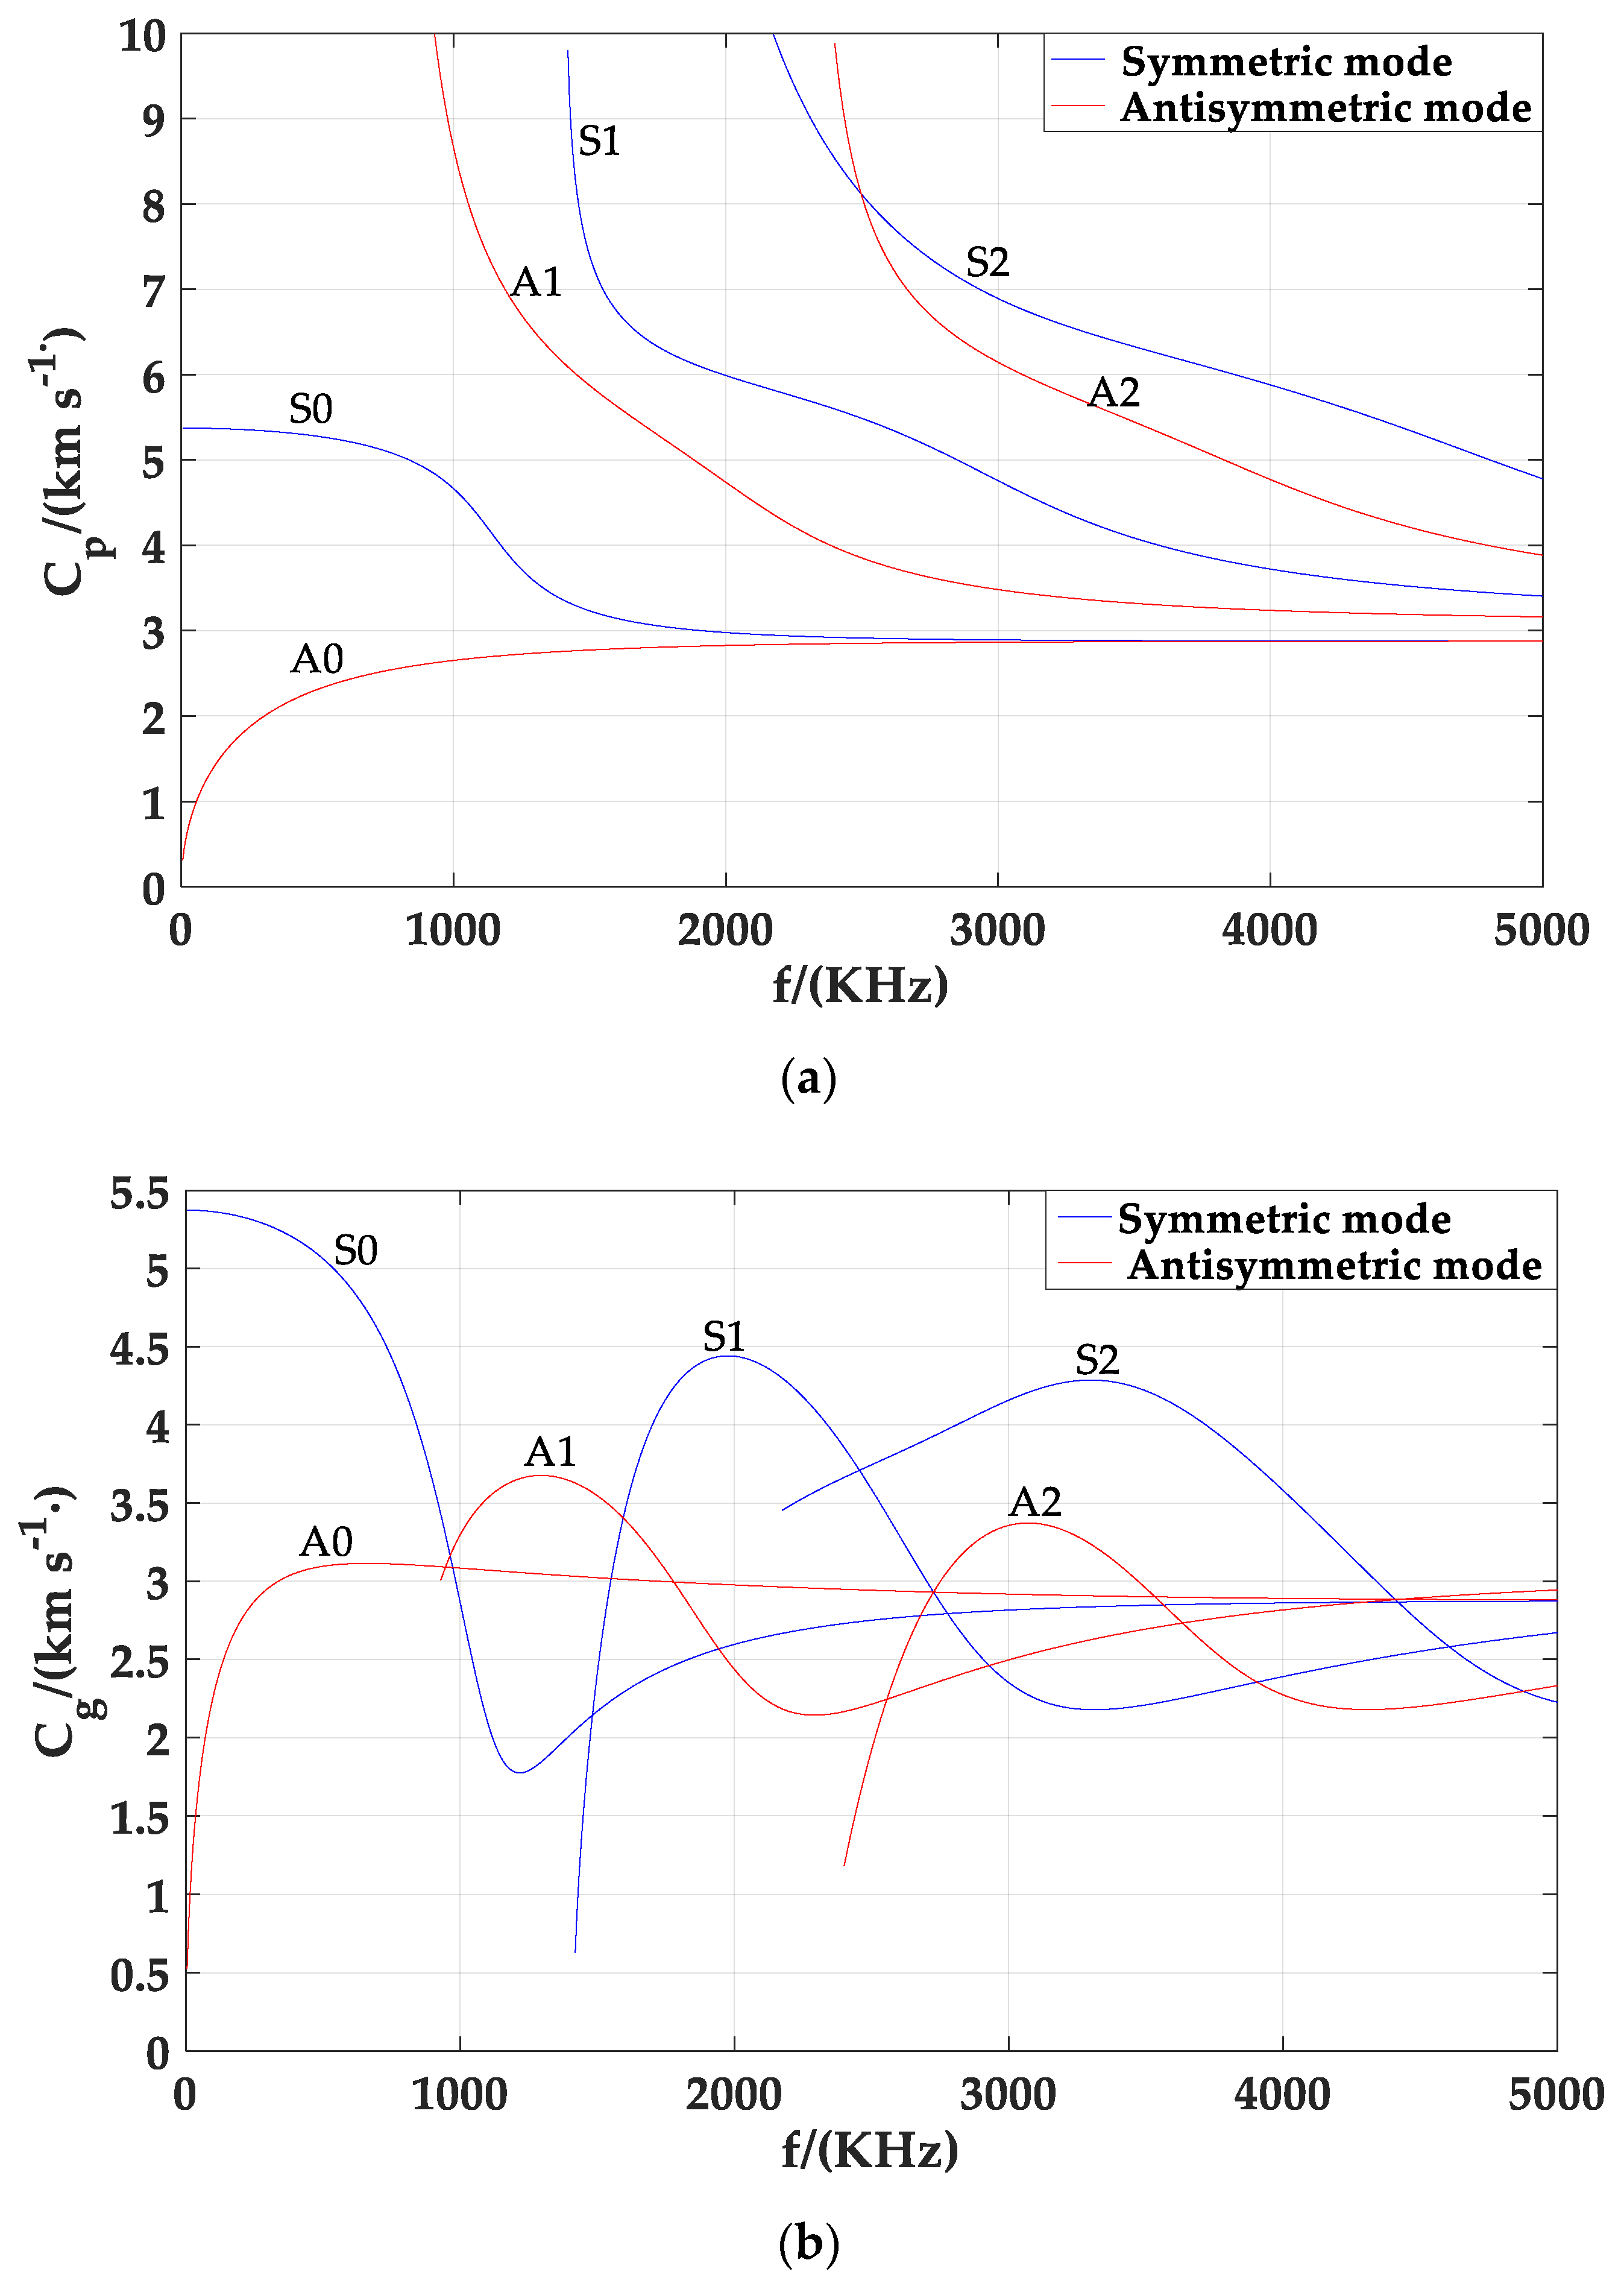
The lamb wave has a dispersion characteristic and is classified into a symmetric lamb mode or an anti-symmetric lamb mode. With the difference of frequency, the lamb wave mode changes and has different phase velocities. The dispersion curve of the 2 mm aluminum plate can be obtained by the matlab numerical method [33]. The longitudinal wave velocity of the aluminum plate is 6300 m/s, and the transverse wave velocity is 3080 m/s. The dispersion curve is shown in Figure 2.
It can be seen from the above figure that when the excitation frequency is lower than 0.9 MHz, only two modes of A0 and S0 exist. The relationship between the excitation angle α, the phase velocity cp, and the longitudinal wave velocity c in the probe wedge is:
s i n α = c / c p ,
A specific mode lamb wave can be excited by adjusting the angle. However, when the excitation frequency is 0.9 MHz, the A0 mode phase velocity is 2610 m/s. The material of the oblique probe’s wedge used in the experiment is plexiglass, and the longitudinal wave velocity of the plexiglass is 2730 m/s. It can be seen that c/cp is always greater than 1 when the excitation frequency is lower than 0.9 MHz, in other words, the A0 mode below 0.9 MHz is difficult to excite. So a single-mode S0 lamb wave can be obtained. As shown in Figure 3, the received pulse signal has a single mode, and the reflected signal from the edge of the sheet is weak, which will not interfere with the result. That is, only the waveform of received pulse signal is obvious.
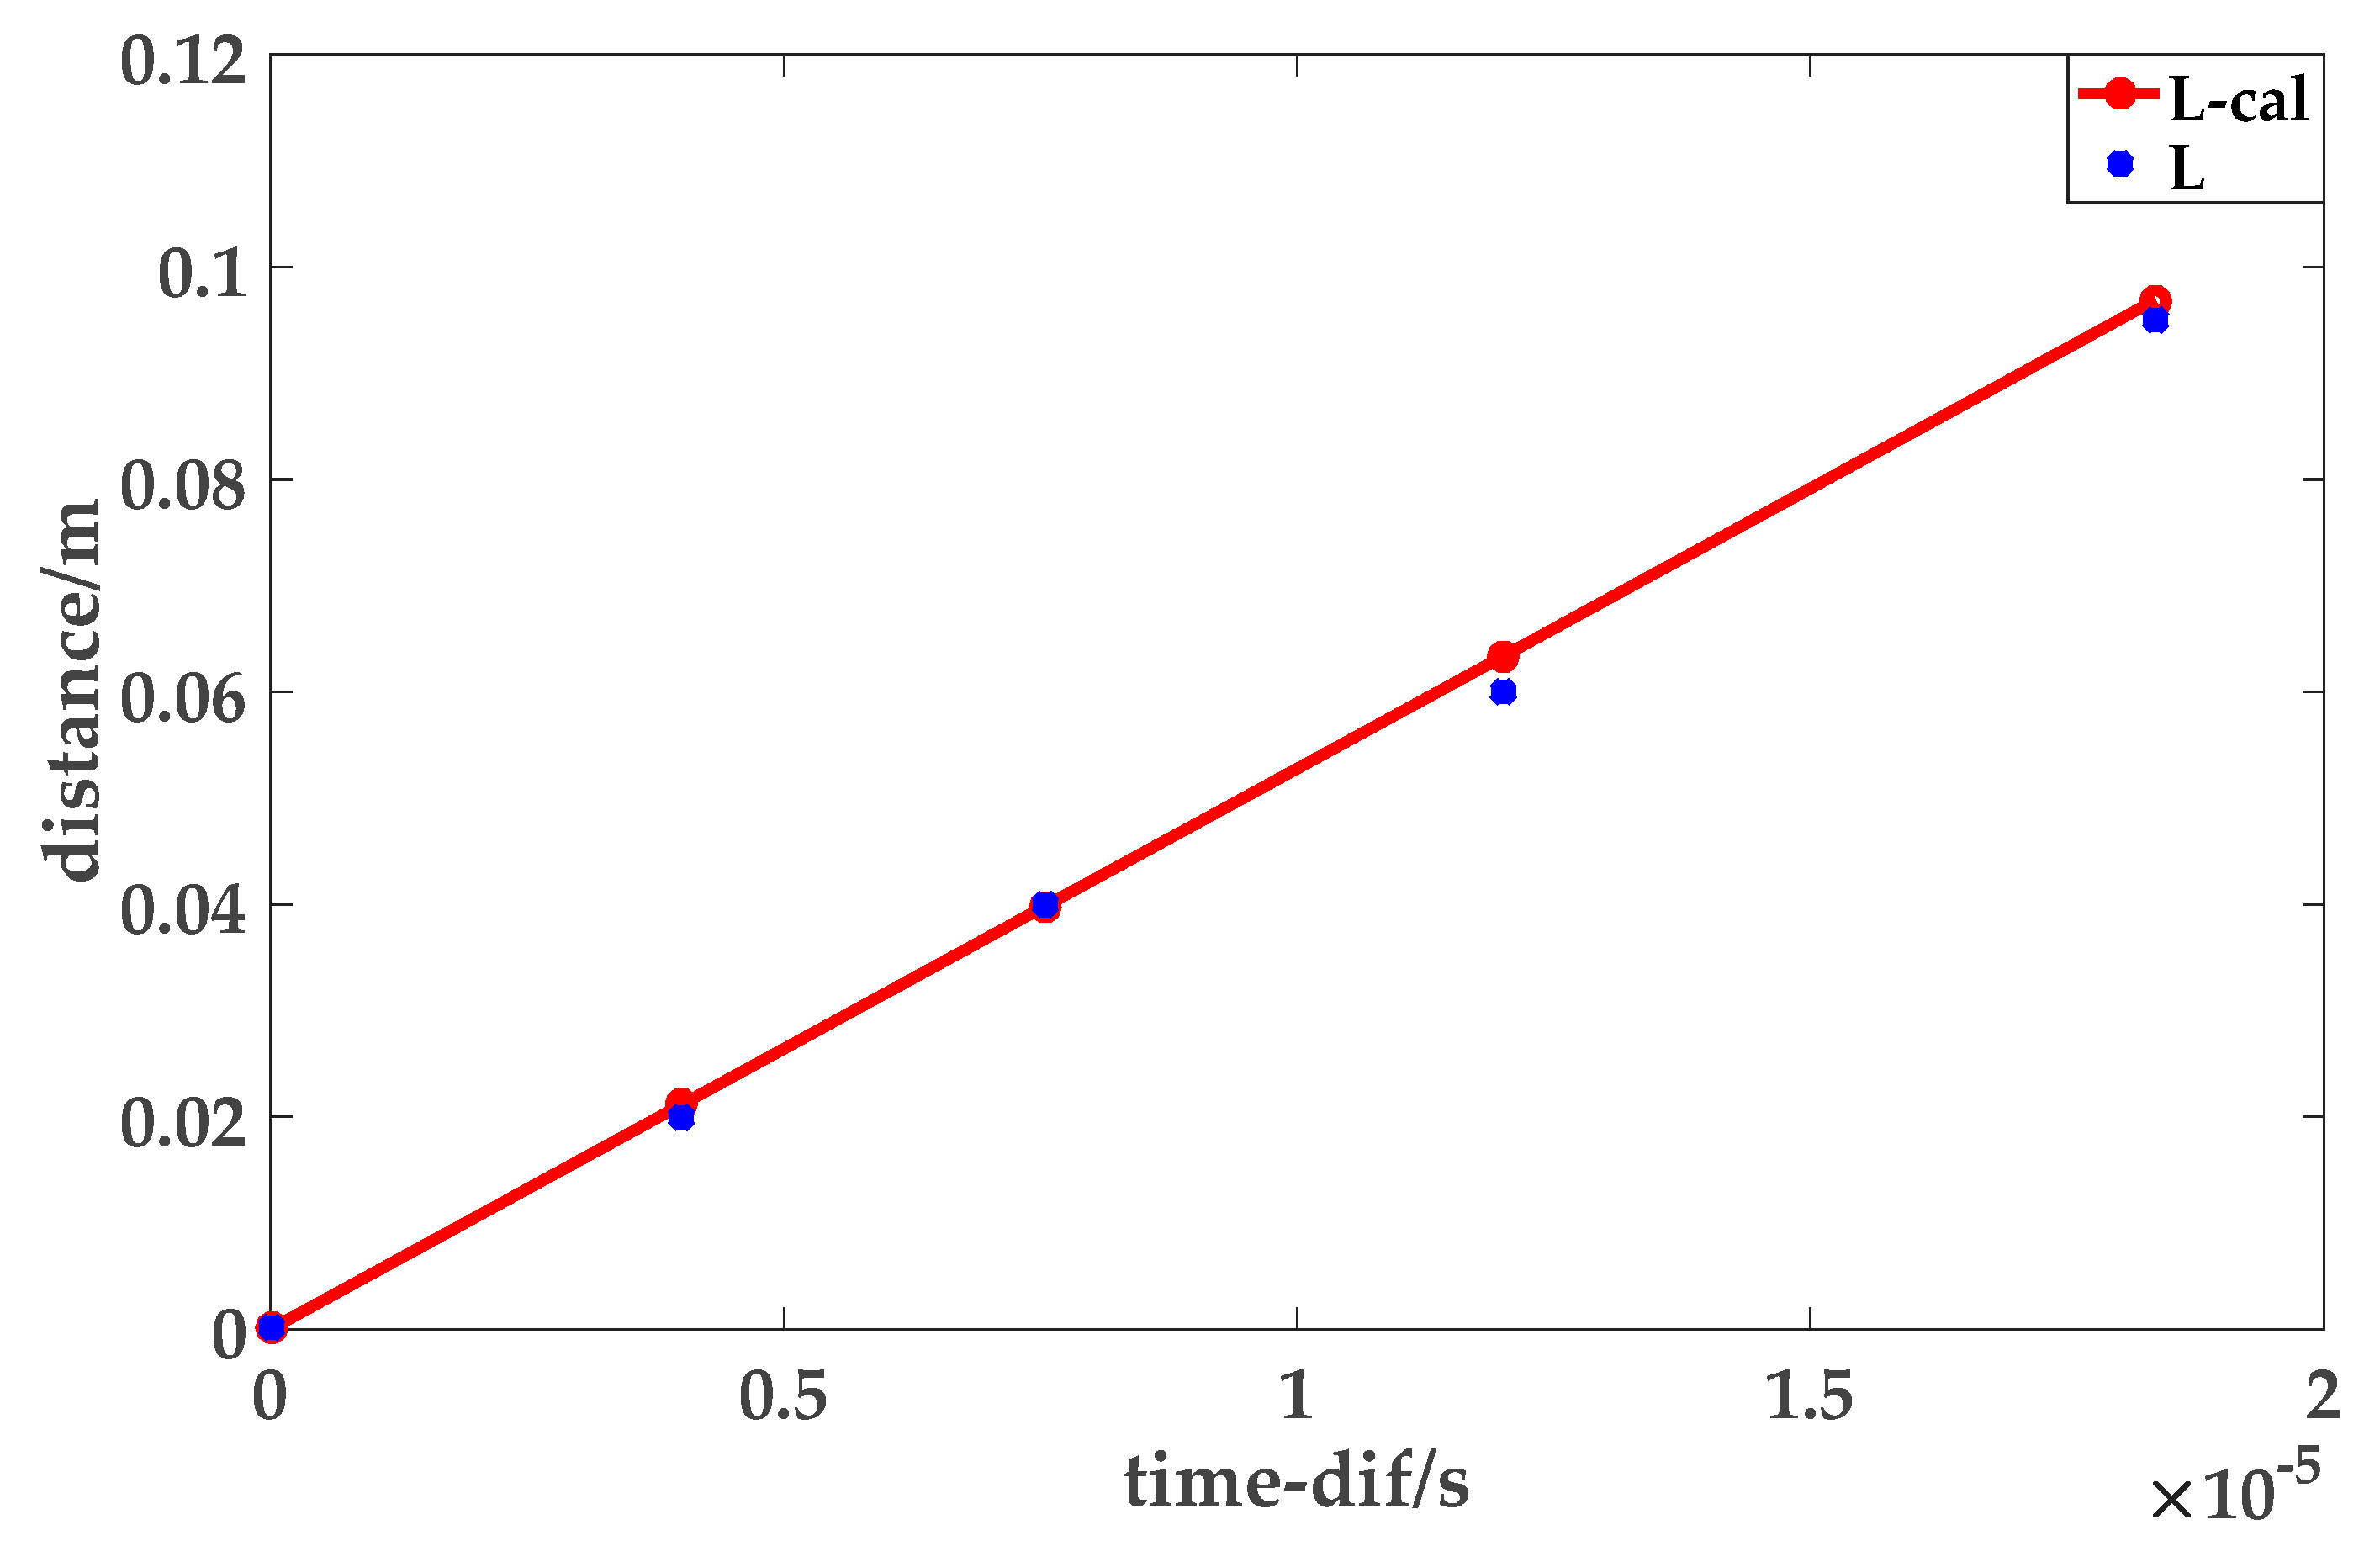
When the excitation frequency is 0.5 MHz, the best excitation angle is about 31°, according to Formula (2), the receiving efficiency of lamb wave is the best, and the velocity is 5278 m/s. The excitation and receiving probes are placed at different distances, L, and the time difference, time_dif, between the excitation signal and the received signal is multiplied by the phase velocity to obtain a theoretical distance, L_cal. Compare L_cal with L to verify whether the excited mode is S0 mode or not; Figure 4 is a comparison chart.
It can be seen from the above figure that the calculated distance is almost the same as the actual distance, which proves that the mode excited is the S0 single mode lamb wave.

2.3. Nonlinear Coefficient

Small defects cause the solid material to exhibit non-linear characteristics while causing nonlinear effects in the ultrasonic waves propagating in the material. However, the high-order harmonics in the received signal are extremely weak, and the use of large-value and high-energy ultrasonic signals can effectively enhance nonlinearity. The micro-defects in the material are thus evaluated by analyzing the nonlinear signals. When the excitation is a single-frequency sine wave, u = A1sinωt, the expression of the ultrasonic wave in the solid medium is obtained by an approximate iterative method [3]:
u ( x , t ) = A 1 s i n ( k x ω t ) A 2 c o s 2 ( k x ω t ) +
where k is the wave number, so the second-order ultrasonic nonlinear parameters can be expressed as [3]:
β = 8 k 2 x A 2 A 1 2
In engineering applications, the relative ultrasonic nonlinear parameters are used to study the nonlinear characteristics. The relative ultrasonic nonlinear parameters caused by microcracks are expressed as [17,21,34]:
β = A 2 A 1
When the crack appears on the lamb wave propagation path, the nonlinear effect is the strongest and the relative nonlinear coefficient is large. When there is no damage on the lamb wave propagation path, the higher harmonics are not generated, and the relative nonlinear coefficient is smaller. Therefore, the relative nonlinear coefficient is detected and calculated at different distances from the microcrack. Then the law is found through experiment.
In the Figure 5a, the transmission to reception path is parallel to the X-axis, and the center of the microcrack is taken as the coordinate origin. The distance from the damage to the center line of the left scanning path is set to be negative. As can be seen from Figure 5b, the closer the distance to the microcrack, the larger the relative nonlinear coefficient; the farther the distance to the microcrack, the smaller the coefficient. In this paper, the relative ultrasonic nonlinear parameters are used as the damage index [25]. The relative ultrasonic nonlinear parameters are detected by the single S0 mode lamb wave.

2.4. Probability Scan Matrix

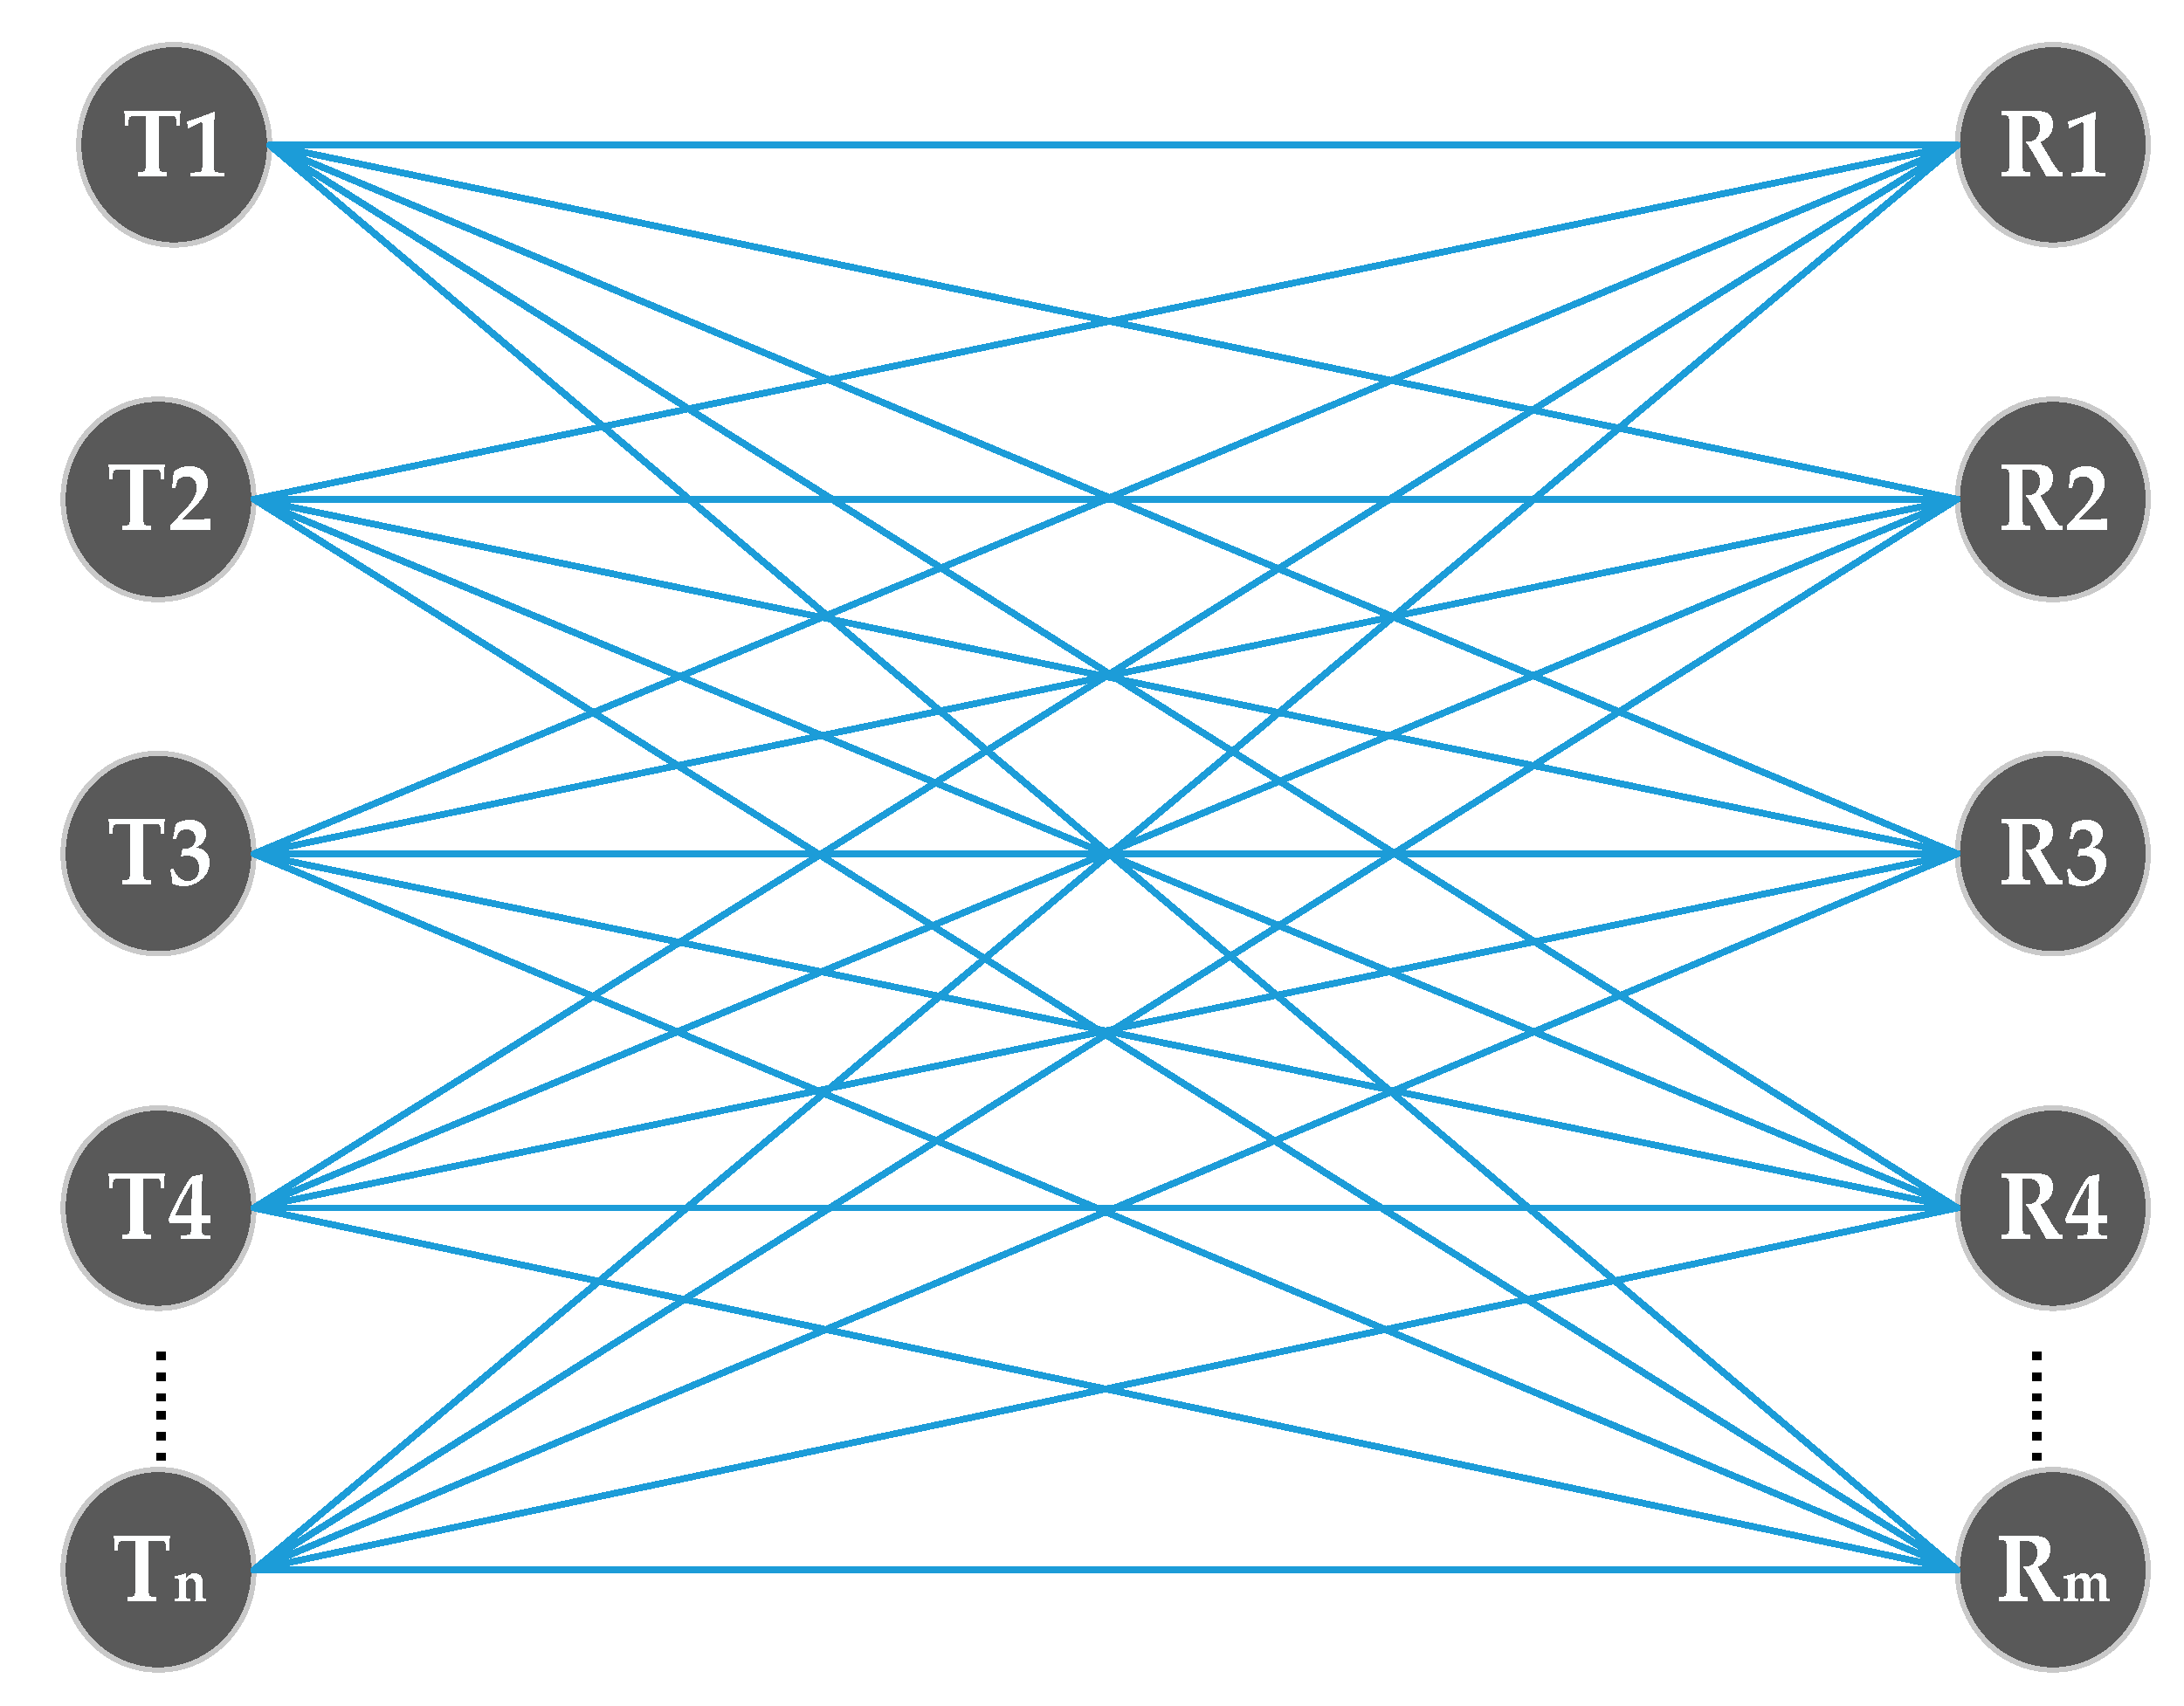
When detecting, parallel to the direction in which the microcracks extend, select n points on the left side of the microcrack to place the excitation probe and select m points on the right side of the microcrack to place the receiving probe. An n×m scan path can be formed, as shown in Figure 6:
The imaging index (Img) of each pixel in the scanning area can be expressed as:
Img = i = 1 n j = 1 m P i j * β i j
where i corresponds to the excitation probes T1, T2,…, Tn; j corresponds to the receiving probe R1, R2, …, Rm; βij is the damage index obtained for each path; and Pij is the normal distribution function distributed along the scan paths. The scanning matrix is moved along the x, y axis to scan and compare, and Max(Img) is the position of the microcrack.

2.5. Result Evaluation

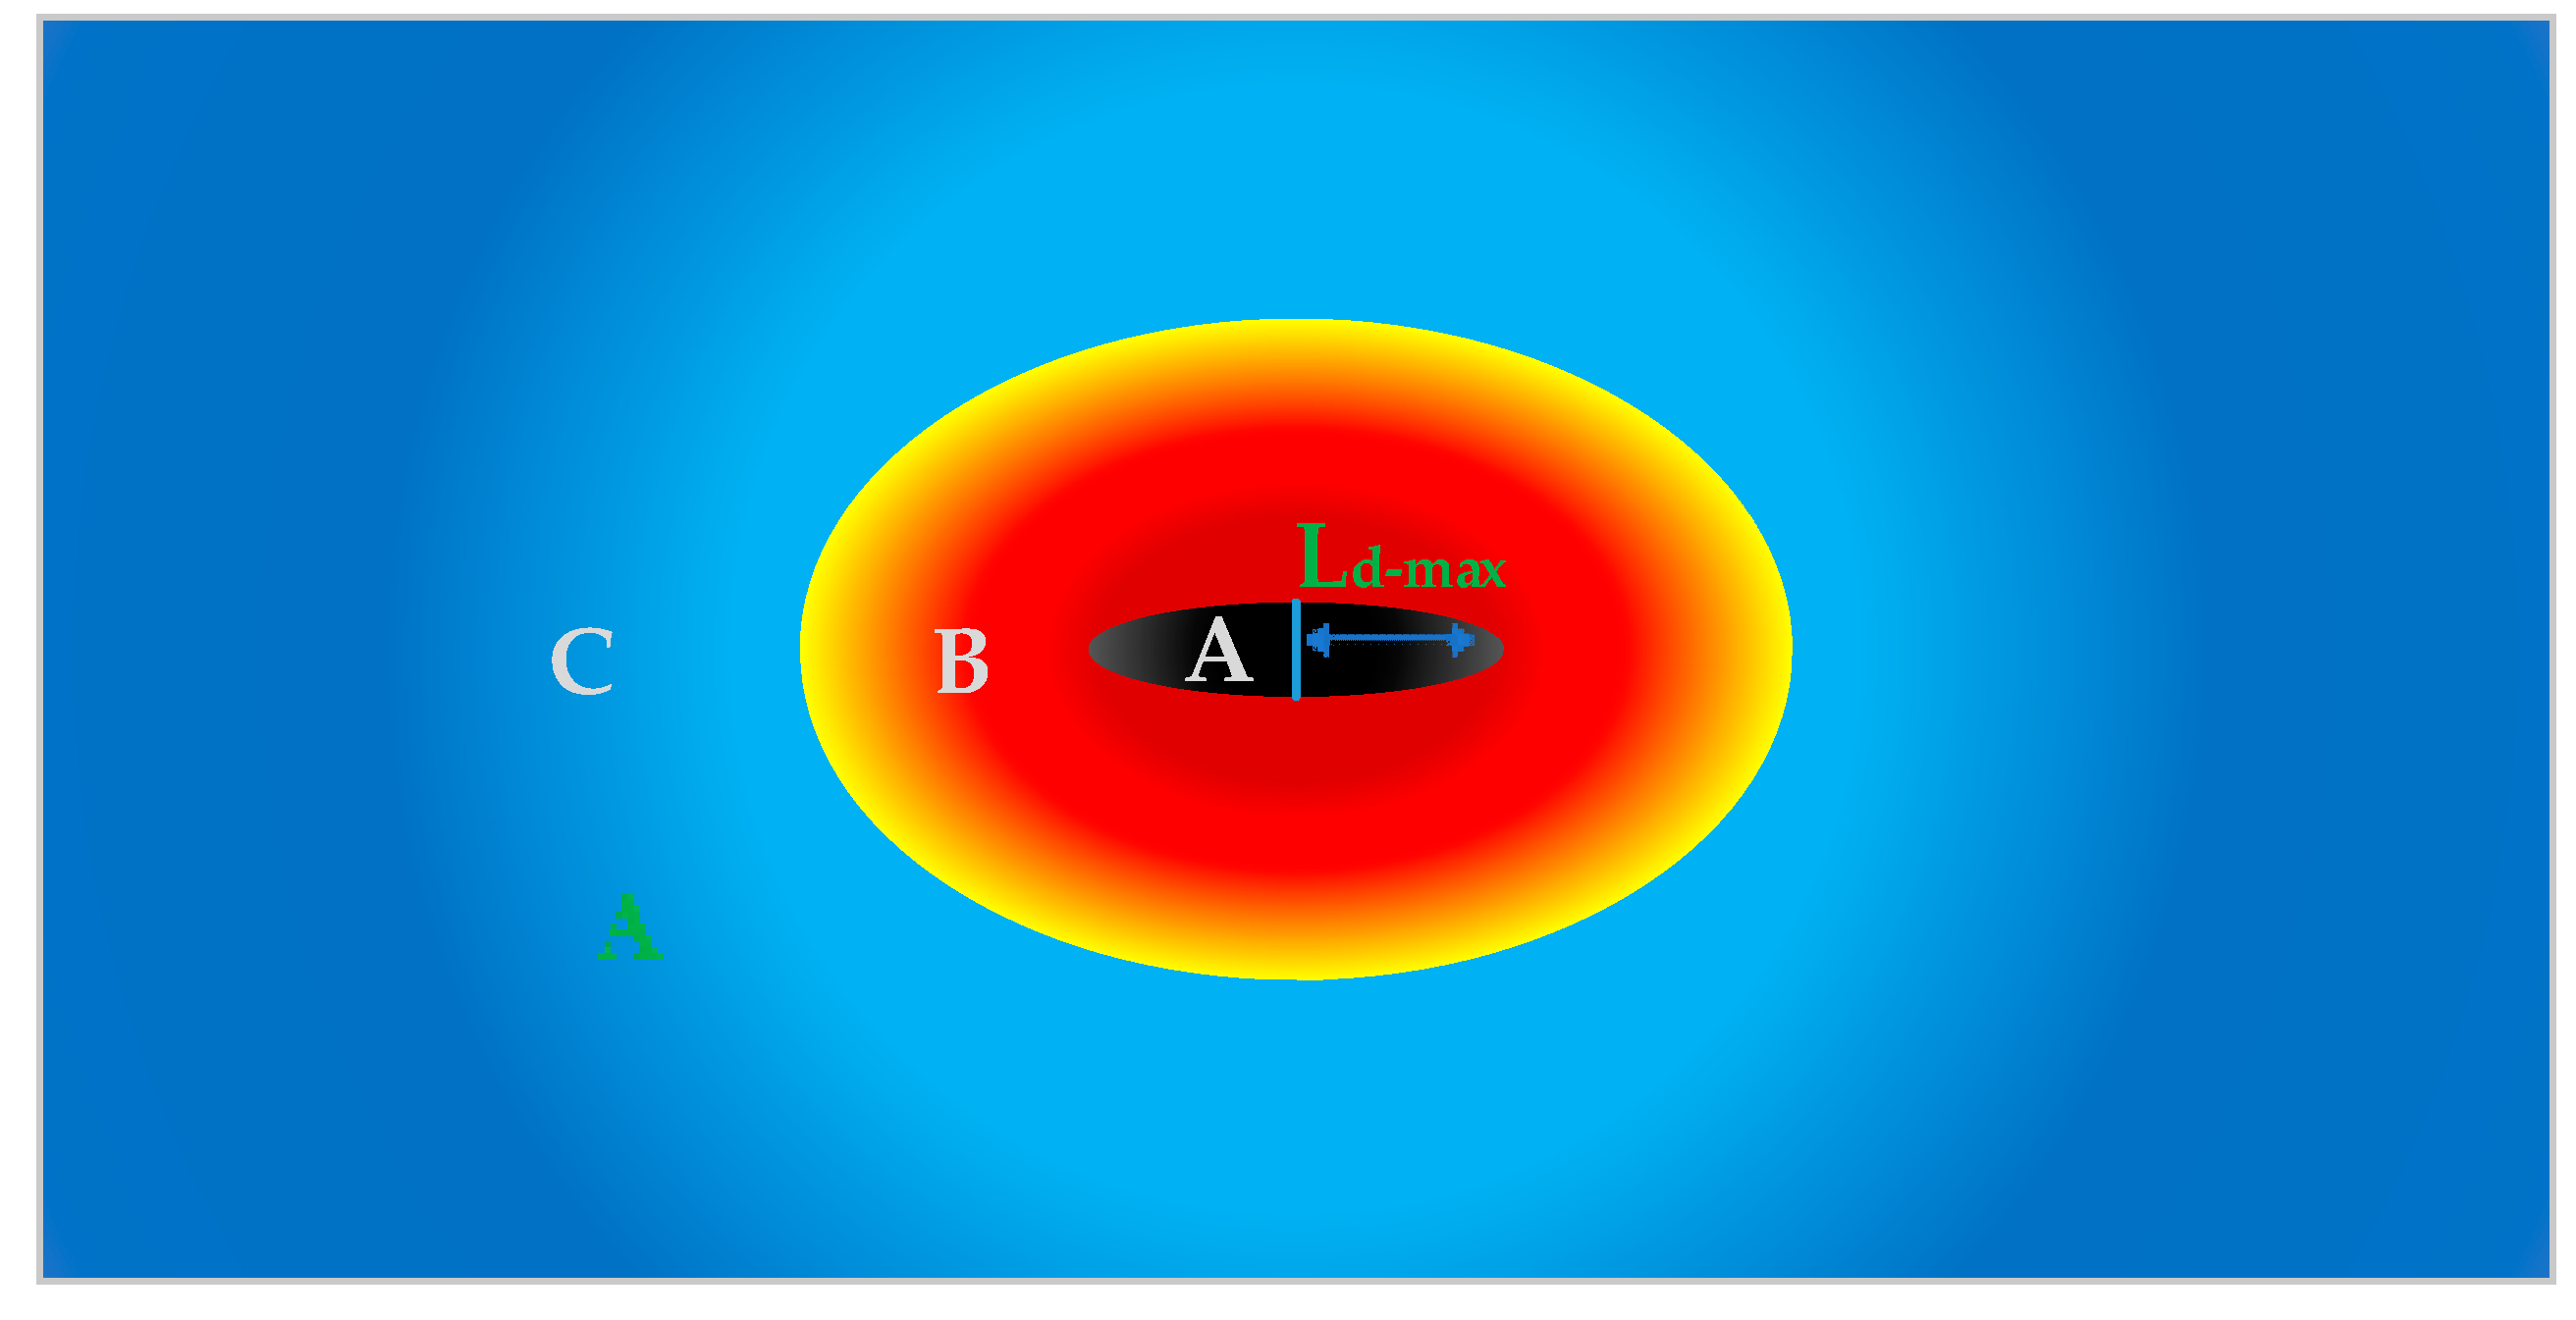
This paper extracts three parameters from the positioning results to evaluate the positioning effect. As shown in the Figure 7, the core region A corresponds to the region with the largest imaging index, and microcrack is considered to be present in the region. Set the microcrack center point as the coordinate origin, measure the distance from the edge of the core zone to the origin, and take the maximum value as Ld-max to evaluate the extent to which the microcrack deviates from the center point of the core zone. It is considered that the smaller the Ld-max value, the better, which means that the microcrack is at the center point of the core region, and the positioning result is the best. At the same time, the percentage (Area-A) of the core area to the total scan area is counted. The smaller the Area-A, the better the positioning result. Region B is a region with a slightly larger imaging index. It is considered that there may be a microcrack. The percentage (Area-B) of the region B to the total scan area is counted. The smaller the Area-B, the more satisfactory it is.

3. Three-Dimensional Finite Element Simulation

3.1. Model Establishment

In this paper, the above theory is verified by finite element analysis software ABAQUS (ABAQUS 6.14.2, DASSAULT SIMULIA, Providence, Rhode Island, USA), and a three-dimensional model 0.25 m long, 0.1 m wide and 0.002 m thick is established. As shown in Figure 8a,b. The Young’s modulus is set to 6.89 × 10¹⁰ N/m2, the Poisson’s ratio is set to 0.330, and the density is set to 2704 kg/m3. The simulation time is 200 μs. The crack length is set to 0.014 m. Taking the microcrack center point as the coordinate origin, the microcrack extends along the y-axis direction. The contact method adopts self-contact, the constraint algorithm adopts the penalty contact method, and the contact attribute defaults tangential behavior and legal behavior. The model diagram is as follows:

3.2. Results and Analysis of Simulation

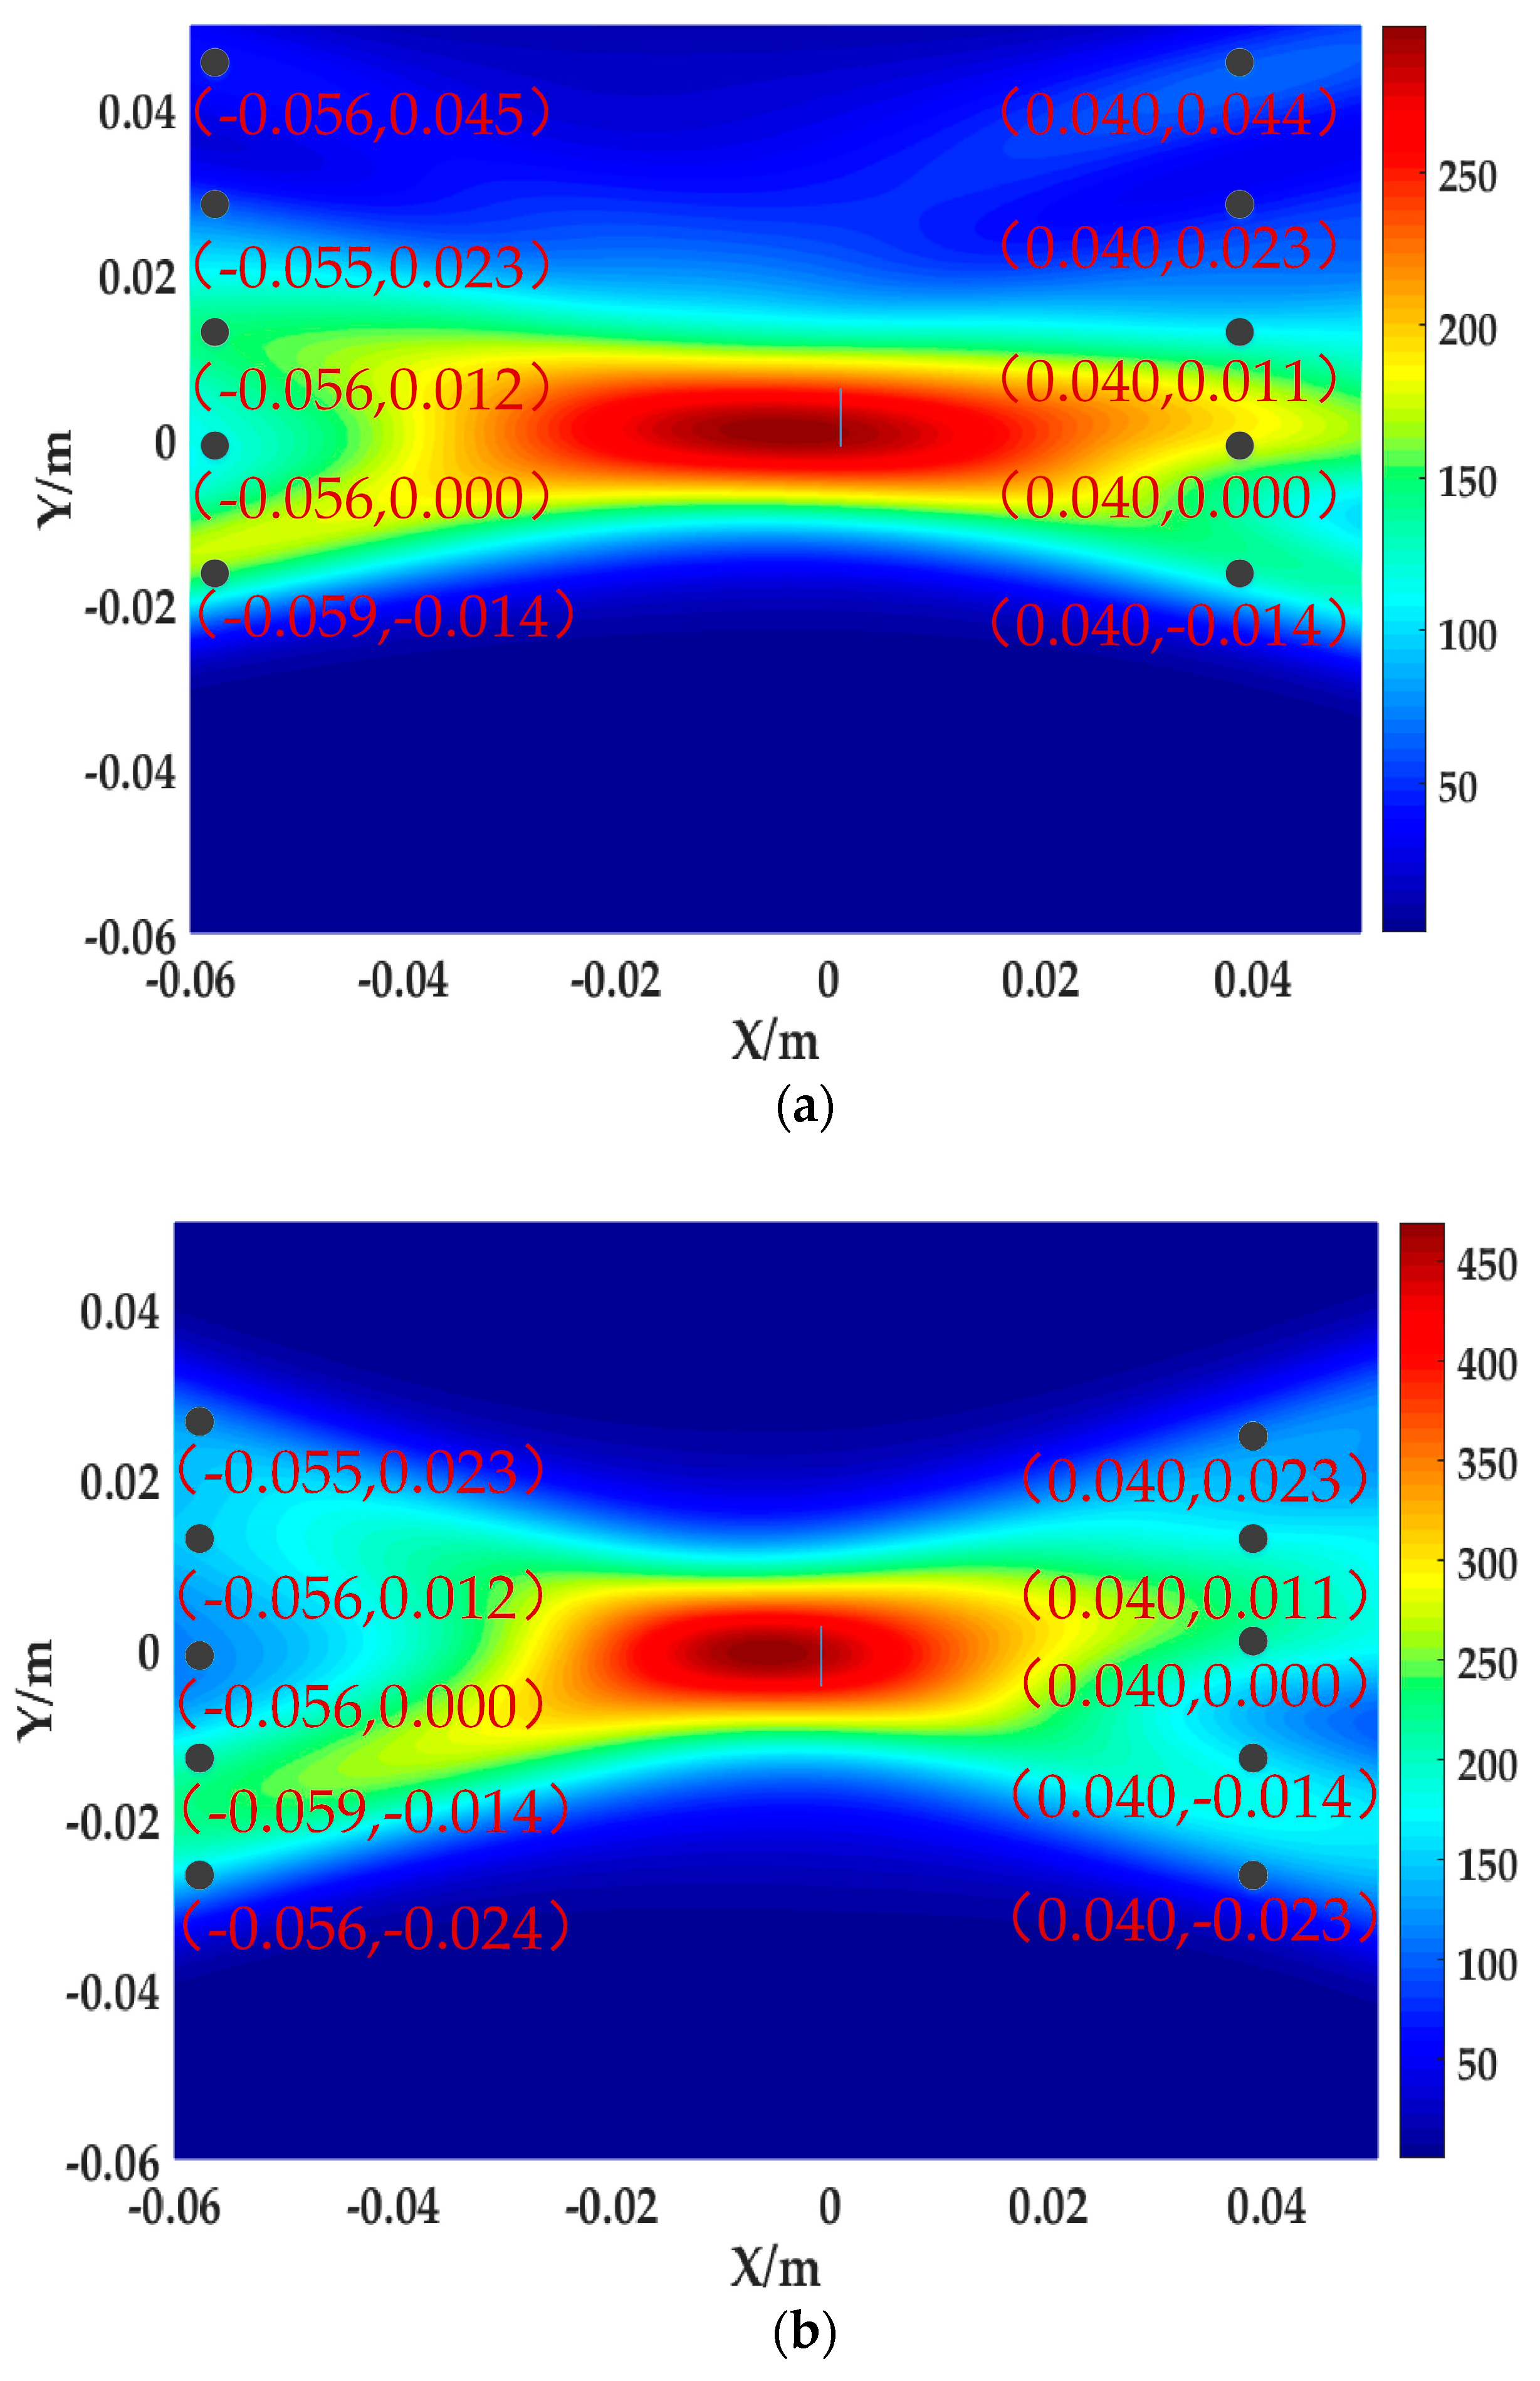
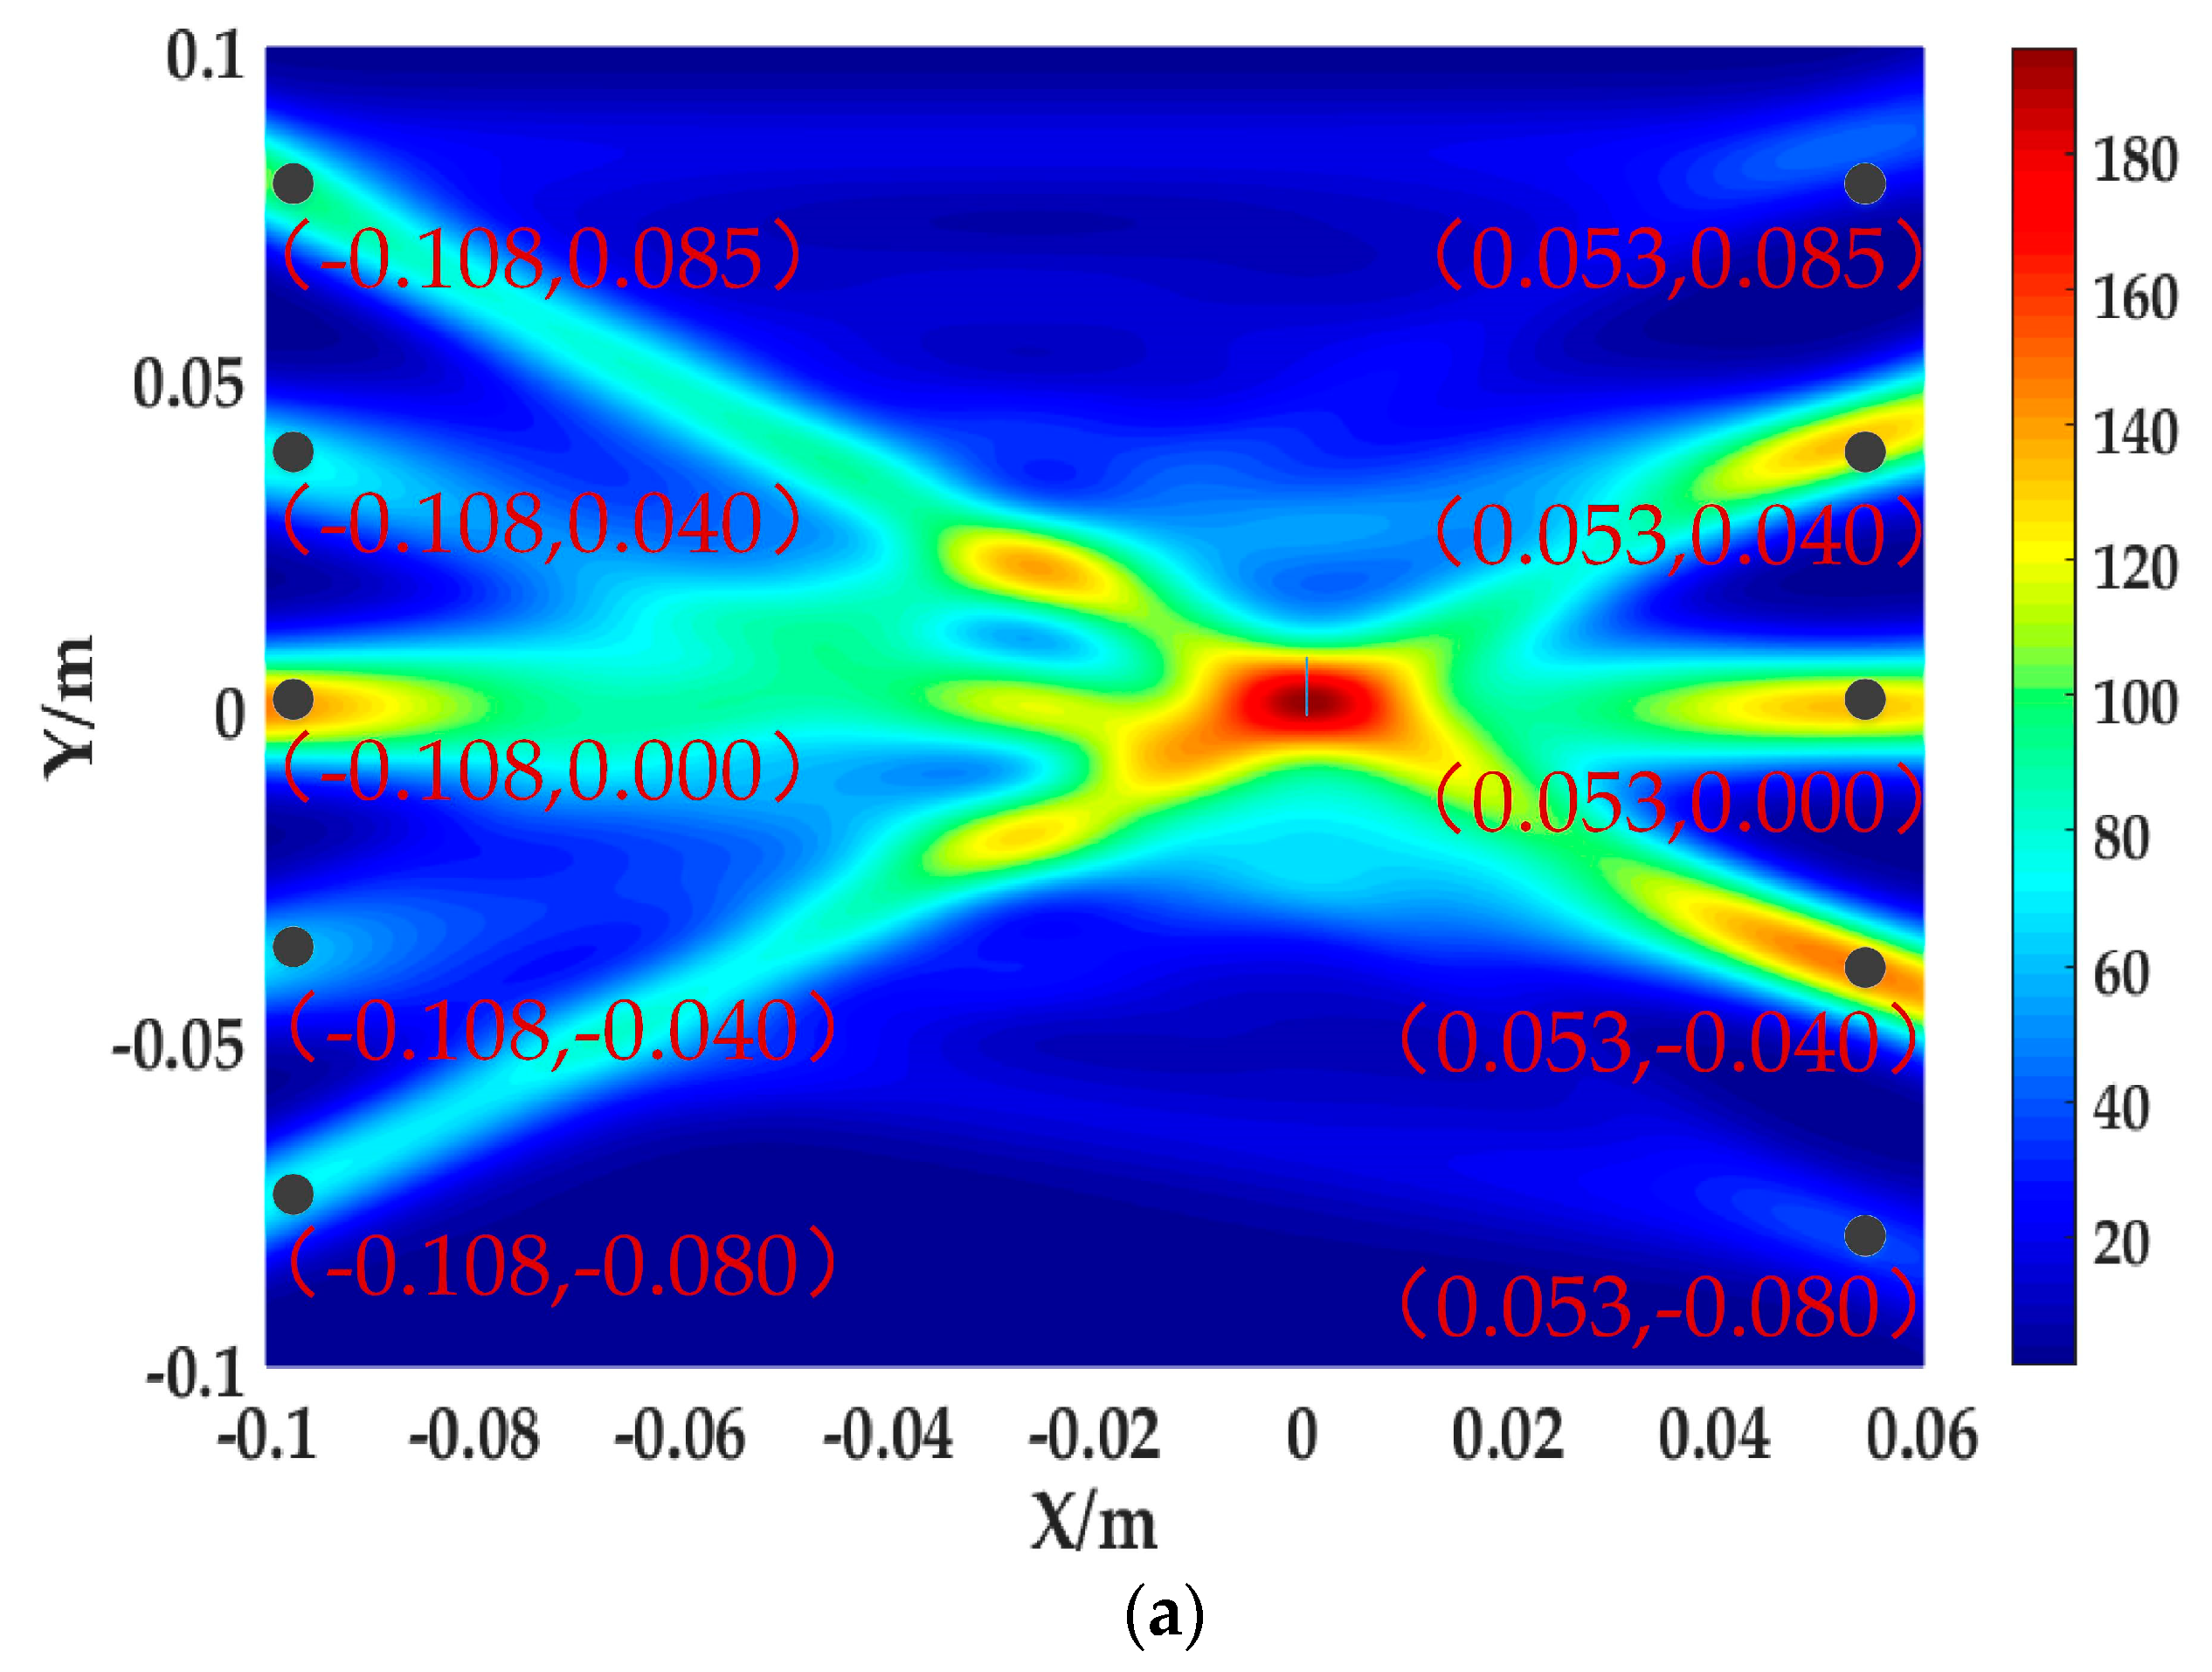
The simulation compares the microcrack positioning results at different locations and verifies that the localization algorithm has strong adaptability. As shown in Figure 9, the darkest area in the positioning maps represents the area where the amplitude of the Img is largest, which is considered to be the area where the microcrack is located. The red area represents the area where a microcrack may exist. The light blue and blue area represent the absence of a microcrack in the area.
We count the ratio (Area-A) of the darkest area to the total scan area, the ratio (Area-B) of the red area to the total scan area and the farthest distance Ld-max from the center of the microcrack to the edge of the darkest area. As shown in Table 1:
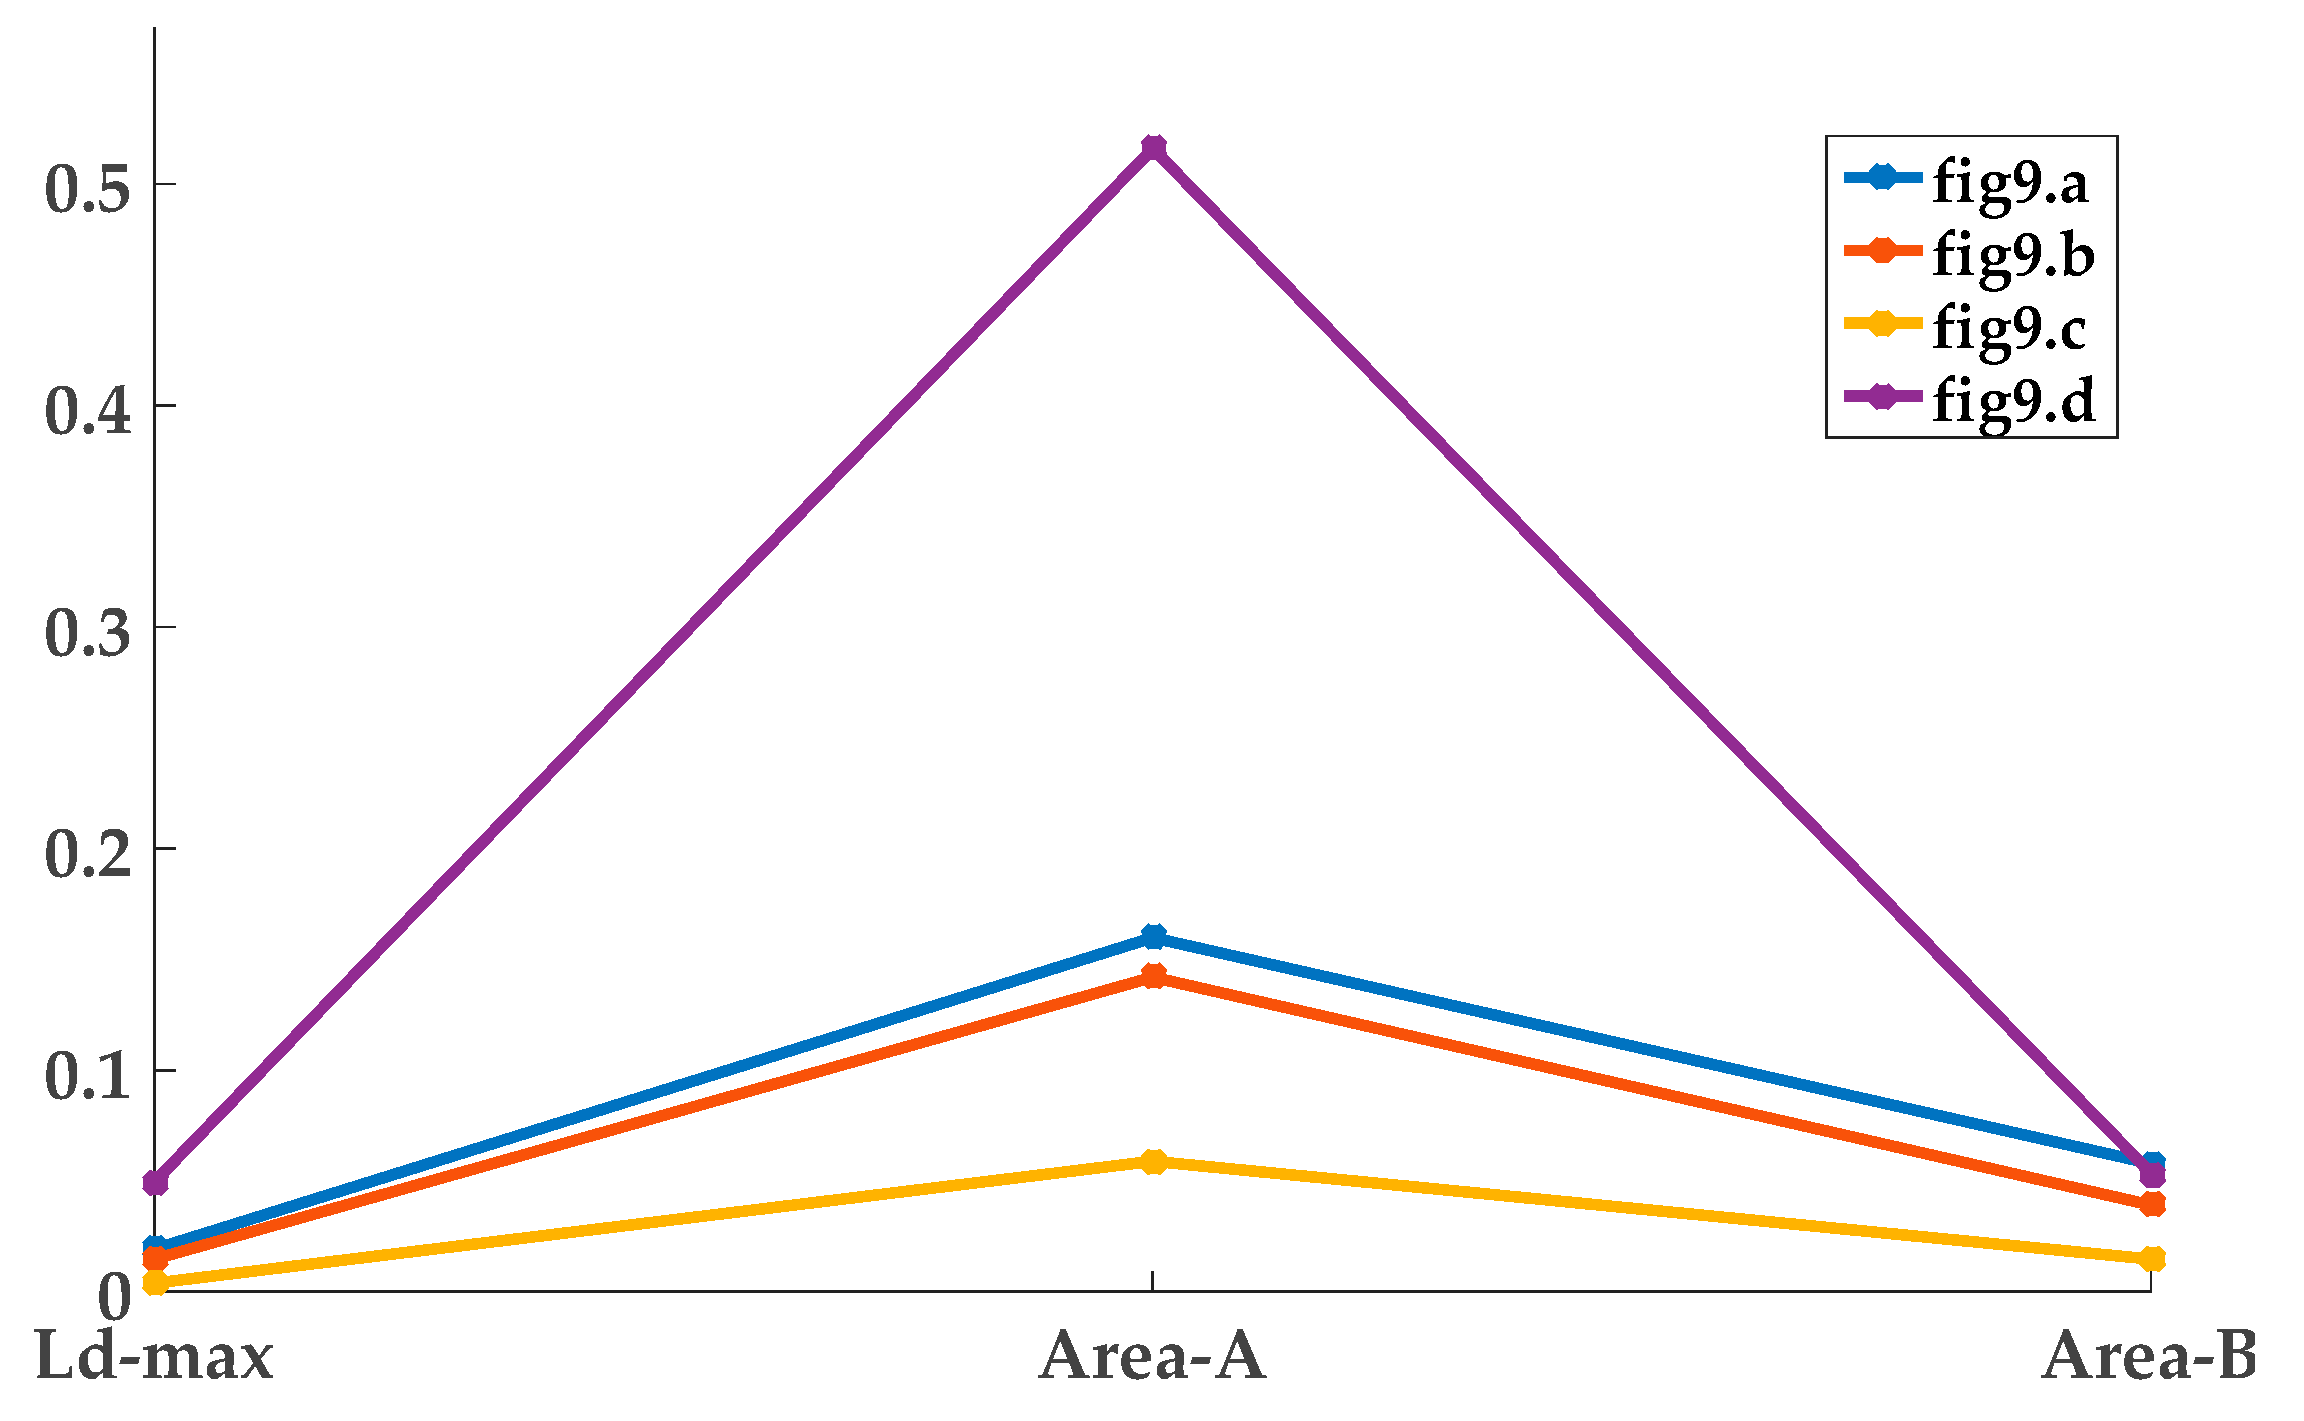
As shown in Figure 9a when the microcrack is in the lower right corner of the scanning area and in Figure 9b when the microcrack is in the right side of the scanning area, the microcracks are effectively positioned. But as shown in Figure 10, the values of Ld-max, Area-A, and Area-B in Figure 9a,b are all larger than the values in Figure 9c. The resulting positioning accuracy is low. There is only one scanning center line through the microcrack in Figure 9d, and the microcrack positioning failure can be found in Figure 9d. In the four positioning maps, the minimum value of Ld-max is 0.004. The minimum value of Area-B is 0.059, and the minimum value of Area-A is 0.015. The minimum values all appear in Figure 9c. After simulation, it can be known that the scanning center line passing through the microcrack should be two or more, and the positioning result is better when the microcrack is in the center of the scanning area. The positioning algorithm proposed in this paper has strong adaptability.
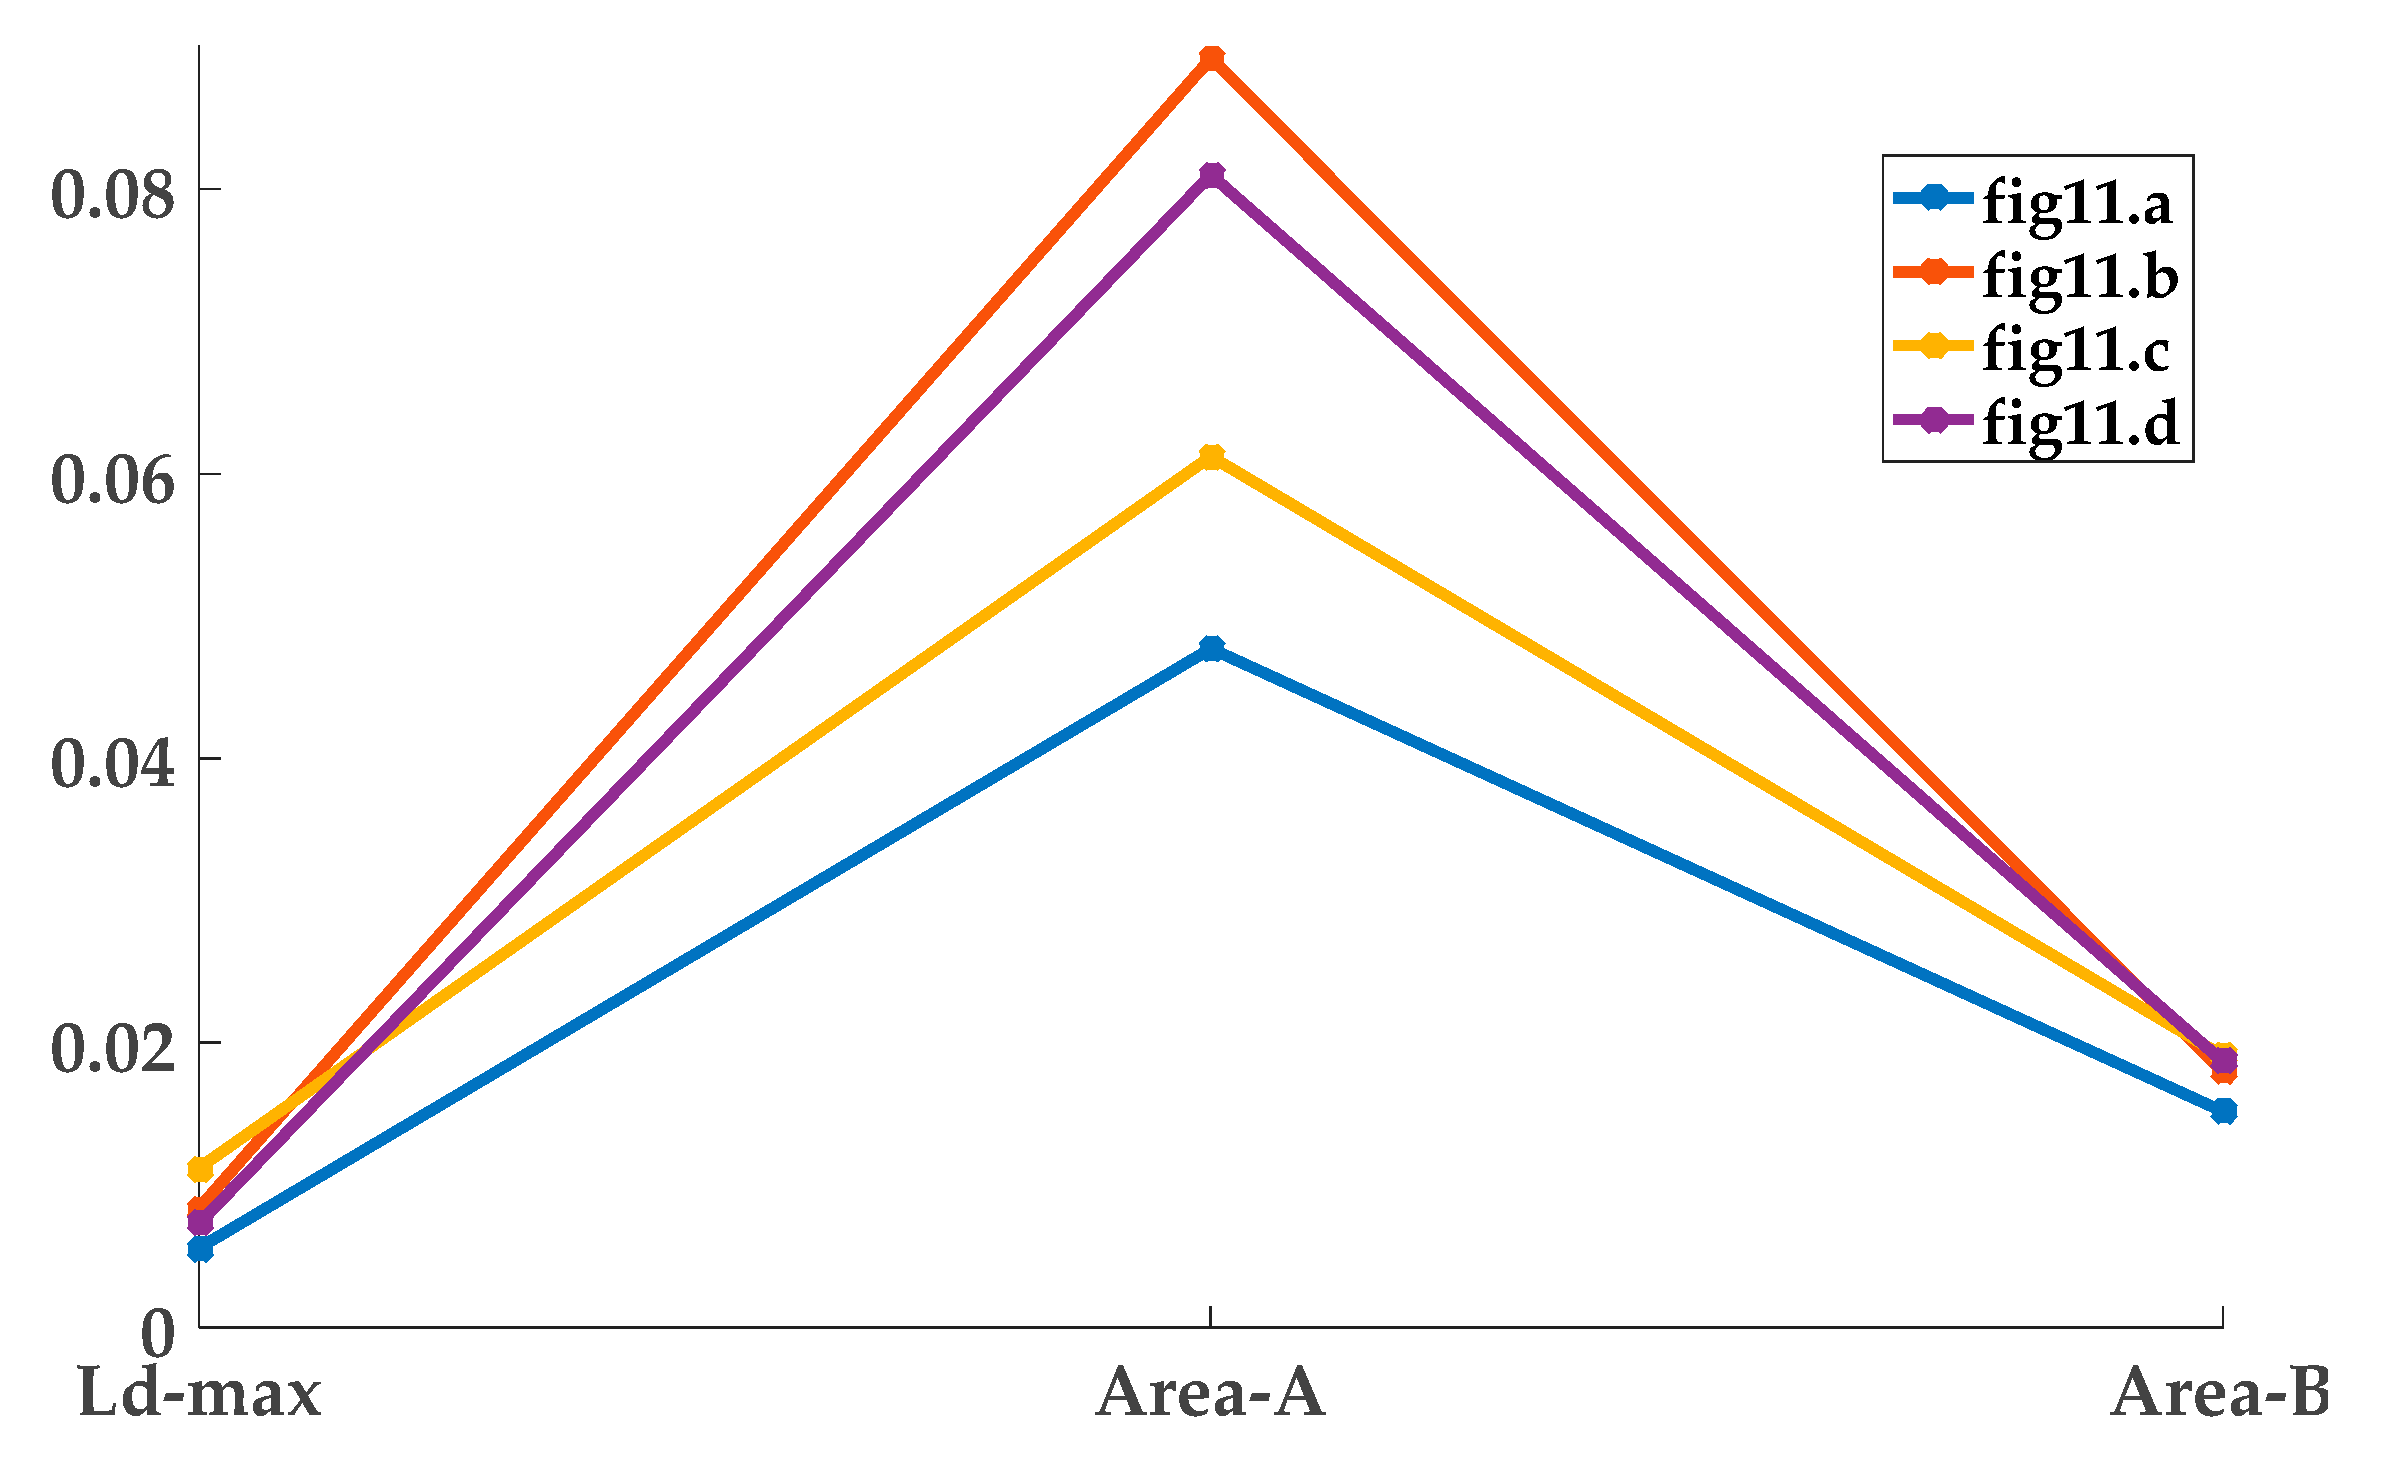
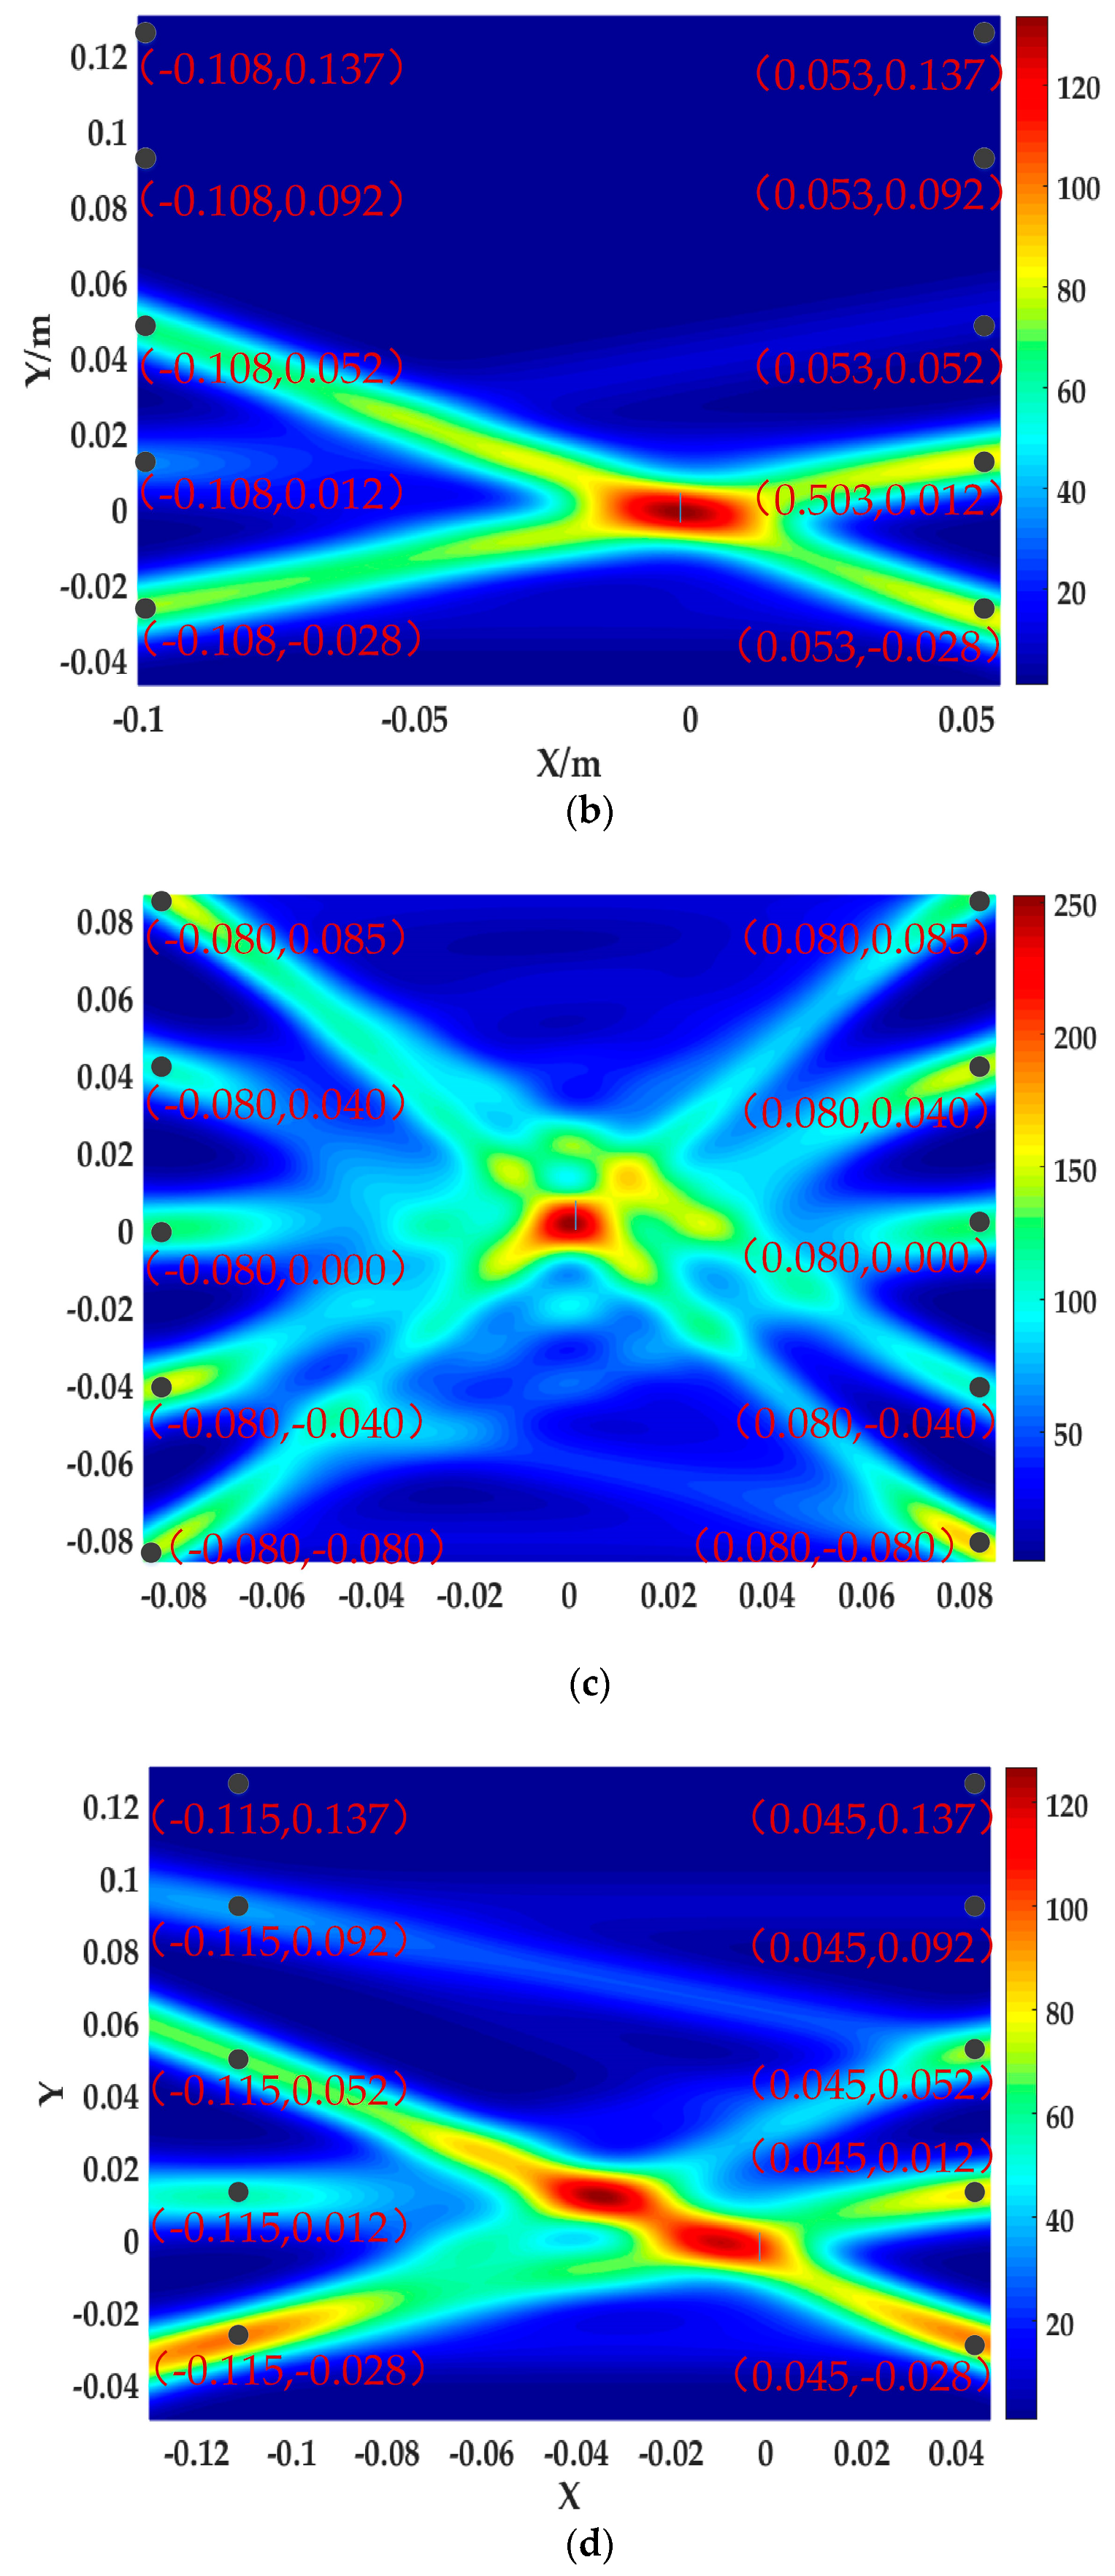
The arrangement changes of the excitation and reception probe are shown in Figure 11. When the probe arrangement was changed, it was found that the microcracks could still be effectively positioned.
The evaluation parameters of the positioning result are shown in Table 2:
It can be seen from Figure 12 that the positioning error in Figure 11a is small compared with Figure 11b–d, that is, increasing the number of probes can effectively reduce the positioning error. Comparing Figure 11a with Figure 9c, the positioning error of Figure 11a is slightly larger than that of Figure 9c. Symmetrical distribution of the excitation and reception probe along the x-axis also helps to improve positioning accuracy. In the four positioning maps, the minimum value of Ld-max is 0.006. The minimum value of Area-B is 0.048, and the minimum value of Area-A is 0.015. The minimum values all appear in Figure 11a.

4. Experimental Verification

4.1. Construction of Experimental System

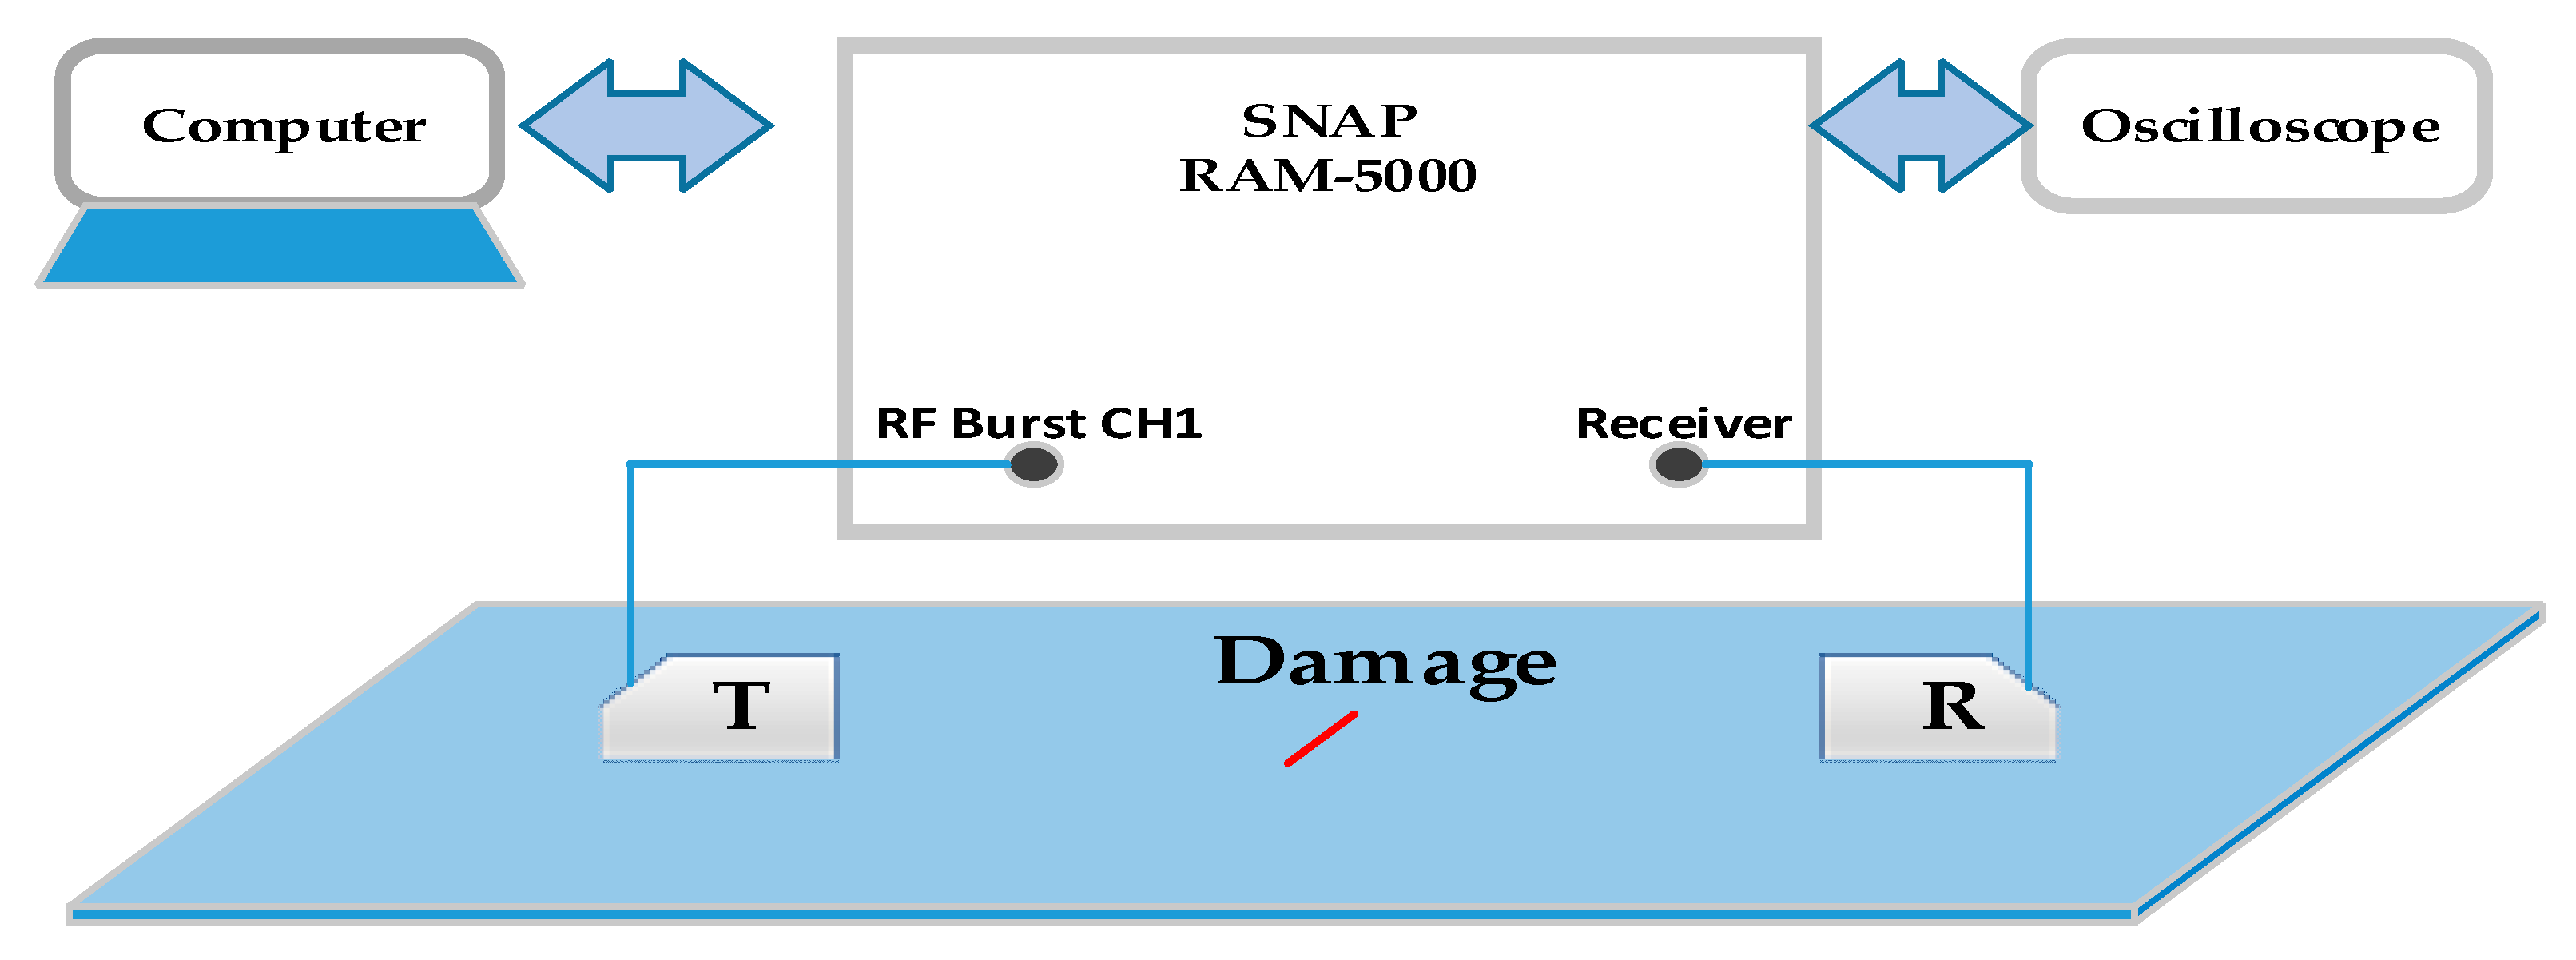
In this paper, the RAM-5000 SNAP nonlinear ultrasound system is used to excite a 0.5 MHz sinusoidal pulse to detect microcracks in a 6061-t6 aluminum alloy sheet. The Output Level is adjusted to 65 and the signal amplitude is approximately 500 V. At this point, the nonlinear effect is already obvious. (When the Output Level is determined, the connected probe is different, and the output voltage is different). In addition, a Hanning window was added, which makes the received signal frequency pure and is good for frequency analysis. The modulation signal’s burst width is set to 10 μs and the corresponding output signal amplitude is about 270 V. The experimental system block diagram is as Figure 13, the oscilloscope is used to observe and extract the time domain waveform, which is convenient for parameter debugging, and the sampling rate is 4 GSa/s:
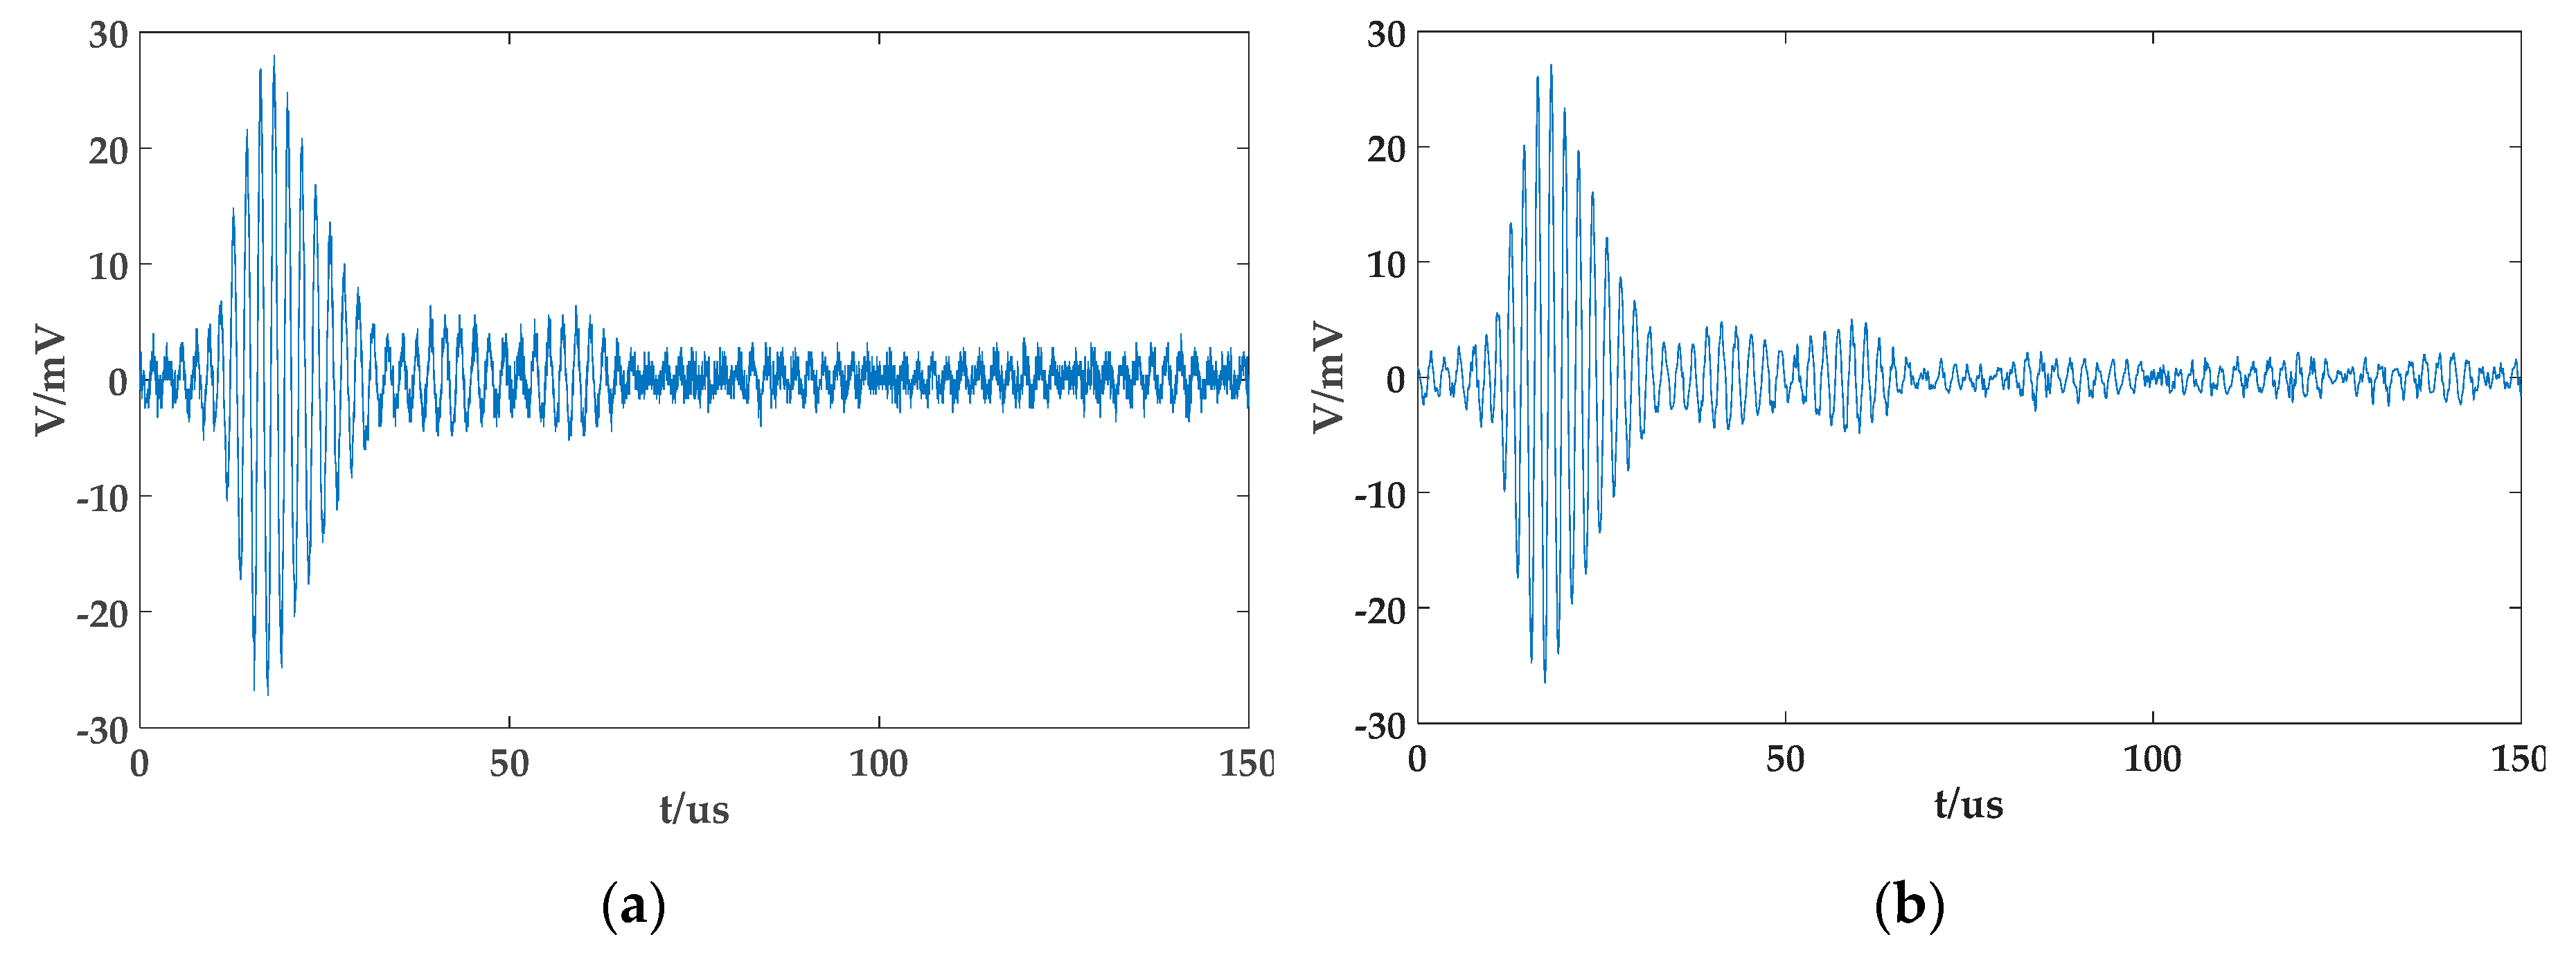
Due to the complicated environment, there are many interference factors in the experiment, and there are many noises in the received signal. An important feature of EMD is that the frequency can be selected. The noise frequency in the received waveform is far from the signal frequency, and the EMD decomposable condition is satisfied. The specific frequency can be extracted by the prior information. The number of IMFs decomposed is affected by the extreme points and the screening termination conditions. This article takes the default parameters and analyzes the frequency of each IMF programmatically. Finally, the noise is removed to achieve the filtering effect, as shown in the following Figure 14:
As can be seen from the above figure, EMD decomposes the original signal into intrinsic mode functions of different frequencies and removes the frequency higher than the second harmonic for signal reconstruction. After EMD filtering, the signal-to-noise ratio of the signal is obviously increased.
The center frequency of the 0.5P13*13 adjustable angle probe is 0.5 MHz and it is used to excite the 0.5 MHz lamb wave. Signal reception uses a 1P13*13 adjustable angle probe to better receive the second harmonic because of its 1 MHz center frequency. Excitation and reception probes are matched with RAM-5000 SNAP by BNC. The wedges are made of plexiglass, which is the key to exciting the S0 mode lamb wave. The coupling agent uses glycerin. The microcracks are produced by tapping and are about 3 mm long. The physical map of the microcrack is shown in Figure 15. The microcrack center point is still used as the coordinate origin, and the crack extends along the y-axis. Through simulation comparison, it can be seen that the microcrack positioning map is ideal when the receiving and sending positions are all five and symmetrically distributed, so the experiment adopts the same arrangement.

4.2. Results and Analysis of Experiment

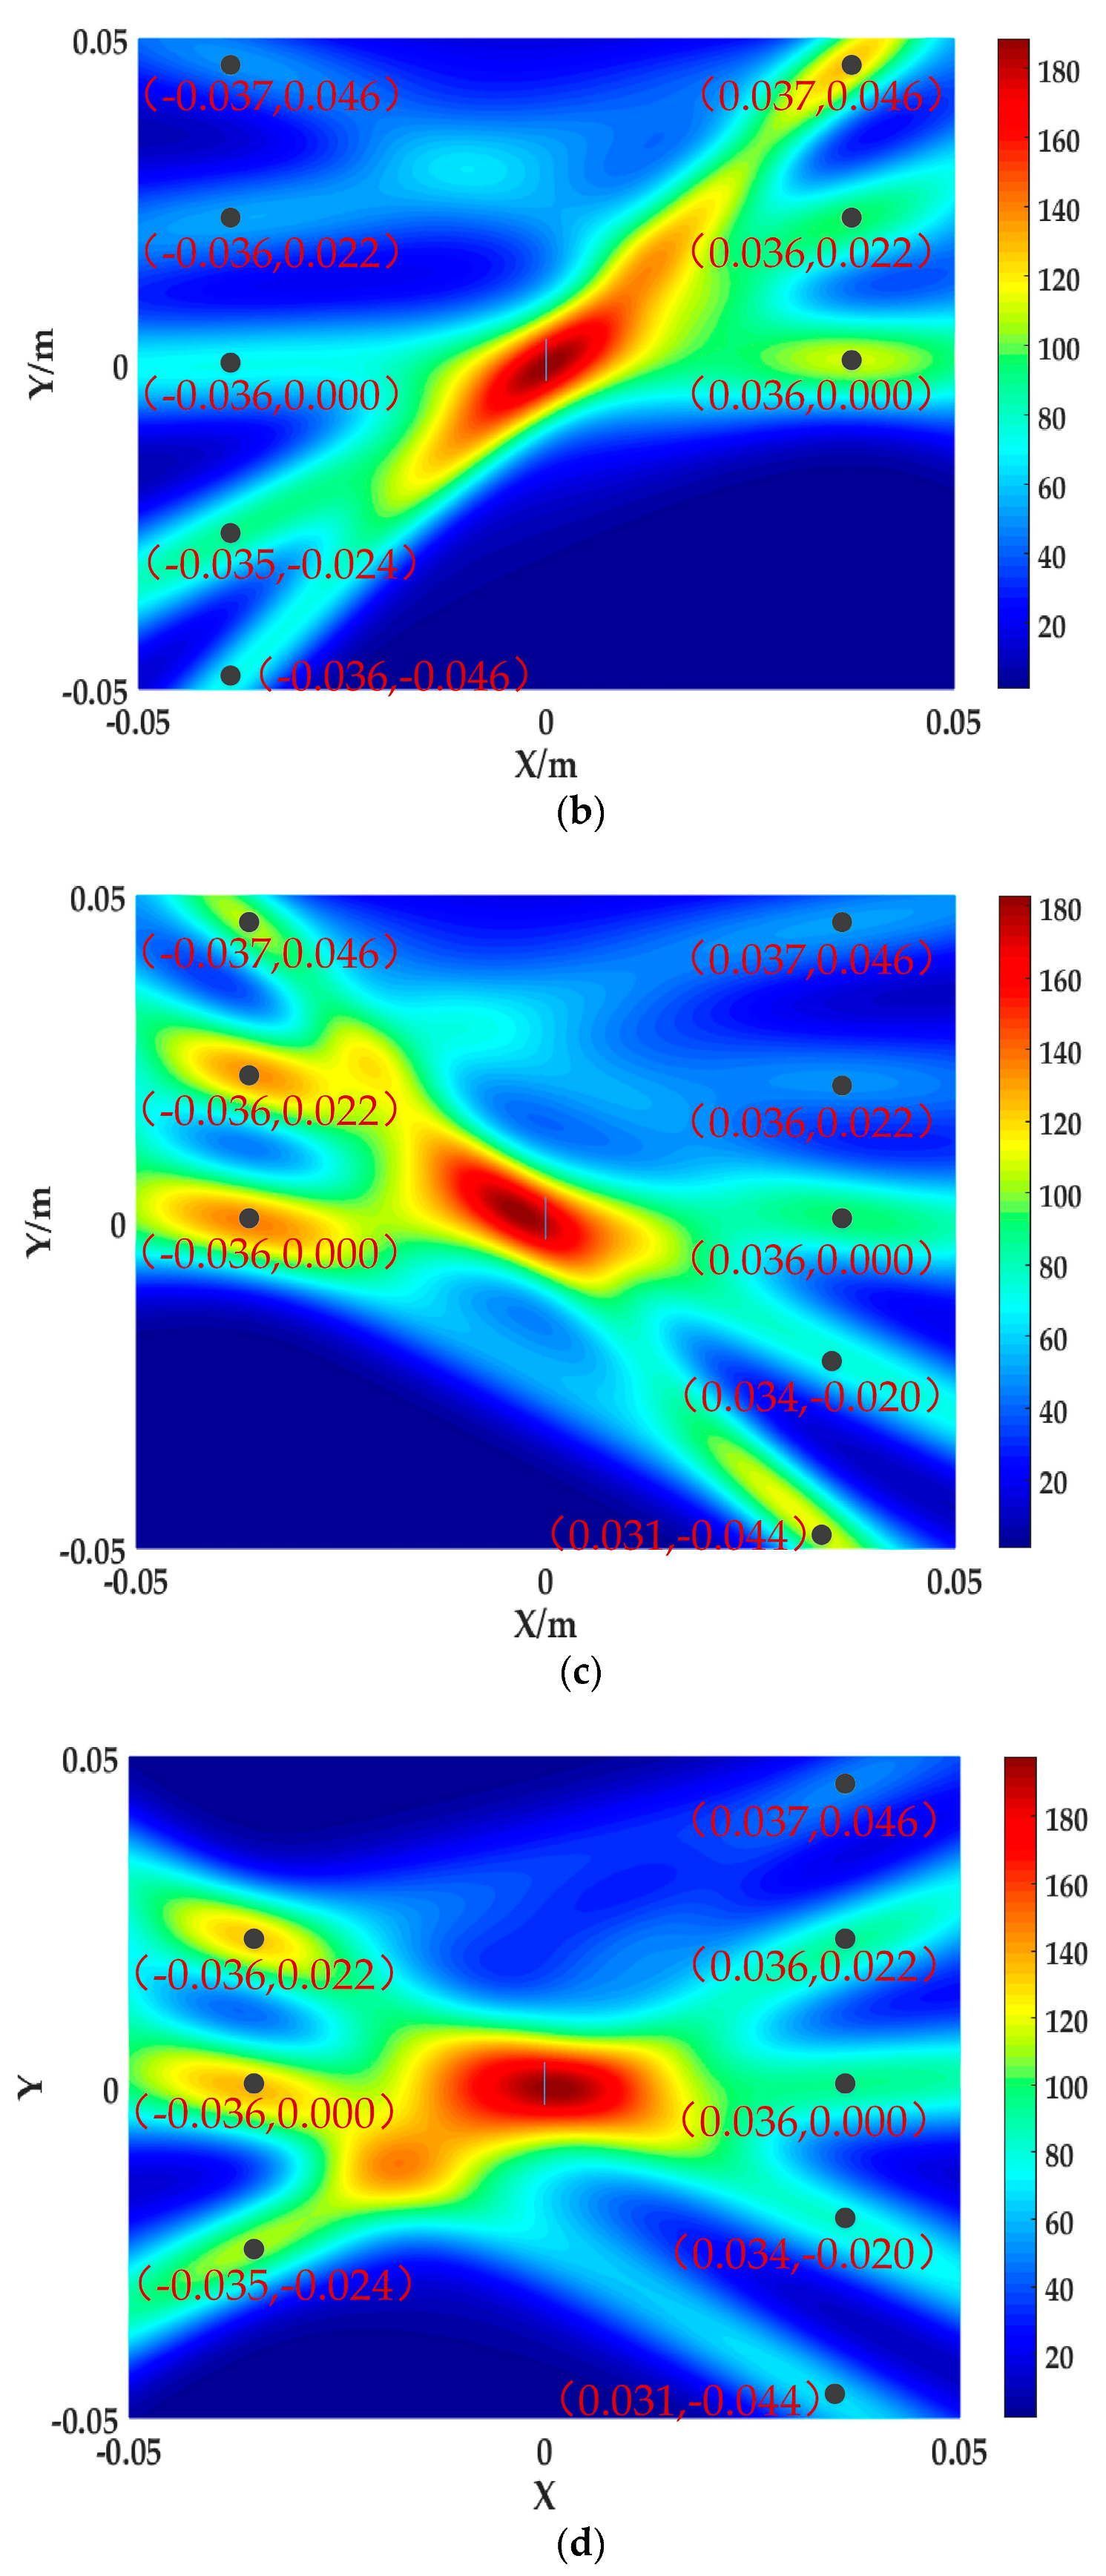
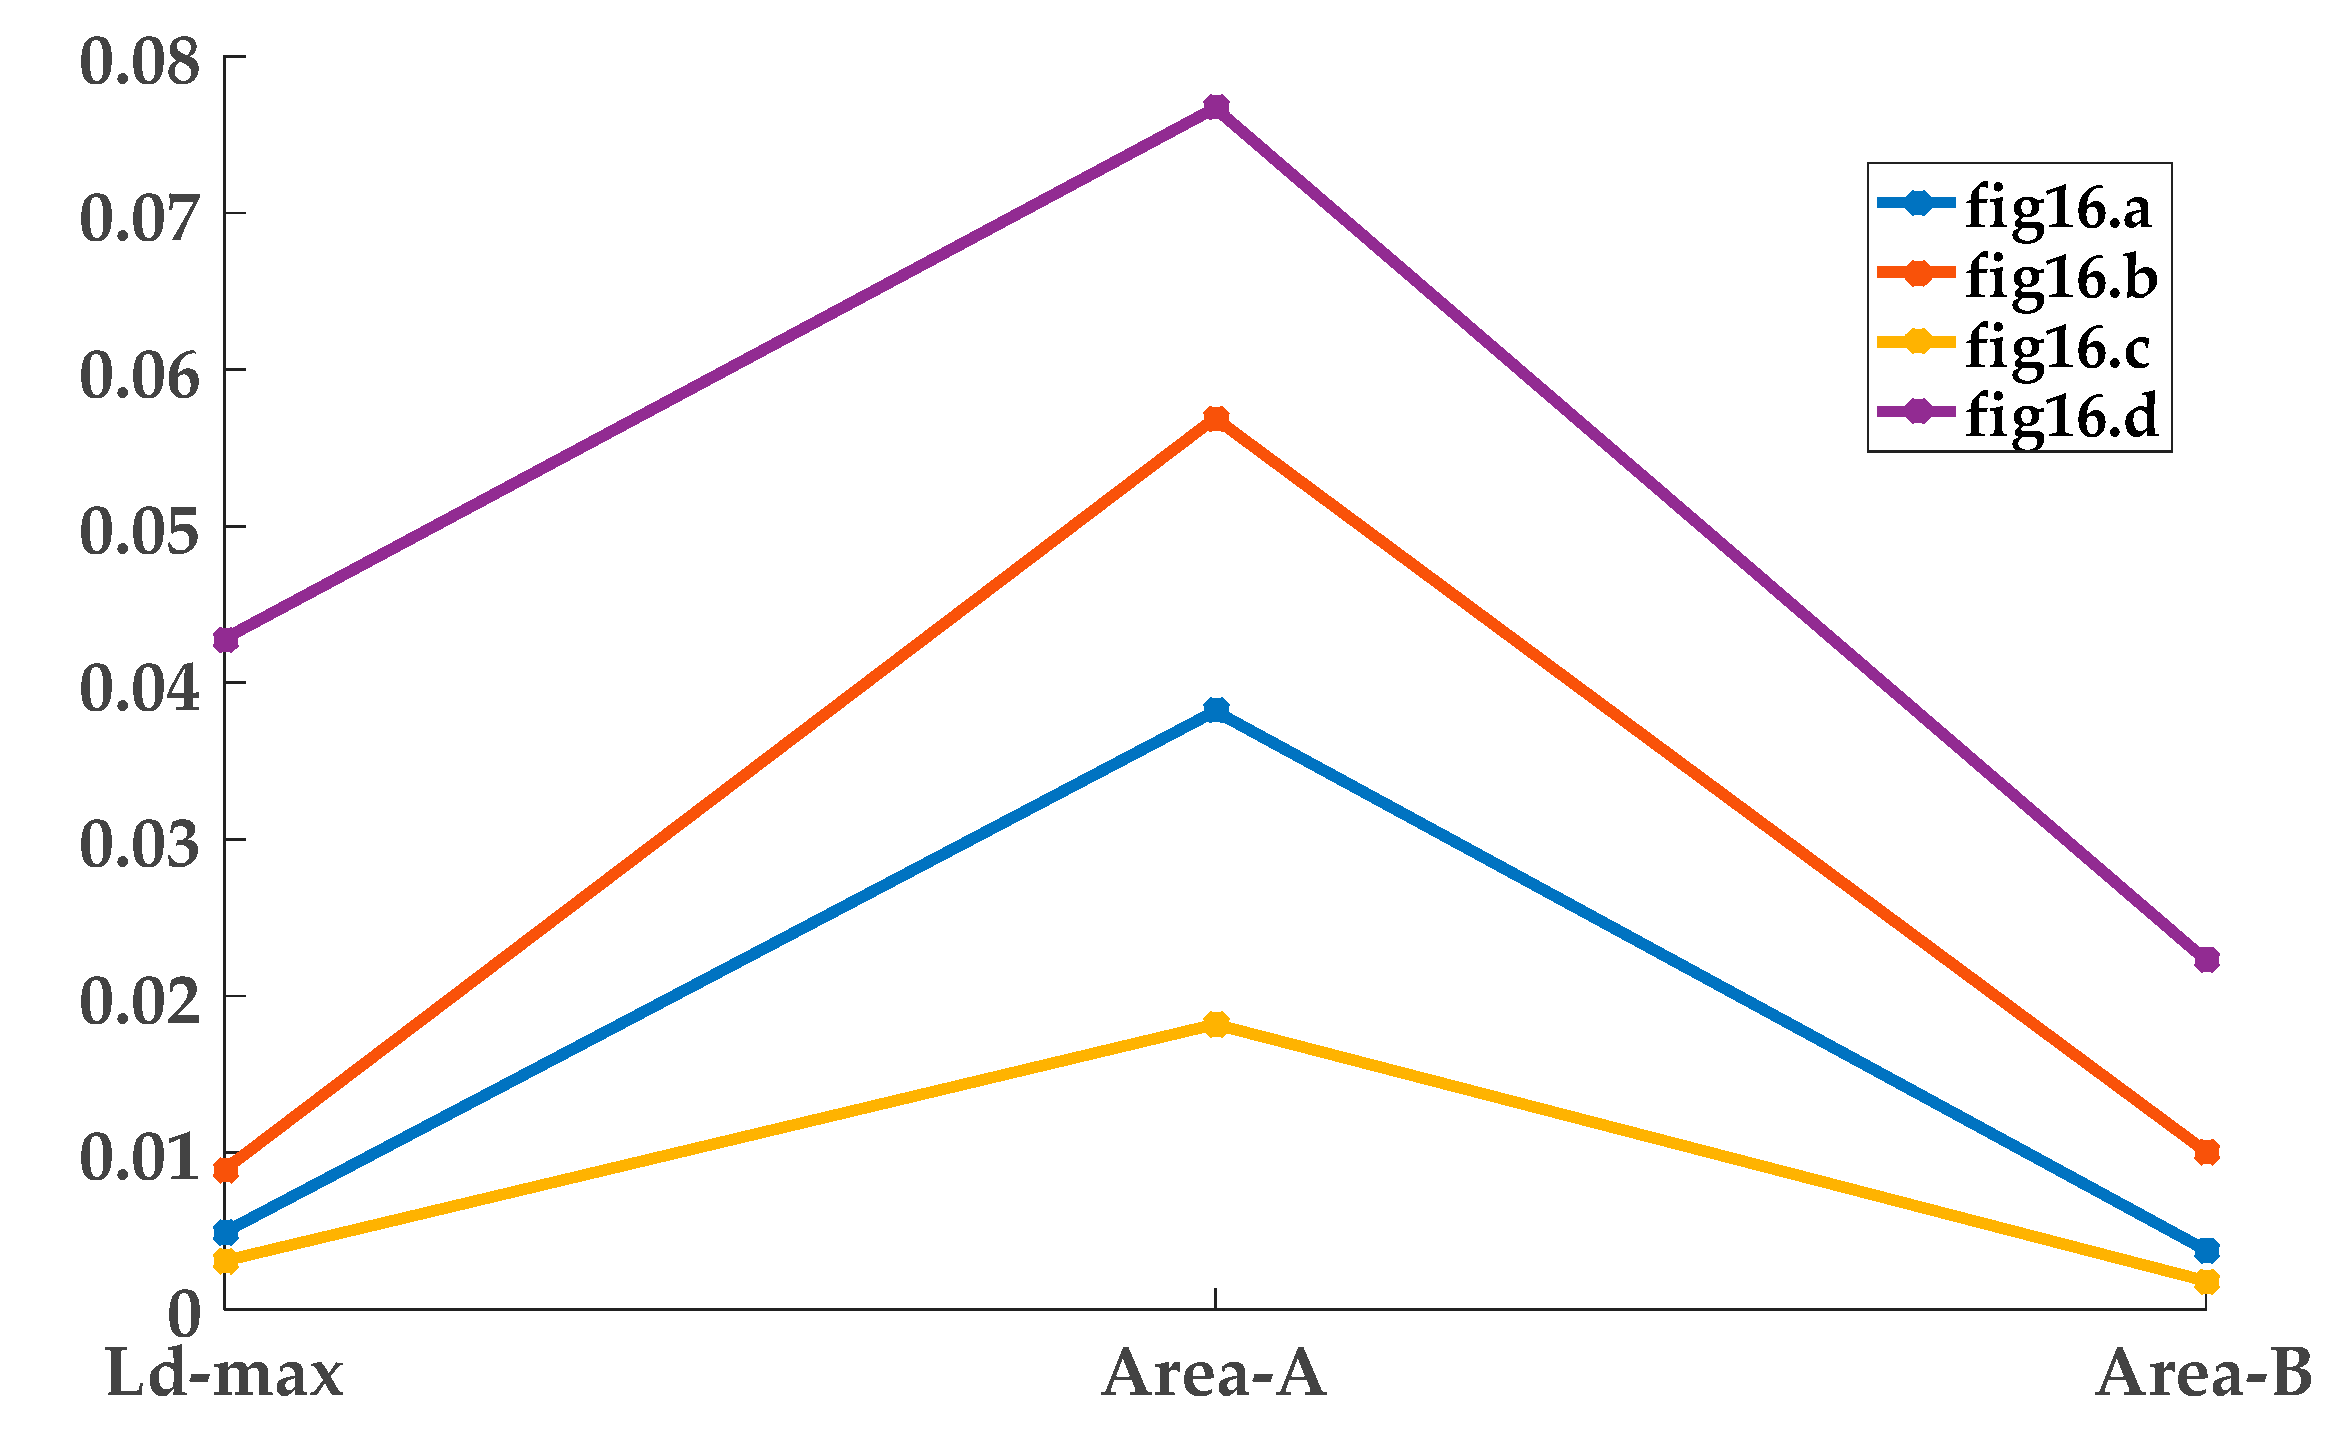
Through simulation comparison, it can be seen that the microcrack positioning imaging figures are ideal when the excitation and reception probes are all five and symmetrically distributed, so the experiment adopts the same arrangement and compares the microcrack positioning results at different positions. It can be seen from the positioning maps of Figure 16a–c that the experimental results are consistent with the simulation and the crack is effectively positioned. It can be seen from Figure 16d that, when there is no scanning center line passing through the microcrack, the positioning is not accurate.
The evaluation parameters of the positioning result are shown in Table 3:
As shown in the Figure 17 that in the four positioning maps, the minimum value of Ld-max is 0.003. The minimum value of Area-B is 0.018, and the minimum value of Area-A is 0.002. The minimum values all appear in Figure 16c. In the actual engineering operation, by moving the scanning matrix, when the focus of multiple scanning center lines passes through the microcrack, the imaging index amplitude is inevitably the largest. By comparing the imaging index, the microcrack can be effectively located.
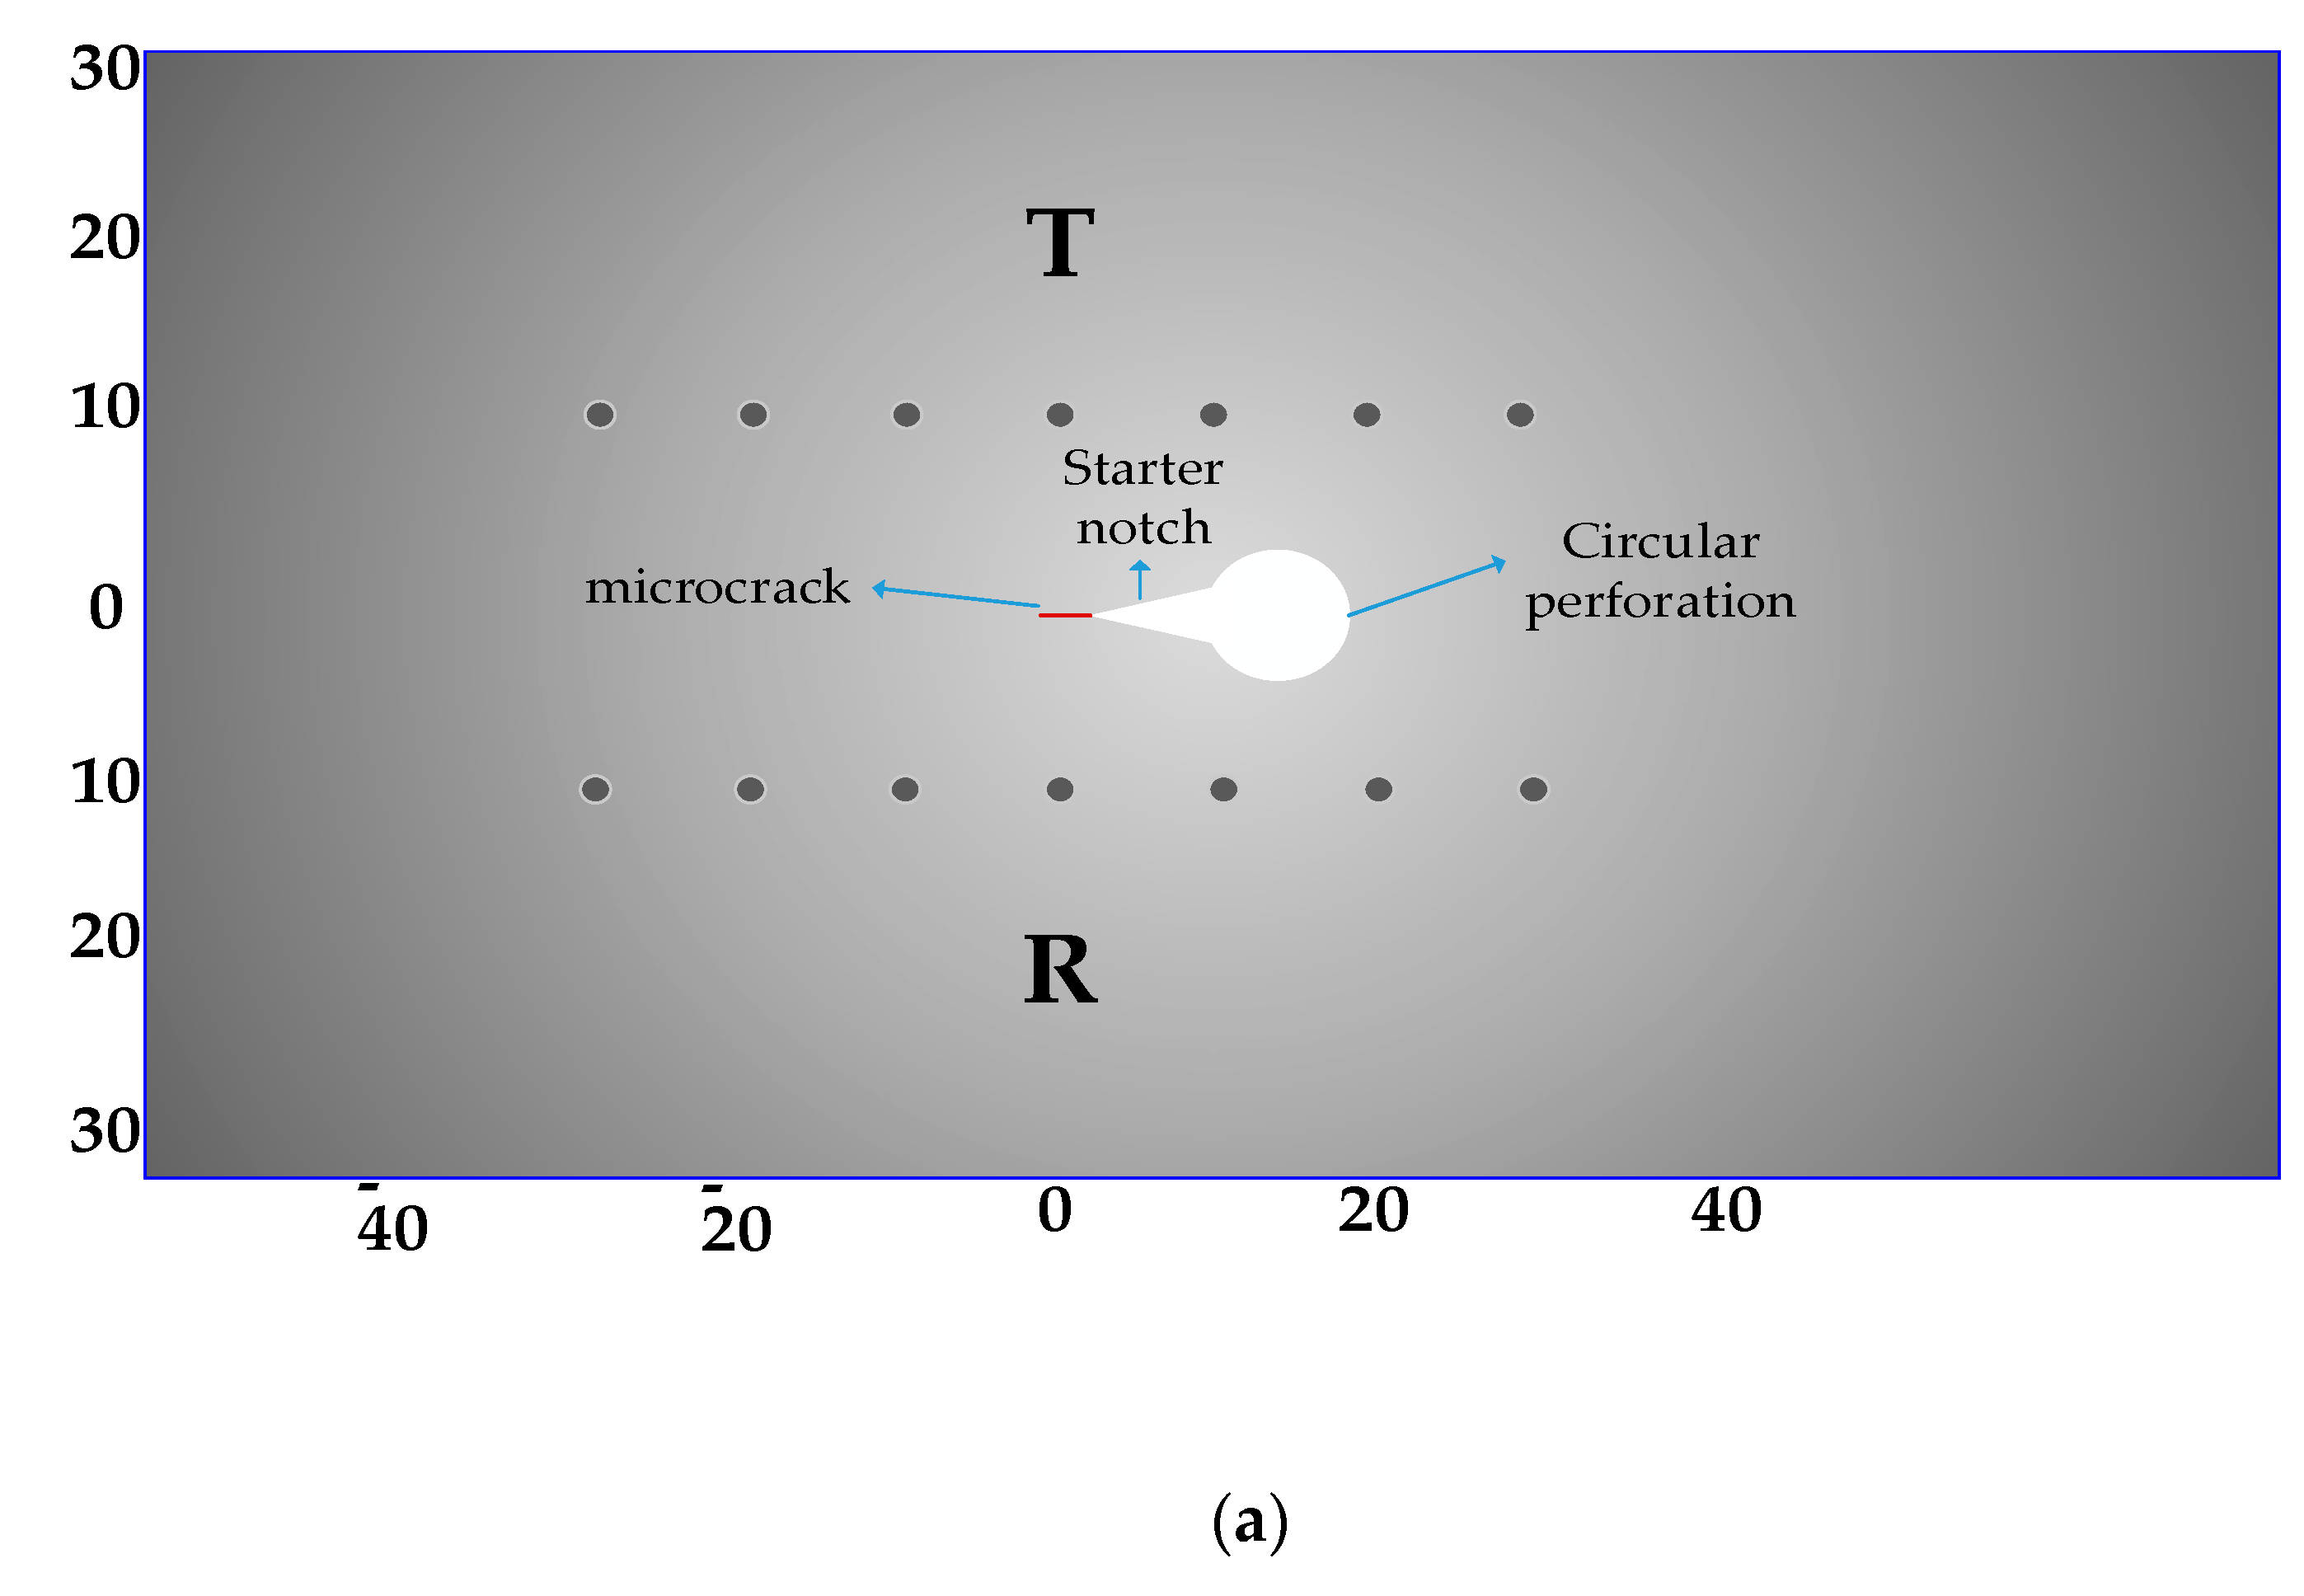
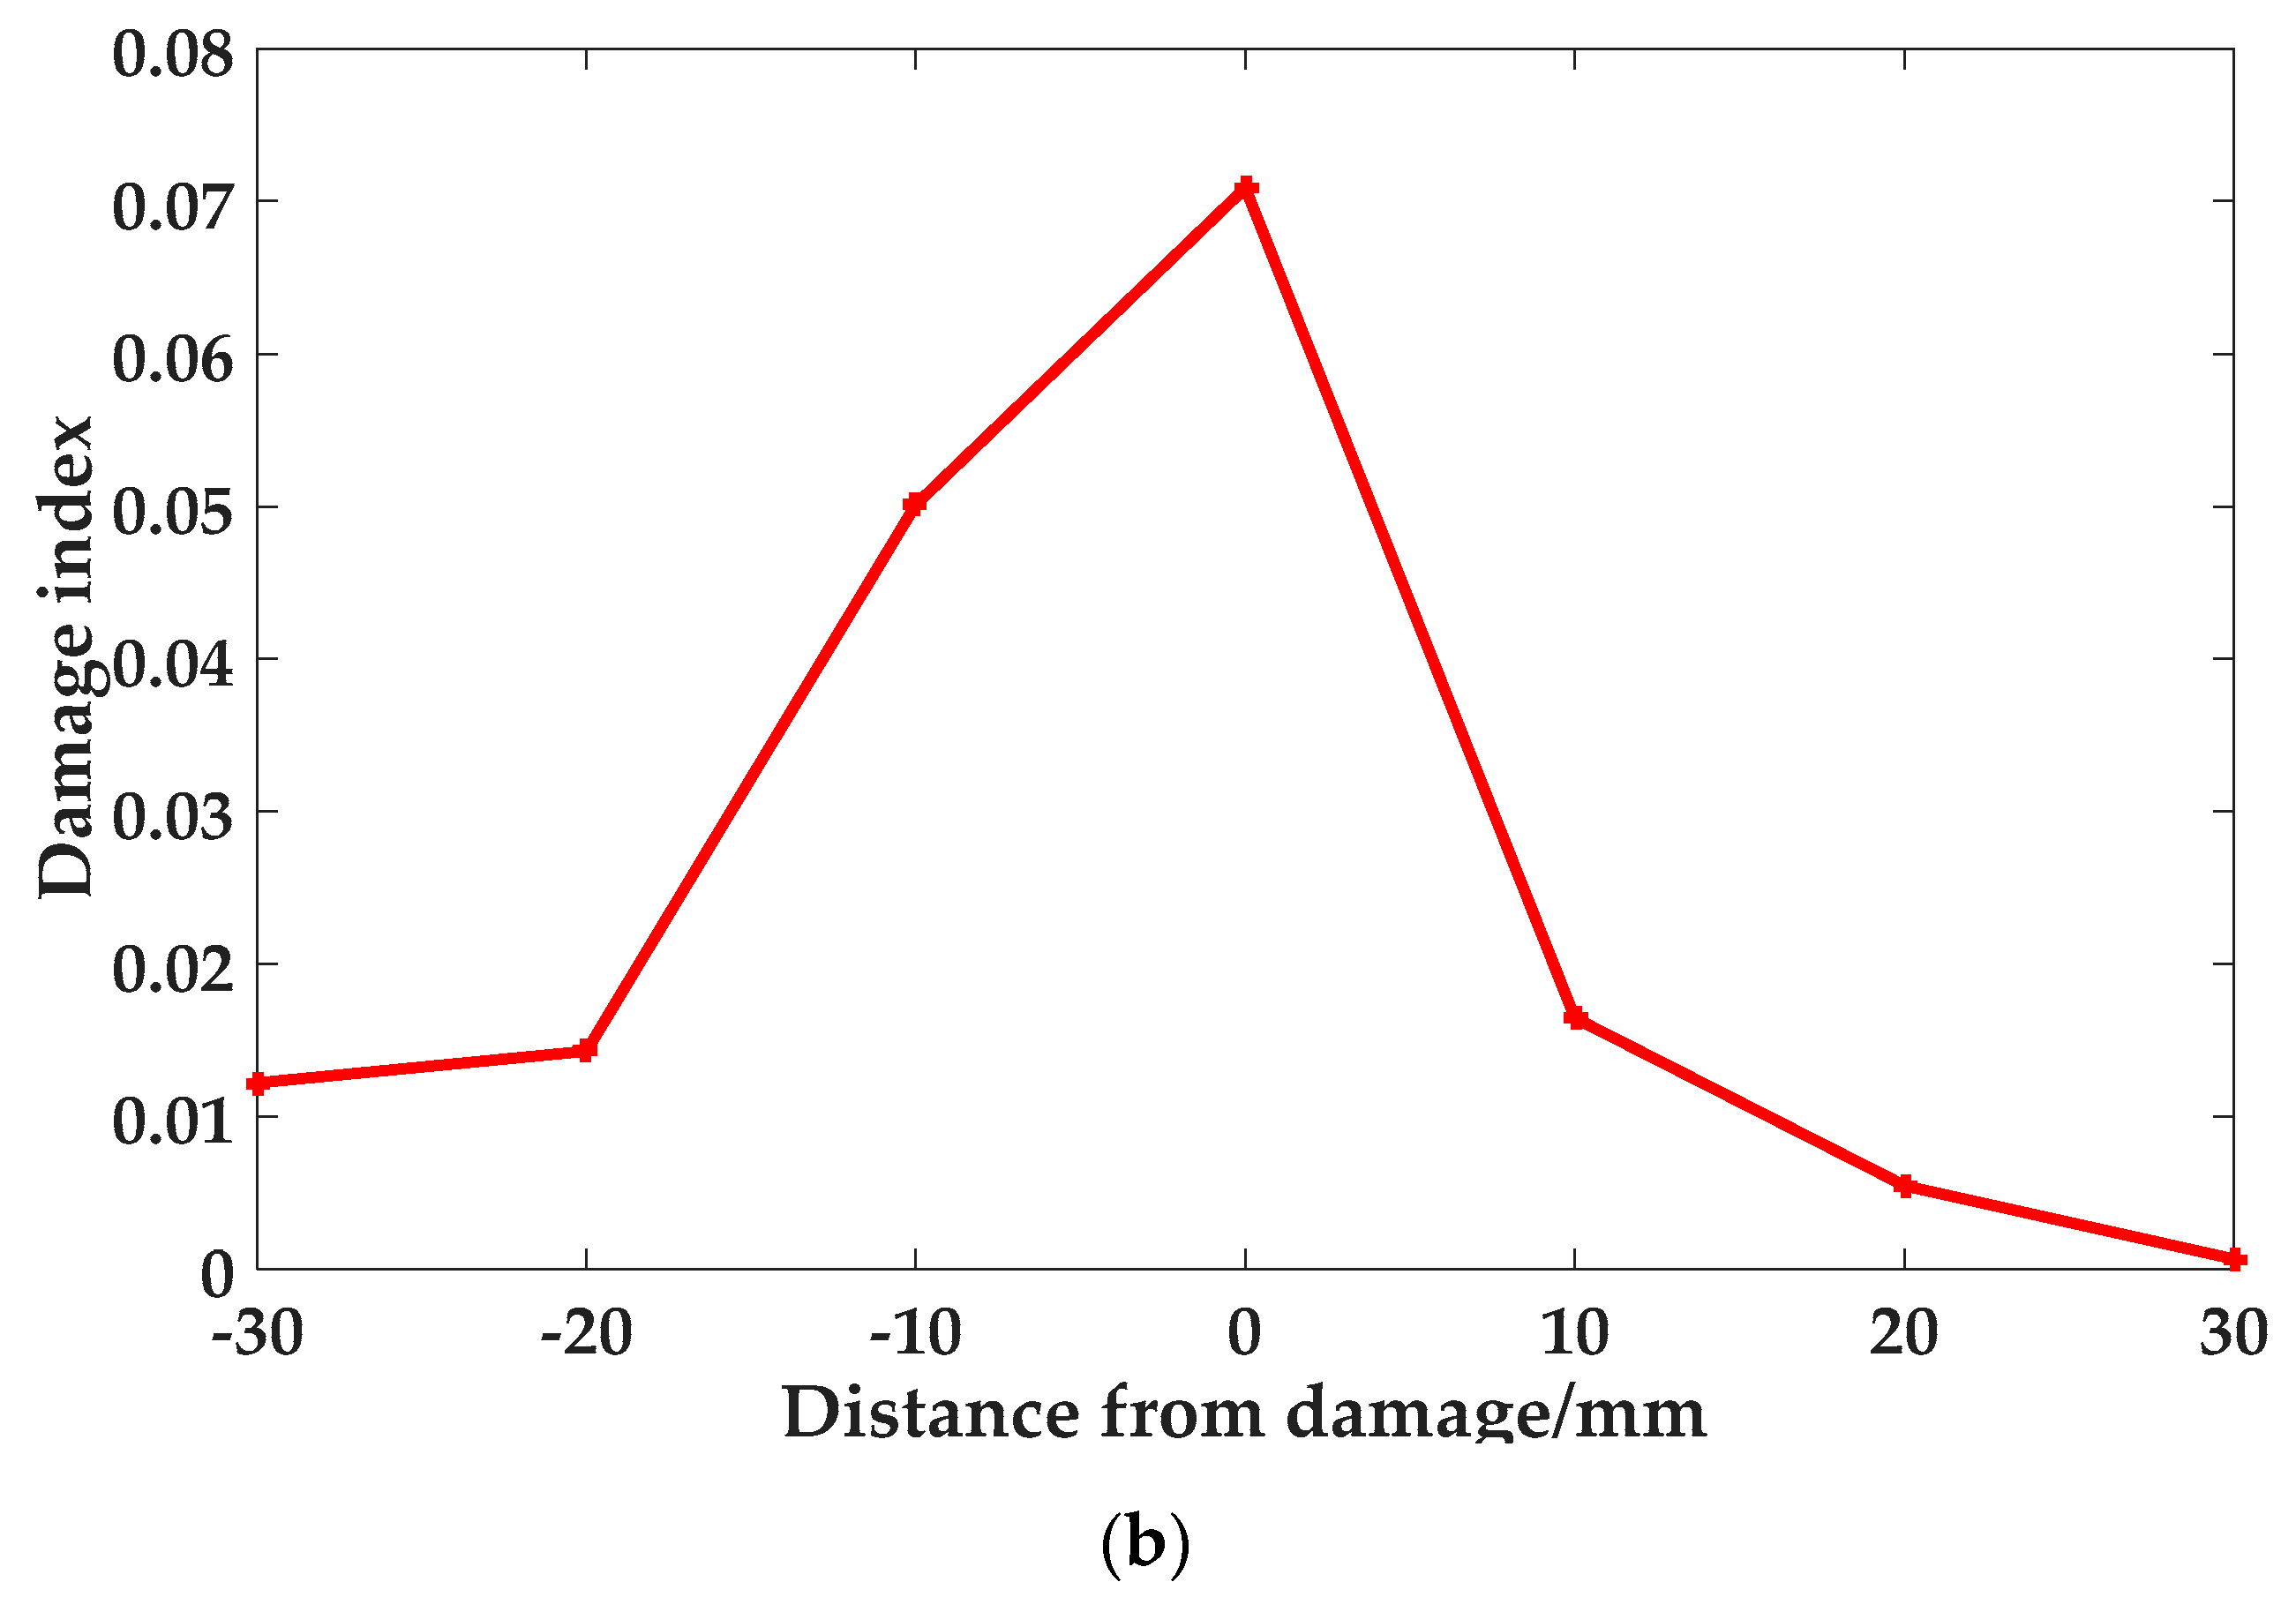
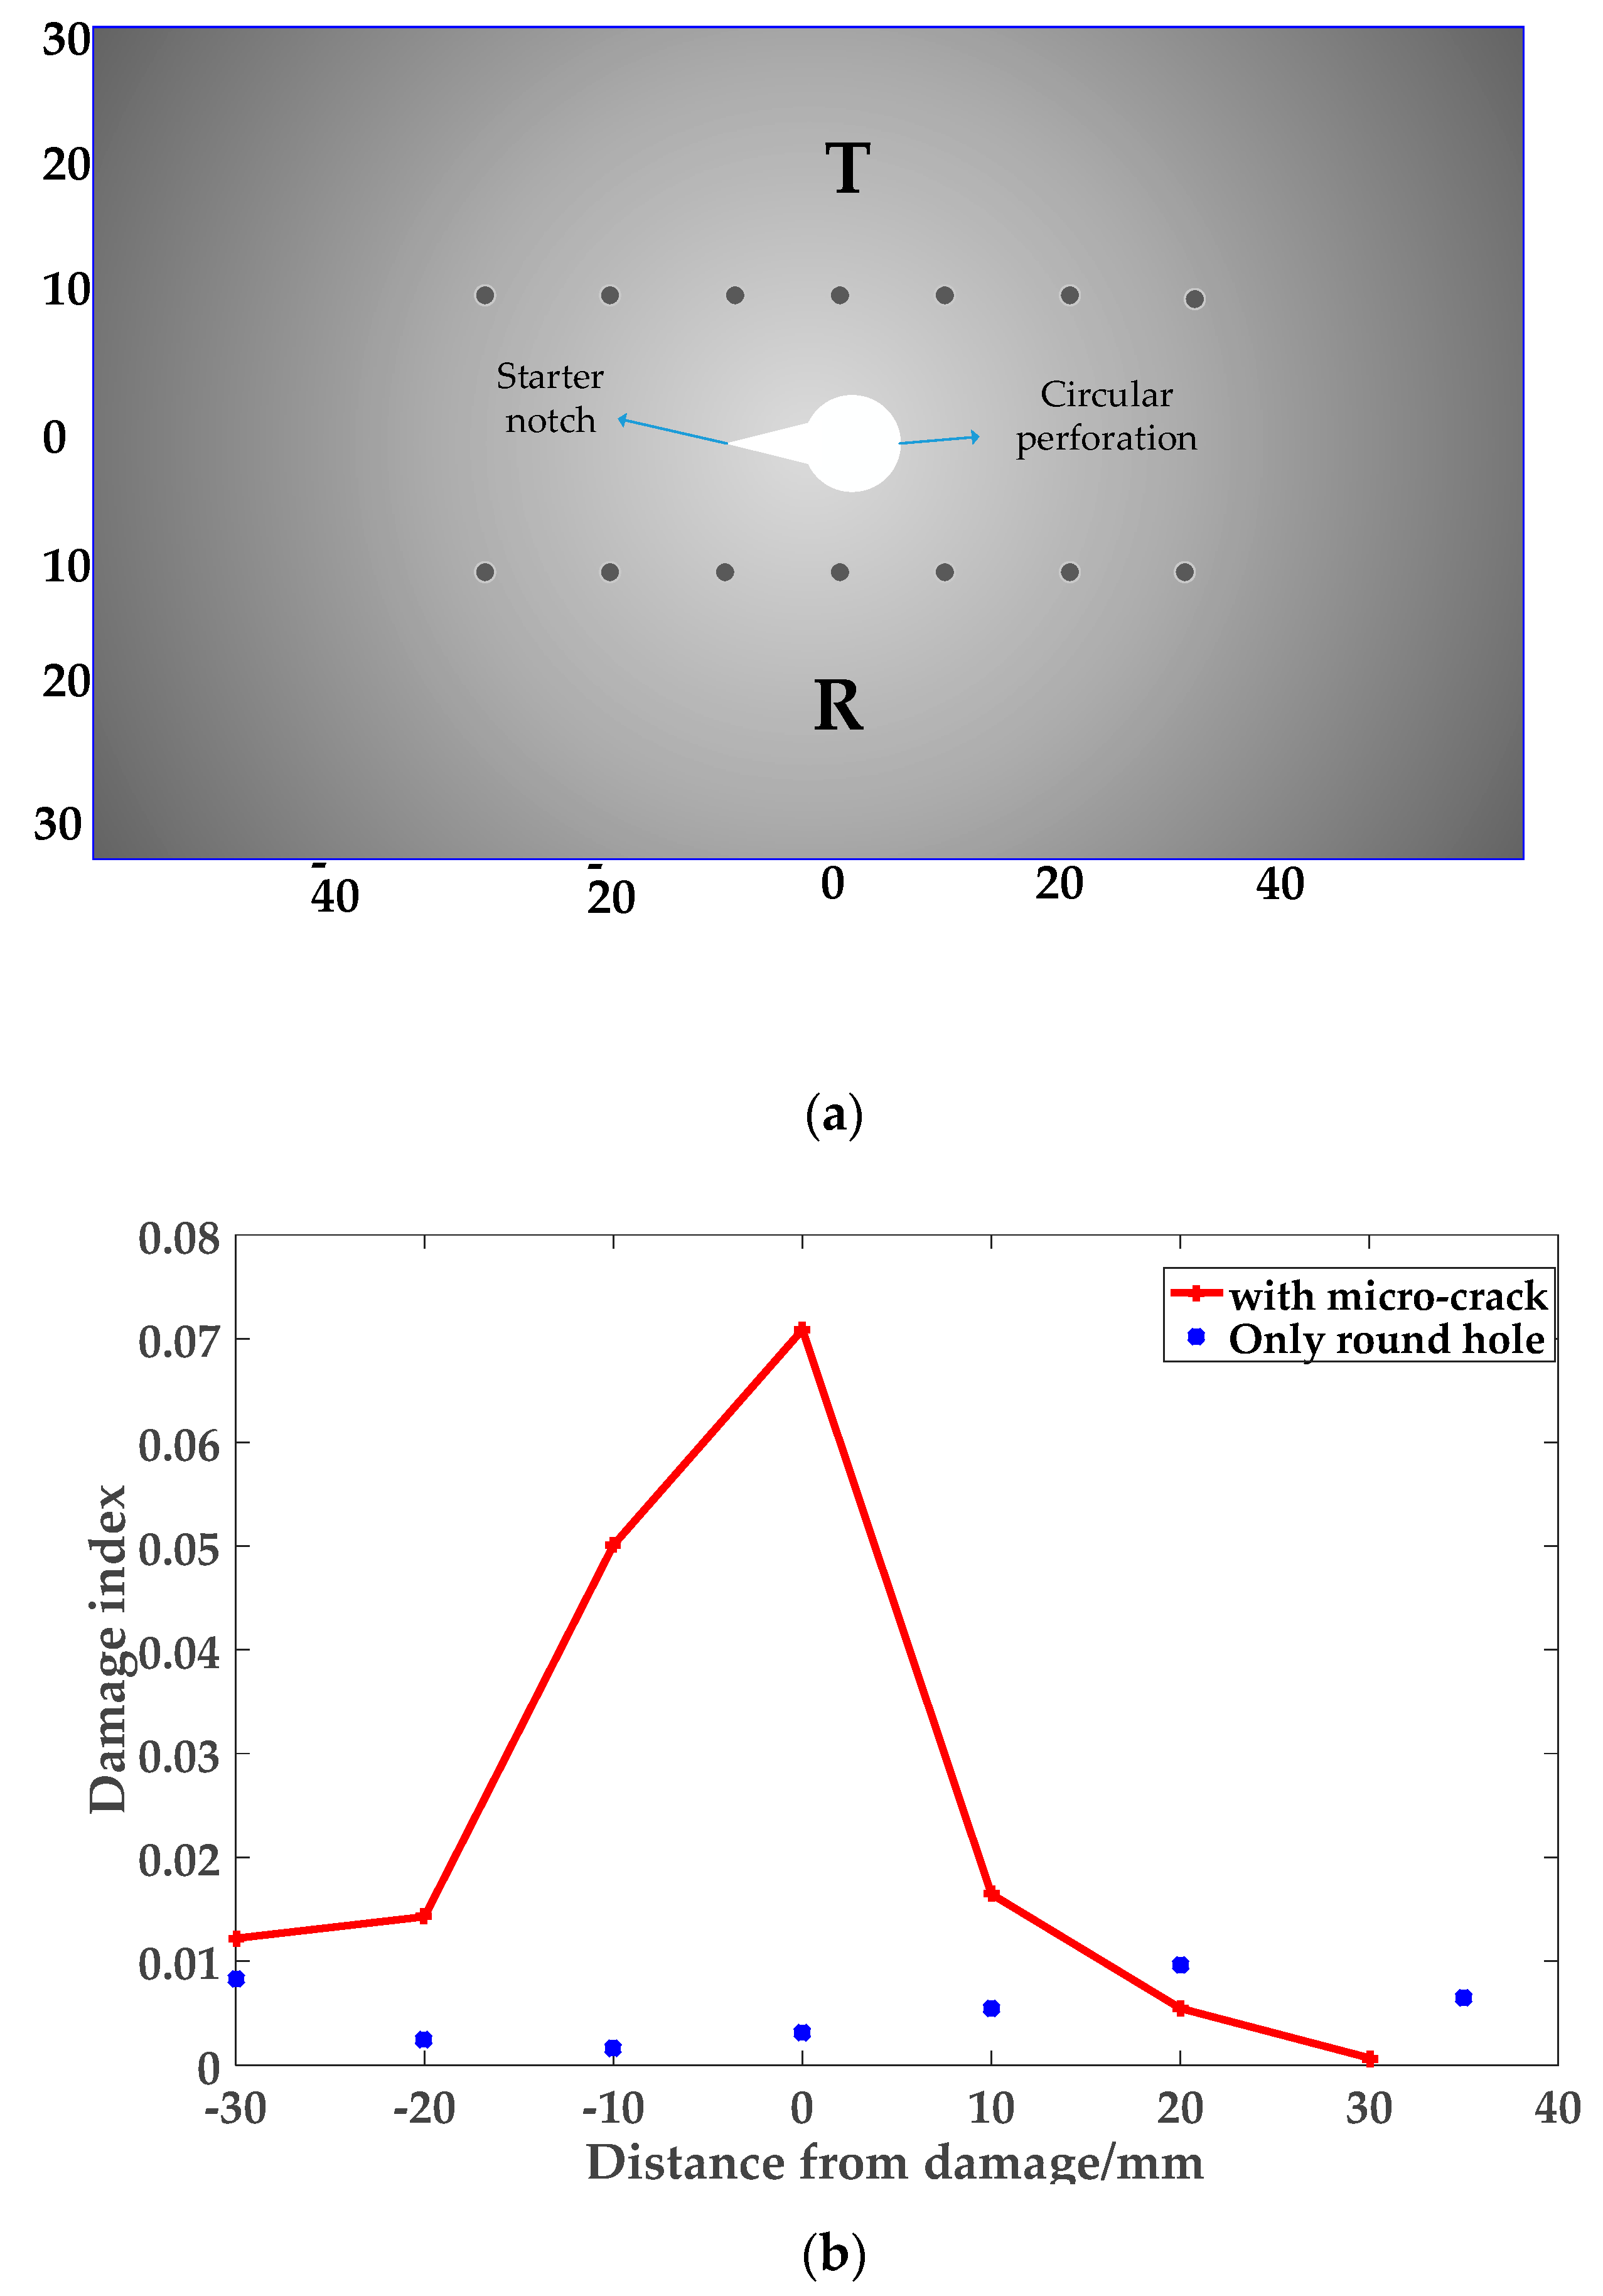
However, the experimental plates originally had circular perforation and starter notch in order to prove that the method is only sensitive to microcrack and the nonlinearity is not produced by the circular perforation or the starter notch. As shown in Figure 18a, we only drill a hole and starter notch on the plate, we do not process microcrack, use the circle point as the coordinate origin, arrange the excitation and reception probes parallel to the x-axis direction, set the left side of the origin as the y-axis negative axis, and then scan and calculate the damage coefficient. As shown in Figure 18b, the damage index obtained in this case is compared with Figure 5b.
When there is only a circular perforation in the plate, the damage index is extremely low, and the difference in the damage index detected at different positions is small. It can be considered that the circular perforation in the plate does not have nonlinear characteristics. The imaging index amplitude of the corresponding area of the circular hole in the imaging three-dimensional map is lower. When there is microcrack in the plate, the scanning path at 10 mm from the microcrack passes through the starter notch. The damage index is lower than that of the scan path when it passes through the microcrack, and the damage index is almost the same as that of the case where only the round hole exists. The starter notch also does not produce nonlinear features. Finally, it can be proved that the positioning imaging algorithm used in this paper is only sensitive to closed microcracks and can locate the damage very efficiently.

4.3. Discussion

  • The above results show that when the S0 single-mode lamb wave is used as the detection fundamental wave, the method of using the probability scan matrix to locate the microcrack can effectively locate and image the microcrack. This method has good robustness and accuracy, and is only sensitive to microcracks.
  • The limitation of the method in this paper is that a microcrack can be effectively positioned only when two or more scanning centerlines pass through it, although there is an error when the microcrack is not at the focus. However, by moving the scan matrix and comparing the amplitude of the imaging core, it can still accurately locate the microcrack.
  • In order to better solve the above shortcomings, for small area detection, the array can be set closer and the scanning path can be increased. For wide area detection, this method can be used as a qualitative test method, as long as the possibility of microcrack is detected within the area, further narrowing the range for secondary scanning.

5. Conclusions

In this paper, a method for locating microcracks using a probability scan matrix is proposed. The nonlinear S0 single-mode lamb wave is excited by the probe with plexiglass wedge as the detection fundamental wave. The nonlinear S0 single-mode lamb wave effectively avoids the effects of dispersion effects. It makes signal analysis more convenient and the velocity information more accurate. More importantly, the algorithm is only sensitive to early minor damage. Because early damage, such as a microcrack, takes up most of the fatigue life, the research in this paper has reference significance for engineering safety assessment, helping engineers to take remedial measures in time. The microcrack is effectively and accurately located and the experiment is consistent with the simulation results. Moreover, in the experiment, the minimum value of the edge of the core area to the center of the microcrack is 0.003 m. The core area accounts for 0.0018% of the total scanned area. The positioning result is ideal. The positioning algorithm has strong robustness, the position of the microcrack and the distribution of the sensor have little influence on the positioning capability. However, in order to achieve a better positioning result, more sensors need to be arranged and arranged symmetrically. In this context, the sensors are arranged in a direction parallel to the y-axis. The authors believe that the sensors can also be aligned parallel to the x-axis direction to further increase the number of scanning paths and improve accuracy.

Author Contributions

Formal analysis, C.M. and Z.Y.; Investigation, C.M.; Methodology, S.Z. and X.R.; Project administration, Y.L.; Software, S.Z.; Writing—original draft, S.Z.; Writing—review & editing, Y.L. and X.R.

Funding

This research was funded by National Key R&D Program of China (No. 2018YFF0212201) and Natural Science Foundation of Tianjin (No. 17JCYBJC19300).

Conflicts of Interest

The authors declare no conflict of interest.

References

  1. Zhao, L. Research on Nonlinear Ultrasonic Testing of Fatigue Damage of Aluminum Alloy Welded Joints. Master’s Thesis, Harbin Institute of Technology, Harbin, China, 2012. [Google Scholar]
  2. Liu, D.; Pons, D. Crack propagation mechanisms for creep fatigue: a consolidated explanation of fundamental behaviours from initiation to failure. Metals 2018, 8, 623. [Google Scholar] [CrossRef]
  3. Zhang, J.; Xuan, F.; Xiang, Y. Evaluation of material damage using nonlinear ultrasonic wave. Sci. Bull. 2016, 61, 1536–1550. [Google Scholar]
  4. Meyendorf, N.G.H.; Rösner, H.; Kramb, V.; Sathish, S. Thermo-acoustic fatigue characterization. Ultrasonics 2002, 40, 427–434. [Google Scholar] [CrossRef]
  5. Cantrell, J.H. Substructural organization, dislocation plasticity and harmonic generation in cyclically stressed wavy slip metals. Proc. Phys. Soc. Lond. Sect. A 2004, 460, 757–780. [Google Scholar] [CrossRef]
  6. Carpinteri, A.; Accornero, F. Multiple snap-back instabilities in progressive microcracking coalescence. Eng. Fract. Mech. 2018, 187, 272–281. [Google Scholar] [CrossRef]
  7. Lei, Y.; Ding, G.; Bao, H. Non-Destructive Testing Technology Q & A; China Petrochemical Press: Beijing, China, 2013; pp. 1–5. [Google Scholar]
  8. Liu, S.; Sun, Y.; Gu, M.; Liu, C.; He, L.; Kang, Y. Review and analysis of three representative electromagnetic NDT methods. Insight Non Destr. Test. Cond. Monit. 2017, 59, 176–183. [Google Scholar] [CrossRef]
  9. Duchene, P.; Chaki, S.; Ayadi, A.; Krawczak, P. A review of non-destructive techniques used for mechanical damage assessment in polymer composites. J. Mater. Sci. 2018, 53, 7915–7938. [Google Scholar] [CrossRef]
  10. Zhou, Z.; Sun, G. New progress of the study and application of advanced ultrasonic testing technology. J. Mech. Eng. 2017, 53, 1–10. [Google Scholar] [CrossRef]
  11. Li, G.; Zhang, G. Laser ultrasonic technology and its applications in nondestructive testing in solids. Proc. SPIE Int. Soc. Opt. Eng. 2005, 5638, 804–812. [Google Scholar]
  12. Masurkar, F.A.; Yelve, N.P. Optimizing location of damage within an enclosed area defined by an algorithm based on the Lamb wave response data. Appl. Acoust. 2017, 120, 98–110. [Google Scholar] [CrossRef]
  13. Zeng, L.; Lin, J. Structural damage imaging approaches based on lamb waves: A review. In Proceedings of the 2011 International Conference on Quality, Reliability, Risk, Maintenance, and Safety Engineering (ICQR2MSE 2011), Xi’an, China, 17–19 June 2011. [Google Scholar]
  14. Chimenti, D.E. Guided Waves in Plates and Their Use in Materials Characterization. Appl. Mech. Rev. 1997, 50, 247–284. [Google Scholar] [CrossRef]
  15. Wilcox, P.; Lowe, M.; Cawley, P. The effect of dispersion on long-range inspection using ultrasonic guided waves. NDT E Int. 2001, 34, 1–9. [Google Scholar] [CrossRef]
  16. Cawley, P.; Alleyne, D. The use of Lamb waves for the long range inspection of large structures. Ultrasonics 1996, 34, 287–290. [Google Scholar] [CrossRef]
  17. Zhao, Y.; Qiu, Y.; Jacobs, L.J.; Qu, J. Frequency-dependent tensile and compressive effective moduli of elastic solids with distributed penny-shaped microcracks. Acta Mech. 2016, 227, 1–21. [Google Scholar] [CrossRef]
  18. Accornero, F.; Lacidogna, G.; Carpinteri, A. Evolutionary fracture analysis of masonry arches: Effects of shallowness ratio and size scale. Comptes Rendus Mécanique 2016, 344, 623–630. [Google Scholar] [CrossRef]
  19. Müller, M.F.; Kim, J.Y.; Qu, J.; Jacobs, L.J. Characteristics of second harmonic generation of Lamb waves in nonlinear elastic plates. J. Acoust. Soc. Am. 2010, 127, 2141. [Google Scholar] [CrossRef]
  20. Deng, M.; Xiang, Y.; Liu, L. Time-domain analysis and experimental examination of cumulative second-harmonic generation by primary Lamb wave propagation. J. Appl. Phys. 2011, 109, 1829–1836. [Google Scholar] [CrossRef]
  21. Zhao, Y.; Li, F.; Cao, P.; Liu, Y.; Zhang, J.Y.; Fu, S.; Zhang, J.; Hu, N. Generation mechanism of nonlinear ultrasonic Lamb waves in thin plates with randomly distributed micro-cracks. Ultrasonics 2017, 79, 60–67. [Google Scholar] [CrossRef] [Green Version]
  22. Deng, M. Characterization of surface properties of a solid plate using nonlinear Lamb wave approach. Ultrasonics 2006, 44, 1157–1162. [Google Scholar] [CrossRef]
  23. Cantrell, J.H.; Yost, W.T. Nonlinear ultrasonic characterization of fatigue microstructures. Int. J. Fatigue 2001, 23, 487–490. [Google Scholar] [CrossRef]
  24. Fierro, G.P.M.; Meo, M. Nonlinear elastic imaging of barely visible impact damage in composite structures using a constructive nonlinear array sweep technique. Ultrasonics 2018, 90, 125–143. [Google Scholar] [CrossRef]
  25. Liu, X.; Bo, L.; Liu, Y.; Zhang, J.; Hu, N.; Fu, S.; Deng, M. Detection of micro-cracks using nonlinear lamb waves based on the Duffing-Holmes system. J. Sound Vib. 2017, 405, 175–186. [Google Scholar] [CrossRef]
  26. Masurkar, F.; Tse, P.W.; Yelve, N. Investigating the critical aspects of evaluating the material nonlinearity in metal plates using Lamb waves: Theoretical and numerical approach. Appl. Acoust. 2018, 140, 301–314. [Google Scholar] [CrossRef]
  27. Singh, A.K.; Chen, B.Y.; Tan, V.B.; Tay, T.E.; Lee, H.P. Finite element modeling of nonlinear acoustics/ultrasonics for the detection of closed delaminations in composites. Ultrasonics 2016, 74, 89–98. [Google Scholar] [CrossRef] [PubMed]
  28. Ding, X.; Zhao, Y.; Hu, N.; Liu, Y.; Zhang, J.; Deng, M. Experimental and numerical study of nonlinear Lamb waves of a low-frequency S0 mode in plates with quadratic nonlinearity. Materials 2018, 11, 2096. [Google Scholar] [CrossRef] [PubMed]
  29. Liu, Z.; Zhong, X.; Dong, T.; He, C.; Wu, B. Delamination detection in composite plates by synthesizing time-reversed Lamb waves and a modified damage imaging algorithm based on RAPID. Struct. Control Health Monit. 2016, 24, 1919. [Google Scholar] [CrossRef]
  30. Lu, G.; Li, Y.; Wang, T.; Xiao, H.; Huo, L.; Song, G. A multi-delay-and-sum imaging algorithm for damage detection using piezoceramic transducers. J. Intell. Mater. Syst. Struct. 2017, 28, 1150–1159. [Google Scholar] [CrossRef]
  31. Gu, J.; Zhou, C.; Luo, Y.; Wang, Z.; Xu, C. Time reversal multiple signal classification algorithm for imaging of CS damage. Electron. Sci. Technol. 2015. [Google Scholar] [CrossRef]
  32. Liu, G.; Xiao, Y.; Zhang, H.; Ren, G. Elliptical ring distribution probability-based damage imaging method for complex aircraft structures. J. Vibroeng. 2017, 19, 4936–4952. [Google Scholar] [CrossRef]
  33. Yanyu, M.; Shi, Y. Thin plate Lamb propagation rule and dispersion curve drawing based on wave theory. Surf. Rev. Lett. 2018. [Google Scholar] [CrossRef]
  34. Wan, X.; Tse, P.W.; Xu, G.H.; Tao, T.F.; Zhang, Q. Analytical and numerical studies of approximate phase velocity matching based nonlinear S0 mode Lamb waves for the detection of evenly distributed microstructural changes. Smart Mater. Struct. 2016, 25. [Google Scholar] [CrossRef]
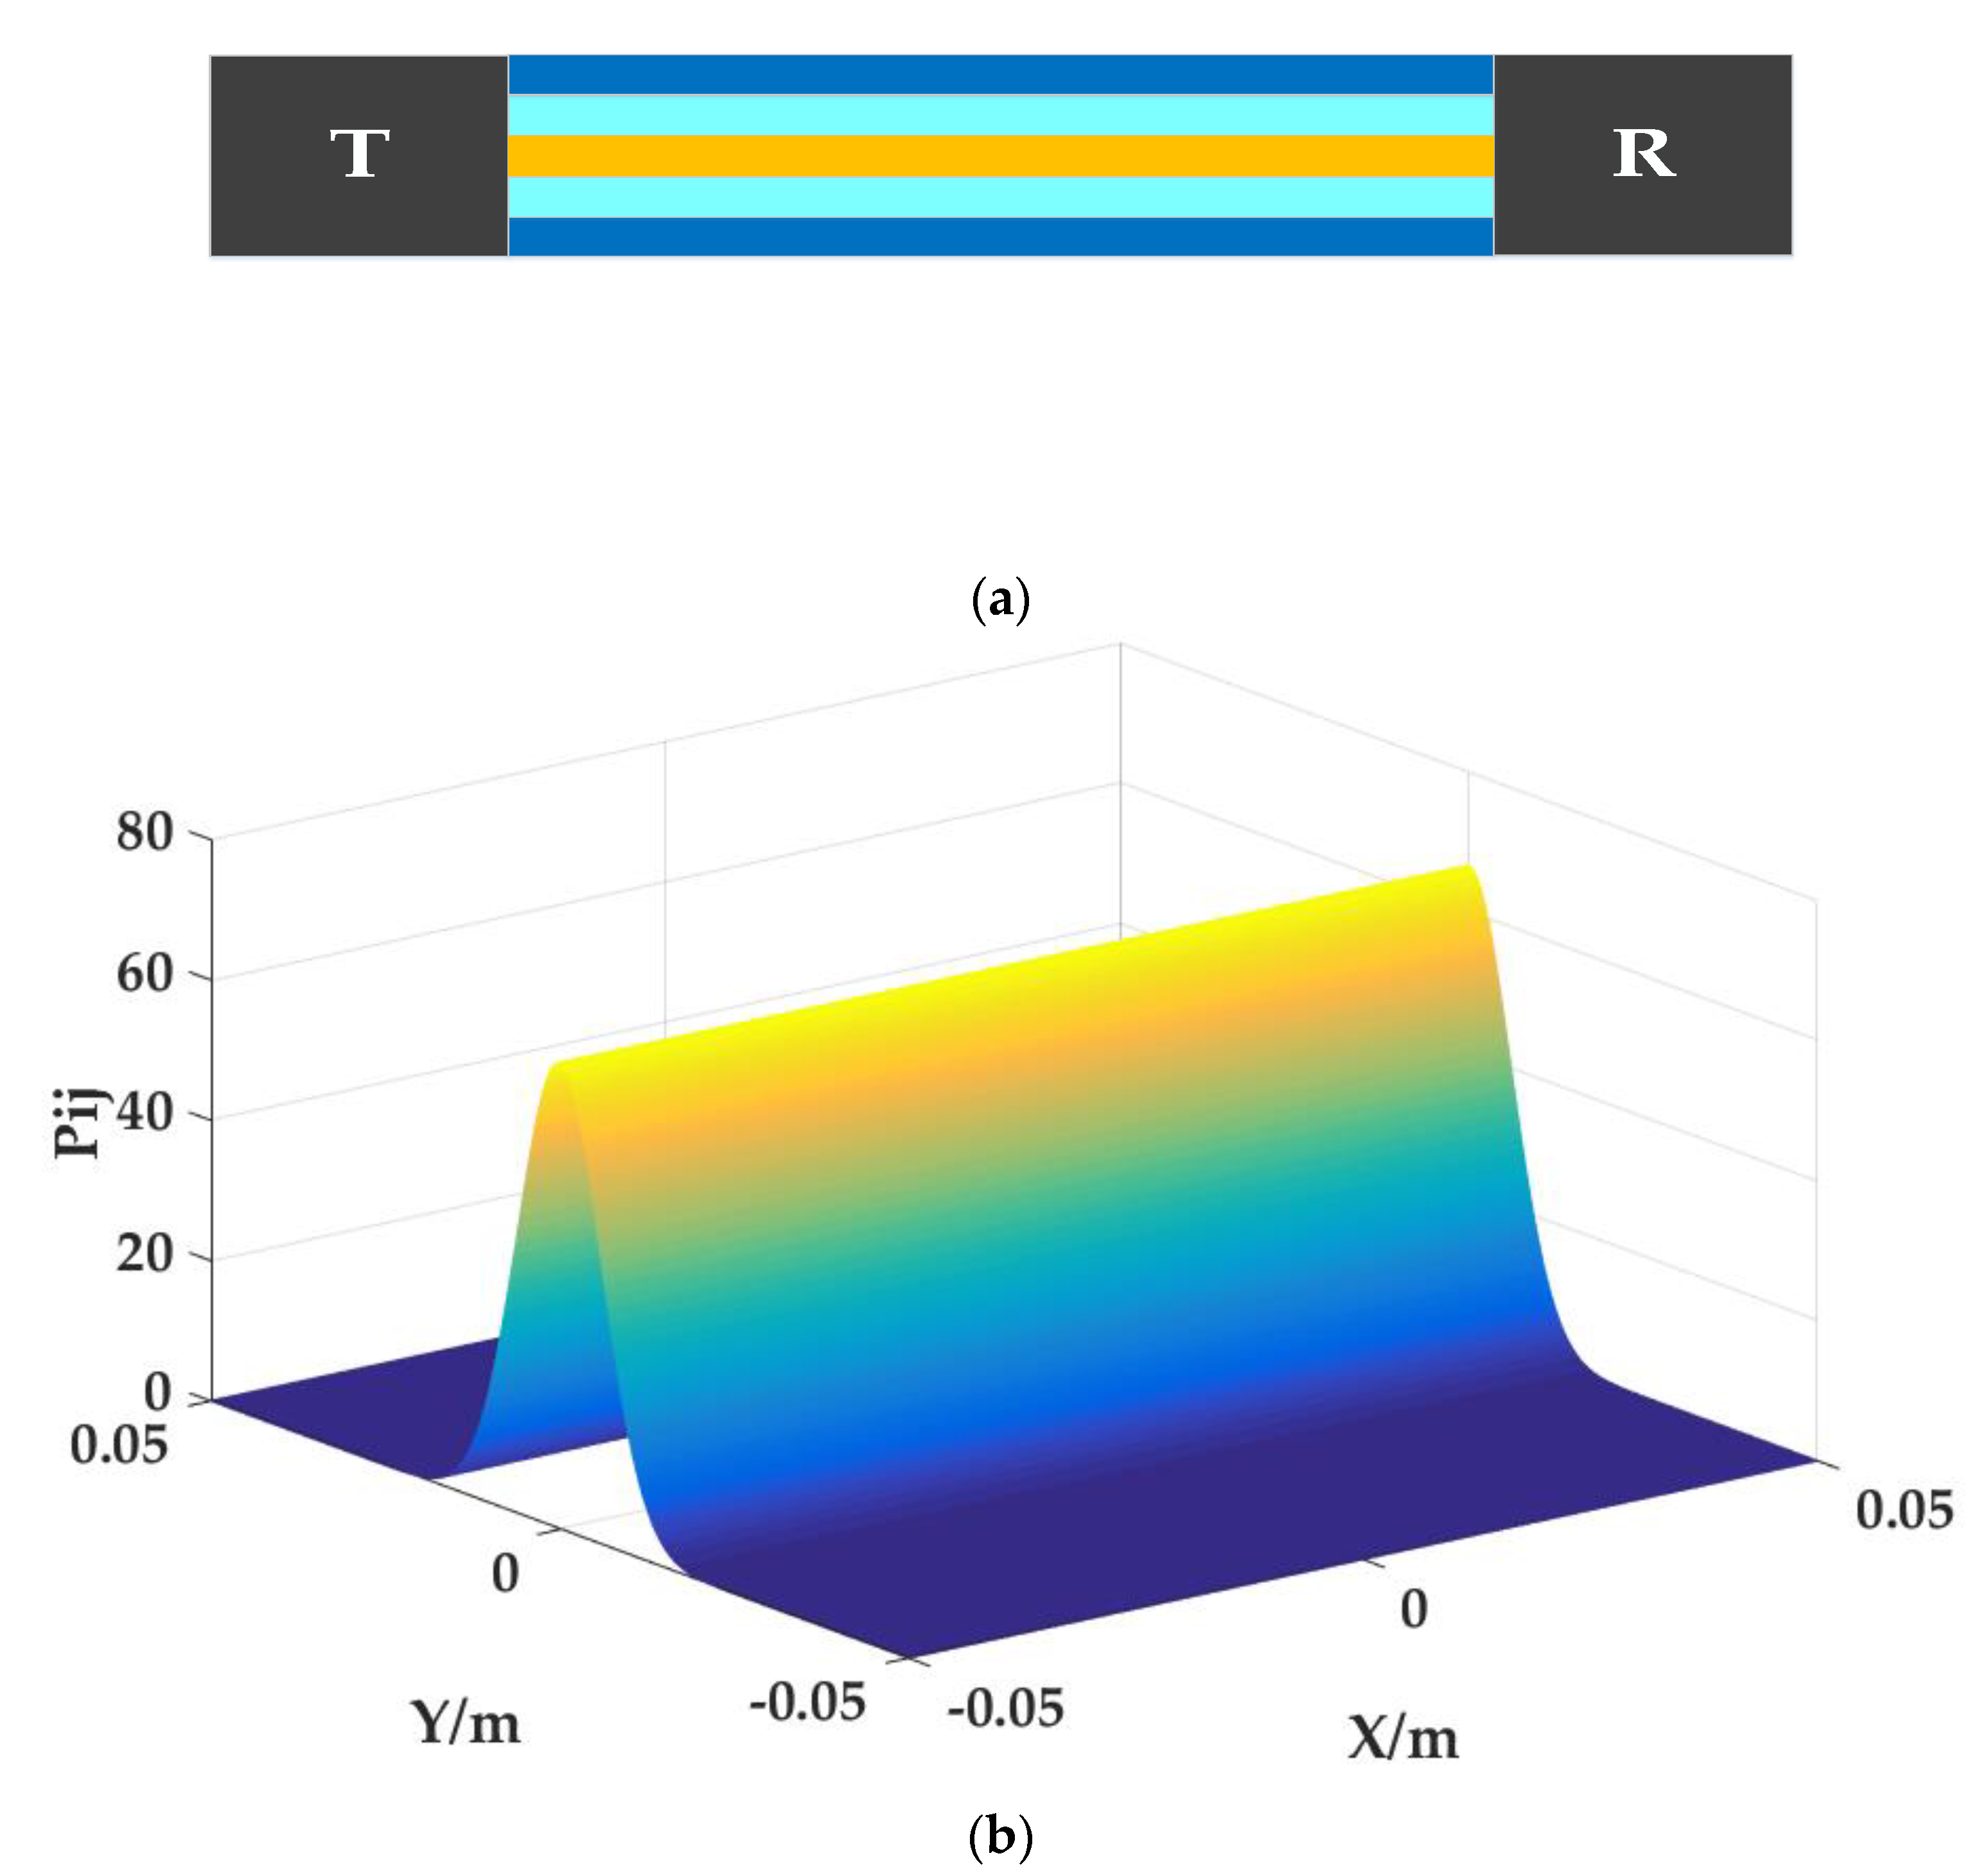
Figure 1. Probability distribution: (a) Probability scan path generated by the excitation and reception probe; (b) three-dimensional probability distribution.
Applsci 09 01874 g001
Figure 2. Dispersion curve in 2 mm aluminum plate: (a) Phase velocity dispersion curve; (b) group velocity dispersion curve.
Applsci 09 01874 g002
Figure 3. Single mode signal received in non-damaged sheet.
Applsci 09 01874 g003
Figure 4. Comparison of actual distance and theoretical distance.
Applsci 09 01874 g004
Figure 5. Research on the relative nonlinear coefficient: (a) The probe layout for looking for the law; (b) the distribution law of β.
Applsci 09 01874 g005aApplsci 09 01874 g005b
Figure 6. Scan path map.
Applsci 09 01874 g006
Figure 7. Schematic diagram of result evaluation.
Applsci 09 01874 g007
Figure 8. Simulation model: (a) Schematic diagram of ABAQUS simulation model; (b) ABAQUS simulation model.
Applsci 09 01874 g008
Figure 9. Positioning results when microcracks are in different positions in the scanning area: (a) microcrack in the lower right corner; (b) microcrack in the right side; (c) microcrack in the middle; (d) microcrack at the bottom.
Applsci 09 01874 g009aApplsci 09 01874 g009b
Figure 10. Evaluation chart.
Applsci 09 01874 g010
Figure 11. Positioning results when the excitation and reception probes are arranged differently: (a) Excitation1–4&Reception1–5; (b) Excitation1–3&Reception1–5; (c) Excitation1–5&Reception1–3; (d) Excitation1–5&Reception2–4.
Applsci 09 01874 g011aApplsci 09 01874 g011b
Figure 12. Evaluation chart.
Applsci 09 01874 g012
Figure 13. System block diagram of the experiment.
Applsci 09 01874 g013
Figure 14. Signal processing: (a) Original waveform; (b) waveform filtered by EMD.
Applsci 09 01874 g014
Figure 15. Physical map of crack.
Applsci 09 01874 g015
Figure 16. Positioning results in experiment: (a) Microcrack in the right side; (b) microcrack in the lower right corner; (c) microcrack in the middle; (d) no scanning center line through microcrack.
Applsci 09 01874 g016aApplsci 09 01874 g016b
Figure 17. Evaluation chart.
Applsci 09 01874 g017
Figure 18. β in the sheet material without microcrack: (a) The probe layout without crack; (b) distribution pattern of β.
Applsci 09 01874 g018
Table 1. Parameters used to evaluate the results of Figure 9.
FigureLd-maxArea-AArea-B
(m)%%
(a)0.0190.0600.160
(b)0.0150.0390.142
(c)0.0040.0150.059
(d)0.0500.0530.516
Table 2. Parameters used to evaluate the results of Figure 11.
FigureLd-maxArea-AArea-B
(m)%%
(a)0.0060.0150.048
(b)0.0080.0180.089
(c)0.0110.0190.061
(d)0.0070.0180.081
Table 3. Parameters used to evaluate the results of Figure 16.
FigureLd-maxArea-AArea-B
(m)%%
(a)0.0050.0040.038
(b)0.0090.0100.057
(c)0.0030.0020.018
(d)0.0430.0220.077