Figure 1.
Effects of intraperitoneal injections of different drugs on Complete Freund’s Adjuvant (CFA)-induced mechanical allodynia. (A) Effects of intraperitoneal injections of HU210 (0.1, 0.32 and 1 mg/kg) or vehicle (3% tween 20 in saline) on CFA-induced changes in % maximal possible effect (MPE). One-way ANOVA revealed the following results: Main effect of treatment (F(3,28) = 2.339; p = 0.0949), (B) Effects of intraperitoneal injections of WIN55212 (0.1, 0.32 and 1 mg/kg) or vehicle (3% tween 20 in saline) on CFA-induced changes in % MPE. One-way ANOVA revealed the following results: Main effect of treatment (F(3,28) = 1.554; p = 0.2227), (C) Effects of intraperitoneal injections of morphine (0.32, 1 and 3.2 mg/kg) or vehicle (3% tween 20 in saline) on CFA-induced changes in % MPE. One-way ANOVA revealed the following results: Significant main effect of treatment (F(3,28) = 11.75; p < 0.0001), (D) Effects of intraperitoneal injections of tramadol (1, 3.2 and 10 mg/kg) or vehicle (3% tween 80 in saline) on CFA-induced changes in % MPE. One-way ANOVA revealed the following results: Significant main effect of treatment (F(3,28) = 9.916; p < 0.0001). Data are expressed as mean ± SEM of % MPE. One-way ANOVA test was used to analyze data followed by Dunnett’s post-hoc test, * p < 0.05, n = 8 rats per group. % MPE = (PWT after drug application − PWT before drug application)/(PWT before manipulation [CFA] − PWT before drug application) × 100. PWT indicates paw withdrawal threshold in grams. Rectangular boxes indicate vehicle treatment.
![Brainsci 10 00523 g001]()
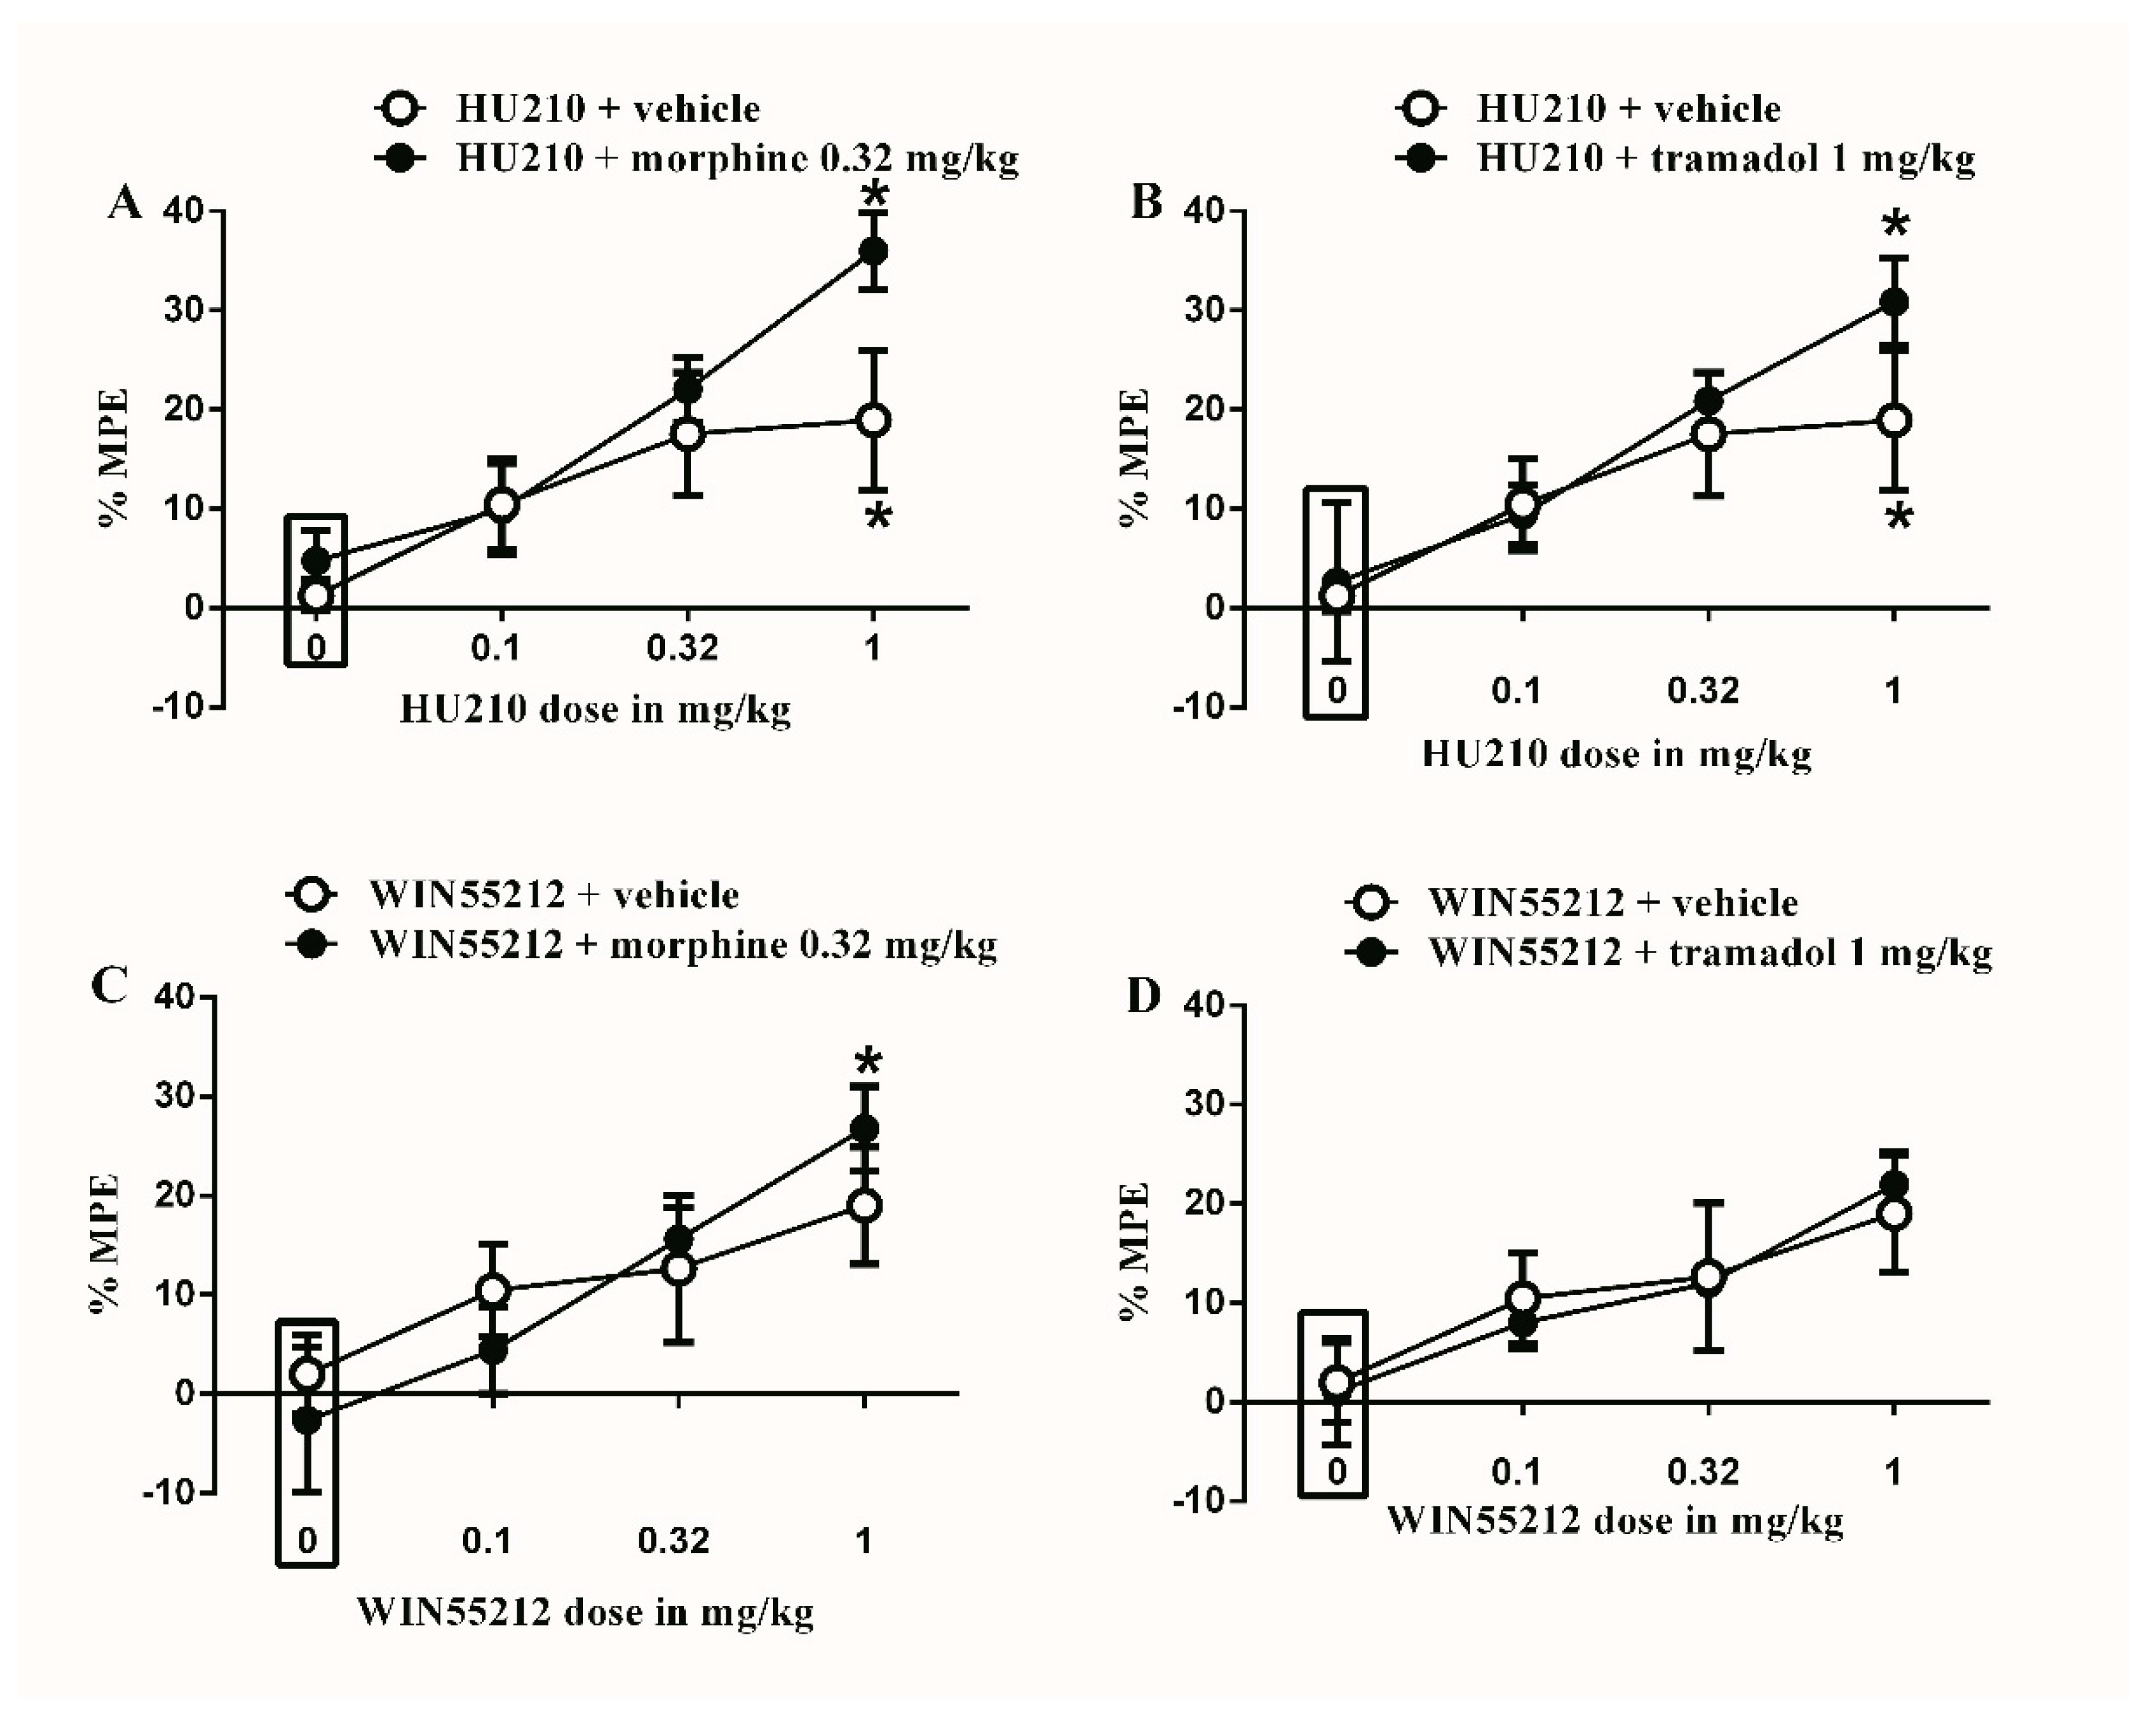
Figure 2.
Effects of intraperitoneal injections of different drug combinations on CFA-induced mechanical allodynia. (A) Effects of intraperitoneal injections of HU210 (0.1, 0.32 and 1 mg/kg) plus the subtherapeutic dose of morphine (0.32 mg/kg) on CFA-induced changes in % MPE. Two-way ANOVA revealed the following results: Significant main effect of drug dose (F(3,48) = 9.492; p < 0.0001), main effect of combination (F(1,48) = 3.104; p = 0.0845), and main combination X drug dose interaction (F(3,48) = 1.186; p = 0.325), (B) Effects of intraperitoneal injections of HU210 (0.1, 0.32 and 1 mg/kg) plus the subtherapeutic dose of tramadol (1 mg/kg) on CFA-induced changes in % MPE. Two-way ANOVA revealed the following results: Significant main effect of drug dose (F(3,48) = 7.434; p = 0.0003), main effect of combination (F(1,48) = 1.105; p = 0.2984), and main combination X drug dose interaction (F(3,48) = 0.06326; p = 0.5775), (C) Effects of intraperitoneal injections of WIN55212 (0.1, 0.32 and 1 mg/kg) plus the subtherapeutic dose of morphine (0.32 mg/kg) on CFA-induced changes in % MPE. Two-way ANOVA revealed the following results: Significant main effect of drug dose (F(3,48) = 6.288; p = 0.0011), main effect of combination (F(1,48) = 3.2; p = 0.9955), and main combination X drug dose interaction (F(3,48) = 0.06806; p = 0.5682), (D) Effects of intraperitoneal injections of WIN55212 (0.1, 0.32 and 1 mg/kg) plus the subtherapeutic dose of tramadol (1 mg/kg) on CFA-induced changes in % MPE. Two-way ANOVA revealed the following results: Significant main effect of drug dose (F(3,48) = 4.764; p = 0.0055), main effect of combination (F(1,48) = 0.006004; p = 0.9396), and main combination X drug dose interaction (F(3,48) = 0.1010; p = 0.9591). Two-way ANOVA test was used to analyze data followed by Holm–Sidak post-hoc test. * indicates a difference that is significant compared with day 0 within the same rat group. Data represent mean ± SEM of 8 rats. % MPE = (PWT after drug application − PWT before drug application)/(PWT before manipulation [CFA] − PWT before drug application) × 100. PWT indicates paw withdrawal threshold in grams. Rectangular boxes indicate vehicle treatment.
![Brainsci 10 00523 g002]()
Figure 3.
Effects of intraperitoneal injections of different drugs on STZ-induced mechanical allodynia. (A) Effects of intraperitoneal injections of HU210 (0.1, 0.32 and 1 mg/kg) or vehicle (3% tween 20 in saline) on STZ-induced changes in % MPE. One-way ANOVA revealed the following results: Significant main effect of treatment (F(3,28) = 5.474; p = 0.0043), (B) Effects of intraperitoneal injections of WIN55212 (0.1, 0.32 and 1 mg/kg) or vehicle (3% tween 20 in saline) on STZ-induced changes in % MPE. One-way ANOVA revealed the following results: Main effect of treatment (F(3,28) = 2.102; p = 0.1225). (C) Effects of intraperitoneal injections of morphine (0.32, 1 and 3.2 mg/kg) or vehicle (3% tween 20 in saline) on STZ-induced changes in % MPE. One-way ANOVA revealed the following results: Significant main effect of treatment (F(3,28) = 7.553; p = 0.0007), (D) Effects of intraperitoneal injections of tramadol (1, 3.2 and 10 mg/kg) or vehicle (3% tween 20 in saline) on STZ-induced changes in % MPE. One-way ANOVA revealed the following results: Significant main effect of treatment (F(3,28) = 18.59; p < 0.0001). Data are expressed as mean ± SEM of % MPE. One-way ANOVA test was used to analyze data followed by Dunnett’s post-hoc test, * p < 0.05, n = 8 rats per group. % MPE = (PWT after drug application − PWT before drug application)/(PWT before manipulation [STZ] − PWT before drug application) × 100. PWT indicates paw withdrawal threshold in grams. Rectangular boxes indicate vehicle treatment.
![Brainsci 10 00523 g003]()
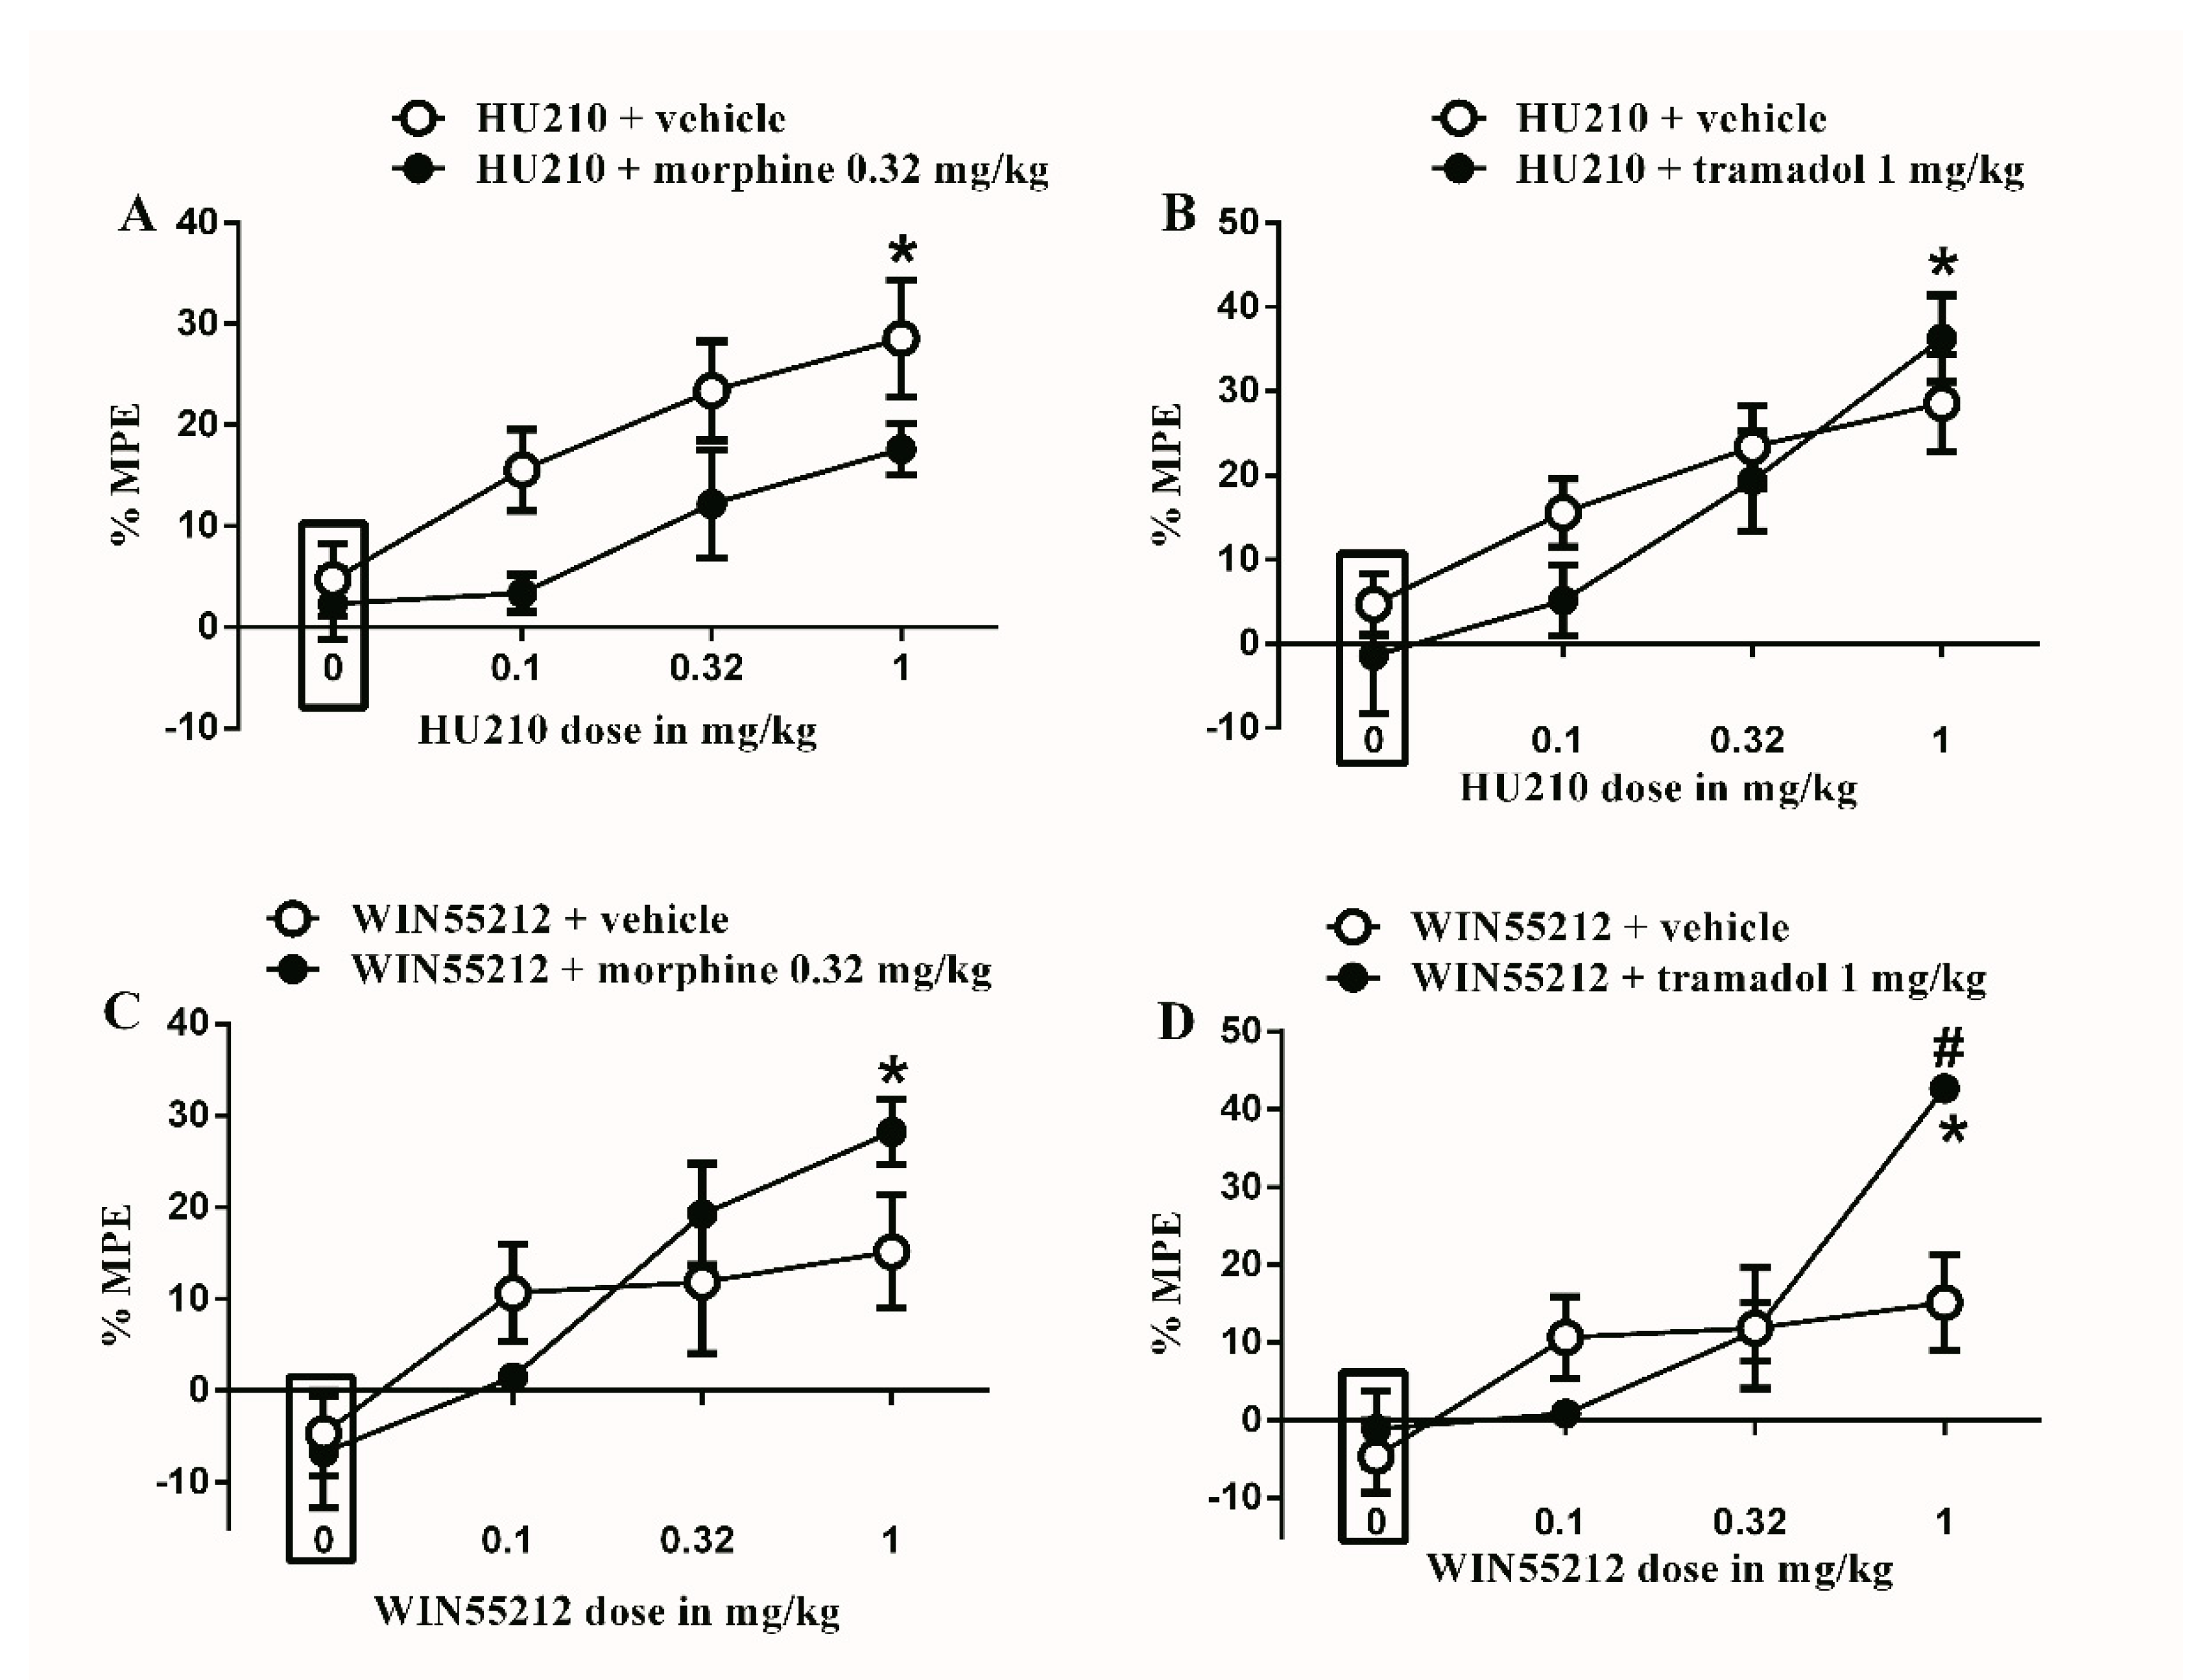
Figure 4.
Effects of intraperitoneal injections of different drug combinations on STZ-induced mechanical allodynia. (A) Effects of intraperitoneal injections of HU210 (0.1, 0.32 and 1 mg/kg) plus the subtherapeutic dose of morphine (0.32 mg/kg) on STZ-induced changes in % MPE. Two-way ANOVA revealed the following results: Significant main effect of drug dose (F(3,48) = 7.855; p = 0.0002), Significant main effect of combination (F(1,48) = 8.748; p = 0.0048), and main combination X drug dose interaction (F(3,48) = 0.5447; p = 0.6541), (B) Effects of intraperitoneal injections of HU210 (0.1, 0.32 and 1 mg/kg) plus the subtherapeutic dose of tramadol (1 mg/kg) on STZ-induced changes in % MPE. Two-way ANOVA revealed the following results: Significant main effect of drug dose (F(3,48) = 13.61; p < 0.0001), main effect of combination (F(1,48) = 0.7796; p = 0.3817), and main combination X drug dose interaction (F(3,48) = 1.141; p = 0.3419), (C) Effects of intraperitoneal injections of WIN55212 (0.1, 0.32 and 1 mg/kg) plus the subtherapeutic dose of morphine (0.32 mg/kg) on STZ-induced changes in % MPE. Two-way ANOVA revealed the following results: Significant main effect of drug dose (F(3,48) = 8.758; p < 0.0001), main effect of combination (F(1,48) = 0.326; p = 0.5707), and main combination X drug dose interaction (F(3,48) = 1.493; p = 0.2284), (D) Effects of intraperitoneal injections of WIN55212 (0.1, 0.32 and 1 mg/kg) plus the subtherapeutic dose of tramadol (1 mg/kg) on STZ-induced changes in % MPE. Two-way ANOVA revealed the following results: Significant main effect of drug dose (F(3,48) = 12.55; p < 0.0001), main effect of combination (F(1,48) = 1.875; p = 0.1773), and Significant main combination X drug dose interaction (F(3,48) = 4.348; p = 0.0083). Two-way ANOVA test was used to analyze data followed by Holm–Sidak post-hoc test. # indicates a difference that is significant between the different rat groups. * indicates a difference that is significant compared with day 0 within the same rat group. Data represent mean ± SEM of 8 rats. % MPE = (PWT after drug application − PWT before drug application)/(PWT before manipulation [STZ] − PWT before drug application) × 100. PWT indicates paw withdrawal threshold in grams. Rectangular boxes indicate vehicle treatment.
![Brainsci 10 00523 g004]()
Figure 5.
Effects of intraperitoneal injections of cannabinoids on locomotion. (A) Effects of intraperitoneal injections of HU210 (0.1, 0.32 and 1 mg/kg) or vehicle (3% tween 20 in saline) on % X total counts. One-way ANOVA revealed the following results: Significant main effect of treatment (F(3,20) = 20.62; p < 0.0001), (B) Effects of intraperitoneal injections of HU210 (0.1, 0.32 and 1 mg/kg) or vehicle (3% tween 20 in saline) on % Z total counts, One-way ANOVA revealed the following results: Significant main effect of treatment (F(3,20) = 6.758; p = 0.0025), (C) Effects of intraperitoneal injections of WIN55212 (0.1, 0.32 and 1 mg/kg) or vehicle (3% tween 20 in saline) on % X total counts. One-way ANOVA revealed the following results: Significant main effect of treatment (F(3,20) = 31.83; p < 0.0001), (D) Effects of intraperitoneal injections of WIN55212 (0.1, 0.32 and 1 mg/kg) or vehicle (3% tween 20 in saline) on % Z total counts. One-way ANOVA revealed the following results: Significant main effect of treatment (F(3,20) = 6.881; p = 0.0023), Data are expressed as mean ± SEM of % X and % Z total counts. One-way ANOVA test was used to analyze data followed by Dunnett’s post-hoc test, * p < 0.05, n = 8 rats per group. % X total counts = (X total counts after drug application/baseline X total counts) × 100. % Z total counts = (Z total counts after drug application/baseline Z total counts) × 100. Rectangular boxes indicate vehicle treatment.
![Brainsci 10 00523 g005]()
Figure 6.
Effects of intraperitoneal injections of opioids on locomotion. (A) Effects of intraperitoneal injections of morphine (0.32, 1, and 3.2 mg/kg) or vehicle (3% tween 20 in saline) on % X total counts. One-way ANOVA revealed the following results: Significant main effect of treatment (F(3,20) = 4.406; p = 0.0156), (B) Effects of intraperitoneal injections of morphine (0.32, 1, and 3.2 mg/kg) or vehicle (3% tween 20 in saline) on % Z total counts. One-way ANOVA revealed the following results: Significant main effect of treatment (F(3,20) = 2.583; p = 0.0819), (C) Effects of intraperitoneal injections of tramadol (1, 3 and 10 mg/kg) or vehicle (3% tween 20 in saline) on % X total counts. One-way ANOVA revealed the following results: Significant main effect of treatment (F(3,20) = 7.232; p = 0.0018), (D) Effects of intraperitoneal injections of tramadol (1, 3 and 10 mg/kg) or vehicle (3% tween 20 in saline) on % Z total counts. One-way ANOVA revealed the following results: Significant main effect of treatment (F(3,20) = 4.972; p = 0.0097). Data are expressed as mean ± SEM of % X and % Z total counts. One-way ANOVA test was used to analyze data followed by Dunnett’s post-hoc test, * p < 0.05, n = 8 rats per group. % X total counts = (X total counts after drug application/baseline X total counts) × 100. % Z total counts = (Z total counts after drug application/baseline Z total counts) × 100. Rectangular boxes indicate vehicle treatment.
![Brainsci 10 00523 g006]()
Figure 7.
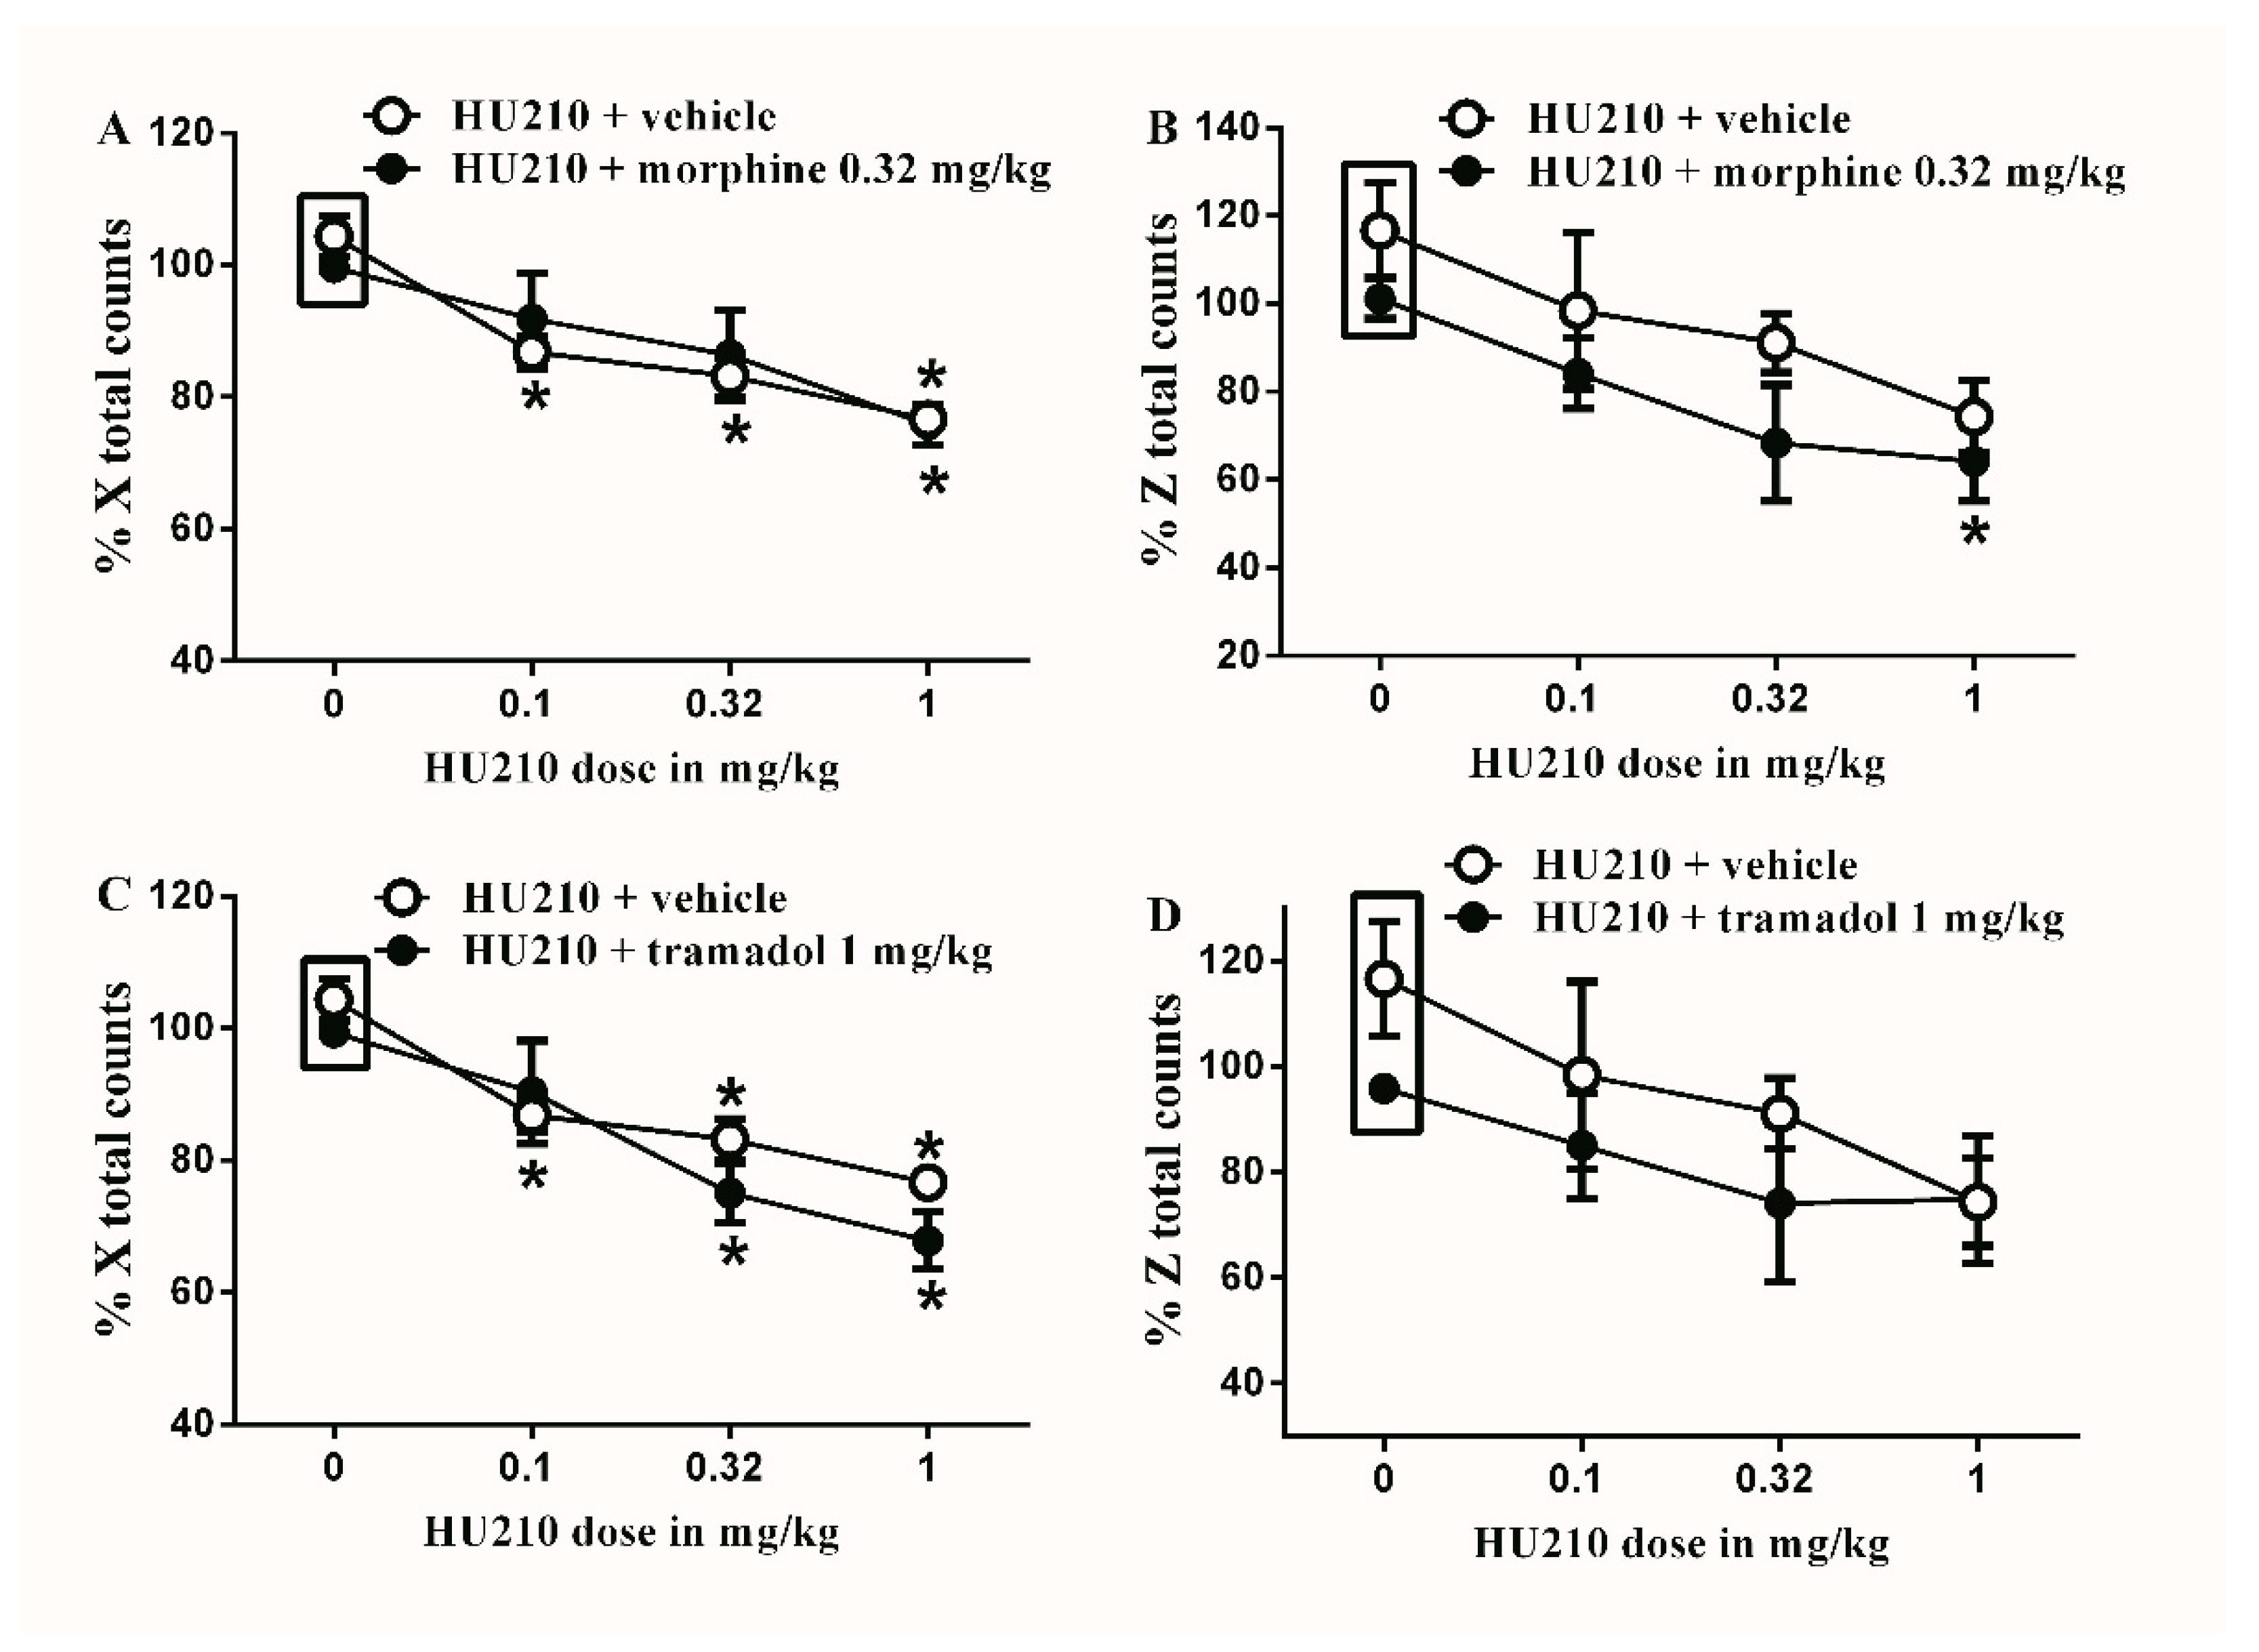
Effects of intraperitoneal injections of HU210 combined with morphine or tramadol on locomotion. (A) Effects of intraperitoneal injections of HU210 (0.1, 0.32 and 1 mg/kg) plus the subtherapeutic dose of morphine (0.32 mg/kg) on % X total counts. Two-way ANOVA revealed the following results: Significant main effect of drug dose (F(3,40) = 13.89; p < 0.0001), main effect of combination (F(1,40) = 0.05348; p = 0.08183), and main combination X drug dose interaction (F(3,40) = 0.5588; p = 0.6553), (B) Effects of intraperitoneal injections of HU210 (0.1, 0.32 and 1 mg/kg) plus the subtherapeutic dose of morphine (0.32 mg/kg) on % Z total counts. Two-way ANOVA revealed the following results: Significant main effect of drug dose (F(3,40) = 5.749; p = 0.0032), main effect of combination (F(1,40) = 4.788; p = 0.0347), and main combination X drug dose interaction (F(3,40) = 0.1388; p = 0.9362) (C) Effects of intraperitoneal injections of HU210 (0.1, 0.32 and 1 mg/kg) plus the subtherapeutic dose of tramadol (1 mg/kg) on % X total counts. Two-way ANOVA revealed the following results: Significant main effect of drug dose (F(3,40) = 20.48; p < 0.0001), main effect of combination (F(1,40) = 2.666; p = 0.1104), and main combination X drug dose interaction (F(3,40) = 1.001; p = 0.4023) (D) Effects of intraperitoneal injections of HU210 (0.1, 0.32 and 1 mg/kg) plus the subtherapeutic dose of tramadol (1 mg/kg) on % Z total counts. Two-way ANOVA revealed the following results: Significant main effect of drug dose (F(3,40) = 3.134; p = 0.0363), main effect of combination (F(1,40) = 2.674; p = 0.1101), and main combination X drug dose interaction (F(3,40) = 0.3628; p = 0.7764). Two-way ANOVA test was used to analyze data followed by Holm–Sidak post-hoc test. * indicates a difference that is significant compared with day 0 within the same rat group. Data represent mean ± SEM of 8 rats. % X total counts = (X total counts after drug application/baseline X total counts) × 100. % Z total counts = (Z total counts after drug application/baseline Z total counts) × 100. Rectangular boxes indicate vehicle treatment.
Figure 7.
Effects of intraperitoneal injections of HU210 combined with morphine or tramadol on locomotion. (A) Effects of intraperitoneal injections of HU210 (0.1, 0.32 and 1 mg/kg) plus the subtherapeutic dose of morphine (0.32 mg/kg) on % X total counts. Two-way ANOVA revealed the following results: Significant main effect of drug dose (F(3,40) = 13.89; p < 0.0001), main effect of combination (F(1,40) = 0.05348; p = 0.08183), and main combination X drug dose interaction (F(3,40) = 0.5588; p = 0.6553), (B) Effects of intraperitoneal injections of HU210 (0.1, 0.32 and 1 mg/kg) plus the subtherapeutic dose of morphine (0.32 mg/kg) on % Z total counts. Two-way ANOVA revealed the following results: Significant main effect of drug dose (F(3,40) = 5.749; p = 0.0032), main effect of combination (F(1,40) = 4.788; p = 0.0347), and main combination X drug dose interaction (F(3,40) = 0.1388; p = 0.9362) (C) Effects of intraperitoneal injections of HU210 (0.1, 0.32 and 1 mg/kg) plus the subtherapeutic dose of tramadol (1 mg/kg) on % X total counts. Two-way ANOVA revealed the following results: Significant main effect of drug dose (F(3,40) = 20.48; p < 0.0001), main effect of combination (F(1,40) = 2.666; p = 0.1104), and main combination X drug dose interaction (F(3,40) = 1.001; p = 0.4023) (D) Effects of intraperitoneal injections of HU210 (0.1, 0.32 and 1 mg/kg) plus the subtherapeutic dose of tramadol (1 mg/kg) on % Z total counts. Two-way ANOVA revealed the following results: Significant main effect of drug dose (F(3,40) = 3.134; p = 0.0363), main effect of combination (F(1,40) = 2.674; p = 0.1101), and main combination X drug dose interaction (F(3,40) = 0.3628; p = 0.7764). Two-way ANOVA test was used to analyze data followed by Holm–Sidak post-hoc test. * indicates a difference that is significant compared with day 0 within the same rat group. Data represent mean ± SEM of 8 rats. % X total counts = (X total counts after drug application/baseline X total counts) × 100. % Z total counts = (Z total counts after drug application/baseline Z total counts) × 100. Rectangular boxes indicate vehicle treatment.
![Brainsci 10 00523 g007]()
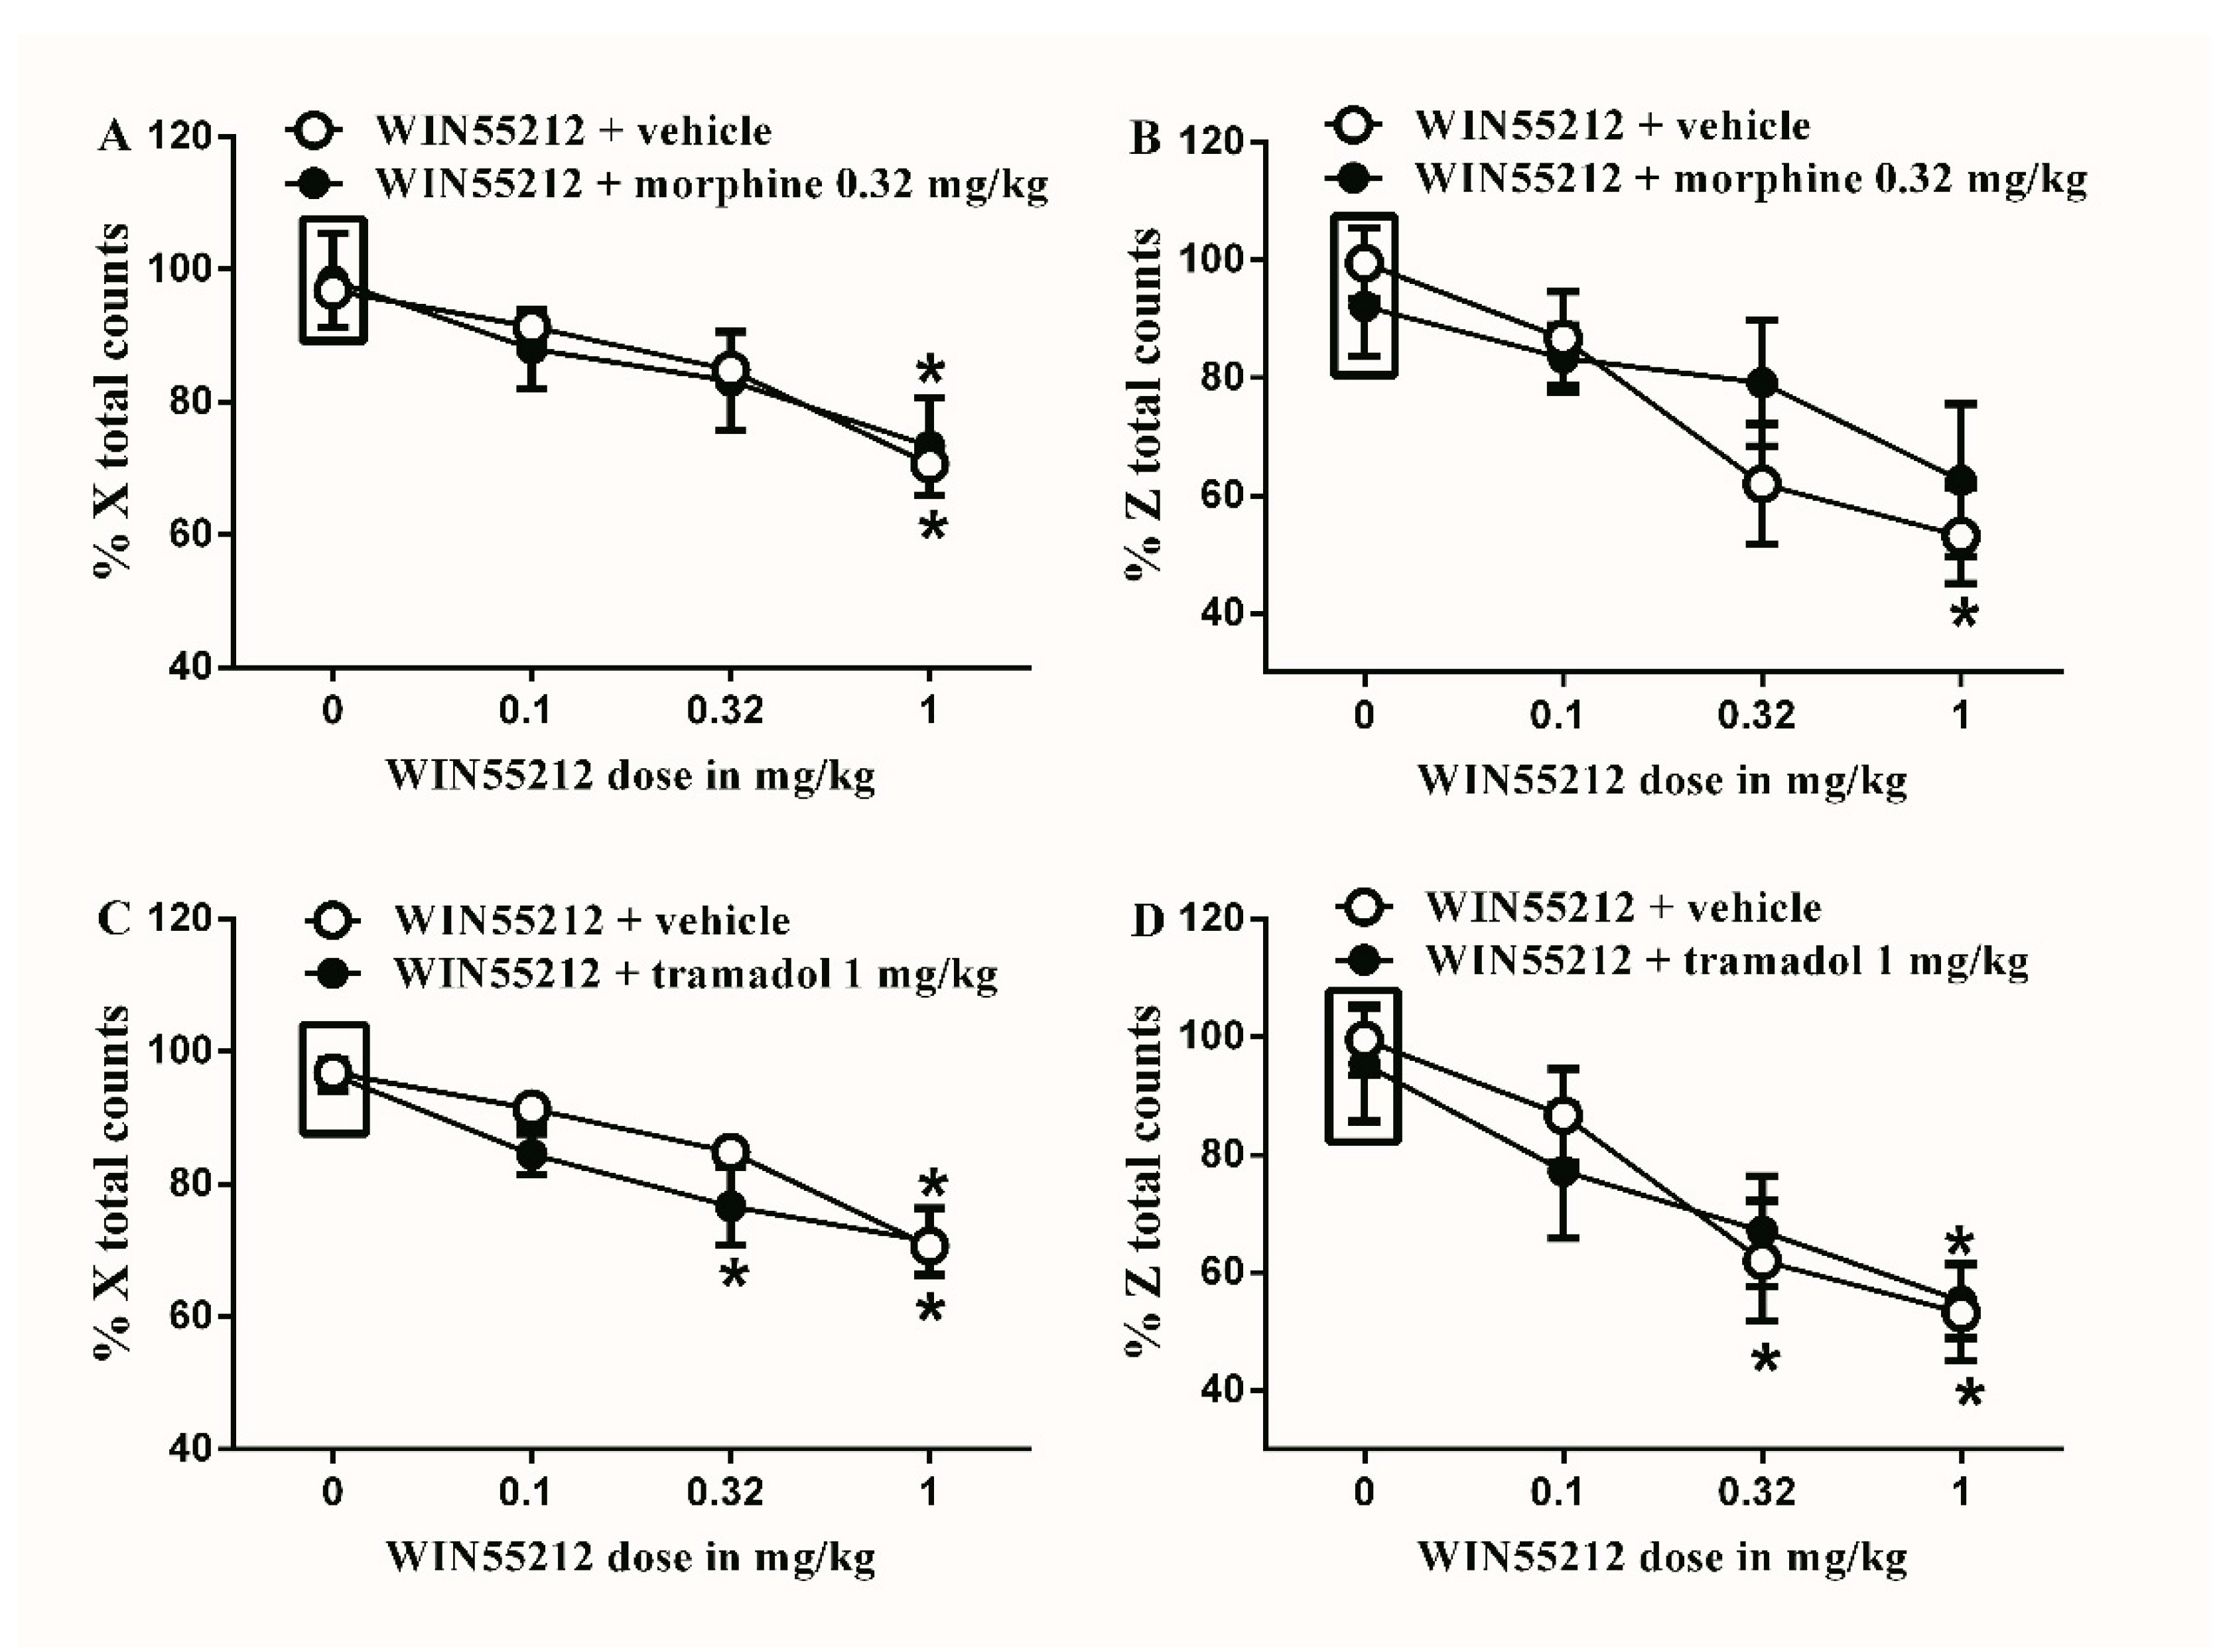
Figure 8.
Effects of intraperitoneal injections of WIN55212 combined with morphine or tramadol on locomotion. (A) Effects of intraperitoneal injections of WIN55212 (0.1, 0.32 and 1 mg/kg) plus the subtherapeutic dose of morphine (0.32 mg/kg) on % X total counts. Two-way ANOVA revealed the following results: Significant main effect of drug dose (F(3,40) = 8.789; p = 0.0001), main effect of combination (F(1,40) = 0.0032; p = 0.9545), and main combination X drug dose interaction (F(3,40) = 0.1459; p = 0.9317), (B) Effects of intraperitoneal injections of WIN55212 (0.1, 0.32 and 1 mg/kg) plus the subtherapeutic dose of morphine (0.32 mg/kg) on % Z total counts. Two-way ANOVA revealed the following results: Significant main effect of drug dose (F(3,40) = 6.867; p = 0.0008), main effect of combination (F(1,40) = 0.4038; p = 0.5288), and main combination X drug dose interaction (F(3,40) = 0.8312; p = 0.4848), (C) Effects of intraperitoneal injections of WIN55212 (0.1, 0.32 and 1 mg/kg) plus the subtherapeutic dose of tramadol (1 mg/kg) on % X total counts. Two-way ANOVA revealed the following results: Significant main effect of drug dose (F(3,40) = 20.86; p < 0.0001), main effect of combination (F(1,40) = 2.367; p = 0.1318), and main combination X drug dose interaction (F(3,40) = 0.8829; p = 0.4582), (D) Effects of intraperitoneal injections of WIN55212 (0.1, 0.32 and 1 mg/kg) plus the subtherapeutic dose of tramadol (1 mg/kg) on % Z total counts. Two-way ANOVA revealed the following results: Significant main effect of drug dose (F(3,40) = 9.842; p < 0.0001), main effect of combination (F(1,40) = 0.07276; p = 0.7888), and main combination X drug dose interaction (F(3,40) = 0.2696; p = 0.8469). Two-way ANOVA test was used to analyze data followed by Holm–Sidak post-hoc test. * indicates a difference that is significant compared with day 0 within the same rat group. Data represent mean ± SEM of 8 rats. % X total counts = (X total counts after drug application/baseline X total counts) × 100. % Z total counts = (Z total counts after drug application/baseline Z total counts) × 100. Rectangular boxes indicate vehicle treatment.
![Brainsci 10 00523 g008]()
Table 1.
Latin square design showing the injection of each tested drug in days 3–9 post-CFA injection. HU210 (dose 1 = 0.1 mg/kg, dose 2 = 0.32 mg/kg and dose 3 = 1 mg/kg). WIN55212 (dose 1 = 0.1 mg/kg, dose 2 = 0.32 mg/kg and dose 3 = 1 mg/kg). Morphine (dose 1 = 0.32 mg/kg, dose 2 = 1 mg/kg and dose 3 = 3.2 mg/kg). Tramadol (dose 1 = 1 mg/kg, dose 2 = 32 mg/kg and dose 3 = 10 mg/kg).
| | Days Post-CFA Injection |
|---|
| Day 3 | Day 5 | Day 7 | Day 9 |
|---|
| Rats 1 and 2 | Vehicle | Dose 1 | Dose 2 | Dose 3 |
| Rats 3 and 4 | Dose 3 | Vehicle | Dose 1 | Dose 2 |
| Rats 5 and 6 | Dose 2 | Dose 3 | Vehicle | Dose 1 |
| Rats 7 and 8 | Dose 1 | Dose 2 | Dose 3 | Vehicle |
Table 2.
Latin square design showing the injection of each tested drug in days 1–7 in week 4 post-streptozotocin (STZ) injection. HU210 (dose 1 = 0.1 mg/kg, dose 2 = 0.32 mg/kg and dose 3 = 1 mg/kg). WIN55212 (dose 1 = 0.1 mg/kg, dose 2 = 0.32 mg/kg and dose 3 = 1 mg/kg). Morphine (dose 1 = 0.32 mg/kg, dose 2 = 1 mg/kg and dose 3 = 3.2 mg/kg). Tramadol (dose 1 = 1 mg/kg, dose 2 = 32 mg/kg and dose 3 = 10 mg/kg).
| | Days in Week 4 Post-STZ Injection |
|---|
| Day 1 | Day 3 | Day 5 | Day 7 |
|---|
| Rats 1 and 2 | Vehicle | Dose 1 | Dose 2 | Dose 3 |
| Rats 3 and 4 | Dose 3 | Vehicle | Dose 1 | Dose 2 |
| Rats 5 and 6 | Dose 2 | Dose 3 | Vehicle | Dose 1 |
| Rats 7 and 8 | Dose 1 | Dose 2 | Dose 3 | Vehicle |

 ,
, 


