
Brain Responses to High-Calorie Visual Food Cues in Individuals with Normal-Weight or Obesity: An Activation Likelihood Estimation Meta-Analysis


Abstract
:1. Introduction
2. Methods
2.1. Study Selection and Inclusion Criteria
2.2. Activation Likelihood Estimation Analysis
2.3. Modulation Effect of Sex
2.4. Conjunction and Contrast Analyses
2.5. Results Visualization
2.6. Study Quality Assessment
3. Results
3.1. Included Studies and Sample Characteristics
3.2. Overall Meta-Analysis
3.3. Brain Response to High-Calorie Visual Food Cues in People with Normal-Weight
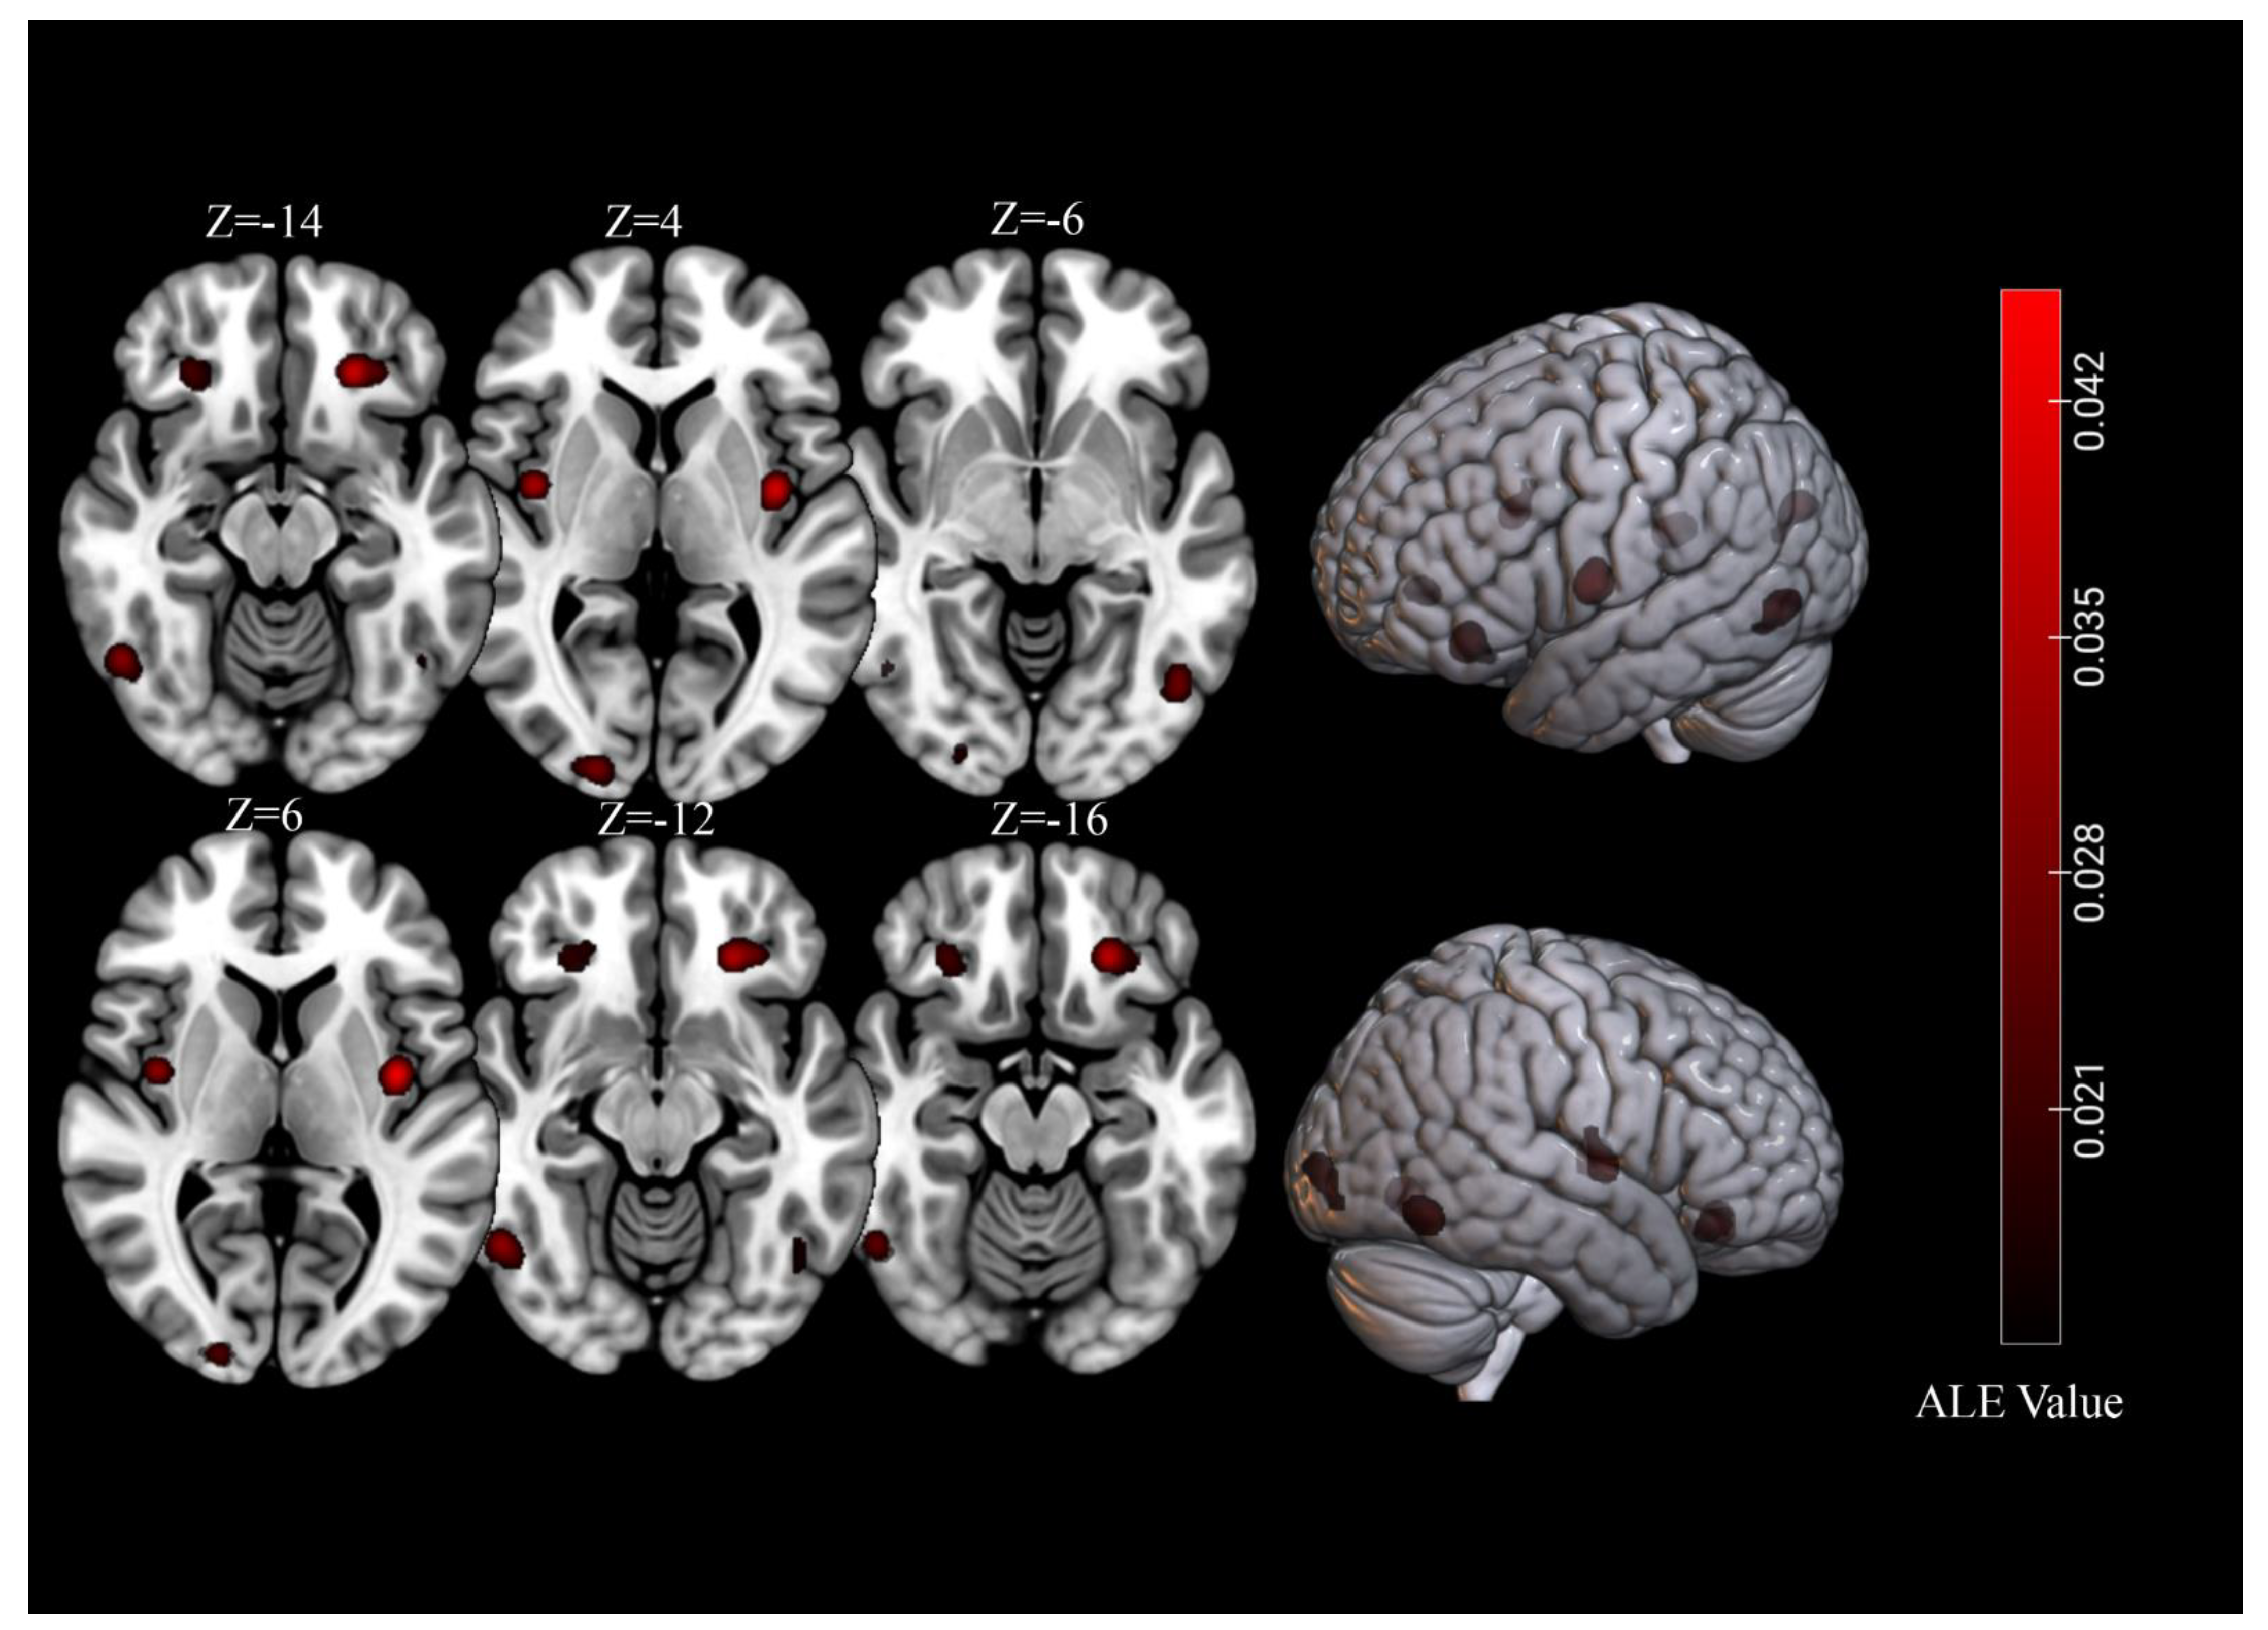
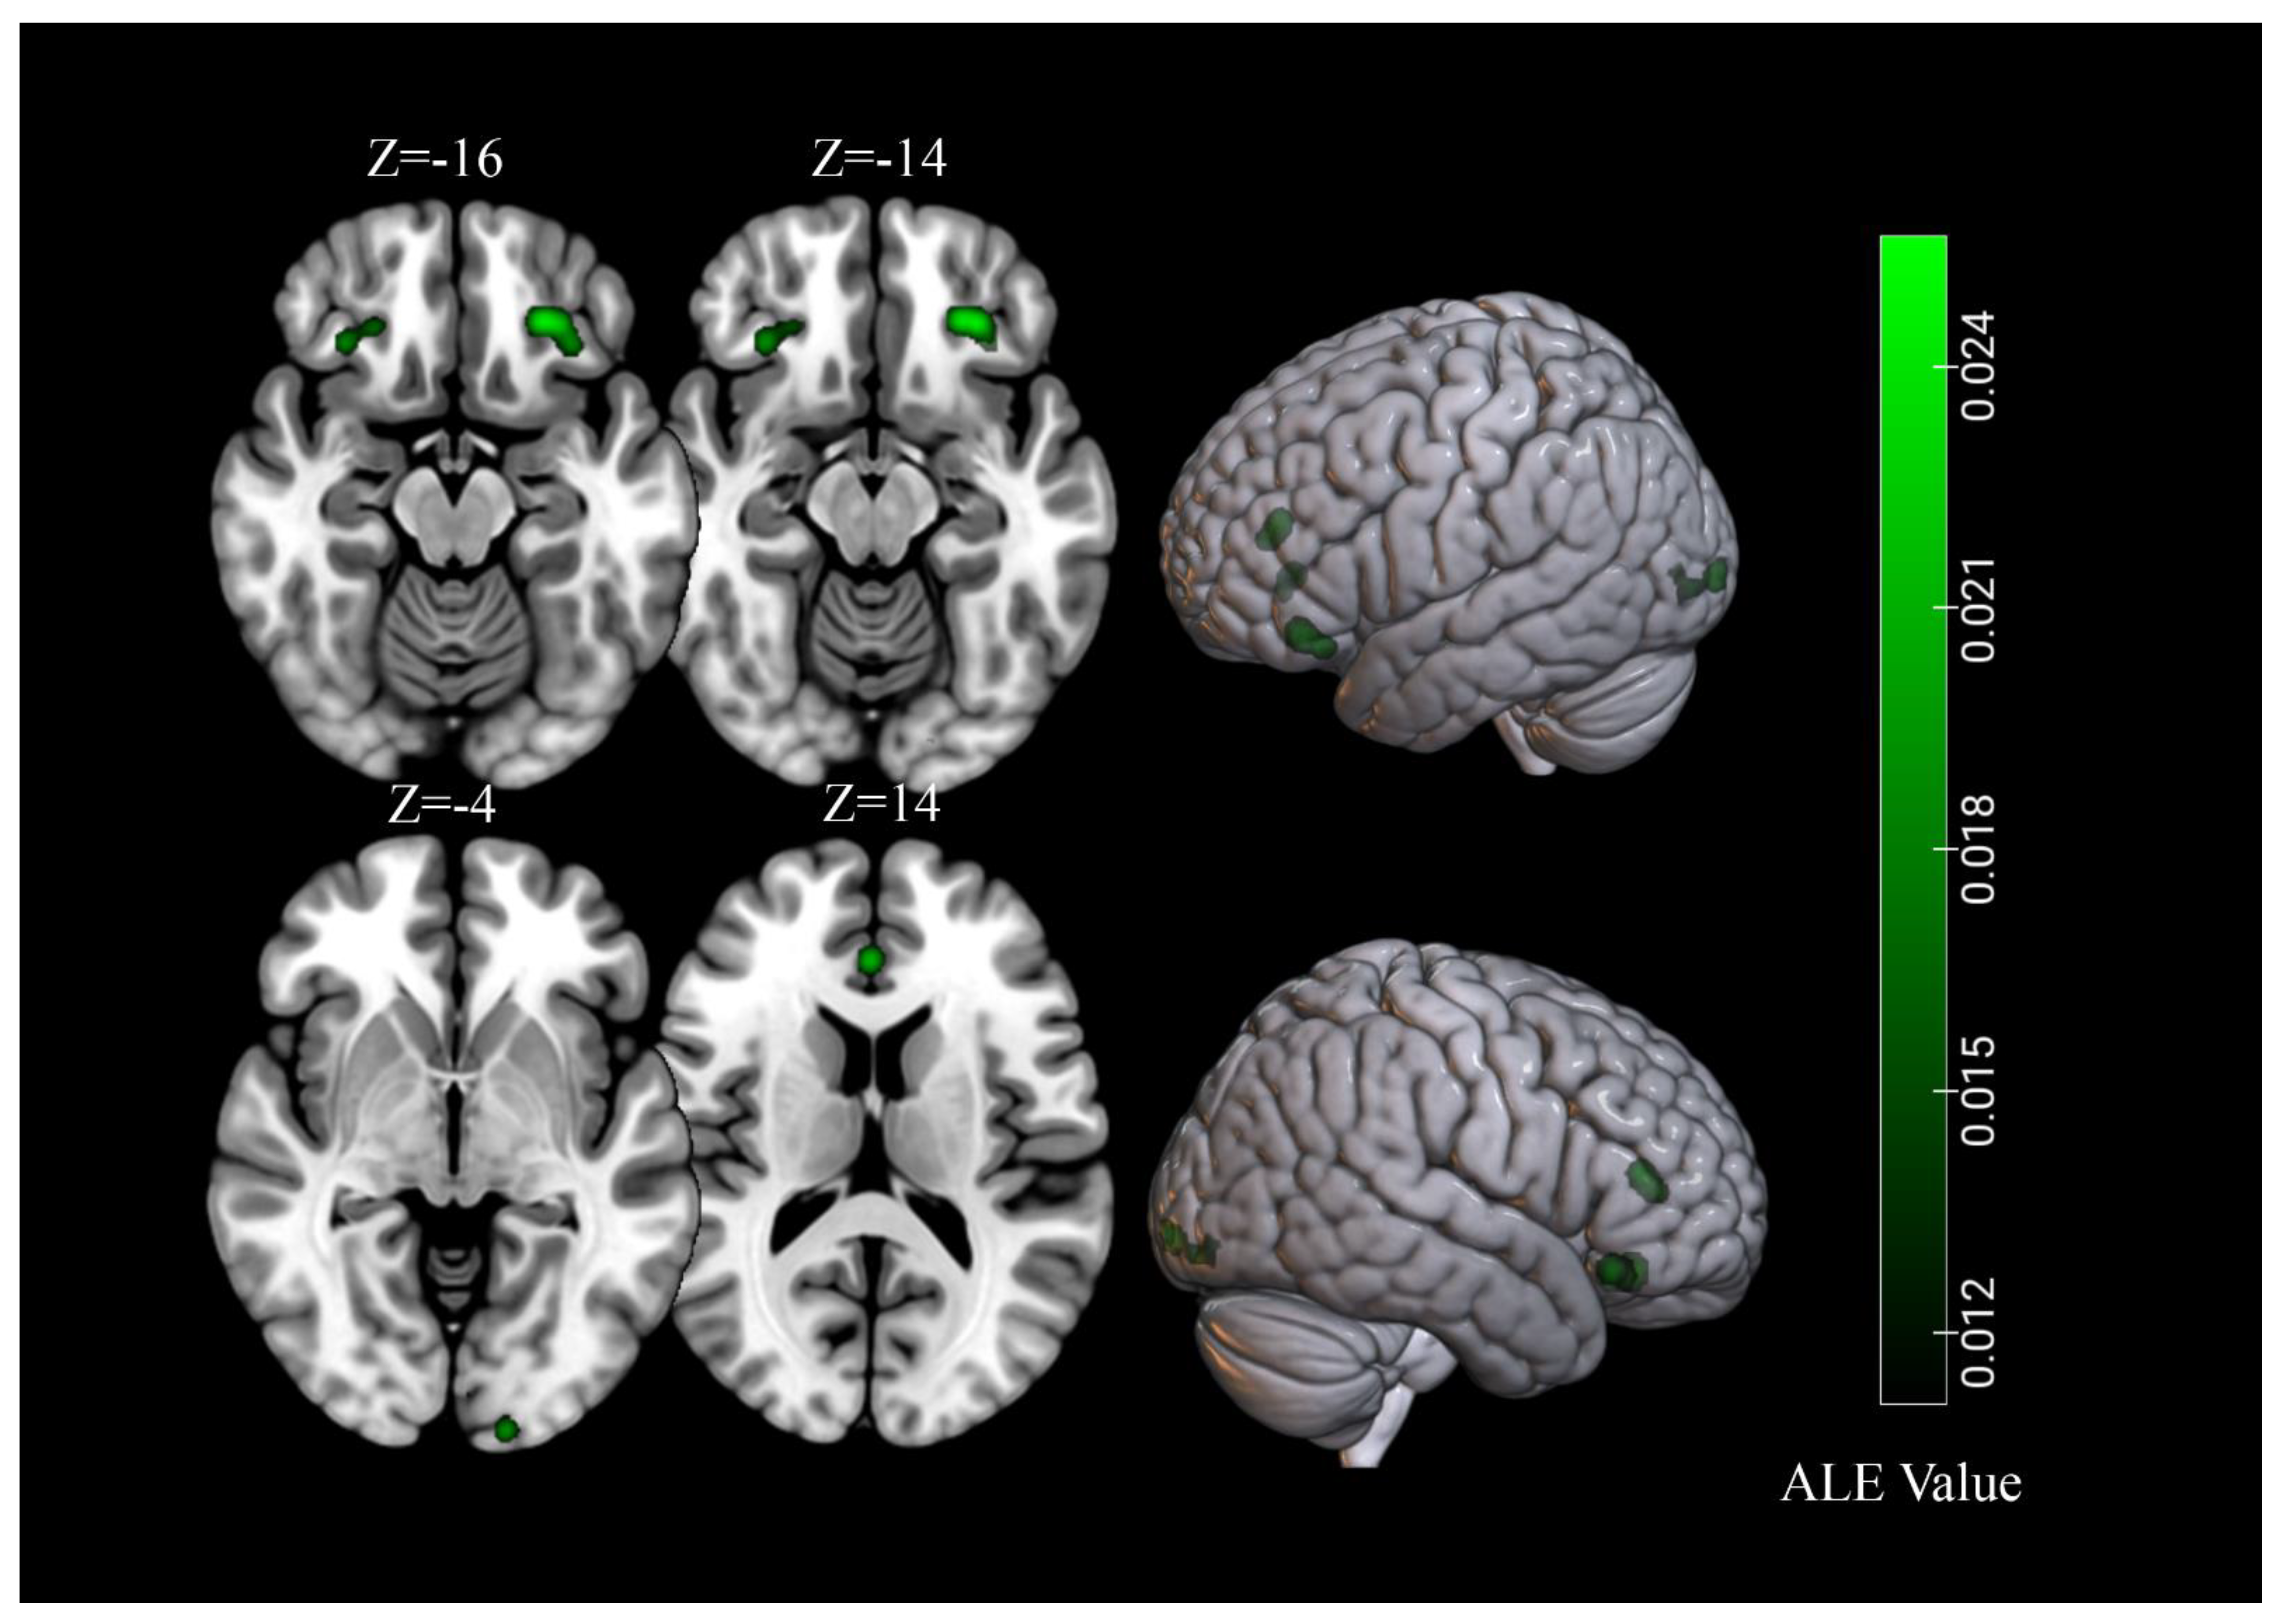
3.4. Brain Response to High-Calorie Visual Food Cues in People with Obesity
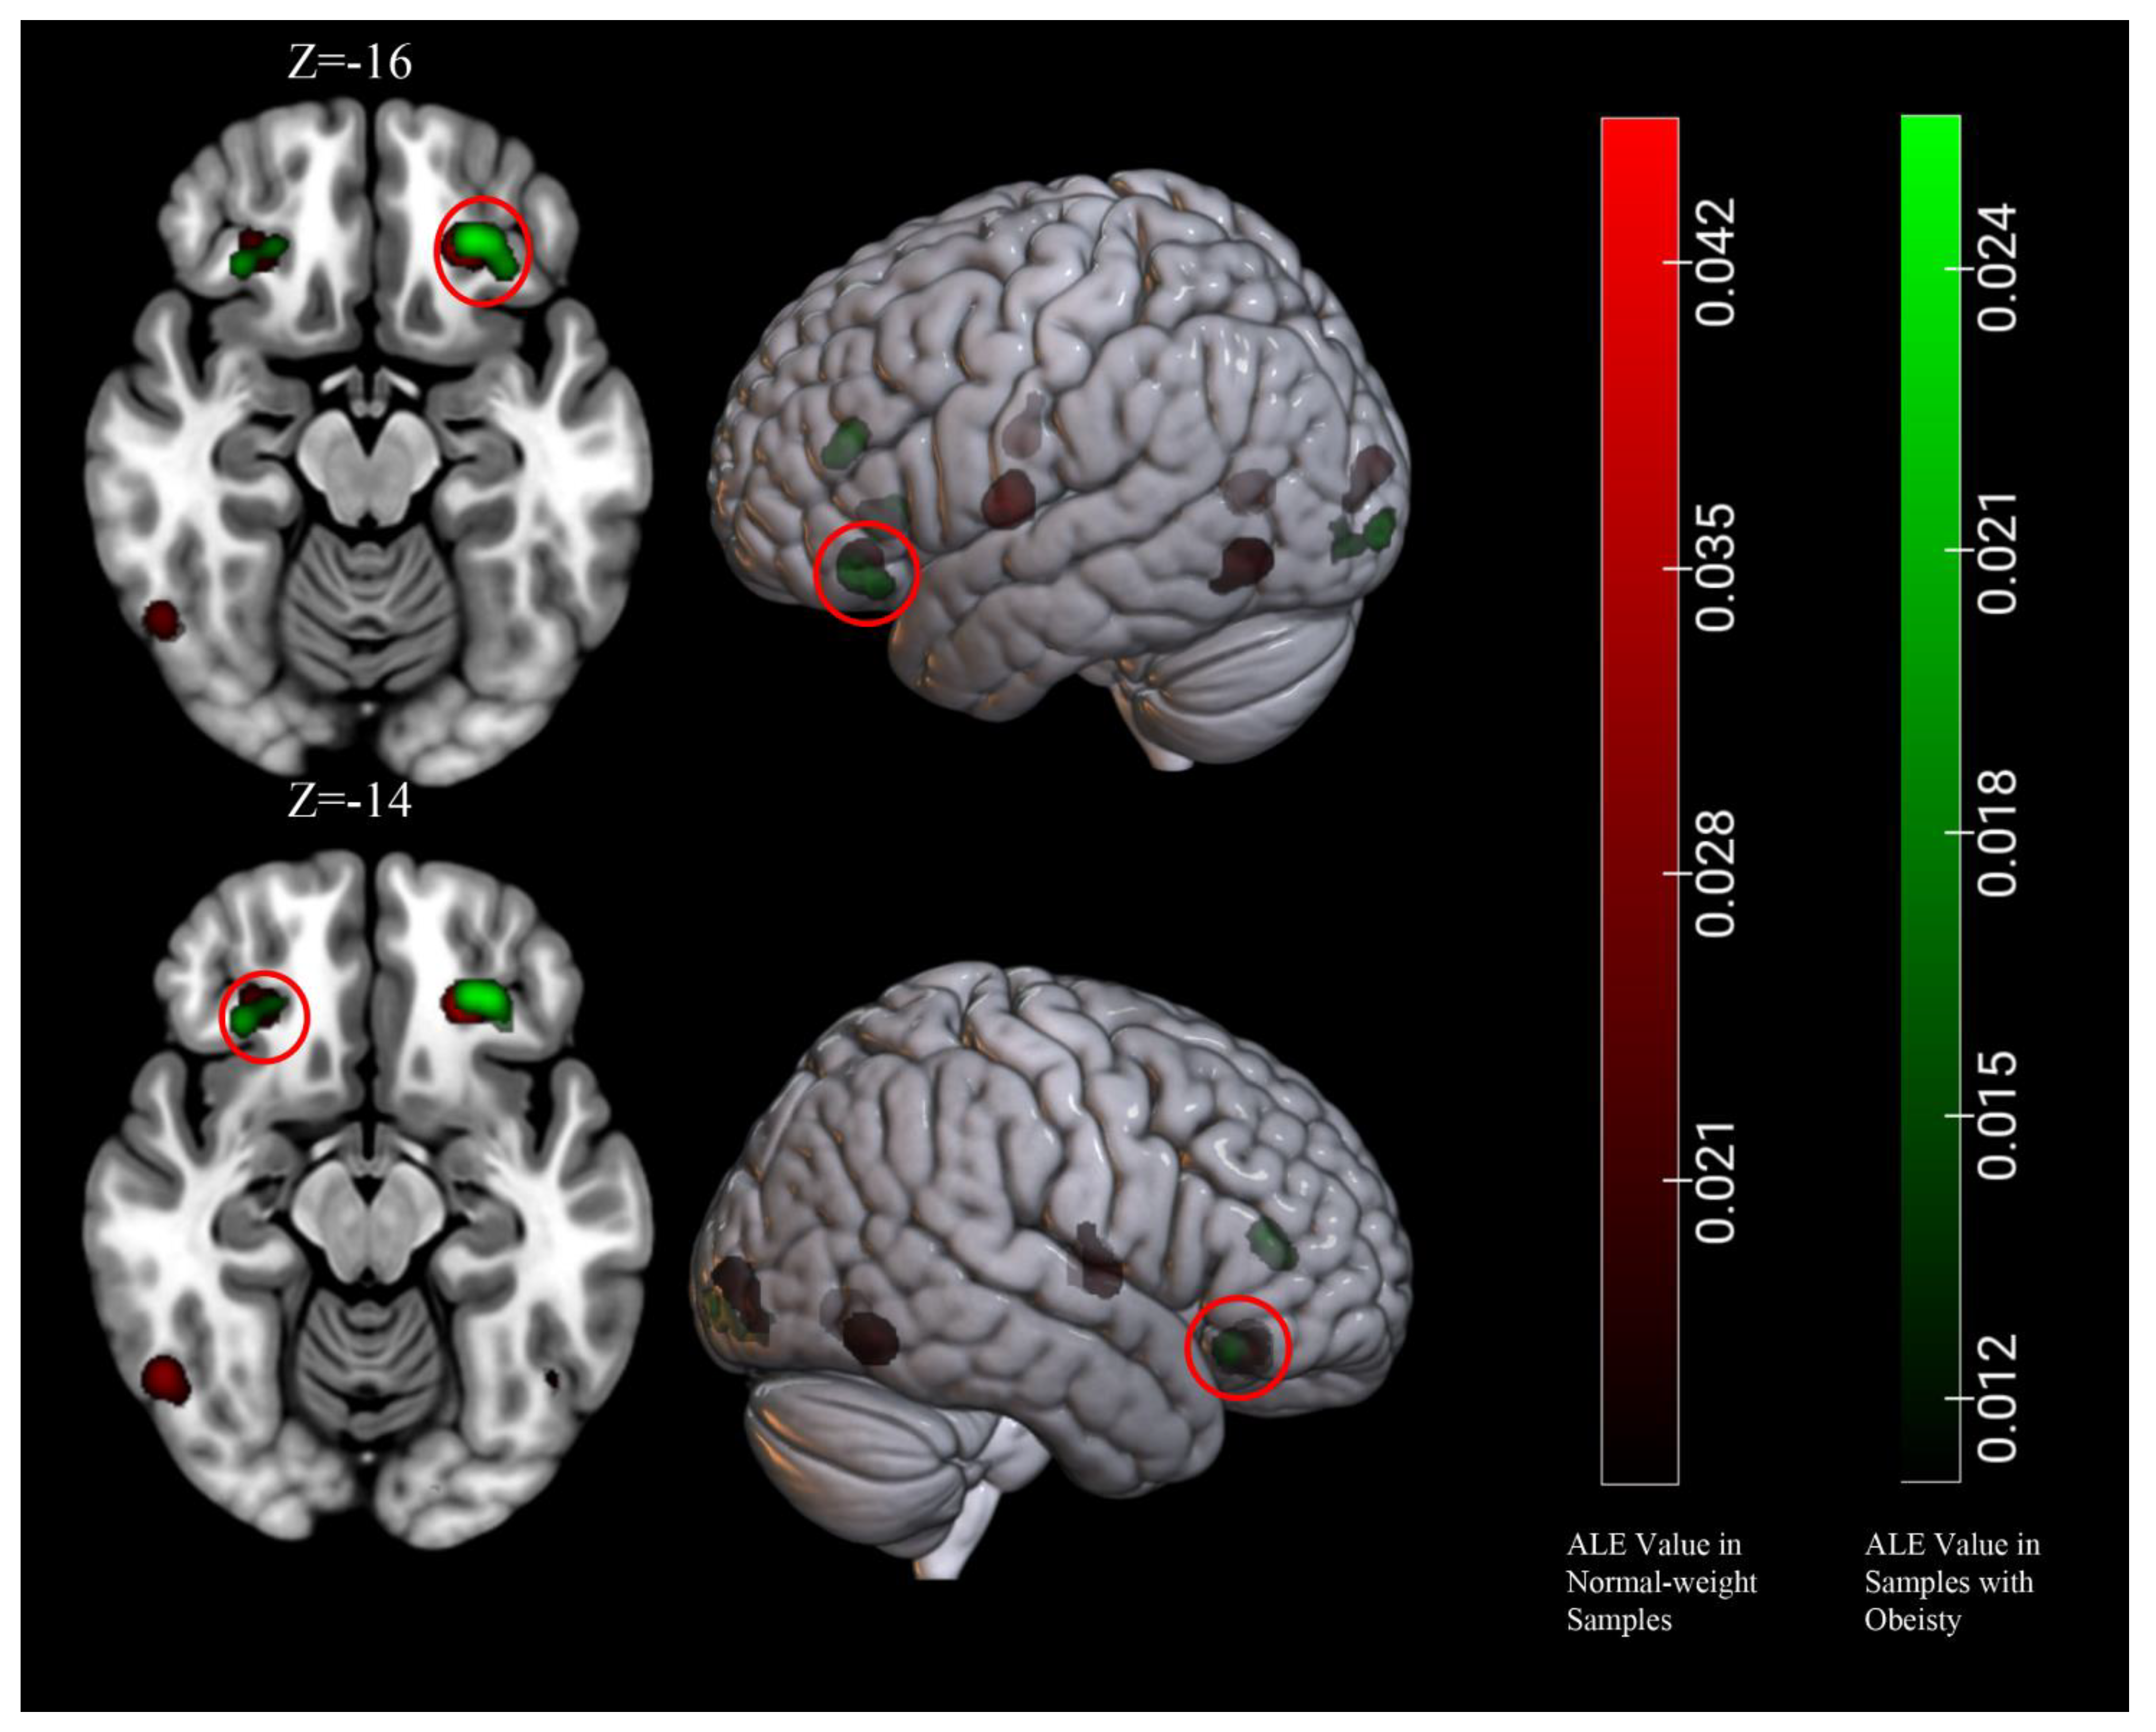
3.5. Conjunction and Contrast Analyses
4. Discussion
4.1. Core Brain Regions Activated by High-Calorie Visual Food Cues
4.2. Common and Specific Brain Activations between Normal-Weight and Obesity
4.3. Limitations and Future Directions
5. Conclusions
Supplementary Materials
Author Contributions
Funding
Data Availability Statement
Conflicts of Interest
References
- Ng, M.; Fleming, T.; Robinson, M.; Thomson, B.; Graetz, N.; Margono, C.; Mullany, E.C.; Biryukov, S.; Abbafati, C.; Abera, S.F.; et al. Global, regional, and national prevalence of overweight and obesity in children and adults during 1980-2013: A systematic analysis for the Global Burden of Disease Study 2013. Lancet 2014, 384, 766–781. [Google Scholar] [CrossRef] [Green Version]
- Lavie, C.J.; Milani, R.V.; Ventura, H.O. Obesity and cardiovascular disease: Risk factor, paradox, and impact of weight loss. J. Am. Coll. Cardiol. 2009, 53, 1925–1932. [Google Scholar] [CrossRef] [Green Version]
- Mokdad, A.H.; Ford, E.S.; Bowman, B.A.; Dietz, W.H.; Vinicor, F.; Bales, V.S.; Marks, J.S. Prevalence of obesity, diabetes, and obesity-related health risk factors, 2001. JAMA 2003, 289, 76–79. [Google Scholar] [CrossRef]
- Kyrgiou, M.; Kalliala, I.; Markozannes, G.; Gunter, M.J.; Paraskevaidis, E.; Gabra, H.; Martin-Hirsch, P.; Tsilidis, K.K. Adiposity and cancer at major anatomical sites: Umbrella review of the literature. BMJ 2017, 356, j477. [Google Scholar] [CrossRef] [PubMed] [Green Version]
- Luppino, F.S.; de Wit, L.M.; Bouvy, P.F.; Stijnen, T.; Cuijpers, P.; Penninx, B.W.; Zitman, F.G. Overweight, obesity, and depression: A systematic review and meta-analysis of longitudinal studies. Arch. Gen. Psychiatry 2010, 67, 220–229. [Google Scholar] [CrossRef] [PubMed]
- Withrow, D.; Alter, D.A. The economic burden of obesity worldwide: A systematic review of the direct costs of obesity. Obes. Rev. 2011, 12, 131–141. [Google Scholar] [CrossRef] [PubMed]
- World Health Organization. Available online: https://www.who.int/news-room/facts-in-pictures/detail/6-facts-on-obesity (accessed on 9 June 2021).
- Vainik, U.; Dagher, A.; Realo, A.; Colodro-Conde, L.; Mortensen, E.L.; Jang, K.; Juko, A.; Kandler, C.; Sorensen, T.I.A.; Mottus, R. Personality-obesity associations are driven by narrow traits: A meta-analysis. Obes. Rev. 2019, 20, 1121–1131. [Google Scholar] [CrossRef] [PubMed] [Green Version]
- Yang, Y.; Shields, G.S.; Guo, C.; Liu, Y. Executive function performance in obesity and overweight individuals: A meta-analysis and review. Neurosci. Biobehav. Rev. 2018, 84, 225–244. [Google Scholar] [CrossRef] [PubMed]
- Yang, Y.; Shields, G.S.; Wu, Q.; Liu, Y.; Chen, H.; Guo, C. The association between obesity and lower working memory is mediated by inflammation: Findings from a nationally representative dataset of U.S. adults. Brain Behav. Immun. 2020, 84, 173–179. [Google Scholar] [CrossRef]
- Boswell, R.G.; Kober, H. Food cue reactivity and craving predict eating and weight gain: A meta-analytic review. Obes. Rev. 2016, 17, 159–177. [Google Scholar] [CrossRef]
- Lowe, C.J.; Reichelt, A.C.; Hall, P.A. The Prefrontal Cortex and Obesity: A Health Neuroscience Perspective. Trends Cogn. Sci. 2019, 23, 349–361. [Google Scholar] [CrossRef] [Green Version]
- Hill, J.O. Understanding and addressing the epidemic of obesity: An energy balance perspective. Endocr. Rev. 2006, 27, 750–761. [Google Scholar] [CrossRef] [Green Version]
- Hu, F.B. Resolved: There is sufficient scientific evidence that decreasing sugar-sweetened beverage consumption will reduce the prevalence of obesity and obesity-related diseases. Obes. Rev. 2013, 14, 606–619. [Google Scholar] [CrossRef] [PubMed]
- Ruanpeng, D.; Thongprayoon, C.; Cheungpasitporn, W.; Harindhanavudhi, T. Sugar and artificially sweetened beverages linked to obesity: A systematic review and meta-analysis. QJM 2017, 110, 513–520. [Google Scholar] [CrossRef] [PubMed] [Green Version]
- Kirk, S.F.; Penney, T.L.; McHugh, T.L. Characterizing the obesogenic environment: The state of the evidence with directions for future research. Obes. Rev. 2010, 11, 109–117. [Google Scholar] [CrossRef] [PubMed]
- Gearhardt, A.N.; Bragg, M.A.; Pearl, R.L.; Schvey, N.A.; Roberto, C.A.; Brownell, K.D. Obesity and public policy. Annu. Rev. Clin. Psychol. 2012, 8, 405–430. [Google Scholar] [CrossRef] [Green Version]
- Swinburn, B.A.; Sacks, G.; Hall, K.D.; McPherson, K.; Finegood, D.T.; Moodie, M.L.; Gortmaker, S.L. The global obesity pandemic: Shaped by global drivers and local environments. Lancet 2011, 378, 804–814. [Google Scholar] [CrossRef]
- Stice, E.; Burger, K. Neural vulnerability factors for obesity. Clin. Psychol. Rev. 2019, 68, 38–53. [Google Scholar] [CrossRef]
- Berridge, K.C.; Ho, C.Y.; Richard, J.M.; DiFeliceantonio, A.G. The tempted brain eats: Pleasure and desire circuits in obesity and eating disorders. Brain Res. 2010, 1350, 43–64. [Google Scholar] [CrossRef] [Green Version]
- Yeung, A.W.K.; Wong, N.S.M.; Lau, H.; Eickhoff, S.B. Human brain responses to gustatory and food stimuli: A meta-evaluation of neuroimaging meta-analyses. Neuroimage 2019, 202, 116111. [Google Scholar] [CrossRef] [PubMed]
- Han, P. Advances in research on brain processing of food odors using different neuroimaging techniques. Curr. Opin. Food Sci. 2021, 42, 134–139. [Google Scholar] [CrossRef]
- Van der Laan, L.N.; de Ridder, D.T.; Viergever, M.A.; Smeets, P.A. The first taste is always with the eyes: A meta-analysis on the neural correlates of processing visual food cues. Neuroimage 2011, 55, 296–303. [Google Scholar] [CrossRef]
- Van Meer, F.; van der Laan, L.N.; Adan, R.A.; Viergever, M.A.; Smeets, P.A. What you see is what you eat: An ALE meta-analysis of the neural correlates of food viewing in children and adolescents. Neuroimage 2015, 104, 35–43. [Google Scholar] [CrossRef] [PubMed]
- Eickhoff, S.B.; Bzdok, D.; Laird, A.R.; Kurth, F.; Fox, P.T. Activation likelihood estimation meta-analysis revisited. Neuroimage 2012, 59, 2349–2361. [Google Scholar] [CrossRef] [Green Version]
- Eickhoff, S.B.; Laird, A.R.; Grefkes, C.; Wang, L.E.; Zilles, K.; Fox, P.T. Coordinate-based activation likelihood estimation meta-analysis of neuroimaging data: A random-effects approach based on empirical estimates of spatial uncertainty. Hum. Brain Mapp. 2009, 30, 2907–2926. [Google Scholar] [CrossRef] [PubMed] [Green Version]
- Tang, D.W.; Fellows, L.K.; Small, D.M.; Dagher, A. Food and drug cues activate similar brain regions: A meta-analysis of functional MRI studies. Physiol. Behav. 2012, 106, 317–324. [Google Scholar] [CrossRef] [PubMed]
- Huerta, C.I.; Sarkar, P.R.; Duong, T.Q.; Laird, A.R.; Fox, P.T. Neural bases of food perception: Coordinate-based meta-analyses of neuroimaging studies in multiple modalities. Obesity 2014, 22, 1439–1446. [Google Scholar] [CrossRef]
- Yeung, A.W.K.; Goto, T.K.; Leung, W.K. Affective value, intensity and quality of liquid tastants/food discernment in the human brain: An activation likelihood estimation meta-analysis. Neuroimage 2018, 169, 189–199. [Google Scholar] [CrossRef] [PubMed]
- Chen, E.Y.; Zeffiro, T.A. Hunger and BMI modulate neural responses to sweet stimuli: fMRI meta-analysis. Int. J. Obes. 2020, 44, 1636–1652. [Google Scholar] [CrossRef] [PubMed]
- Sescousse, G.; Caldu, X.; Segura, B.; Dreher, J.C. Processing of primary and secondary rewards: A quantitative meta-analysis and review of human functional neuroimaging studies. Neurosci. Biobehav. Rev. 2013, 37, 681–696. [Google Scholar] [CrossRef] [PubMed] [Green Version]
- Pursey, K.M.; Stanwell, P.; Callister, R.J.; Brain, K.; Collins, C.E.; Burrows, T.L. Neural responses to visual food cues according to weight status: A systematic review of functional magnetic resonance imaging studies. Front. Nutr. 2014, 1, 7. [Google Scholar] [CrossRef] [PubMed]
- Eickhoff, S.B.; Laird, A.R.; Fox, P.M.; Lancaster, J.L.; Fox, P.T. Implementation errors in the GingerALE Software: Description and recommendations. Hum. Brain Mapp. 2017, 38, 7–11. [Google Scholar] [CrossRef] [Green Version]
- Cole, T.J.; Bellizzi, M.C.; Flegal, K.M.; Dietz, W.H. Establishing a standard definition for child overweight and obesity worldwide: International survey. BMJ 2000, 320, 1240–1243. [Google Scholar] [CrossRef] [PubMed] [Green Version]
- Turkeltaub, P.E.; Eickhoff, S.B.; Laird, A.R.; Fox, M.; Wiener, M.; Fox, P. Minimizing within-experiment and within-group effects in Activation Likelihood Estimation meta-analyses. Hum. Brain Mapp. 2012, 33, 1–13. [Google Scholar] [CrossRef] [Green Version]
- Eickhoff, S.B.; Nichols, T.E.; Laird, A.R.; Hoffstaedter, F.; Amunts, K.; Fox, P.T.; Bzdok, D.; Eickhoff, C.R. Behavior, sensitivity, and power of activation likelihood estimation characterized by massive empirical simulation. Neuroimage 2016, 137, 70–85. [Google Scholar] [CrossRef] [Green Version]
- Nichol, A.D.; Holle, M.J.; An, R. Glycemic impact of non-nutritive sweeteners: A systematic review and meta-analysis of randomized controlled trials. Eur. J. Clin. Nutr. 2018, 72, 796–804. [Google Scholar] [CrossRef]
- Basso, F.; Petit, O.; Le Bellu, S.; Lahlou, S.; Cancel, A.; Anton, J.L. Taste at first (person) sight: Visual perspective modulates brain activity implicitly associated with viewing unhealthy but not healthy foods. Appetite 2018, 128, 242–254. [Google Scholar] [CrossRef] [PubMed]
- Basu, T.; Bao, P.; Lerner, A.; Anderson, L.; Page, K.; Stanczyk, F.; Mishell, D., Jr.; Segall-Gutierrez, P. The Effect of Depo Medroxyprogesterone Acetate (DMPA) on Cerebral Food Motivation Centers: A Pilot Study using Functional Magnetic Resonance Imaging. Contraception 2016, 94, 321–327. [Google Scholar] [CrossRef]
- Beaver, J.D.; Lawrence, A.D.; van Ditzhuijzen, J.; Davis, M.H.; Woods, A.; Calder, A.J. Individual differences in reward drive predict neural responses to images of food. J. Neurosci. 2006, 26, 5160–5166. [Google Scholar] [CrossRef] [Green Version]
- Blechert, J.; Klackl, J.; Miedl, S.F.; Wilhelm, F.H. To eat or not to eat: Effects of food availability on reward system activity during food picture viewing. Appetite 2016, 99, 254–261. [Google Scholar] [CrossRef]
- Carnell, S.; Benson, L.; Chang, K.V.; Wang, Z.; Huo, Y.; Geliebter, A.; Peterson, B.S. Neural correlates of familial obesity risk and overweight in adolescence. Neuroimage 2017, 159, 236–247. [Google Scholar] [CrossRef]
- Chen, P.A.; Chavez, R.S.; Heatherton, T.F. Structural integrity between executive control and reward regions of the brain predicts body fat percentage in chronic dieters. Cogn. Neurosci. 2017, 8, 162–166. [Google Scholar] [CrossRef] [PubMed] [Green Version]
- Cornier, M.A.; McFadden, K.L.; Thomas, E.A.; Bechtell, J.L.; Eichman, L.S.; Bessesen, D.H.; Tregellas, J.R. Differences in the neuronal response to food in obesity-resistant as compared to obesity-prone individuals. Physiol. Behav. 2013, 110–111, 122–128. [Google Scholar] [CrossRef] [PubMed] [Green Version]
- Cornier, M.A.; Melanson, E.L.; Salzberg, A.K.; Bechtell, J.L.; Tregellas, J.R. The effects of exercise on the neuronal response to food cues. Physiol. Behav. 2012, 105, 1028–1034. [Google Scholar] [CrossRef] [Green Version]
- Cornier, M.A.; Salzberg, A.K.; Endly, D.C.; Bessesen, D.H.; Rojas, D.C.; Tregellas, J.R. The effects of overfeeding on the neuronal response to visual food cues in thin and reduced-obese individuals. PLoS ONE 2009, 4, e6310. [Google Scholar] [CrossRef] [PubMed] [Green Version]
- Cornier, M.A.; Von Kaenel, S.S.; Bessesen, D.H.; Tregellas, J.R. Effects of overfeeding on the neuronal response to visual food cues. Am. J. Clin. Nutr. 2007, 86, 965–971. [Google Scholar] [CrossRef] [Green Version]
- Davids, S.; Lauffer, H.; Thoms, K.; Jagdhuhn, M.; Hirschfeld, H.; Domin, M.; Hamm, A.; Lotze, M. Increased dorsolateral prefrontal cortex activation in obese children during observation of food stimuli. Int. J. Obes. 2010, 34, 94–104. [Google Scholar] [CrossRef] [PubMed] [Green Version]
- Doornweerd, S.; De Geus, E.J.; Barkhof, F.; Van Bloemendaal, L.; Boomsma, D.I.; Van Dongen, J.; Drent, M.L.; Willemsen, G.; Veltman, D.J.; IJzerman, G.R. Brain reward responses to food stimuli among female monozygotic twins discordant for BMI. Brain Imaging Behav. 2018, 12, 718–727. [Google Scholar] [CrossRef] [PubMed] [Green Version]
- English, L.K.; Fearnbach, S.N.; Wilson, S.J.; Fisher, J.O.; Savage, J.S.; Rolls, B.J.; Keller, K.L. Food portion size and energy density evoke different patterns of brain activation in children. Am. J. Clin. Nutr. 2017, 105, 295–305. [Google Scholar] [CrossRef] [Green Version]
- Evero, N.; Hackett, L.C.; Clark, R.D.; Phelan, S.; Hagobian, T.A. Aerobic exercise reduces neuronal responses in food reward brain regions. J. Appl. Physiol. 2012, 112, 1612–1619. [Google Scholar] [CrossRef] [Green Version]
- Frank, S.; Laharnar, N.; Kullmann, S.; Veit, R.; Canova, C.; Hegner, Y.L.; Fritsche, A.; Preissl, H. Processing of food pictures: Influence of hunger, gender and calorie content. Brain Res. 2010, 1350, 159–166. [Google Scholar] [CrossRef] [PubMed]
- Frank, S.; Wilms, B.; Veit, R.; Ernst, B.; Thurnheer, M.; Kullmann, S.; Fritsche, A.; Birbaumer, N.; Preissl, H.; Schultes, B. Altered brain activity in severely obese women may recover after Roux-en Y gastric bypass surgery. Int. J. Obes. 2014, 38, 341–348. [Google Scholar] [CrossRef] [PubMed]
- Garcia-Garcia, I.; Kube, J.; Morys, F.; Schrimpf, A.; Kanaan, A.S.; Gaebler, M.; Villringer, A.; Dagher, A.; Horstmann, A.; Neumann, J. Liking and left amygdala activity during food versus nonfood processing are modulated by emotional context. Cogn. Affect. Behav. Neurosci. 2020, 20, 91–102. [Google Scholar] [CrossRef]
- Gearhardt, A.N.; Yokum, S.; Harris, J.L.; Epstein, L.H.; Lumeng, J.C. Neural response to fast food commercials in adolescents predicts intake. Am. J. Clin. Nutr. 2020, 111, 493–502. [Google Scholar] [CrossRef]
- Geliebter, A.; Pantazatos, S.P.; McOuatt, H.; Puma, L.; Gibson, C.D.; Atalayer, D. Sex-based fMRI differences in obese humans in response to high vs. low energy food cues. Behav. Brain Res. 2013, 243, 91–96. [Google Scholar] [CrossRef] [Green Version]
- Goldstone, A.P.; Prechtl de Hernandez, C.G.; Beaver, J.D.; Muhammed, K.; Croese, C.; Bell, G.; Durighel, G.; Hughes, E.; Waldman, A.D.; Frost, G.; et al. Fasting biases brain reward systems towards high-calorie foods. Eur. J. Neurosci. 2009, 30, 1625–1635. [Google Scholar] [CrossRef] [PubMed]
- Heni, M.; Kullmann, S.; Ketterer, C.; Guthoff, M.; Bayer, M.; Staiger, H.; Machicao, F.; Haring, H.U.; Preissl, H.; Veit, R.; et al. Differential effect of glucose ingestion on the neural processing of food stimuli in lean and overweight adults. Hum. Brain Mapp. 2014, 35, 918–928. [Google Scholar] [CrossRef] [PubMed]
- Hermann, P.; Gal, V.; Kobor, I.; Kirwan, C.B.; Kovacs, P.; Kitka, T.; Lengyel, Z.; Balint, E.; Varga, B.; Cseko, C.; et al. Efficacy of weight loss intervention can be predicted based on early alterations of fMRI food cue reactivity in the striatum. Neuroimage Clin. 2019, 23, 101803. [Google Scholar] [CrossRef] [PubMed]
- Horster, I.; Nickel, K.; Holovics, L.; Schmidt, S.; Endres, D.; Tebartz van Elst, L.; Zeeck, A.; Maier, S.; Joos, A. A Neglected Topic in Neuroscience: Replicability of fMRI Results with Specific Reference to ANOREXIA NERVOSA. Front. Psychiatry 2020, 11, 777. [Google Scholar] [CrossRef]
- Jastreboff, A.M.; Lacadie, C.; Seo, D.; Kubat, J.; Van Name, M.A.; Giannini, C.; Savoye, M.; Constable, R.T.; Sherwin, R.S.; Caprio, S.; et al. Leptin is associated with exaggerated brain reward and emotion responses to food images in adolescent obesity. Diabetes Care 2014, 37, 3061–3068. [Google Scholar] [CrossRef] [Green Version]
- Jastreboff, A.M.; Sinha, R.; Lacadie, C.; Small, D.M.; Sherwin, R.S.; Potenza, M.N. Neural correlates of stress- and food cue-induced food craving in obesity: Association with insulin levels. Diabetes Care 2013, 36, 394–402. [Google Scholar] [CrossRef] [Green Version]
- Jensen, C.D.; Kirwan, C.B. Functional brain response to food images in successful adolescent weight losers compared with normal-weight and overweight controls. Obesity 2015, 23, 630–636. [Google Scholar] [CrossRef]
- Karra, E.; O’Daly, O.G.; Choudhury, A.I.; Yousseif, A.; Millership, S.; Neary, M.T.; Scott, W.R.; Chandarana, K.; Manning, S.; Hess, M.E.; et al. A link between FTO, ghrelin, and impaired brain food-cue responsivity. J. Clin. Investig. 2013, 123, 3539–3551. [Google Scholar] [CrossRef] [PubMed] [Green Version]
- Killgore, W.D.; Yurgelun-Todd, D.A. Developmental changes in the functional brain responses of adolescents to images of high and low-calorie foods. Dev. Psychobiol. 2005, 47, 377–397. [Google Scholar] [CrossRef]
- Killgore, W.D.S.; Young, A.D.; Femia, L.A.; Bogorodzki, P.; Rogowska, J.; Yurgelun-Todd, D.A. Cortical and limbic activation during viewing of high- versus low-calorie foods. NeuroImage 2003, 19, 1381–1394. [Google Scholar] [CrossRef]
- Kim, K.R.; Ku, J.; Lee, J.H.; Lee, H.; Jung, Y.C. Functional and effective connectivity of anterior insula in anorexia nervosa and bulimia nervosa. Neurosci. Lett. 2012, 521, 152–157. [Google Scholar] [CrossRef]
- Le, T.M.; Zhornitsky, S.; Wang, W.; Zhang, S.; Li, C.R. Problem drinking alters gray matter volume and food cue responses of the lateral orbitofrontal cortex. Addict. Biol. 2021, 26, e12857. [Google Scholar] [CrossRef]
- Li, G.; Hu, Y.; Zhang, W.; Ding, Y.; Wang, Y.; Wang, J.; He, Y.; Lv, G.; von Deneen, K.M.; Zhao, Y.; et al. Resting activity of the hippocampus and amygdala in obese individuals predicts their response to food cues. Addict. Biol. 2021, 26, e12974. [Google Scholar] [CrossRef]
- Luo, S.; Alves, J.; Hardy, K.; Wang, X.; Monterosso, J.; Xiang, A.H.; Page, K.A. Neural processing of food cues in pre-pubertal children. Pediatr. Obes. 2019, 14, e12435. [Google Scholar] [CrossRef]
- Luo, S.; Romero, A.; Adam, T.C.; Hu, H.H.; Monterosso, J.; Page, K.A. Abdominal fat is associated with a greater brain reward response to high-calorie food cues in Hispanic women. Obesity 2013, 21, 2029–2036. [Google Scholar] [CrossRef] [Green Version]
- Malik, S.; McGlone, F.; Dagher, A. State of expectancy modulates the neural response to visual food stimuli in humans. Appetite 2011, 56, 302–309. [Google Scholar] [CrossRef]
- Masterson, T.D.; Kirwan, C.B.; Davidson, L.E.; LeCheminant, J.D. Neural reactivity to visual food stimuli is reduced in some areas of the brain during evening hours compared to morning hours: An fMRI study in women. Brain Imaging Behav. 2016, 10, 68–78. [Google Scholar] [CrossRef] [PubMed]
- Mengotti, P.; Foroni, F.; Rumiati, R.I. Neural correlates of the energetic value of food during visual processing and response inhibition. Neuroimage 2019, 184, 130–139. [Google Scholar] [CrossRef] [PubMed]
- Merchant, J.S.; Cosme, D.; Giuliani, N.R.; Dirks, B.; Berkman, E.T. Neural Substrates of Food Valuation and Its Relationship with BMI and Healthy Eating in Higher BMI Individuals. Front. Behav. Neurosci. 2020, 14, 578676. [Google Scholar] [CrossRef]
- Murdaugh, D.L.; Cox, J.E.; Cook, E.W., 3rd; Weller, R.E. fMRI reactivity to high-calorie food pictures predicts short- and long-term outcome in a weight-loss program. Neuroimage 2012, 59, 2709–2721. [Google Scholar] [CrossRef] [Green Version]
- Murray, E.; Brouwer, S.; McCutcheon, R.; Harmer, C.J.; Cowen, P.J.; McCabe, C. Opposing neural effects of naltrexone on food reward and aversion: Implications for the treatment of obesity. Psychopharmacology 2014, 231, 4323–4335. [Google Scholar] [CrossRef] [PubMed]
- Neseliler, S.; Tannenbaum, B.; Zacchia, M.; Larcher, K.; Coulter, K.; Lamarche, M.; Marliss, E.B.; Pruessner, J.; Dagher, A. Academic stress and personality interact to increase the neural response to high-calorie food cues. Appetite 2017, 116, 306–314. [Google Scholar] [CrossRef] [Green Version]
- Nummenmaa, L.; Hirvonen, J.; Hannukainen, J.C.; Immonen, H.; Lindroos, M.M.; Salminen, P.; Nuutila, P. Dorsal striatum and its limbic connectivity mediate abnormal anticipatory reward processing in obesity. PLoS ONE 2012, 7, e31089. [Google Scholar] [CrossRef]
- Passamonti, L.; Rowe, J.B.; Schwarzbauer, C.; Ewbank, M.P.; von dem Hagen, E.; Calder, A.J. Personality predicts the brain’s response to viewing appetizing foods: The neural basis of a risk factor for overeating. J. Neurosci. 2009, 29, 43–51. [Google Scholar] [CrossRef] [Green Version]
- Pursey, K.M.; Contreras-Rodriguez, O.; Collins, C.E.; Stanwell, P.; Burrows, T.L. Food Addiction Symptoms and Amygdala Response in Fasted and Fed States. Nutrients 2019, 11, 1285. [Google Scholar] [CrossRef] [Green Version]
- Rapuano, K.M.; Huckins, J.F.; Sargent, J.D.; Heatherton, T.F.; Kelley, W.M. Individual Differences in Reward and Somatosensory-Motor Brain Regions Correlate with Adiposity in Adolescents. Cereb. Cortex 2016, 26, 2602–2611. [Google Scholar] [CrossRef] [Green Version]
- Rothemund, Y.; Preuschhof, C.; Bohner, G.; Bauknecht, H.C.; Klingebiel, R.; Flor, H.; Klapp, B.F. Differential activation of the dorsal striatum by high-calorie visual food stimuli in obese individuals. Neuroimage 2007, 37, 410–421. [Google Scholar] [CrossRef] [PubMed]
- Santel, S.; Baving, L.; Krauel, K.; Munte, T.F.; Rotte, M. Hunger and satiety in anorexia nervosa: fMRI during cognitive processing of food pictures. Brain Res. 2006, 1114, 138–148. [Google Scholar] [CrossRef] [PubMed]
- Schienle, A.; Schafer, A.; Hermann, A.; Vaitl, D. Binge-eating disorder: Reward sensitivity and brain activation to images of food. Biol. Psychiatry 2009, 65, 654–661. [Google Scholar] [CrossRef] [PubMed]
- Simmons, W.K.; Martin, A.; Barsalou, L.W. Pictures of appetizing foods activate gustatory cortices for taste and reward. Cereb. Cortex 2005, 15, 1602–1608. [Google Scholar] [CrossRef]
- Smeets, P.A.; Kroese, F.M.; Evers, C.; de Ridder, D.T. Allured or alarmed: Counteractive control responses to food temptations in the brain. Behav. Brain Res. 2013, 248, 41–45. [Google Scholar] [CrossRef] [Green Version]
- St-Onge, M.P.; Wolfe, S.; Sy, M.; Shechter, A.; Hirsch, J. Sleep restriction increases the neuronal response to unhealthy food in normal-weight individuals. Int. J. Obes. 2014, 38, 411–416. [Google Scholar] [CrossRef] [PubMed] [Green Version]
- Van Bloemendaal, L.; RG, I.J.; Ten Kulve, J.S.; Barkhof, F.; Konrad, R.J.; Drent, M.L.; Veltman, D.J.; Diamant, M. GLP-1 receptor activation modulates appetite- and reward-related brain areas in humans. Diabetes 2014, 63, 4186–4196. [Google Scholar] [CrossRef] [Green Version]
- Van Meer, F.; van der Laan, L.N.; Charbonnier, L.; Viergever, M.A.; Adan, R.A.; Smeets, P.A.; Consortium, I.F. Developmental differences in the brain response to unhealthy food cues: An fMRI study of children and adults. Am. J. Clin. Nutr. 2016, 104, 1515–1522. [Google Scholar] [CrossRef] [PubMed] [Green Version]
- Wabnegger, A.; Schwab, D.; Schienle, A. Aversive aftertaste changes visual food cue reactivity: An fMRI study on cross-modal perception. Neurosci. Lett. 2018, 673, 56–60. [Google Scholar] [CrossRef]
- Wagner, D.D.; Boswell, R.G.; Kelley, W.M.; Heatherton, T.F. Inducing negative affect increases the reward value of appetizing foods in dieters. J. Cogn. Neurosci. 2012, 24, 1625–1633. [Google Scholar] [CrossRef] [Green Version]
- Wang, Y.; Dong, D.; Todd, J.; Du, J.; Yang, Z.; Lu, H.; Chen, H. Neural correlates of restrained eaters’ high susceptibility to food cues: An fMRI study. Neurosci. Lett. 2016, 631, 56–62. [Google Scholar] [CrossRef] [PubMed]
- Yokum, S.; Bohon, C.; Berkman, E.; Stice, E. Test-retest reliability of functional MRI food receipt, anticipated receipt, and picture tasks. Am. J. Clin. Nutr. 2021, 114, 764–779. [Google Scholar] [CrossRef] [PubMed]
- Van Meer, A.F. Neural Processing of Healthy Foods in Normal-Weight and Overweight Children and Adults. Ph.D. Thesis, Utrecht University, Utrecht, The Netherlands, 2017. [Google Scholar]
- Yang, Y.; Morys, F.; Li, J.; Wu, Q.; Chen, H. Food-Specific Go/No-Go Training for Overweight Individuals: Brain Imaging Data Suggest Inhibition Shapes Food Evaluation. Soc. Cogn. Affect. Neurosci. Unpublished manuscript 2021. [Google Scholar]
- Van den Akker, K.; Stewart, K.; Antoniou, E.E.; Palmberg, A.; Jansen, A. Food Cue Reactivity, Obesity, and Impulsivity: Are They Associated? Curr. Addict. Rep. 2014, 1, 301–308. [Google Scholar] [CrossRef]
- Devoto, F.; Zapparoli, L.; Bonandrini, R.; Berlingeri, M.; Ferrulli, A.; Luzi, L.; Banfi, G.; Paulesu, E. Hungry brains: A meta-analytical review of brain activation imaging studies on food perception and appetite in obese individuals. Neurosci. Biobehav. Rev. 2018, 94, 271–285. [Google Scholar] [CrossRef]
- LeDoux, J.E. Emotion circuits in the brain. Annu. Rev. Neurosci. 2000, 23, 155–184. [Google Scholar] [CrossRef] [PubMed]
- Janak, P.H.; Tye, K.M. From circuits to behaviour in the amygdala. Nature 2015, 517, 284–292. [Google Scholar] [CrossRef] [Green Version]
- Zheng, J.; Anderson, K.L.; Leal, S.L.; Shestyuk, A.; Gulsen, G.; Mnatsakanyan, L.; Vadera, S.; Hsu, F.P.; Yassa, M.A.; Knight, R.T.; et al. Amygdala-hippocampal dynamics during salient information processing. Nat. Commun. 2017, 8, 14413. [Google Scholar] [CrossRef] [PubMed]
- Richter-Levin, G.; Akirav, I. Emotional tagging of memory formation--in the search for neural mechanisms. Brain Res. Brain Res. Rev. 2003, 43, 247–256. [Google Scholar] [CrossRef] [PubMed]
- Rudebeck, P.H.; Mitz, A.R.; Chacko, R.V.; Murray, E.A. Effects of amygdala lesions on reward-value coding in orbital and medial prefrontal cortex. Neuron 2013, 80, 1519–1531. [Google Scholar] [CrossRef] [PubMed] [Green Version]
- Liu, X.; Hairston, J.; Schrier, M.; Fan, J. Common and distinct networks underlying reward valence and processing stages: A meta-analysis of functional neuroimaging studies. Neurosci. Biobehav. Rev. 2011, 35, 1219–1236. [Google Scholar] [CrossRef] [Green Version]
- Hill-Bowen, L.D.; Riedel, M.C.; Poudel, R.; Salo, T.; Flannery, J.S.; Camilleri, J.A.; Eickhoff, S.B.; Laird, A.R.; Sutherland, M.T. The cue-reactivity paradigm: An ensemble of networks driving attention and cognition when viewing drug and natural reward-related stimuli. Neurosci. Biobehav. Rev. 2021, 130, 201–213. [Google Scholar] [CrossRef] [PubMed]
- Kringelbach, M.L.; O’Doherty, J.; Rolls, E.T.; Andrews, C. Activation of the human orbitofrontal cortex to a liquid food stimulus is correlated with its subjective pleasantness. Cereb. Cortex 2003, 13, 1064–1071. [Google Scholar] [CrossRef]
- Simmons, W.K.; Rapuano, K.M.; Ingeholm, J.E.; Avery, J.; Kallman, S.; Hall, K.D.; Martin, A. The ventral pallidum and orbitofrontal cortex support food pleasantness inferences. Brain Struct. Funct. 2014, 219, 473–483. [Google Scholar] [CrossRef] [PubMed] [Green Version]
- Londeree, A.M.; Wagner, D.D. The orbitofrontal cortex spontaneously encodes food health and contains more distinct representations for foods highest in tastiness. Soc. Cogn. Affect. Neurosci. 2021, 16, 816–826. [Google Scholar] [CrossRef]
- Rolls, E.T. Functions of the anterior insula in taste, autonomic, and related functions. Brain Cogn. 2016, 110, 4–19. [Google Scholar] [CrossRef]
- Dagher, A. Functional brain imaging of appetite. Trends Endocrinol. Metab. 2012, 23, 250–260. [Google Scholar] [CrossRef] [PubMed]
- Naqvi, N.H.; Bechara, A. The hidden island of addiction: The insula. Trends Neurosci. 2009, 32, 56–67. [Google Scholar] [CrossRef] [Green Version]
- Pelchat, M.L.; Johnson, A.; Chan, R.; Valdez, J.; Ragland, J.D. Images of desire: Food-craving activation during fMRI. Neuroimage 2004, 23, 1486–1493. [Google Scholar] [CrossRef]
- Zhu, J.N.; Wang, J.J. The cerebellum in feeding control: Possible function and mechanism. Cell. Mol. Neurobiol. 2008, 28, 469–478. [Google Scholar] [CrossRef] [PubMed]
- Caligiore, D.; Arbib, M.A.; Miall, R.C.; Baldassarre, G. The super-learning hypothesis: Integrating learning processes across cortex, cerebellum and basal ganglia. Neurosci. Biobehav. Rev. 2019, 100, 19–34. [Google Scholar] [CrossRef]
- Hanlon, C.A.; Dowdle, L.T.; Naselaris, T.; Canterberry, M.; Cortese, B.M. Visual cortex activation to drug cues: A meta-analysis of functional neuroimaging papers in addiction and substance abuse literature. Drug Alcohol Depend. 2014, 143, 206–212. [Google Scholar] [CrossRef] [PubMed] [Green Version]
- Ko, C.H.; Liu, G.C.; Yen, J.Y.; Chen, C.Y.; Yen, C.F.; Chen, C.S. Brain correlates of craving for online gaming under cue exposure in subjects with Internet gaming addiction and in remitted subjects. Addict. Biol. 2013, 18, 559–569. [Google Scholar] [CrossRef]
- Drewnowski, A. Taste preferences and food intake. Annu. Rev. Nutr. 1997, 17, 237–253. [Google Scholar] [CrossRef] [PubMed] [Green Version]
- Morys, F.; Garcia-Garcia, I.; Dagher, A. Is obesity related to enhanced neural reactivity to visual food cues? A review and meta-analysis. Soc. Cogn. Affect. Neurosci. 2020, nsaa113. [Google Scholar] [CrossRef] [PubMed]
- Meng, X.; Huang, D.; Ao, H.; Wang, X.; Gao, X. Food cue recruits increased reward processing and decreased inhibitory control processing in the obese/overweight: An activation likelihood estimation meta-analysis of fMRI studies. Obes. Res. Clin. Pract. 2020, 14, 127–135. [Google Scholar] [CrossRef] [PubMed]
- Stice, E.; Yokum, S. Neural vulnerability factors that increase risk for future weight gain. Psychol. Bull. 2016, 142, 447–471. [Google Scholar] [CrossRef] [PubMed]


| Study | N (Percent Female) | Mean Age | Weight Status | Hours Fasted | High-Calorie Food Cues | Control Stimuli | Task | Foci | p |
|---|---|---|---|---|---|---|---|---|---|
| Basso et al., 2018 [38] | 20 (50%) | 26 | Normal-weight | At least 4 | Sweet and salty food images | Non-food control images/Healthy food images | Passive viewing | 16 | p < 0.05, FWE corrected |
| Basu et al., 2016 [39] | 8 (100%) | 23 | Normal-weight | At least 8 | High-calorie food images | Low-calorie food images | Passive viewing | 7 | p < 0.05, corrected |
| Beaver et al., 2006 [40] | 12 (58%) | 22 | Normal-weight | At least 2 | Highly appetizing food images such as chocolate, ice cream | Non-food control pictures/Bland food images | Passive viewing | 32 | p < 0.001, uncorrected |
| Blechert et al., 2016 [41] | 32 (50%) | 22 | Normal-weight | At least 3 | Sweet and salty snack food images | Fruit, vegetables images | Passive viewing | 25 | p < 0.005, uncorrected |
| Carnell et al., 2017 [42] | 10 (70%)/16 (50%)/10 (50%) | 16 | Normal-weight/Obesity | At least 5 | High-calorie food words | Non-food words/Low-calorie food words | Passive viewing | 21 | p < 0.000005, uncorrected |
| Chen et al., 2017 [43] | 36 (100%) | 20 | Normal-weight | N.A | Appetizing food images | Non-food control images | Viewing, attentional task | 11 | p < 0.05, corrected |
| Cornier et al., 2007 [47] | 25 (50%) | 35 | Normal-weight | At least 10 | High hedonic value food images | Neutral hedonic food images | Passive viewing | 7 | p < 0.05, FDR corrected |
| Cornier et al., 2009 [46] | 22 (45%) | 34 | Normal-weight | At least 10 | High hedonic value food images | Non-food control images | Passive viewing | 23 | p < 0.05, FDR corrected |
| Cornier et al., 2012 [45] | 12 (42%) | 38 | Obesity | At least 10 | High hedonic value food images | Non-food control images | Passive viewing | 8 | p < 0.01, FDR corrected |
| Cornier et al., 2013 [44] | 25 (44%)/28 (50%) | 31/30 | Normal-weight/Overweight | At least 10 | High hedonic value food images | Non-food control images | Passive viewing | 6/9 | p < 0.05, FDR corrected |
| Davids et al., 2010 [48] | 22 (45%)/22 (32%) | 14/14 | Normal-weight/Obesity | At least 2 | Pizza, hamburgers, sweets images | Non-food control images | Passive viewing | 13/13 | p < 0.05, FDR corrected |
| Doornweerd et al., 2018 [49] | 32 (100%) | 50 | Overweight | At least 12 | High-calorie food images | Non-food control images | Passive viewing | 5 | p < 0.05, FWE corrected |
| English et al., 2017 [50] | 36 (50%) | 9 | Normal-weight | At least 2 | High-energy food images | Low-energy food images | Passive viewing | 10 | p < 0.05, corrected |
| Evero et al., 2012 [51] | 30 (43%) | 22 | Normal-weight | At least 10 | High-energy food images | Non-food control images | Passive viewing | 1 | p < 0.005, uncorrected |
| Frank et al., 2010 [52] | 12 (50%) | 27 | Normal-weight | Fast/fed | High-calorie food images | Non-food control images/Low-calorie food images | Viewing, attentional task | 21 | p < 0.05, FDR corrected |
| Frank et al., 2014 [53] | 31 (100%) | 41 | Obesity | 0.5 | High-calorie food images | Non-food control images/Low-calorie food images | Viewing, attentional task | 22 | p < 0.001, uncorrected |
| García-García et al., 2020 [54] | 58 (100%) | 26 | Overweight | At least 2 | Palatable food images | Non-food control images | Passive viewing | 7 | p < 0.05, FWE corrected |
| Gearhardt et al., 2020 [55] | 171 (51%) | 14 | Overweight | At least 3 | High-calorie food commercials | Non-food commercials/Low-calorie food commercials | Passive viewing | 45 | p < 0.05, corrected |
| Geliebter et al., 2013 [56] | 31 (45%) | 35 | Obesity | Fast/fed | High-energy food images | Low-energy food images | Passive viewing | 16 | p < 0.005, uncorrected |
| Goldstone et al., 2009 [57] | 20 (50%) | 26 | Normal-weight | Fast/fed | High-energy food images | Low-energy food images | Passive viewing | 42 | p < 0.05, FDR corrected |
| Heni et al., 2014 [58] | 24 (50%) | 24 | Overweight | At least 10 | High-calorie food images | Low-calorie food images | Passive viewing | 7 | p < 0.001, uncorrected |
| Hermann et al., 2019 [59] | 29 (90%) | 48 | Obesity | At least 2 | Sweet and salty snack images | Low-calorie food images | Passive viewing | 13 | p < 0.05, FDR corrected |
| Horster et al., 2020 [60] | 27 (89%) | 24 | Normal-weight | N.A | Sweet and savoury food images | Non-food control images | Passive viewing | 6 | p < 0.05, FWE corrected |
| Jastreboff et al., 2013 [62] | 25 (40%) | 26 | Obesity | 2 | High-calorie food images | Neutral-relaxing images | Passive viewing | 6 | p < 0.01, FWE corrected |
| Jastreboff et al., 2014 [61] | 25 (60%)/15 (33%) | 16 | Normal-weight/Obesity | 2 | High-calorie food images | Non-food control images/Low-calorie food images | Passive viewing | 8/4 | p < 0.01, FWE corrected |
| Jensen & Kirwan, 2015 [63] | 34 (85%) | 19 | Overweight | At least 4 | High-energy food images | Low-energy food images | Passive viewing | 7 | p < 0.05, corrected |
| Karra et al., 2013 [64] | 24 (0%) | 23 | Normal-weight | Fast/fed | High-calorie food images | Low-calorie food images | Passive viewing | 5 | p < 0.001, uncorrected |
| Killgore et al. 2003 [66] | 13 (100%) | 24 | Normal-weight | 6 | High-calorie food images | Non-food control images | Passive viewing | 18 | p < 0.0005, uncorrected |
| Killgore et al. 2005 [65] | 8 (100%) | 12 | Normal-weight | 6 | High-calorie food images | Non-food control images/Low-calorie food images | Passive viewing | 17 | p < 0.005, uncorrected |
| Kim et al., 2012 [67] | 20 (100%) | 23 | Normal-weight | 6 | High-calorie food images | Non-food control images | Passive viewing | 4 | p < 0.001, uncorrected |
| Le et al., 2021 [68] | 82 (40%) | 41 | Overweight | 4 | High-calorie food images | Non-food control images | Passive viewing | 18 | p < 0.05, FWE corrected |
| Li et al., 2021 [69] | 118 (58%) | 27 | Obesity | At least 12 | High-calorie food images | Low-calorie food images | Passive viewing | 3 | p < 0.05, FWE corrected |
| Luo et al., 2013 [71] | 13 (100%) | 23 | Obesity | At least 10 | High-calorie food images | Non-food control images | Passive viewing | 18 | p < 0.05, FWE corrected |
| Luo et al., 2019 [70] | 53 (58%) | 8 | Normal-weight | At least 12 | High-calorie food images | Non-food control images | Passive viewing | 29 | p < 0.05, FWE corrected |
| Malik et al., 2011 [72] | 10 (0%) | 26 | Normal-weight | At least 8 | High-calorie food images | Non-food control images | Passive viewing | 27 | p < 0.05, corrected |
| Masterson et al., 2016 [73] | 15 (100%) | 23 | Normal-weight | At least 6 | High-calorie food images | Low-calorie food images | Viewing, attentional task | 9 | p < 0.001, uncorrected |
| Mengotti et al., 2016 [74] | 25 (56%) | 24 | Normal-weight | At least 4 | High-calorie food images | Low-calorie food images | Viewing, attentional task | 6 | p < 0.001, uncorrected |
| Merchant et al., 2020 [75] | 93 (83%) | 39 | Obesity | At least 1 | High-caloric snack food images | Low-calorie food images | Passive viewing | 6 | p < 0.05, FWE corrected |
| Murdaugh et al., 2012 [76] | 25(76%)/13(76%) | 48/45 | Normal-weight/Obesity | At least 8 | Sweet foods images | Non-food control images | Passive viewing | 15/11 | p < 0.05, FDR corrected |
| Murray et al., 2014 [77] | 20 (50%) | 23 | Normal-weight | At least 2 | Chocolate images | Grey images | Passive viewing | 9 | p < 0.05, FWE corrected |
| Neseliler et al., 2017 [78] | 22 (59%) | 21 | Normal-weight | At least 4 | High-calorie food images | Low-calorie food images | Passive viewing | 4 | p < 0.05, corrected |
| Nummenmaa et al., 2012 [79] | 35 (50%) | 47 | Obesity | At least 3 | Highly appetizing food images such as chocolate, pizza, steak | Low-calorie food images | Passive viewing | 20 | p < 0.05, FDR corrected |
| Passamonti et al., 2009 [80] | 21 (48%) | 25 | Normal-weight | At least 2 | High-calorie food images | Low-calorie food images | Passive viewing | 13 | p < 0.001, uncorrected |
| Pursey et al., 2019 [81] | 11 (100%) | 24 | Overweight | Fast/fed | High-calorie food images | Low-calorie food images | Passive viewing | 6 | p < 0.001, uncorrected |
| Rapuano et al., 2016 [82] | 37 (54%) | 14 | Overweight | At least 2 | High-calorie food commercials | Non-food commercials | Passive viewing | 5 | p < 0.05, FWE corrected |
| Rothemund et al., 2007 [83] | 13 (100%) | 31 | Obesity | At least 1.5 | High-calorie food images | Non-food control images | Passive viewing | 7 | p < 0.05, FWE corrected |
| Santel et al., 2006 [84] | 10 (100%) | 17 | Normal-weight | At least 12 | Sweet and salty food images | Non-food control images | Passive viewing | 7 | p < 0.001, uncorrected |
| Schienle et al., 2009 [85] | 19 (100%)/17 (100%) | 22/25 | Normal-weight/Obesity | At least 10 | High-calorie food images | Low-calorie food images | Passive viewing | 3/1 | p < 0.05, FWE corrected |
| Simmons et al., 2005 [86] | 9 (67%) | 18–45 | Normal-weight | N.A | Sweet and salty food images | Non-food control images | Passive viewing | 6 | p < 0.005, uncorrected |
| Smeets et al., 2013 [87] | 30 (100%) | 22 | Normal-weight | 3 | Fattening food images | Non-food control images | Passive viewing | 25 | p < 0.001, uncorrected |
| St-Onge et al., 2014 [88] | 25 (50%) | 35 | Normal-weight | At least 10 | Unhealthy food images | Healthy food images | Passive viewing | 20 | p < 0.05, uncorrected |
| van Bloemendaal et al., 2014 [89] | 48 (50%) | 58 | Obesity | N.A | High-calorie food images | Non-food control images | Passive viewing | 20 | p < 0.05, FWE corrected |
| van Meer et al., 2016 [90] | 27 (67%)/32 (67%) | 11/44 | Normal-weight/Overweight | At least 2 | Unhealthy food images | Healthy food images | Passive viewing | 6/3 | p < 0.05, corrected |
| van Meer, 2017 [95] | 168 (56%)/183 (52%) | 13/45 | Normal-weight/Overweight | At least 2 | High-calorie food images | Low-calorie food images | Passive viewing | 11/26 | p < 0.05, FWE corrected |
| Wabnegger et al., 2018 [91] | 25 (100%) | 24 | Normal-weight | At least 10 | High-caloric sweet foods images | Low-calorie food images | Passive viewing | 4 | p < 0.05, FWE corrected |
| Wagner et al., 2012 [92] | 30 (100%) | 20 | Normal-weight | N.A | High-calorie food images | Non-food control images | Viewing, attentional task | 10 | p < 0.05, FWE corrected |
| Wang et al., 2016 [93] | 24 (100%) | 22 | Normal-weight | 4 | High-energy food images | Non-food control images/Low-calorie food images | Passive viewing | 8 | p < 0.05, FDR corrected |
| Yang et al., 2021 (unpublished data) [96] | 42 (93%) | 19 | Overweight | 2 | High-calorie food images | Low-calorie food images | Passive viewing | 7 | p < 0.05, FWE corrected |
| Yokum et al., 2021 [94] | 150 (79%) | 30 | Obesity | 3 | High-calorie food images | Glass of water images/Low-calorie food images | Passive viewing | 36 | p < 0.05, corrected |
| Cluster | Cluster Size (mm3) | Brain Region | Peak Voxel MNI Coordinates | ALE Value (×10−2) | Z | Contributing Samples | |||
|---|---|---|---|---|---|---|---|---|---|
| X | Y | Z | No. | % | |||||
| 1 | 4096 | L Lingual Gyrus | −14 | −98 | −4 | 3.65 | 5.28 | 20 | 29% |
| 2 | 3680 | L Orbitofrontal Cortex | −26 | 34 | −14 | 6.94 | 8.40 | 21 | 31% |
| 3 | 3368 | R Lingual Gyrus | 22 | −90 | −8 | 2.88 | 4.43 | 18 | 26% |
| 4 | 3232 | R Amygdala | 28 | −6 | −20 | 2.30 | 3.71 | 17 | 25% |
| 5 | 3136 | R Fusiform Gyrus | 38 | −76 | −16 | 2.29 | 3.69 | 16 | 24% |
| 6 | 3040 | L Fusiform Gyrus | −30 | −78 | −12 | 2.63 | 4.13 | 18 | 26% |
| 7 | 2512 | R Orbitofrontal Cortex | 26 | 32 | −14 | 4.35 | 6.01 | 15 | 22% |
| 8 | 2312 | L Insula | −38 | −6 | 6 | 6.90 | 8.36 | 16 | 24% |
| 9 | 2184 | L Amygdala | −20 | −6 | −18 | 3.94 | 5.59 | 13 | 19% |
| 10 | 2168 | R Middle Occipital Gyrus | 36 | −84 | 12 | 4.31 | 5.98 | 11 | 16% |
| 11 | 1376 | L Culmen | −32 | −56 | −18 | 3.27 | 4.87 | 7 | 10% |
| 12 | 1352 | R Insula | 40 | −4 | 4 | 5.46 | 7.09 | 10 | 15% |
| 13 | 1176 | R Inferior Frontal Gyrus | 46 | 6 | 26 | 3.41 | 5.03 | 6 | 9% |
| Cluster | Cluster Size (mm3) | Brain Region | Peak Voxel MNI Coordinates | ALE Value (×10−2) | Z | Contributing Samples | |||
|---|---|---|---|---|---|---|---|---|---|
| X | Y | Z | No. | % | |||||
| Normal weight | |||||||||
| 1 | 2080 | L Orbitofrontal Cortex | −24 | 32 | −14 | 4.01 | 6.56 | 9 | 23% |
| 2 | 1600 | R Lingual Gyrus | 20 | −96 | 4 | 2.92 | 5.36 | 8 | 21% |
| 3 | 1568 | L Fusiform Gyrus | −46 | −68 | −6 | 2.73 | 5.02 | 8 | 21% |
| 4 | 1568 | L Insula | −38 | −6 | 6 | 4.53 | 7.13 | 9 | 23% |
| 5 | 1560 | R Fusiform Gyrus | 50 | −60 | −12 | 3.23 | 5.65 | 7 | 18% |
| 6 | 1160 | R Insula | 40 | −4 | 4 | 3.62 | 6.11 | 8 | 21% |
| 7 | 1144 | R Orbitofrontal Cortex | 28 | 32 | −16 | 2.24 | 4.37 | 8 | 21% |
| Obesity | |||||||||
| 1 | 1680 | L Orbitofrontal Cortex | −26 | 34 | −16 | 2.56 | 5.33 | 6 | 35% |
| 2 | 1344 | L Lingual Gyrus | −16 | −100 | −4 | 1.96 | 4.47 | 6 | 35% |
| 3 | 1000 | R Orbitofrontal Cortex | 32 | 28 | −14 | 1.96 | 4.48 | 4 | 24% |
| 4 | 928 | Anterior Cingulate Cortex | 0 | 36 | 14 | 2.15 | 4.75 | 5 | 29% |
| Cluster | Cluster Size (mm3) | Brain Region | Peak Voxel MNI Coordinates | ALE Value (×10−2)/Z | ||
|---|---|---|---|---|---|---|
| X | Y | Z | ||||
| Obesity ∩ Normal-weight | 1232 | L Orbitofrontal Cortex | −26 | 34 | −16 | 2.56 |
| 544 | R Orbitofrontal Cortex | 30 | 30 | −14 | 1.80 | |
| Obesity > Normal-weight | None | |||||
| Obesity < Normal-weight | None | |||||
| Obesity/overweight ∩ Normal-weight | 1344 | L Orbitofrontal Cortex | −26 | 34 | −14 | 3.53 |
| 904 | L insula | −38 | −6 | 2 | 3.06 | |
| 864 | L Fusiform Gyrus | −46 | −68 | −6 | 2.73 | |
| 784 | R Fusiform Gyrus | 48 | −64 | −10 | 2.61 | |
| 712 | R Orbitofrontal Cortex | 28 | 32 | −14 | 2.15 | |
| Obesity/overweight > Normal-weight | 584 | L Culmen | 27 | −53.8 | −13.7 | 3.19 |
| 208 | R Culmen | −26 | −58 | −16 | 2.66 | |
| Obesity/overweight < Normal-weight | None | |||||
Publisher’s Note: MDPI stays neutral with regard to jurisdictional claims in published maps and institutional affiliations. |
© 2021 by the authors. Licensee MDPI, Basel, Switzerland. This article is an open access article distributed under the terms and conditions of the Creative Commons Attribution (CC BY) license (https://creativecommons.org/licenses/by/4.0/).
Share and Cite
Yang, Y.; Wu, Q.; Morys, F. Brain Responses to High-Calorie Visual Food Cues in Individuals with Normal-Weight or Obesity: An Activation Likelihood Estimation Meta-Analysis. Brain Sci. 2021, 11, 1587. https://doi.org/10.3390/brainsci11121587
Yang Y, Wu Q, Morys F. Brain Responses to High-Calorie Visual Food Cues in Individuals with Normal-Weight or Obesity: An Activation Likelihood Estimation Meta-Analysis. Brain Sciences. 2021; 11(12):1587. https://doi.org/10.3390/brainsci11121587
Chicago/Turabian StyleYang, Yingkai, Qian Wu, and Filip Morys. 2021. "Brain Responses to High-Calorie Visual Food Cues in Individuals with Normal-Weight or Obesity: An Activation Likelihood Estimation Meta-Analysis" Brain Sciences 11, no. 12: 1587. https://doi.org/10.3390/brainsci11121587