Author Contributions
Conceptualization, J.L.P. and M.O.; methodology, K.P.M., B.P. and M.O.; software, M.O.; validation, M.O.; formal analysis, K.P.M., B.P. and M.O.; data curation, K.P.M., B.P. and M.O.; writing—original draft preparation, K.P.M.; writing—review and editing, K.P.M., B.P., J.L.P. and M.O.; supervision, J.L.P. and M.O.; project administration, M.O.; funding acquisition, J.L.P. All authors have read and agreed to the published version of the manuscript.
Figure 1.
Principal component analysis of libraries sequenced for RNA-seq for tissues isolated at (A) E15, (B) E17, and (C) E20.
Figure 1.
Principal component analysis of libraries sequenced for RNA-seq for tissues isolated at (A) E15, (B) E17, and (C) E20.
Figure 2.
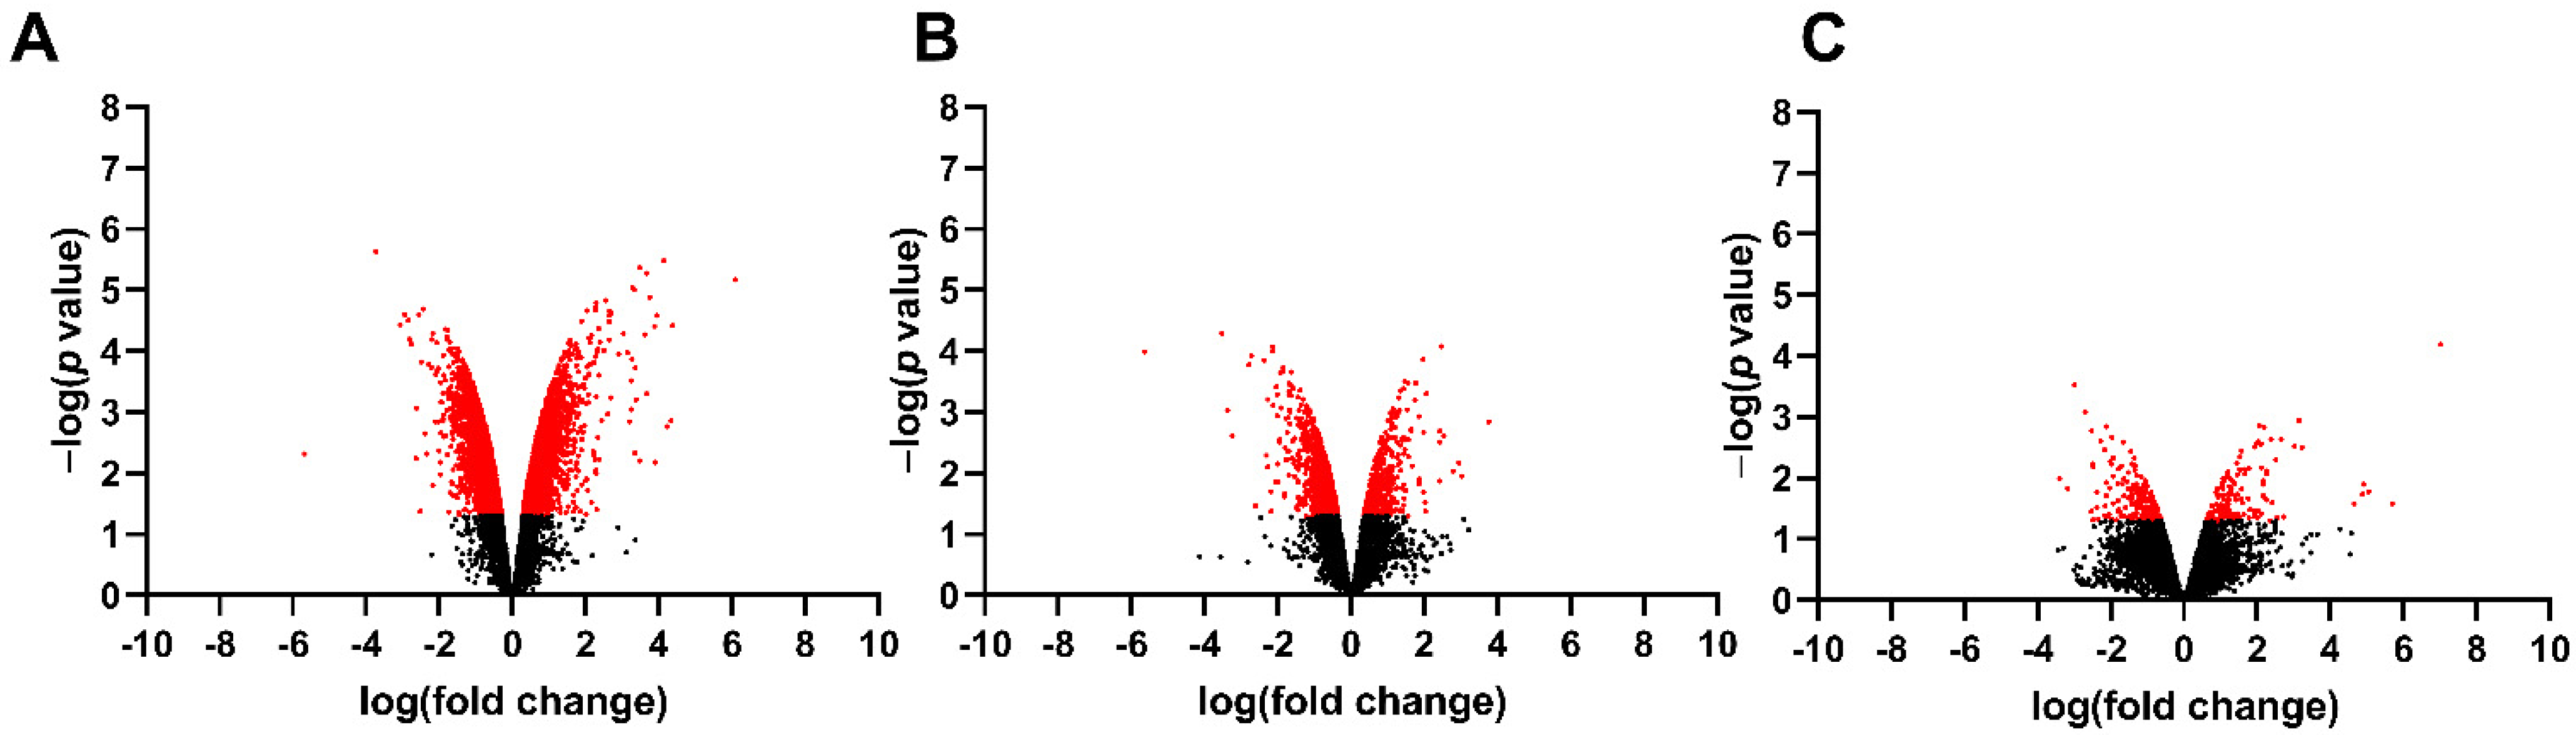
Volcano plot illustrating RNA-seq data of fetal spinal cords isolated from MMC and vehicle at (A) E15, (B) E17, and (C) E20. Red identifies genes that were greater than 1.5-fold change and p < 0.05.
Figure 2.
Volcano plot illustrating RNA-seq data of fetal spinal cords isolated from MMC and vehicle at (A) E15, (B) E17, and (C) E20. Red identifies genes that were greater than 1.5-fold change and p < 0.05.
Figure 3.
Volcano plot illustrating RNA-seq data of fetal spinal cords isolated from MMC and control at (A) E15, (B) E17, and (C) E20. Red identifies genes that were greater than 1.5-fold change and p < 0.05.
Figure 3.
Volcano plot illustrating RNA-seq data of fetal spinal cords isolated from MMC and control at (A) E15, (B) E17, and (C) E20. Red identifies genes that were greater than 1.5-fold change and p < 0.05.
Figure 4.
Volcano plot illustrating RNA-seq data of fetal spinal cords isolated from control and vehicle at (A) E15, (B) E17, and (C) E20. Red identifies genes that were greater than 1.5-fold change and p < 0.05.
Figure 4.
Volcano plot illustrating RNA-seq data of fetal spinal cords isolated from control and vehicle at (A) E15, (B) E17, and (C) E20. Red identifies genes that were greater than 1.5-fold change and p < 0.05.
Figure 5.
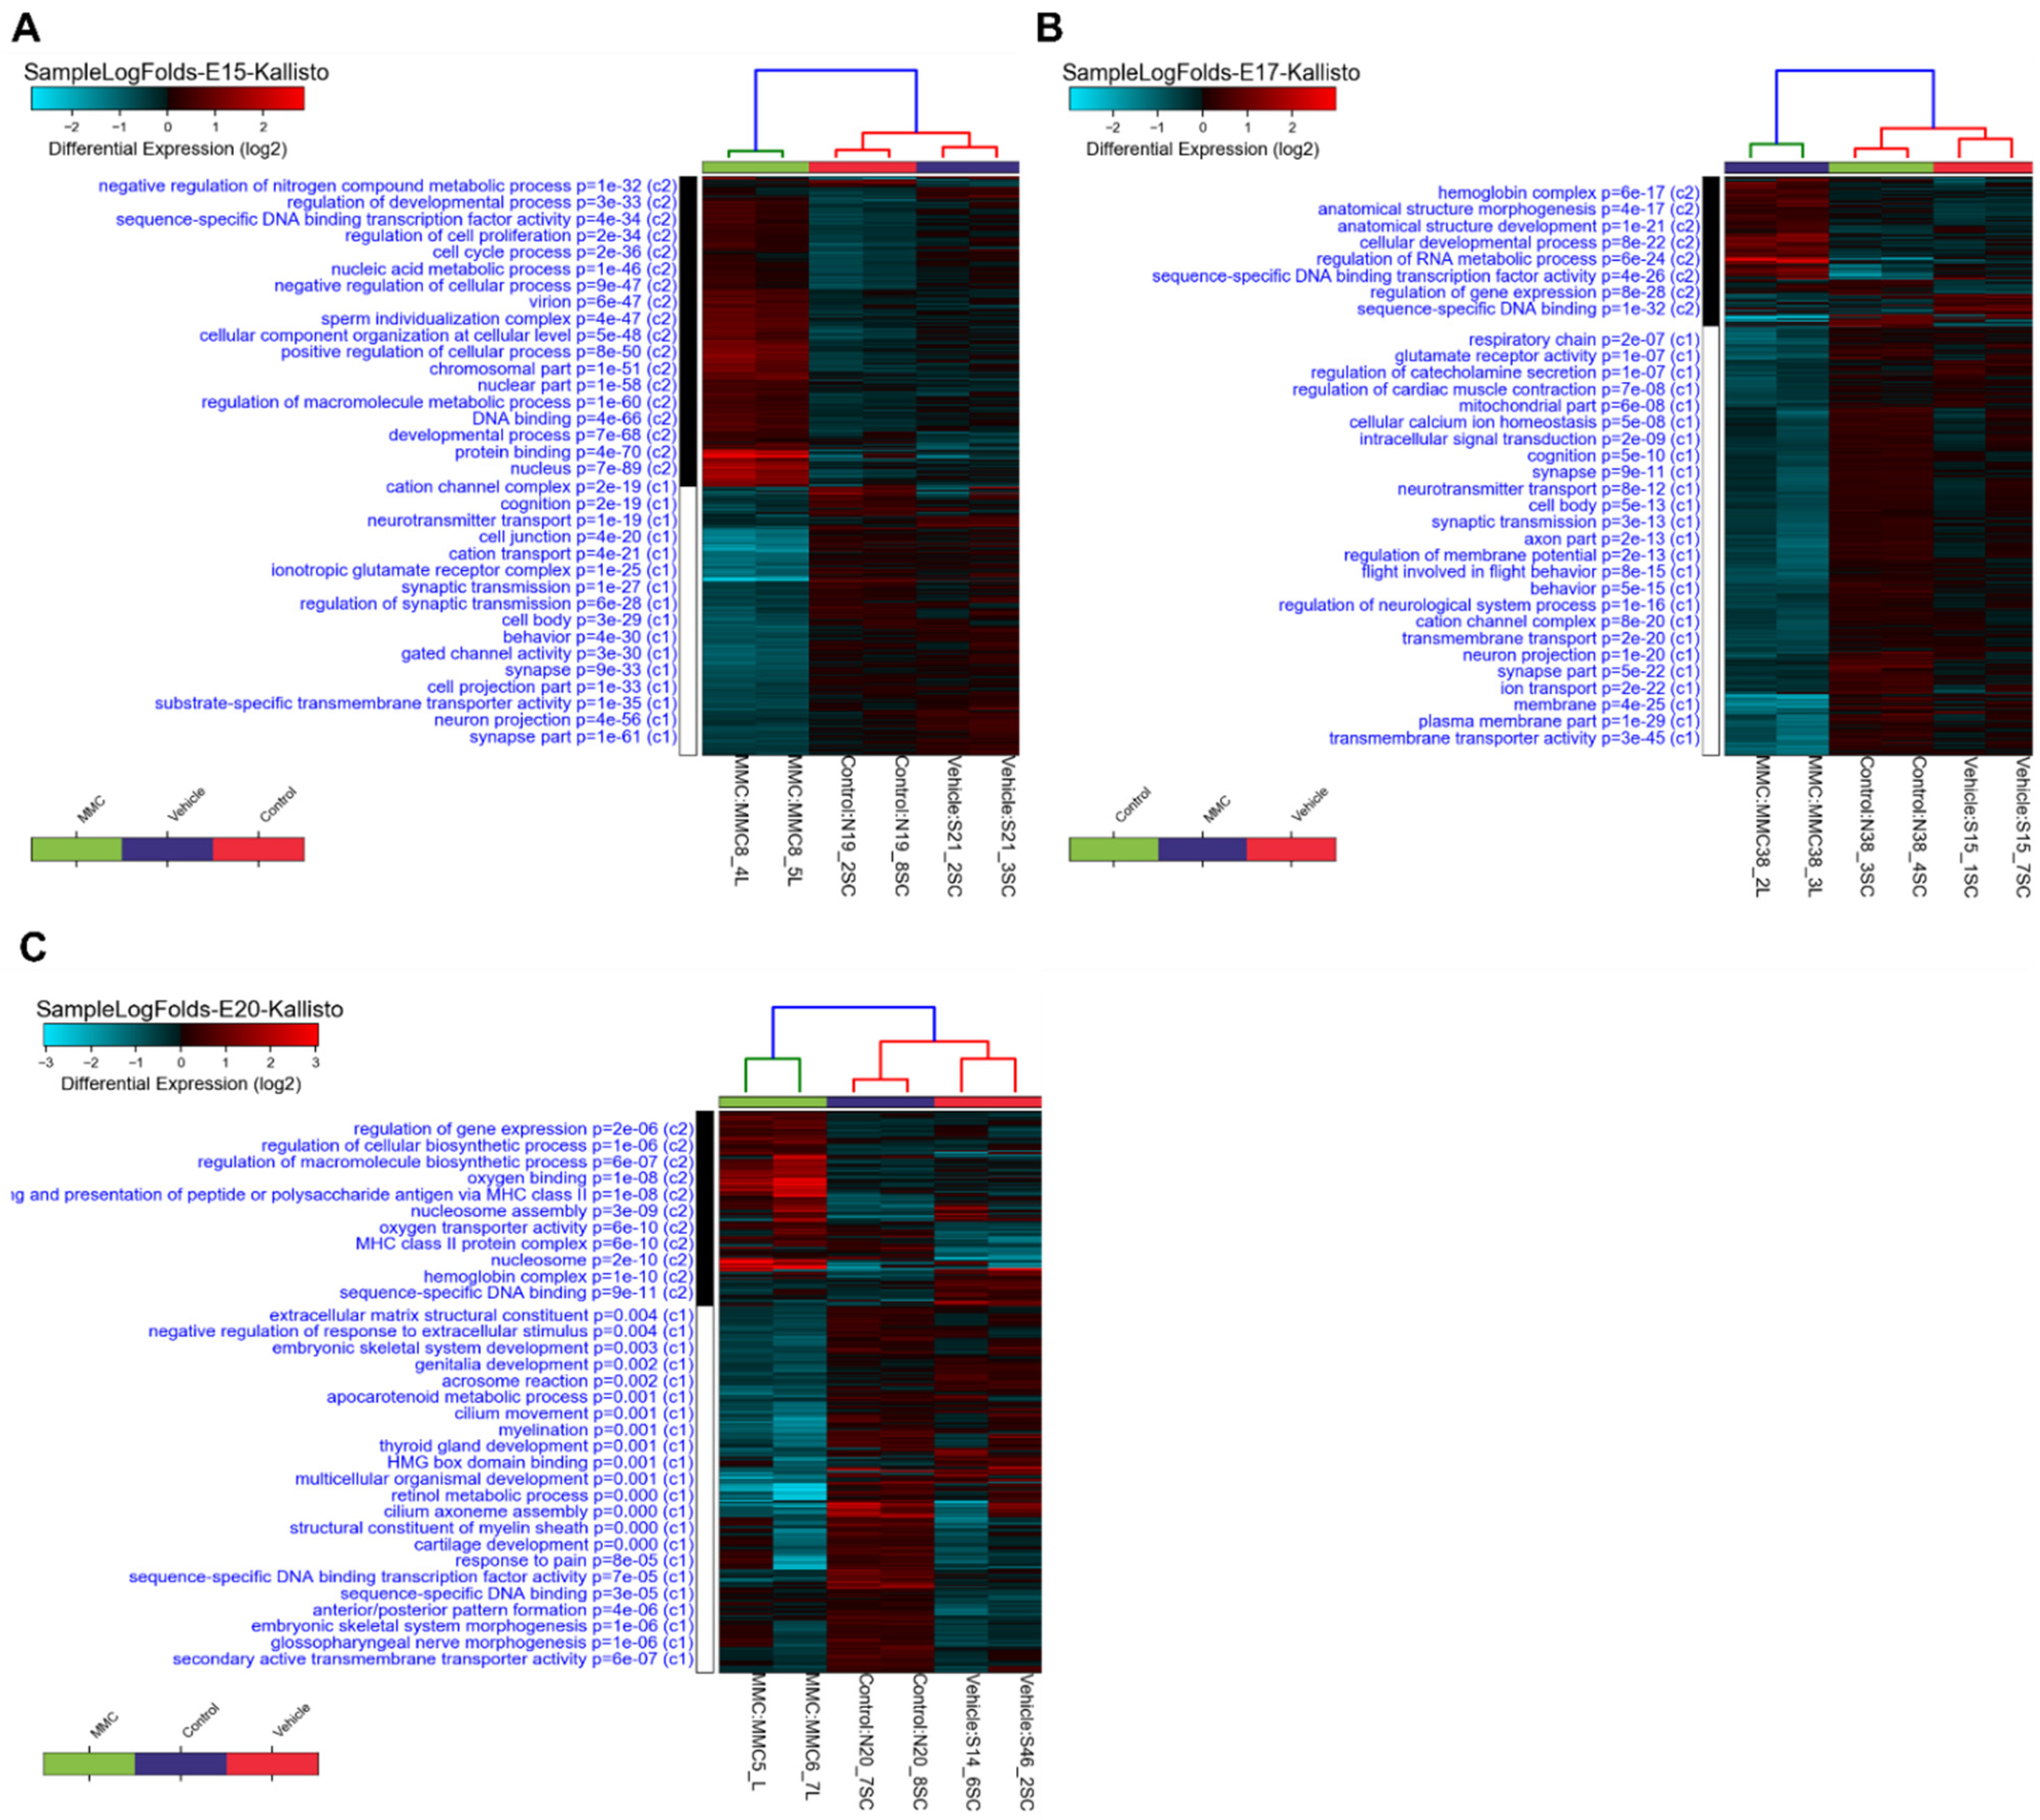
Hierarchical clustering analysis of differentially expressed genes in the spinal cord of MMC, vehicle, and control fetuses isolated at (A) E15, (B) E17, and (C) E20.
Figure 5.
Hierarchical clustering analysis of differentially expressed genes in the spinal cord of MMC, vehicle, and control fetuses isolated at (A) E15, (B) E17, and (C) E20.
Figure 6.
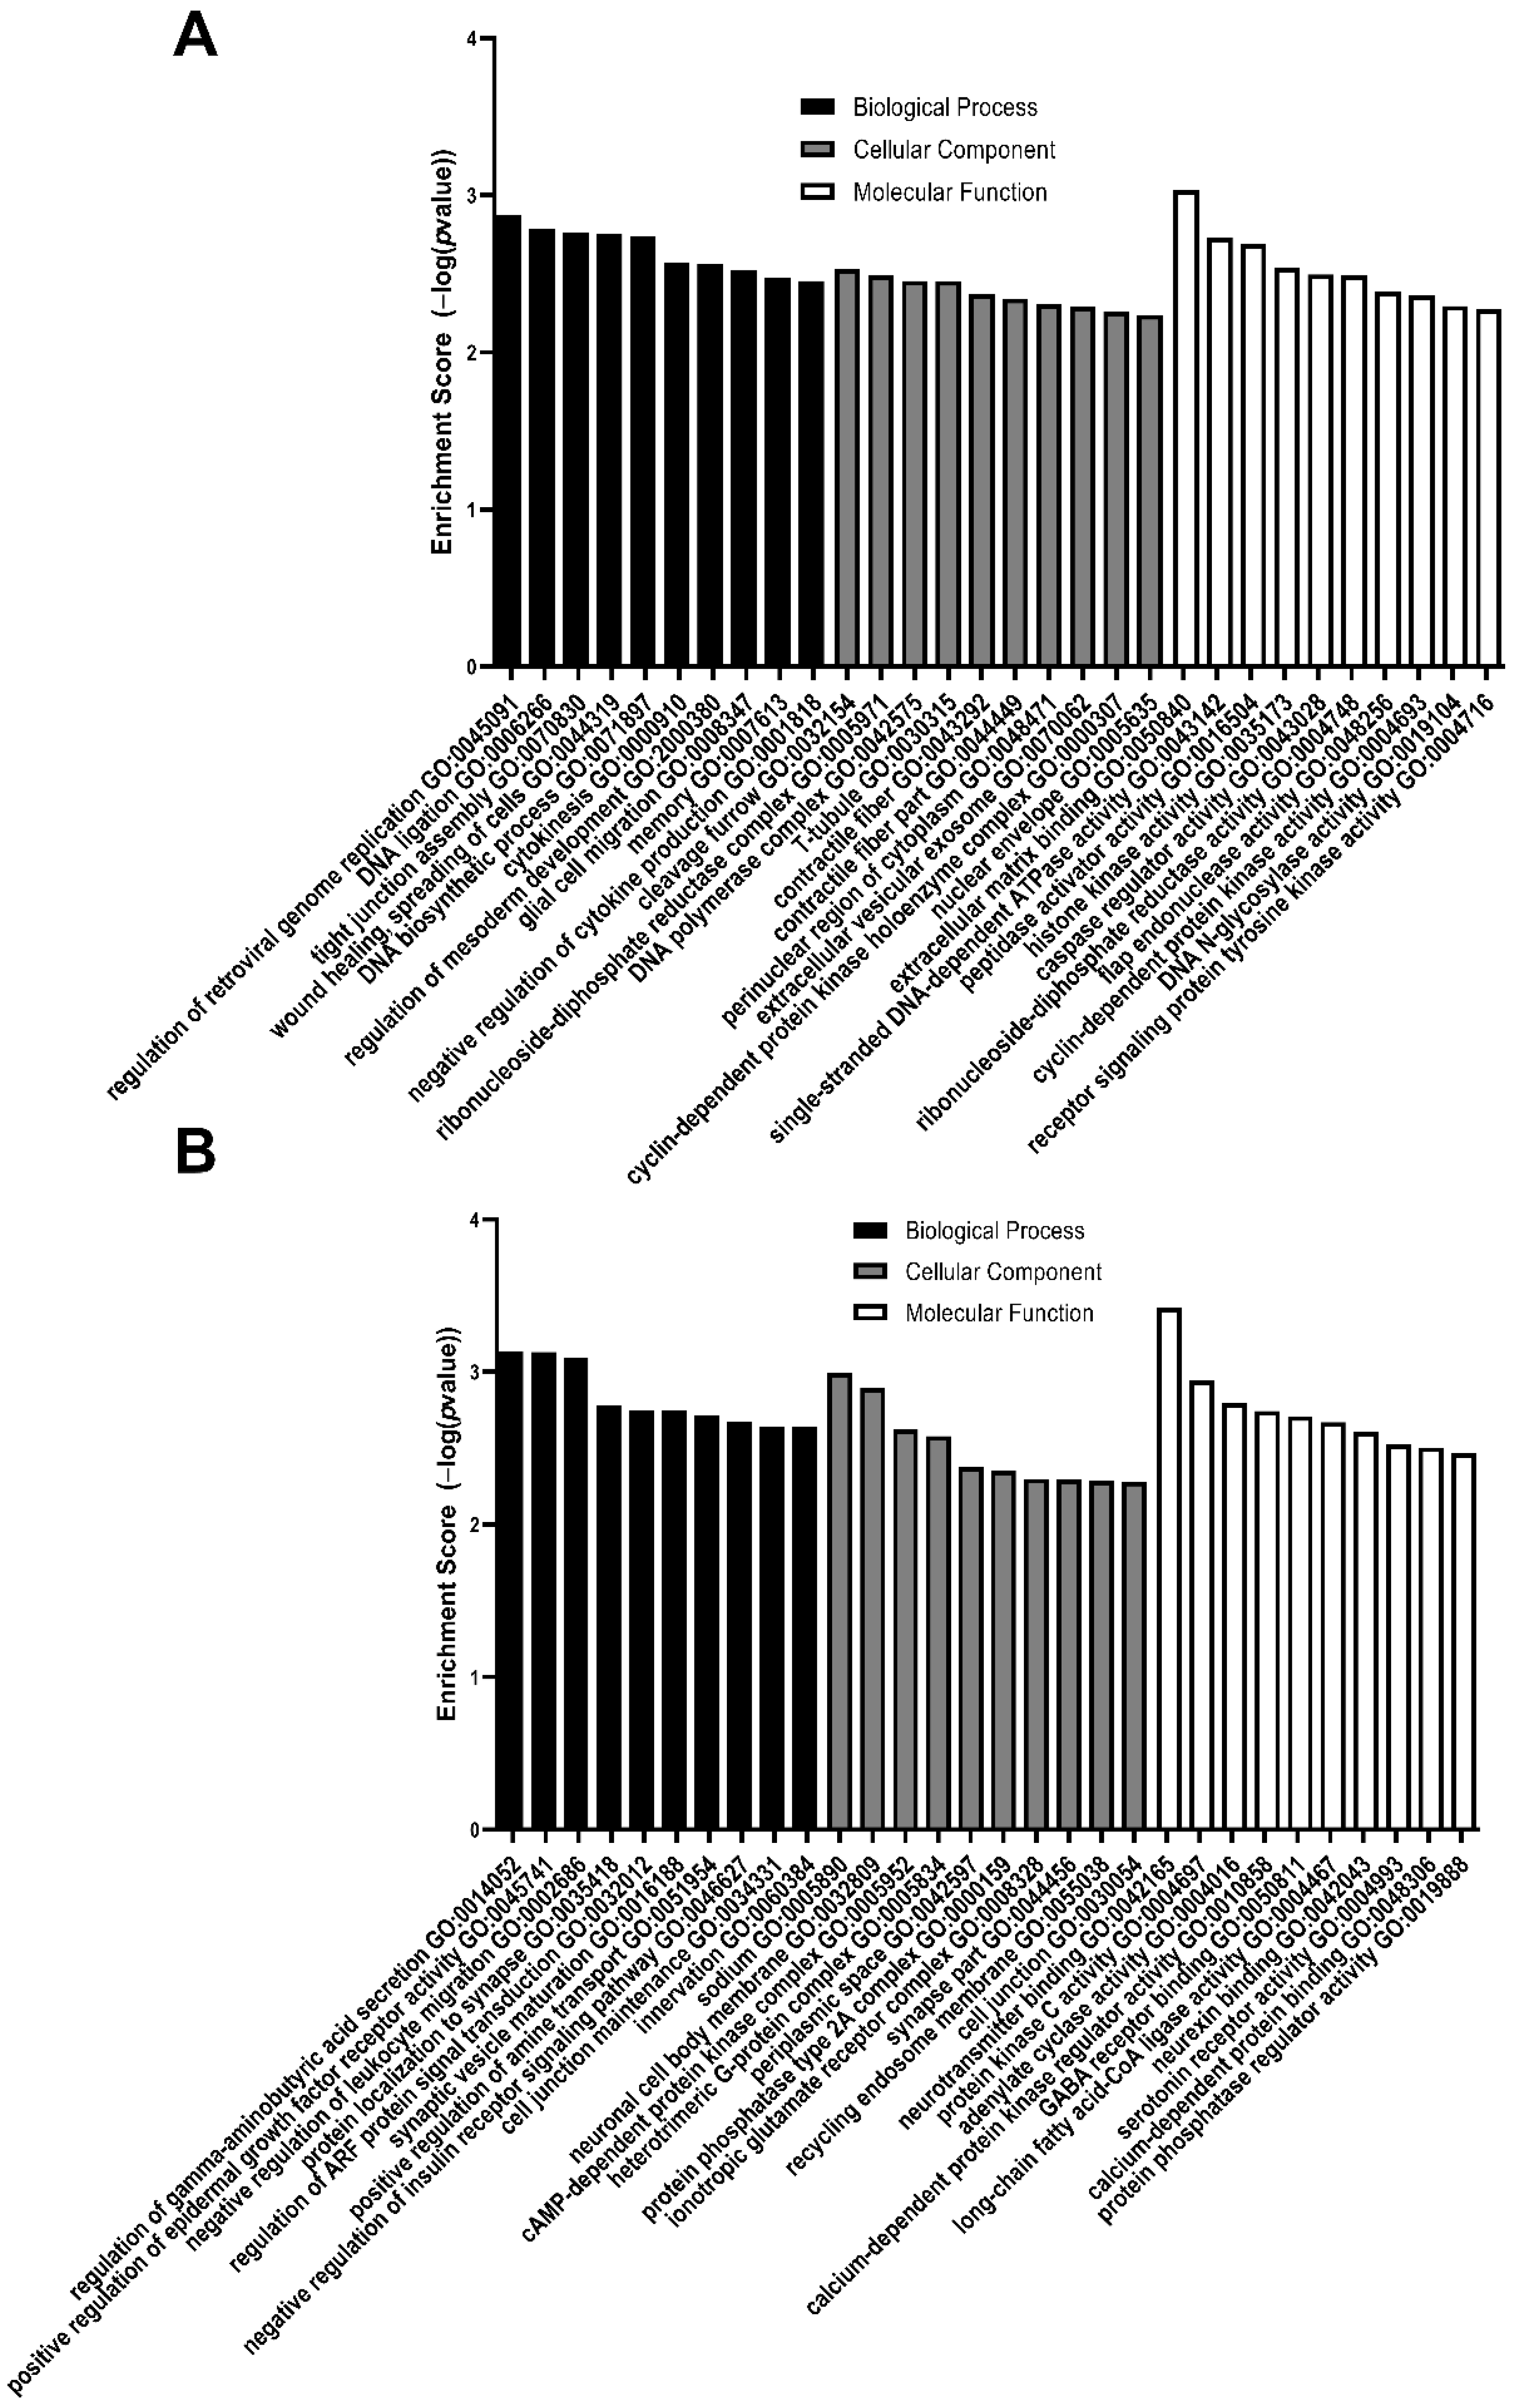
Enrichment scores of the top 10 GO biological processes, cellular components, and molecular function enriched from differentially expressed genes that are (A) upregulated or (B) downregulated in MMC spinal cords compared to vehicle at E15. All GO pathways were >1.5-fold and p < 0.05.
Figure 6.
Enrichment scores of the top 10 GO biological processes, cellular components, and molecular function enriched from differentially expressed genes that are (A) upregulated or (B) downregulated in MMC spinal cords compared to vehicle at E15. All GO pathways were >1.5-fold and p < 0.05.
Figure 7.
Enrichment scores of the top 10 GO biological processes, cellular components, and molecular function enriched from differentially expressed genes that are (A) upregulated or (B) downregulated in MMC spinal cords compared to vehicle at E17. All GO pathways were >1.5-fold and p < 0.05.
Figure 7.
Enrichment scores of the top 10 GO biological processes, cellular components, and molecular function enriched from differentially expressed genes that are (A) upregulated or (B) downregulated in MMC spinal cords compared to vehicle at E17. All GO pathways were >1.5-fold and p < 0.05.
Figure 8.
Enrichment scores of the top 10 GO biological processes, cellular components, and molecular function enriched from differentially expressed genes that are (A) upregulated or (B) downregulated in MMC spinal cords compared to vehicle at E20. All GO pathways were >1.5-fold and p < 0.05.
Figure 8.
Enrichment scores of the top 10 GO biological processes, cellular components, and molecular function enriched from differentially expressed genes that are (A) upregulated or (B) downregulated in MMC spinal cords compared to vehicle at E20. All GO pathways were >1.5-fold and p < 0.05.
Figure 9.
KEGG and protein–protein interaction network analysis of differentially expressed genes in the spinal cord of MMC and vehicle fetuses isolated at E15. (A) Top 10 KEGG pathways upregulated and downregulated as determined by percent total changed genes in each pathway. All pathways were greater than 1.5-fold change and p < 0.05. (B,C) Protein–protein interaction network analysis based on top 25 (B) upregulated and (C) downregulated differentially expressed genes.
Figure 10.
KEGG and protein–protein interaction network analysis of differentially expressed genes in the spinal cord of MMC and vehicle fetuses isolated at E17. (A) Top 10 KEGG pathways upregulated and downregulated as determined by percent total changed genes in each pathway. All pathways were greater than 1.5-fold change and p < 0.05. (B,C) Protein–protein interaction network analysis based on top 25 (B) upregulated and (C) downregulated differentially expressed genes.
Figure 11.
KEGG and protein–protein interaction network analysis of differentially expressed genes in the spinal cord of MMC and vehicle fetuses isolated at E20. (A) Top 10 KEGG pathways upregulated and downregulated as determined by percent total changed genes in each pathway. All pathways were greater than 1.5-fold change and p < 0.05. (B,C) Protein–protein interaction network analysis based on top 25 (B) upregulated and (C) downregulated differentially expressed genes.
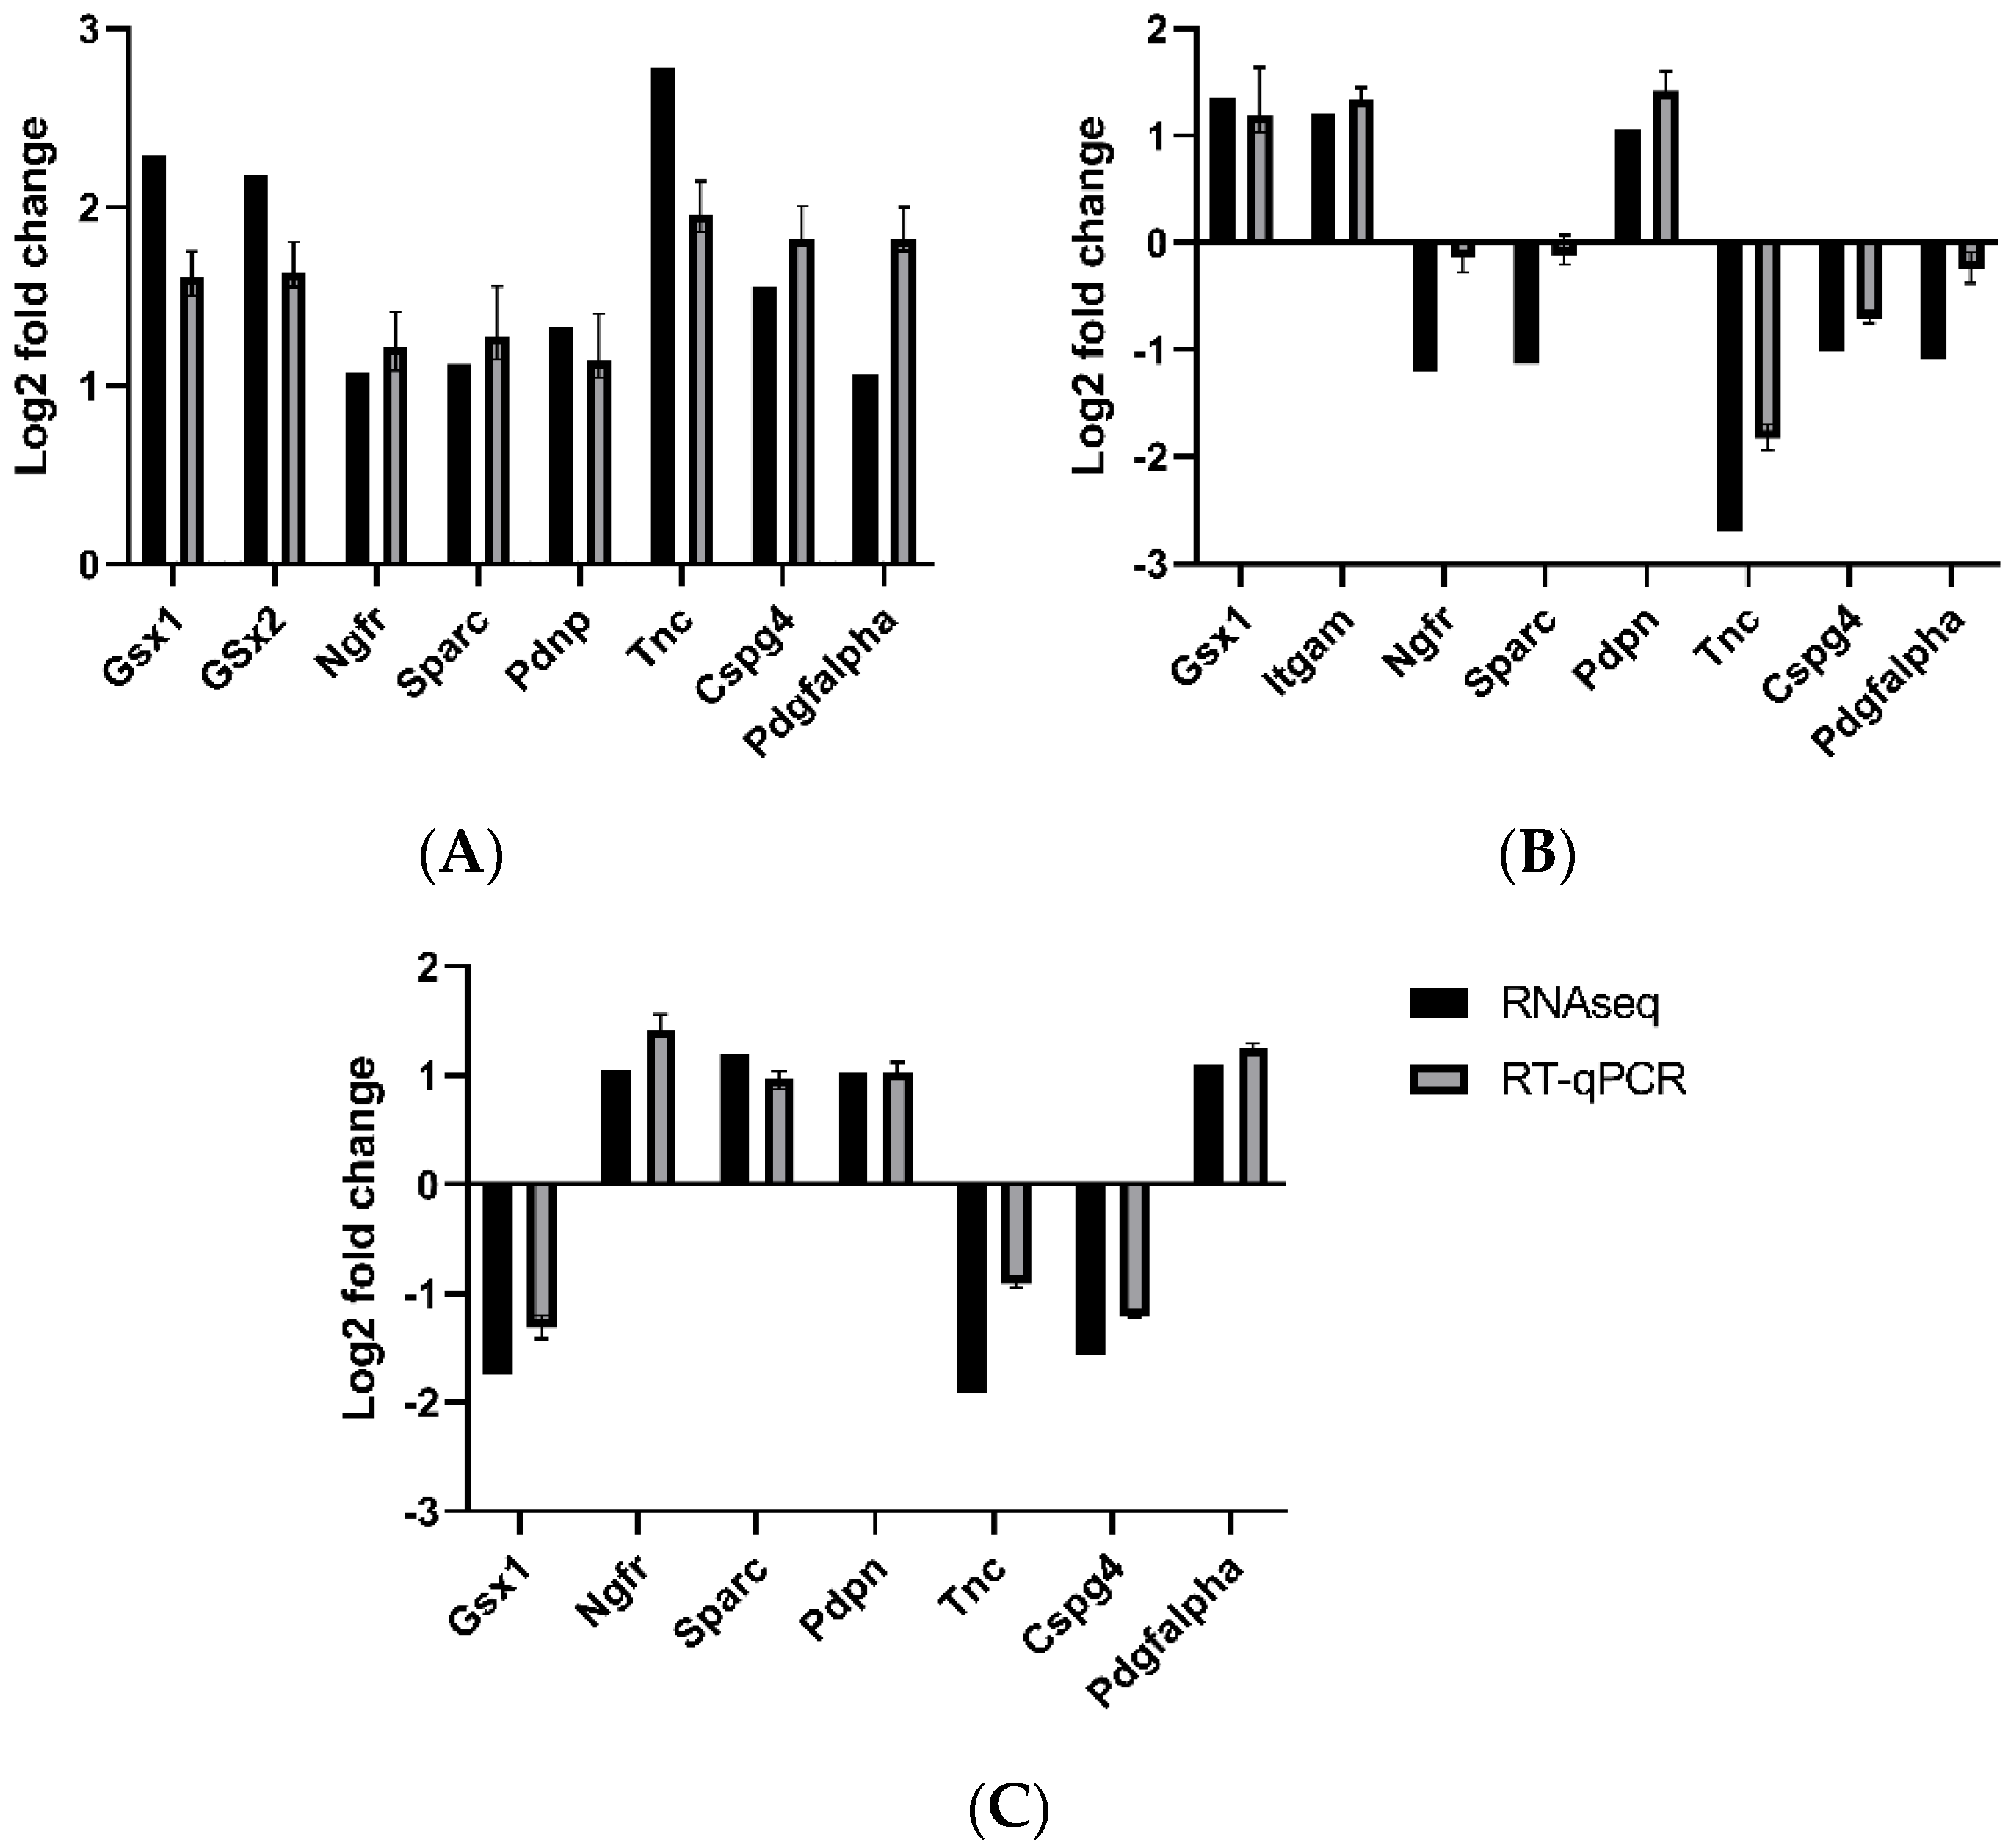
Figure 12.
Comparison between RNA sequencing results and RT-qPCR between MMC and vehicle at (A) E15, (B) E17, and (C) E20.
Figure 12.
Comparison between RNA sequencing results and RT-qPCR between MMC and vehicle at (A) E15, (B) E17, and (C) E20.
Table 1.
TaqMan probes used for RT-qPCR analysis.
Table 1.
TaqMan probes used for RT-qPCR analysis.
| mRNA | Name | * Assay Code Number |
|---|
| Gsx1 | GS Homeobox1 | Rn01412792_g1 |
| Gsx2 | GS Homeobox2 | Rn03810223_m1 |
| Ngfr | Nerve Growth Factor Receptor | Rn00561634_m1 |
| Sparc | Secreted Protein, Acidic, Cysteine-Rich | Rn01470624_m1 |
| Pdpn | Podoplanin | Rn00571195_m1 |
| Hprt1 | Hypoxanthine Phosphoribosyl Transferase 1 | Rn01527840_m1 |
| Tnc | Tenascin C | Rn01454948_m1 |
| Pdgfa | Platelet-Derived Growth Factor Polypeptide | Rn00709363_m1 |
Table 2.
Number of differentially expressed genes identified as >1.5-fold change and p < 0.05 and % of total differentially expressed genes up- or downregulated.
Table 2.
Number of differentially expressed genes identified as >1.5-fold change and p < 0.05 and % of total differentially expressed genes up- or downregulated.
| | E15 | E17 | E20 |
|---|
| | Total | Upregulated | Downregulated | Total | Upregulated | Downregulated | Total | Upregulated | Downregulated |
| MMC vs. Vehicle | 3022 | 1324 (44%) | 1698 (56%) | 1167 | 312 (27%) | 855 (73%) | 302 | 133 (44%) | 169 (56%) |
| MMC vs. Control | 3777 | 2119 (56%) | 1658 (44%) | 1847 | 264 (14%) | 1583 (86%) | 469 | 154 (33%) | 315 (67%) |
| Control vs. Vehicle | 505 | 147 (29%) | 358 (71%) | 327 | 117 (56%) | 210 (44%) | 355 | 269 (76%) | 86 (24%) |
Table 3.
Top 25 upregulated and downregulated genes between MMC and vehicle groups at E15.
Table 3.
Top 25 upregulated and downregulated genes between MMC and vehicle groups at E15.
| Gene Symbol | Full Gene Name | Fold Change | p Value |
|---|
| Actc1 | Actin, alpha cardiac muscle 1 | 68.26 | |
| Tnni1 | Troponin I, slow skeletal muscle | 20.94 | |
| Rps20 | 40S ribosomal protein S20 | 20.21 | |
| Myh3 | Myosin-3 | 17.56 | |
| Tnnc2 | Troponin C, skeletal muscle | 15.43 | |
| Krt5 | Keratin, type II cytoskeletal 5 | 14.95 | |
| Myl1 | Myosin light chain 1/3, skeletal muscle isoform | 14.81 | |
| Myog | Myogenin | 13.50 | |
| Cxcl14 | C-X-C motif chemokine 14 precursor | 12.76 | |
| Twist2 | Twist-related protein 2 | 12.62 | |
| Tnnt1 | Troponin T, slow skeletal muscle | 12.24 | |
| Smoc2 | SPARC-related modular calcium-binding protein 2
precursor | 11.22 | |
| Fam167b | Family with sequence similarity 167, member B | 10.45 | |
| Agtr2 | Type-2 angiotensin II receptor | 10.28 | |
| Krt14 | Keratin, type I cytoskeletal 14 | 10.22 | |
| Myod1 | Myoblast determination protein 1 | 10.01 | |
| Kremen2 | Kremen protein 2 precursor | 9.82 | |
| Myl4 | Myosin light chain 4 | 9.67 | |
| Pitx1 | Pituitary homeobox 1 | 9.57 | |
| Hand2 | Heart- and neural crest derivatives-expressed protein 2 | 9.45 | |
| Krt15 | Keratin, type I cytoskeletal 15 | 9.23 | |
| Mylpf | Myosin regulatory light chain 2, skeletal muscle isoform | 8.91 | |
| Actn2 | Actinin alpha 2 | 7.50 | |
| Acta1 | Actin, alpha skeletal muscle | 6.50 | |
| Tbx15 | T-box transcription factor TBX15 | 6.44 | |
| EF1A | Elongation factor 1-alpha | −51.18 | |
| Lynx1 | Ly-6/neurotoxin-like protein 1 precursor | −13.24 | |
| Necab1 | N-terminal EF-hand calcium-binding protein 1 | −8.35 | |
| Slc6a13 | Sodium- and chloride-dependent GABA transporter 2 | −7.65 | |
| Bcan | Brevican core protein isoform 1 precursor | −7.18 | |
| Slc13a4 | Solute carrier family 13 member 4 precursor | −7.01 | |
| Clec3b | C-type lectin domain family 3, member b | -6.78 | |
| Hoxc8 | Homeobox protein Hox-C8 | −6.15 | |
| Slc6a11 | Sodium- and chloride-dependent GABA transporter 3 | −5.85 | |
| S100b | Protein S100-B | −5.63 | |
| Grm5 | Metabotropic glutamate receptor 5 | −5.40 | |
| Slc22a6 | Solute carrier family 22 member 6 | −4.86 | |
| Ptgds | Prostaglandin-H2 D-isomerase | −4.63 | |
| Vsnl1 | Visinin-like protein 1 | −4.61 | |
| Slc16a11 | Solute carrier family 16, member 11 | −4.26 | |
| Ccl19 | C-C motif chemokine 19 precursor | −4.20 | |
| Park2 | E3 ubiquitin-protein ligase parkin | −4.19 | |
| Cdh8 | Cadherin-8 precursor | −3.90 | |
| Sncb | Beta-synuclein | −3.80 | |
| Fmod | Fibromodulin precursor | −3.73 | |
| Hs6st3 | Heparan-sulfate 6-O-sulfotransferase 3 precursor | −3.72 | |
| Cyp26b1 | Cytochrome P450 26B1 | −3.69 | |
| Tac1 | Protachykinin-1 Substance P Neurokinin A Neuropeptide K Neuropeptide gamma C-terminal-flanking peptide | −3.69 | |
| Olig1 | Oligodendrocyte transcription factor 1 | −3.64 | |
| Chd5 | Chromodomain-helicase-DNA-binding protein 5 | −3.63 | |
Table 4.
Top 25 upregulated and downregulated genes between MMC and vehicle groups at E17.
Table 4.
Top 25 upregulated and downregulated genes between MMC and vehicle groups at E17.
| Gene Symbol | Full Gene Name | Fold Change | p Value |
|---|
| Fam167b | Family with sequence similarity 167, member B | 8.18 | |
| Hoxc11 | Homeobox C11 | 7.72 | |
| Fam50a | Protein Fam50a | 6.96 | |
| Dbx1 | Homeobox protein DBX1 | 5.82 | |
| Capg | Macrophage-capping protein | 5.59 | |
| Hoxa11 | Protein Hoxa10 | 5.40 | |
| Tmem200b | Transmembrane protein 200B | 4.16 | |
| Cox6a2 | Cytochrome c oxidase subunit 6A2, mitochondrial | 4.06 | |
| Hbb-b2 | Hemoglobin subunit beta-2 | 3.97 | |
| Plvap | Plasmalemma vesicle-associated protein | 3.94 | |
| Hoxd12 | Homeo box D12 | 3.92 | |
| Rd3 | Retinal degeneration 3 | 3.67 | |
| Neurog2 | Protein Neurog2 | 3.67 | |
| Retsat | All-trans-retinol 13,14-reductase precursor | 3.41 | |
| Tnfrsf22 | Tumor necrosis factor superfamily member 22 | 3.37 | |
| Rps20 | 40S ribosomal protein S20 | 3.18 | |
| Hist1h2bc | Histone H2B | 3.14 | |
| Hoxc10 | Homeo box C10 | 3.13 | |
| Arx | Homeobox protein ARX | 2.97 | |
| ATP5F1E | ATP synthase subunit epsilon, mitochondrial | 2.96 | |
| Col15a1 | Collagen alpha-1(XV) chain precursor | 2.96 | |
| Hsd11b2 | Corticosteroid 11-beta-dehydrogenase isozyme 2 | 2.95 | |
| Wt1 | Wilms tumor protein homolog | 2.90 | |
| Hoxd10 | Homeo box D10 | 2.82 | |
| Cebpa | CCAAT/enhancer-binding protein alpha | 2.81 | |
| Ptgds | Prostaglandin-H2 D-isomerase | −49.27 | |
| Gm10068 | Chromobox 3, pseudogene 7 | −11.56 | 5.10 × 10⁻⁵ |
| Eno2 | Enolase 2 | −9.46 | |
| Calca | Calcitonin | −6.91 | |
| SDHAF1 | Succinate dehydrogenase assembly factor 1 | −6.07 | |
| Defb10 | Beta-defensin 10 | -5.15 | |
| Lynx1 | Ly-6/neurotoxin-like protein 1 precursor | −4.83 | |
| Reg3b | Regenerating islet-derived protein 3-beta | −4.55 | |
| Slc22a6 | Solute carrier family 22 member 6 | −4.41 | |
| Hoxc8 | Homeobox protein Hox-C8 | −4.35 | |
| Hoxc5 | Homeo box C5 | −4.16 | |
| Uts2d | Urotensin-2B | −4.06 | |
| Slc13a4 | Solute carrier family 13 member 4 precursor | −4.06 | |
| Gng4 | Guanine nucleotide-binding protein subunit gamma 4 | −4.01 | |
| NUPR1 | Nuclear protein 1 | −3.83 | |
| Slc6a13 | Sodium- and chloride-dependent GABA transporter 2 | −3.82 | |
| Nefh | Neurofilament heavy polypeptide | −3.73 | |
| Calcb | Calcitonin gene-related peptide 2 precursor | −3.62 | |
| Asgr1 | Asialoglycoprotein receptor 1 | −3.60 | |
| Gng13 | Guanine nucleotide binding protein, gamma 13 | −3.48 | |
| Ccl19 | C-C motif chemokine 19 precursor | −3.44 | |
| Hoxc6 | Homeo box C6 | −3.33 | |
| Snhg11 | Small nucleolar RNA host gene 11 (non-protein coding) | −3.32 | |
| Gjb6 | Gap junction beta-6 protein | −3.30 | |
| Synpr | Synaptoporin | −3.29 | |
Table 5.
Top 25 upregulated and downregulated genes between MMC and vehicle groups at E20.
Table 5.
Top 25 upregulated and downregulated genes between MMC and vehicle groups at E20.
| Gene Symbol | Full Gene Name | Fold Change | p Value |
|---|
| EF1A | Elongation factor 1-alpha | 129.91 | |
| Krt5 | Keratin, type II cytoskeletal 5 | 51.61 | |
| Hoxc11 | Homeobox C11 | 29.97 | |
| HBB | Hemoglobin subunit beta-2 | 29.46 | |
| Krt14 | Keratin, type I cytoskeletal 14 | 25.30 | |
| Hoxa11 | Homeobox A11 | 9.35 | |
| RPS18 | 40S ribosomal protein S18 | 8.87 | |
| Hoxa11 | Protein Hoxa10; RCG52455 | 8.13 | |
| RT1-Da | RT1 class II, locus Da precursor | 6.32 | |
| MRPL36 | Mitochondrial ribosomal protein L36 | 5.85 | |
| Ntrk1 | High affinity nerve growth factor receptor | 5.70 | |
| Lgals3 | Galectin-3 | 5.36 | |
| Cd74 | H-2 class II histocompatibility antigen gamma chain | 5.23 | |
| FZD8 | Frizzled 8 | 4.84 | |
| Prdm12 | PR domain zinc finger protein 12 | 4.82 | |
| Tlx2 | T-cell leukemia, homeobox 2 | 4.82 | |
| Stfa2l1 | Stefin-3 | 4.70 | |
| Ccl12 | Chemokine (C-C motif) ligand 12 precursor | 4.52 | |
| Hcst | Hematopoietic cell signal transducer | 4.50 | |
| Tusc5 | Tumor suppressor candidate 5 homolog | 4.48 | |
| Scn10a | Sodium channel protein type 10 subunit alpha | 4.34 | |
| Slc2a3 | Solute carrier family 2, facilitated glucose transporter member 3 | 4.33 | |
| RT1-Bb | Rano class II histocompatibility antigen, B-1 beta chain precursor | 4.18 | |
| Fcnb | Ficolin-2 | 4.04 | |
| Sost | Sclerostin | 4.03 | |
| Pla2g3 | Group 3 secretory phospholipase A2 precursor | −9.01 | |
| Bcas1 | Breast carcinoma-amplified sequence 1 homolog | −5.78 | |
| Mbp | Myelin basic protein S | −5.72 | |
| Tnks2 | Tankyrase 2 | −5.59 | |
| Gpr17 | Uracil nucleotide/cysteinyl leukotriene receptor | −5.58 | |
| TSGA14 | Testis-Specific Gene A14 Protein | −5.56 | |
| Slc22a6 | Solute carrier family 22 member 6 | −5.19 | |
| Pnlip | Pancreatic triacylglycerol lipase precursor | −4.83 | |
| Slc6a13 | Sodium- and chloride-dependent GABA transporter 2 | −4.48 | |
| Ogn | Osteoglycin | −4.46 | |
| Paqr8 | Membrane progestin receptor beta | −4.44 | |
| Nkx6-2 | NK6 homeobox 2 | −4.35 | |
| Crygn | Gamma-crystallin N | −4.23 | |
| Scrg1 | Scrapie-responsive protein 1 | −4.09 | |
| Plp1 | Myelin proteolipid protein | −3.92 | |
| Zfp488 | Zinc Finger Protein 488 | −3.89 | |
| Fmod | Fibromodulin precursor | −3.80 | |
| Pmaip1 | Phorbol-12-myristate-13-acetate-induced protein 1 | −3.79 | |
| AKR1B10 | Aldo-keto reductase family 1, member B10 | −3.56 | |
| Fgf15 | Fibroblast growth factor 15 precursor | −3.50 | |
| Slc5a7 | High affinity choline transporter 1 | −3.47 | |
| Bmp6 | Bone morphogenetic protein 6 | −3.46 | |
| Lims2 | LIM and senescent cell antigen-like-containing domain protein 2 | −3.30 | |
| Pnpla1 | Patatin-like phospholipase domain-containing protein 1 | −3.29 | |
| Kcne1l | Potassium voltage-gated channel subfamily E member 1-like protein | −3.24 | |
Table 6.
Top 10 GO biological processes, cellular components, and molecular functions enriched from differentially expressed genes that are upregulated in MMC spinal cords compared to vehicle at E15. All GO pathways were >1.5-fold and p < 0.05.
Table 6.
Top 10 GO biological processes, cellular components, and molecular functions enriched from differentially expressed genes that are upregulated in MMC spinal cords compared to vehicle at E15. All GO pathways were >1.5-fold and p < 0.05.
| GO Biological Process | GO Cellular Component | GO Molecular Function |
|---|
| Regulation of retroviral genome replication | Cleavage furrow | Extracellular matrix binding |
| DNA ligation | Ribonucleoside-diphosphate reductase complex | Single-stranded DNA-dependent ATPase activity |
| Tight junction assembly | DNA polymerase complex | Peptidase activator activity |
| Wound healing, spreading of cells | T-tubule | Histone kinase activity |
| DNA biosynthetic process | Contractile fiber | Caspase regulator activity |
| Cytokinesis | Contractile fiber part | Ribonucleoside-diphosphate reductase activity |
| Regulation of mesoderm development | Perinuclear region of cytoplasm | Flap endonuclease activity |
| Glial cell migration | Extracellular vesicular exosome | Cyclin-dependent protein kinase activity |
| Memory | Cyclin-dependent protein kinase holoenzyme complex | DNA N-glycosylase activity |
| Negative regulation of cytokine production | Nuclear envelope | Receptor signaling protein tyrosine kinase activity |
Table 7.
Top 10 GO biological processes, cellular components, and molecular functions enriched from differentially expressed genes that are downregulated in MMC spinal cords compared to vehicle at E15. All GO pathways were >1.5-fold and p < 0.05.
Table 7.
Top 10 GO biological processes, cellular components, and molecular functions enriched from differentially expressed genes that are downregulated in MMC spinal cords compared to vehicle at E15. All GO pathways were >1.5-fold and p < 0.05.
| GO Biological Process | GO Cellular Component | GO Molecular Function |
|---|
| Regulation of gamma-aminobutyric acid secretion | Sodium | Neurotransmitter binding |
Positive regulation of epidermal growth factor
receptor activity | Neuronal cell body membrane | Protein kinase C activity |
| Negative regulation of leukocyte migration | cAMP-dependent protein kinase complex | Adenylate cyclase activity |
| Protein localization to synapse | Heterotrimeric G-protein complex | Calcium-dependent protein kinase regulator activity |
Regulation of ARF protein
signal transduction | Periplasmic space | GABA receptor binding |
| Synaptic vesicle maturation | Protein phosphatase type 2A complex | Long-chain fatty acid-CoA ligase activity |
| Positive regulation of amine transport | Ionotropic glutamate receptor complex | Neurexin binding |
| Negative regulation of insulin receptor signaling pathway | Synapse part | Serotonin receptor activity |
| Cell junction maintenance | Recycling endosome membrane | Calcium-dependent protein binding |
| Innervation | Cell junction | Protein phosphatase regulator activity |
Table 8.
Top 10 GO biological processes, cellular components, and molecular functions enriched from differentially expressed genes that are upregulated in MMC spinal cords compared to vehicle at E17. All GO pathways were >1.5-fold and p < 0.05.
Table 8.
Top 10 GO biological processes, cellular components, and molecular functions enriched from differentially expressed genes that are upregulated in MMC spinal cords compared to vehicle at E17. All GO pathways were >1.5-fold and p < 0.05.
| GO Biological Process | GO Cellular Component | GO Molecular Function |
|---|
| Female pregnancy | Cortical cytoskeleton | mRNA 3′-UTR binding |
| Proximal/distal pattern formation | Myosin complex | Extracellular matrix structural constituent |
| Specification of loop of Henle identity | Stress fiber | Growth factor binding |
| Regulation of endocrine process | Nucleosome | Manganese ion binding |
| Platelet activation | Collagen | Protein dimerization activity |
| Somatic stem cell maintenance | Basement membrane | Hormone activity |
| Multicellular organism adhesion | Extracellular matrix | C2H2 zinc finger domain binding |
| Retinol metabolic process | Hemoglobin complex | Oxygen transporter activity |
| Endochondral ossification | Extracellular space | Oxygen binding |
| Negative regulation of cell fate specification | Nucleus | Actin filament binding |
Table 9.
Top 10 GO biological processes, cellular components, and molecular functions enriched from differentially expressed genes that are downregulated in MMC spinal cords compared to vehicle at E17. All GO pathways were >1.5-fold and p < 0.05.
Table 9.
Top 10 GO biological processes, cellular components, and molecular functions enriched from differentially expressed genes that are downregulated in MMC spinal cords compared to vehicle at E17. All GO pathways were >1.5-fold and p < 0.05.
| GO Biological Process | GO Cellular Component | GO Molecular Function |
|---|
| Regulation of response to food | Heterotrimeric G protein complex | Neuropeptide hormone activity |
| Gastric acid secretion | Perikaryon | Channel inhibitor activity |
| Negative regulation of tissue remodeling | Extrinsic to organelle membrane | GABA receptor binding |
| Neuronal action potential propagation | Endomembrane system | Retinoid binding |
| Peptide transport | Dendritic shaft | Neuropeptide receptor binding |
| Diol metabolic process | Axon part | Cyclic nucleotide binding |
| Regulation of cellular amine metabolic process | Myelin sheath | Tau protein binding |
| Regulation of glomerular filtration | Cell body | L amino acid transmembrane transporter activity |
| Negative regulation of muscle contraction | Extracellular region | Caspase regulator activity |
| Cellular glucose homeostasis | Ionotropic glutamate receptor complex | Oxidoreductase activity |
Table 10.
Top 10 GO biological processes, cellular components, and molecular functions enriched from differentially expressed genes that are upregulated in MMC spinal cords compared to vehicle at E20. All GO pathways were >1.5-fold and p < 0.05.
Table 10.
Top 10 GO biological processes, cellular components, and molecular functions enriched from differentially expressed genes that are upregulated in MMC spinal cords compared to vehicle at E20. All GO pathways were >1.5-fold and p < 0.05.
| GO Biological Process | GO Cellular Component | GO Molecular Function |
|---|
| Mechanical stimulus involved in sensory perception of pain | Lytic vacuole | Sodium channel activity |
| Antigen processing and presentation of antigen via MHC class II | External side of plasma membrane | Cytokine receptor binding |
| Cellular response to interferon-gamma | MHC class II protein complex | GTPase activity |
| Sodium ion transport | Integral to plasma membrane | Cytokine activity |
| Positive regulation of antigen processing and presentation | Vacuolar membrane | Sequence specific DNA binding |
| Regulation of cytokine production involved in immune response | Nucleosome | Sequence specific DNA binding transcription factor activity |
| Negative regulation of leukocyte activation | Cell surface | Ligand-gated ion channel activity |
| Regulation of T cell differentiation | Intracellular | Heme binding |
Negative regulation of
protein complex assembly | Extracellular region part | Structure specific DNA binding |
Regulation of alpha-beta
T cell activation | Keratin filament | Oxygen transporter activity |
Table 11.
Top 10 GO biological processes, cellular components, and molecular functions enriched from differentially expressed genes that are downregulated in MMC spinal cords compared to vehicle at E17. All GO pathways were >1.5-fold and p < 0.05.
Table 11.
Top 10 GO biological processes, cellular components, and molecular functions enriched from differentially expressed genes that are downregulated in MMC spinal cords compared to vehicle at E17. All GO pathways were >1.5-fold and p < 0.05.
| GO Biological Process | GO Cellular Component | GO Molecular Function |
|---|
| Response to toxin | Integral to plasma membrane | Carboxylic ester hydrolase activity |
| Myelination | Extracellular region | Carboxylic acid transmembrane transporter activity |
| Sterol transport | Caveola | Cytokine receptor binding |
| Regulation of symbiosis | Extracellular space | Amine transmembrane transporter activity |
| Negative regulation of neurogenesis | Extracellular matrix part | Voltage-gated ion channel activity |
| Regulation of cellular ketone metabolic process | Neuronal cell body | Secondary active transmembrane transporter activity |
| Regulation of steroid metabolic process | Extracellular matrix | Inorganic cation transmembrane transporter activity |
| Membrane organization | Nuclear membrane | Anion transmembrane transporter activity |
| Positive regulation of signal transduction | | Cytokine activity |
| Regulation of lipid transport | | |


