
Time-Frequency Characterization of Resting Brain in Bipolar Disorder during Euthymia—A Preliminary Study

 , , , , , , ,
Abstract
:1. Introduction
2. Methods
2.1. Participants
2.2. MRI Data Acquisition
2.3. fMRI Data Analysis
2.4. ALFF and f/ALFF Calculation
2.5. ReHo Calculation
2.6. Statistical Analyses
3. Results
3.1. One-Way ANCOVA
3.2. Post-Hoc Test
3.3. Typical ALFF Band: BD vs. HC
3.4. ALFF-Based FC Analysis
3.5. fALLF: BD vs. HC
3.6. ReHo: BD vs. HC
4. Discussion
5. Conclusions
Author Contributions
Funding
Institutional Review Board Statement
Informed Consent Statement
Data Availability Statement
Conflicts of Interest
References
- Olley, A.; Malhi, G.S.; Mitchell, P.B.; Batchelor, J.; Lagopoulos, J.; Austin, M.P.V. When euthymia is just not good enough: The neuropsychology of bipolar disorder. J. Nerv. Ment. Dis. 2005, 193, 323–330. [Google Scholar] [CrossRef]
- Syan, S.K.; Smith, M.; Frey, B.N.; Remtulla, R.; Kapczinski, F.; Hall, G.B.C.; Minuzzi, L. Resting-state functional connectivity in individuals with bipolar disorder during clinical remission: A systematic review. J. Psychiatry Neurosci. 2018, 43, 298–316. [Google Scholar] [CrossRef] [PubMed] [Green Version]
- Chrobak, A.; Bohaterewicz, B.; Tereszko, A.; Krupa, A.; Sobczak, A.; Ceglarek, A.; Wielgus, M.; Fafrowicz, M.; Siwek, M.; Marek, T.; et al. Altered functional connectivity among frontal eye fields, thalamus and cerebellum in bipolar disorder. Psychiatr. Pol. 2019, 133, 1–11. [Google Scholar] [CrossRef] [PubMed]
- Agcaoglu, O.; Wilson, T.W.; Wang, Y.P.; Stephen, J.; Calhoun, V.D. Resting state connectivity differences in eyes open versus eyes closed conditions. Hum. Brain Mapp. 2019, 40, 2488–2498. [Google Scholar] [CrossRef] [Green Version]
- Friston, K.J.; Frith, C.D.; Liddle, P.F.; Frackowiak, R.S.J. Functional connectivity: The principal-component analysis of large (PET) data sets. J. Cereb. Blood Flow Metab. 1993, 13, 5–14. [Google Scholar] [CrossRef] [PubMed]
- Yang, H.; Long, X.Y.; Yang, Y.; Yan, H.; Zhu, C.Z.; Zhou, X.P.; Zang, Y.F.; Gong, Q.Y. Amplitude of low frequency fluctuation within visual areas revealed by resting-state functional MRI. Neuroimage 2007, 36, 144–152. [Google Scholar] [CrossRef]
- Zou, Q.H.; Zhu, C.Z.; Yang, Y.; Zuo, X.N.; Long, X.Y.; Cao, Q.J.; Wang, Y.F.; Zang, Y.F. An improved approach to detection of amplitude of low-frequency fluctuation (ALFF) for resting-state fMRI: Fractional ALFF. J. Neurosci. Methods 2008, 172, 137–141. [Google Scholar] [CrossRef] [Green Version]
- Tadayonnejad, R.; Yang, S.; Kumar, A.; Ajilore, O. Clinical, cognitive, and functional connectivity correlations of resting-state intrinsic brain activity alterations in unmedicated depression. J. Affect. Disord. 2015, 172, 241–250. [Google Scholar] [CrossRef] [Green Version]
- Li, Y.; Yao, H.; Lin, P.; Zheng, L.; Li, C.; Zhou, B.; Wang, P.; Zhang, Z.; Wang, L.; An, N.; et al. Frequency-dependent altered functional connections of default mode network in Alzheimer’s disease. Front. Aging Neurosci. 2017, 9, 259. [Google Scholar] [CrossRef] [Green Version]
- Zuo, X.-N.; Di Martino, A.; Kelly, C.; Shehzad, Z.E.; Gee, D.G.; Klein, D.F.; Castellanos, F.X.; Biswal, B.B.; Milham, M.P. The oscillating brain: Complex and reliable. Neuroimage 2010, 49, 1432–1445. [Google Scholar] [CrossRef] [Green Version]
- Vargas, C.; López-Jaramillo, C.; Vieta, E. A systematic literature review of resting state network—functional MRI in bipolar disorder. J. Affect. Disord. 2013, 150, 727–735. [Google Scholar] [CrossRef]
- Zhang, B.; Wang, F.; Dong, H.-M.; Jiang, X.-W.; Wei, S.-N.; Chang, M.; Yin, Z.-Y.; Yang, N.; Zuo, X.-N.; XuTang, K.Y.-Q.; et al. Surface-based regional homogeneity in bipolar disorder: A resting-state fMRI study. Psychiatry Res. 2019, 278, 199–204. [Google Scholar] [CrossRef]
- Chepenik, L.G.; Raffo, M.; Hampson, M.; Lacadie, C.; Wang, F.; Jones, M.M.; Pittman, B.; Skudlarski, P.; Blumberg, H.P. Functional connectivity between ventral prefrontal cortex and amygdala at low frequency in the resting state in bipolar disorder. Psychiatry Res. Neuroimaging 2010, 182, 207–210. [Google Scholar] [CrossRef] [Green Version]
- Strakowski, S.M.; Adler, C.M.; Almeida, J.; Altshuler, L.L.; Blumberg, H.P.; Chang, K.D.; Delbello, M.P.; Frangou, S.; McIntosh, A.; Phillips, M.L.; et al. The functional neuroanatomy of bipolar disorder: A consensus model. Bipolar Disord. 2012, 14, 313–325. [Google Scholar] [CrossRef] [Green Version]
- Xu, K.; Liu, H.; Li, H.; Tang, Y.; Womer, F.; Jiang, X.; Chen, K.; Zhou, Y.; Jiang, W.; Luo, X.; et al. Amplitude of low-frequency fluctuations in bipolar disorder: A resting state fMRI study. J. Affect. Disord. 2014, 152–154, 237–242. [Google Scholar] [CrossRef]
- Liu, C.-H.; Ma, X.; Li, F.; Wang, Y.-J.; Tie, C.-L.; Li, S.-F.; Chen, T.-L.; Fan, T.; Zhang, Y.; Dong, J.; et al. Regional homogeneity within the default mode network in bipolar depression: A resting-state functional magnetic resonance imaging study. PLoS ONE 2012, 7, e48181. [Google Scholar] [CrossRef]
- Torrisi, S.; Moody, T.D.; Vizueta, N.; Thomason, M.E.; Monti, M.M.; Townsend, J.D.; Bookheimer, S.Y.; Altshuler, L.L. Differences in resting corticolimbic functional connectivity in bipolar I euthymia. Bipolar Disord. 2013, 15, 156–166. [Google Scholar] [CrossRef] [Green Version]
- Meda, S.A.; Wang, Z.; Ivleva, E.I.; Poudyal, G.; Keshavan, M.S.; Tamminga, C.A.; Sweeney, J.A.; Clementz, B.A.; Schretlen, D.J.; Calhoun, V.D.; et al. Frequency-Specific Neural Signatures of Spontaneous Low-Frequency Resting State Fluctuations in Psychosis: Evidence from Bipolar-Schizophrenia Network on Intermediate Phenotypes (B-SNIP) Consortium. Schizophr. Bull. 2015, 41, 1336–1348. [Google Scholar] [CrossRef] [Green Version]
- Xiao, Q.; Zhong, Y.; Lu, D.; Gao, W.; Jiao, Q.; Lu, G.; Su, L. Altered regional homogeneity in pediatric bipolar disorder during manic and euthymic state: A resting-state fMRI study. Brain Imaging Behav. 2019, 8. [Google Scholar] [CrossRef]
- Mcdowell, I. Measuring Health: A Guide to Rating Scales and Questionnaires; Oxford University Press: Oxford, UK, 2006. [Google Scholar]
- Young, R.C.; Biggs, J.T.; Ziegler, V.E.; Meyer, D.A. A rating scale for mania: Reliability, validity and sensitivity. Br. J. Psychiatry 1979, 133, 429–435. [Google Scholar] [CrossRef]
- Buchanan, R.W.; Heinrichs, D.W. The Neurological Evaluation Scale (NES): A structured instrument for the assessment of neurological signs in schizophrenia. Psychiatry Res. 1989, 27, 335–350. [Google Scholar] [CrossRef]
- Yan, C.G.; Di Wang, X.; Zuo, X.N.; Zang, Y.F. DPABI: Data Processing & Analysis for (Resting-State) Brain Imaging. Neuroinformatics 2016, 14, 339–351. [Google Scholar] [CrossRef] [PubMed]
- Power, J.D.; Barnes, K.A.; Snyder, A.Z.; Schlaggar, B.L.; Petersen, S.E. Spurious but systematic correlations in functional connectivity MRI networks arise from subject motion. Neuroimage 2012, 59, 2142–2154. [Google Scholar] [CrossRef] [PubMed] [Green Version]
- Satterthwaite, T.D.; Elliott, M.A.; Gerraty, R.T.; Ruparel, K.; Loughead, J.; Calkins, M.E.; Eickhoff, S.B.; Hakonarson, H.; Gur, R.C.; Gur, R.E.; et al. An improved framework for confound regression and filtering for control of motion artifact in the preprocessing of resting-state functional connectivity data. Neuroimage 2013, 64, 240–256. [Google Scholar] [CrossRef] [Green Version]
- van Dijk, K.R.A.; Sabuncu, M.R.; Buckner, R.L. The influence of head motion on intrinsic functional connectivity MRI. Neuroimage 2012, 59, 431–438. [Google Scholar] [CrossRef] [Green Version]
- Yan, C.G.; Cheung, B.; Kelly, C.; Colcombe, S.; Craddock, R.C.; Di Martino, A.; Li, Q.; Zuo, X.N.; Castellanos, F.X.; Milham, M.P. A comprehensive assessment of regional variation in the impact of head micromovements on functional connectomics. Neuroimage 2013, 76, 183–201. [Google Scholar] [CrossRef] [Green Version]
- Eklund, A.; Nichols, T.E.; Knutsson, H. Cluster failure: Why fMRI inferences for spatial extent have inflated false-positive rates. Proc. Natl. Acad. Sci. USA 2016, 113, 7900–7905. [Google Scholar] [CrossRef] [Green Version]
- Grill, M.; Pevný, T.; Rehak, M. Reducing false positives of network anomaly detection by local adaptive multivariate smoothing. J. Comput. Syst. Sci. 2017, 83, 43–57. [Google Scholar] [CrossRef]
- Liu, T.T.; Nalci, A.; Falahpour, M. The global signal in fMRI: Nuisance or Information? Neuroimage 2017, 150, 213–229. [Google Scholar] [CrossRef] [Green Version]
- Bijsterbosch, J.; Smith, S.M.; Beckmann, C.F. Introduction to Resting State FMRI Functional Connectivity; Oxford University Press: Oxford, UK, 2017. [Google Scholar]
- Wang, L.; Kong, Q.; Li, K.; Su, Y.; Zeng, Y.; Zhang, Q.; Dai, W.; Xia, M.; Wang, G.; Jin, Z.; et al. Frequency-dependent changes in amplitude of low-frequency oscillations in depression: A resting-state fMRI study. Neurosci. Lett. 2016, 614, 105–111. [Google Scholar] [CrossRef]
- Zang, Y.F.; Yong, H.; Chao-Zhe, Z.; Qing-Jiu, C.; Man-Qiu, S.; Meng, L.; Li-Xia, T.; Tian-Zi, J.; Yu-Feng, W. Altered baseline brain activity in children with ADHD revealed by resting-state functional MRI. Brain Dev. 2007, 29, 83–91. [Google Scholar] [CrossRef]
- Buzsáki, G.; Draguhn, A. Neuronal olscillations in cortical networks. Science 2004, 304, 1926–1929. [Google Scholar] [CrossRef] [Green Version]
- Gohel, S.R.; Biswal, B.B. Functional integration between brain regions at rest occurs in multiple-frequency bands. Brain Connect. 2015, 5, 23–34. [Google Scholar] [CrossRef] [Green Version]
- Kendall, M.; Gibbons, J.D. Rank Correlation Methods (Charles Griffin Book Series); Oxford University Press: Cary, NC, USA, 1990. [Google Scholar]
- Zang, Y.; Jiang, T.; Lu, Y.; He, Y.; Tian, L. Regional homogeneity approach to fMRI data analysis. Neuroimage 2004, 22, 394–400. [Google Scholar] [CrossRef]
- IBM Corp. IBM SPSS Statistics for Windows, Version 24.0; IBM Corp.: Armonk, NY, USA, 2016. [Google Scholar]
- Cordes, D.; Haughton, V.M.; Arfanakis, K.; Carew, J.D.; Turski, P.A.; Moritz, C.H.; Quigley, M.A.; Meyerand, M.E. Frequencies contributing to functional connectivity in the cerebral cortex in “resting-state” data. Am. J. Neuroradiol. 2001, 22, 1326–1333. [Google Scholar] [PubMed]
- Duff, E.P.; Johnston, L.A.; Xiong, J.; Fox, P.T.; Mareels, I.; Egan, G.F. The power of spectral density analysis for mapping endogenous BOLD signal fluctuations. Hum. Brain Mapp. 2008, 29, 778–790. [Google Scholar] [CrossRef] [Green Version]
- Fox, M.D.; Raichle, M.E. Spontaneous fluctuations in brain activity observed with functional magnetic resonance imaging. Nat. Rev. Neurosci. 2007, 8, 700–711. [Google Scholar] [CrossRef]
- Turner, J.A.; Chen, H.; Mathalon, D.H.; Allen, E.A.; Mayer, A.R.; Abbott, C.C.; Calhoun, V.D.; Bustillo, J. Reliability of the amplitude of low-frequency fluctuations in resting state fMRI in chronic schizophrenia. Psychiatry Res.—Neuroimaging 2012, 201, 253–255. [Google Scholar] [CrossRef] [Green Version]
- Chen, C.H.; Suckling, J.; Lennox, B.R.; Ooi, C.; Bullmore, E.T. A quantitative meta-analysis of fMRI studies in bipolar disorder. Bipolar Disord. 2011, 13, 1–15. [Google Scholar] [CrossRef]
- Cattarinussi, G.; Di Giorgio, A.; Wolf, R.C.; Balestrieri, M.; Sambataro, F. Neural signatures of the risk for bipolar disorder: A meta-analysis of structural and functional neuroimaging studies. Bipolar Disord. 2019, 21, 215–227. [Google Scholar] [CrossRef] [PubMed] [Green Version]
- Li, J.; Tang, Y.; Womer, F.; Fan, G.; Zhou, Q.; Sun, W.; Xu, K.; Wang, F. Two patterns of anterior insular cortex functional connectivity in bipolar disorder and schizophrenia. World J. Biol. Psychiatry 2018, 19, S115–S123. [Google Scholar] [CrossRef]
- Keener, M.T.; Phillips, M.L. Neuroimaging in bipolar disorder: A critical review of current findings. Curr. Psychiatry Rep. 2007, 9, 512–520. [Google Scholar] [CrossRef] [Green Version]
- Malhi, G.S.; Lagopoulos, J.; Sachdev, P.S.; Ivanovski, B.; Shnier, R.; Ketter, T. Is a lack of disgust something to fear? A functional magnetic resonance imaging facial emotion recognition study in euthymic bipolar disorder patients. Bipolar Disord. 2007, 9, 345–357. [Google Scholar] [CrossRef]
- Li, M.; Xu, H.; Lu, S. Neural basis of depression related to a dominant right hemisphere: A resting-state fMRI study. Behav. Neurol. 2018, 2018, 5024520. [Google Scholar] [CrossRef]
- Minzenberg, M.J.; Laird, A.R.; Thelen, S.; Carter, C.S.; Glahn, D.C. Meta-analysis of 41 Functional Neuroimaging Studies of Executive Function in Schizophrenia. Arch. Gen. Psychiatry 2009, 66, 811–822. [Google Scholar] [CrossRef] [Green Version]
- Tan, H.Y.; Choo, W.C.; Fones, C.S.L.; Chee, M.W.L. fMRI study of maintenance and manipulation processes within working memory in first-episode schizophrenia. Am. J. Psychiatry 2005, 162, 1849–1858. [Google Scholar] [CrossRef] [PubMed]
- Ellard, K.K.; Zimmerman, J.P.; Kaur, N.; Van Dijk, K.R.A.; Roffman, J.L.; Nierenberg, A.A.; Dougherty, D.D.; Deckersbach, T.; Camprodon, J.A. Functional Connectivity Between Anterior Insula and Key Nodes of Frontoparietal Executive Control and Salience Networks Distinguish Bipolar Depression From Unipolar Depression and Healthy Control Subjects. Biol. Psychiatry Cogn. Neurosci. Neuroimaging 2018, 3, 473–484. [Google Scholar] [CrossRef]
- Yip, S.W.; Mackay, C.E.; Goodwin, G.M. Increased temporo-insular engagement in unmedicated bipolar II disorder: An exploratory resting state study using independent component analysis. Bipolar Disord. 2014, 16, 748–755. [Google Scholar] [CrossRef] [PubMed]
- Sobczak, A.M.; Bohaterewicz, B.; Marek, T.; Fafrowicz, M.; Dudek, D.; Siwek, M.; Tereszko, A.; Krupa, A.J.; Bryll, A.; Chrobak, A. Altered Functional connectivity differences in Salience Network as a neuromarker of suicide risk in euthymic bipolar disorder patients. Front. Hum. Neurosci. 2020, 14, 480. [Google Scholar] [CrossRef] [PubMed]
- Mutschler, I.; Wieckhorst, B.; Kowalevski, S.; Derix, J.; Wentlandt, J.; Schulze-Bonhage, A.; Ball, T. Functional organization of the human anterior insular cortex. Neurosci. Lett. 2009, 457, 66–70. [Google Scholar] [CrossRef]
- Shaffer, J.J.; Johnson, C.P.; Fiedorowicz, J.G.; Christensen, G.E.; Wemmie, J.A.; Magnotta, V.A. Impaired sensory processing measured by functional MRI in Bipolar disorder manic and depressed mood states. Brain Imaging Behav. 2018, 12, 837–847. [Google Scholar] [CrossRef]
- Serafini, G.; Engel-Yeger, B.; Vazquez, G.H.; Pompili, M.; Amore, M. Sensory processing disorders are associated with duration of current episode and severity of side effects. Psychiatry Investig. 2017, 14, 51. [Google Scholar] [CrossRef] [Green Version]
- Lui, S.; Li, T.; Deng, W.; Jiang, L.; Wu, Q.; Tang, H.; Yue, Q.; Huang, X.; Chan, R.C.; Collier, D.A.; et al. Short-term effects of antipsychotic treatment on cerebral function in drug-naive first-episode schizophrenia revealed by “resting state” functional magnetic resonance imaging. Arch. Gen. Psychiatry 2010, 67, 783–792. [Google Scholar] [CrossRef] [Green Version]
- Calhoun, V.D.; Sui, J.; Kiehl, K.; Turner, J.; Allen, E.; Pearlson, G. Exploring the psychosis functional connectome: Aberrant intrinsic networks in schizophrenia and bipolar disorder. Front. Psychiatry 2012, 2, 75. [Google Scholar] [CrossRef] [Green Version]
- Anticevic, A.; Brumbaugh, M.S.; Winkler, A.M.; Lombardo, L.E.; Barrett, J.; Corlett, P.R.; Kober, H.; Gruber, J.; Repovs, G.; Cole, M.W.; et al. Global prefrontal and fronto-amygdala dysconnectivity in bipolar i disorder with psychosis history. Biol. Psychiatry 2013, 73, 565–573. [Google Scholar] [CrossRef] [PubMed] [Green Version]
- Meda, S.A.; Gill, A.; Stevens, M.C.; Lorenzoni, R.P.; Glahn, D.C.; Calhoun, V.D.; Sweeney, J.A.; Tamminga, C.A.; Keshavan, M.S.; Thaker, G.; et al. Differences in resting-state functional magnetic resonance imaging functional network connectivity between schizophrenia and psychotic bipolar probands and their unaffected first-degree relatives. Biol. Psychiatry 2012, 71, 881–889. [Google Scholar] [CrossRef] [Green Version]
- Chang, M.; Edmiston, E.K.; Womer, F.Y.; Zhou, Q.; Wei, S.; Jiang, X.; Zhou, Y.; Ye, Y.; Huang, H.; Zuo, X.N.; et al. Spontaneous low-frequency fluctuations in the neural system for emotional perception in major psychiatric disorders: Amplitude similarities and differences across frequency bands. J. Psychiatry Neurosci. 2019, 44, 132–141. [Google Scholar] [CrossRef] [Green Version]
- Reinke, B.; Van de Ven, V.; Matura, S.; Linden, D.E.J.; Oertel-Knöchel, V. Altered intrinsic functional connectivity in language-related brain regions in association with verbal memory performance in euthymic bipolar patients. Brain Sci. 2013, 3, 1357–1373. [Google Scholar] [CrossRef]
- Wang, B.; Li, T.; Zhou, M.; Zhao, S.; Niu, Y.; Wang, X.; Yan, T.; Cao, R.; Xiang, J.; Li, D. The Abnormality of Topological Asymmetry in Hemispheric Brain Anatomical Networks in Bipolar Disorder. Front. Neurosci. 2018, 12, 618. [Google Scholar] [CrossRef] [Green Version]
- Caligiuri, M.; Brown, G.; Meloy, M.; Eyler, L.; Kindermann, S.; Eberson, S.; Frank, L.; Lohr, J. A functional magnetic resonance imaging study of cortical asymmetry in bipolar disorder. Bipolar Disord. 2004, 6, 183–196. [Google Scholar] [CrossRef] [PubMed]
- Caligiuri, M.P.; Brown, G.G.; Meloy, M.J.; Eberson, S.C.; Kindermann, S.S.; Frank, L.R.; Zorrilla, L.E.; Lohr, J.B. An fMRI study of affective state and medication on cortical and subcortical brain regions during motor performance in bipolar disorder. Psychiatry Res. 2003, 123, 171–182. [Google Scholar] [CrossRef]


| BD Group | HC Group | p-Values | |
|---|---|---|---|
| Age (years, mean (SD)) a | 36 (6.4) 7/12 9/10 | 35 (10.2) | 0.420 |
| Sex (men/women) b | 9/9 | 0.411 | |
| BD type (I/II) | - | ||
| Number of BD patients with history of psychotic symptoms | 5 | - | |
| Duration of treatment (years, mean (SD)) | 6.6 (6.1) | ||
| Number of affective episodes (mean, (SD)) | 9.6 (11.0) | ||
| Number of hypomanic episodes (mean, (SD)) | 1.1 (1.4) | ||
| Number of manic episodes (mean, (SD)) | 2.7 (5.7) | ||
| Number of depressive episodes (mean, (SD)) | 5.8 (6.5) | ||
| Mean head motion a | 0.077 (0.07) | 0.073 (0.077) | 0.003 |
| Medication | |||
| Number of patients (%) | Dose (mean mg (SD)) | ||
| Quetiapine | 6 (32%) | 367.7 (233.8) | |
| Olanzapine | 7 (37%) | 9.6 (4.7) | |
| Valproic acid | 10 (53%) | 980 (315.5) | |
| Brain Regions | F-Scores | MNI Coordinates | Cluster Size (Voxels) | ||
|---|---|---|---|---|---|
| x | y | z | |||
| Main effect of group | |||||
| left MFG—BA 10 | 37.88 | −30 | 63 | 3 | 15 |
| left insula—BA 47 | 26.35 | −36 | 15 | −15 | 10 |
| right MOG—BA 19 | 23.22 | 30 | −63 | 36 | 16 |
| right RG—BA 11 | 21.72 | 6 | 33 | −24 | 13 |
| left MTP—BA 21 | 20.38 | −39 | 15 | −42 | 14 |
| Main effect of frequency band | |||||
| left FG—BA 37 | 17.20 | −36 | −18 | −24 | 11 |
| Brain Regions | Peak T-Scores | MNI Coordinates | Cluster Size (Voxels) | ||
|---|---|---|---|---|---|
| x | y | z | |||
| In the slow-4 band | |||||
| BD < HC | |||||
| None | |||||
| BD > HC | |||||
| None | |||||
| In the slow-5 band | |||||
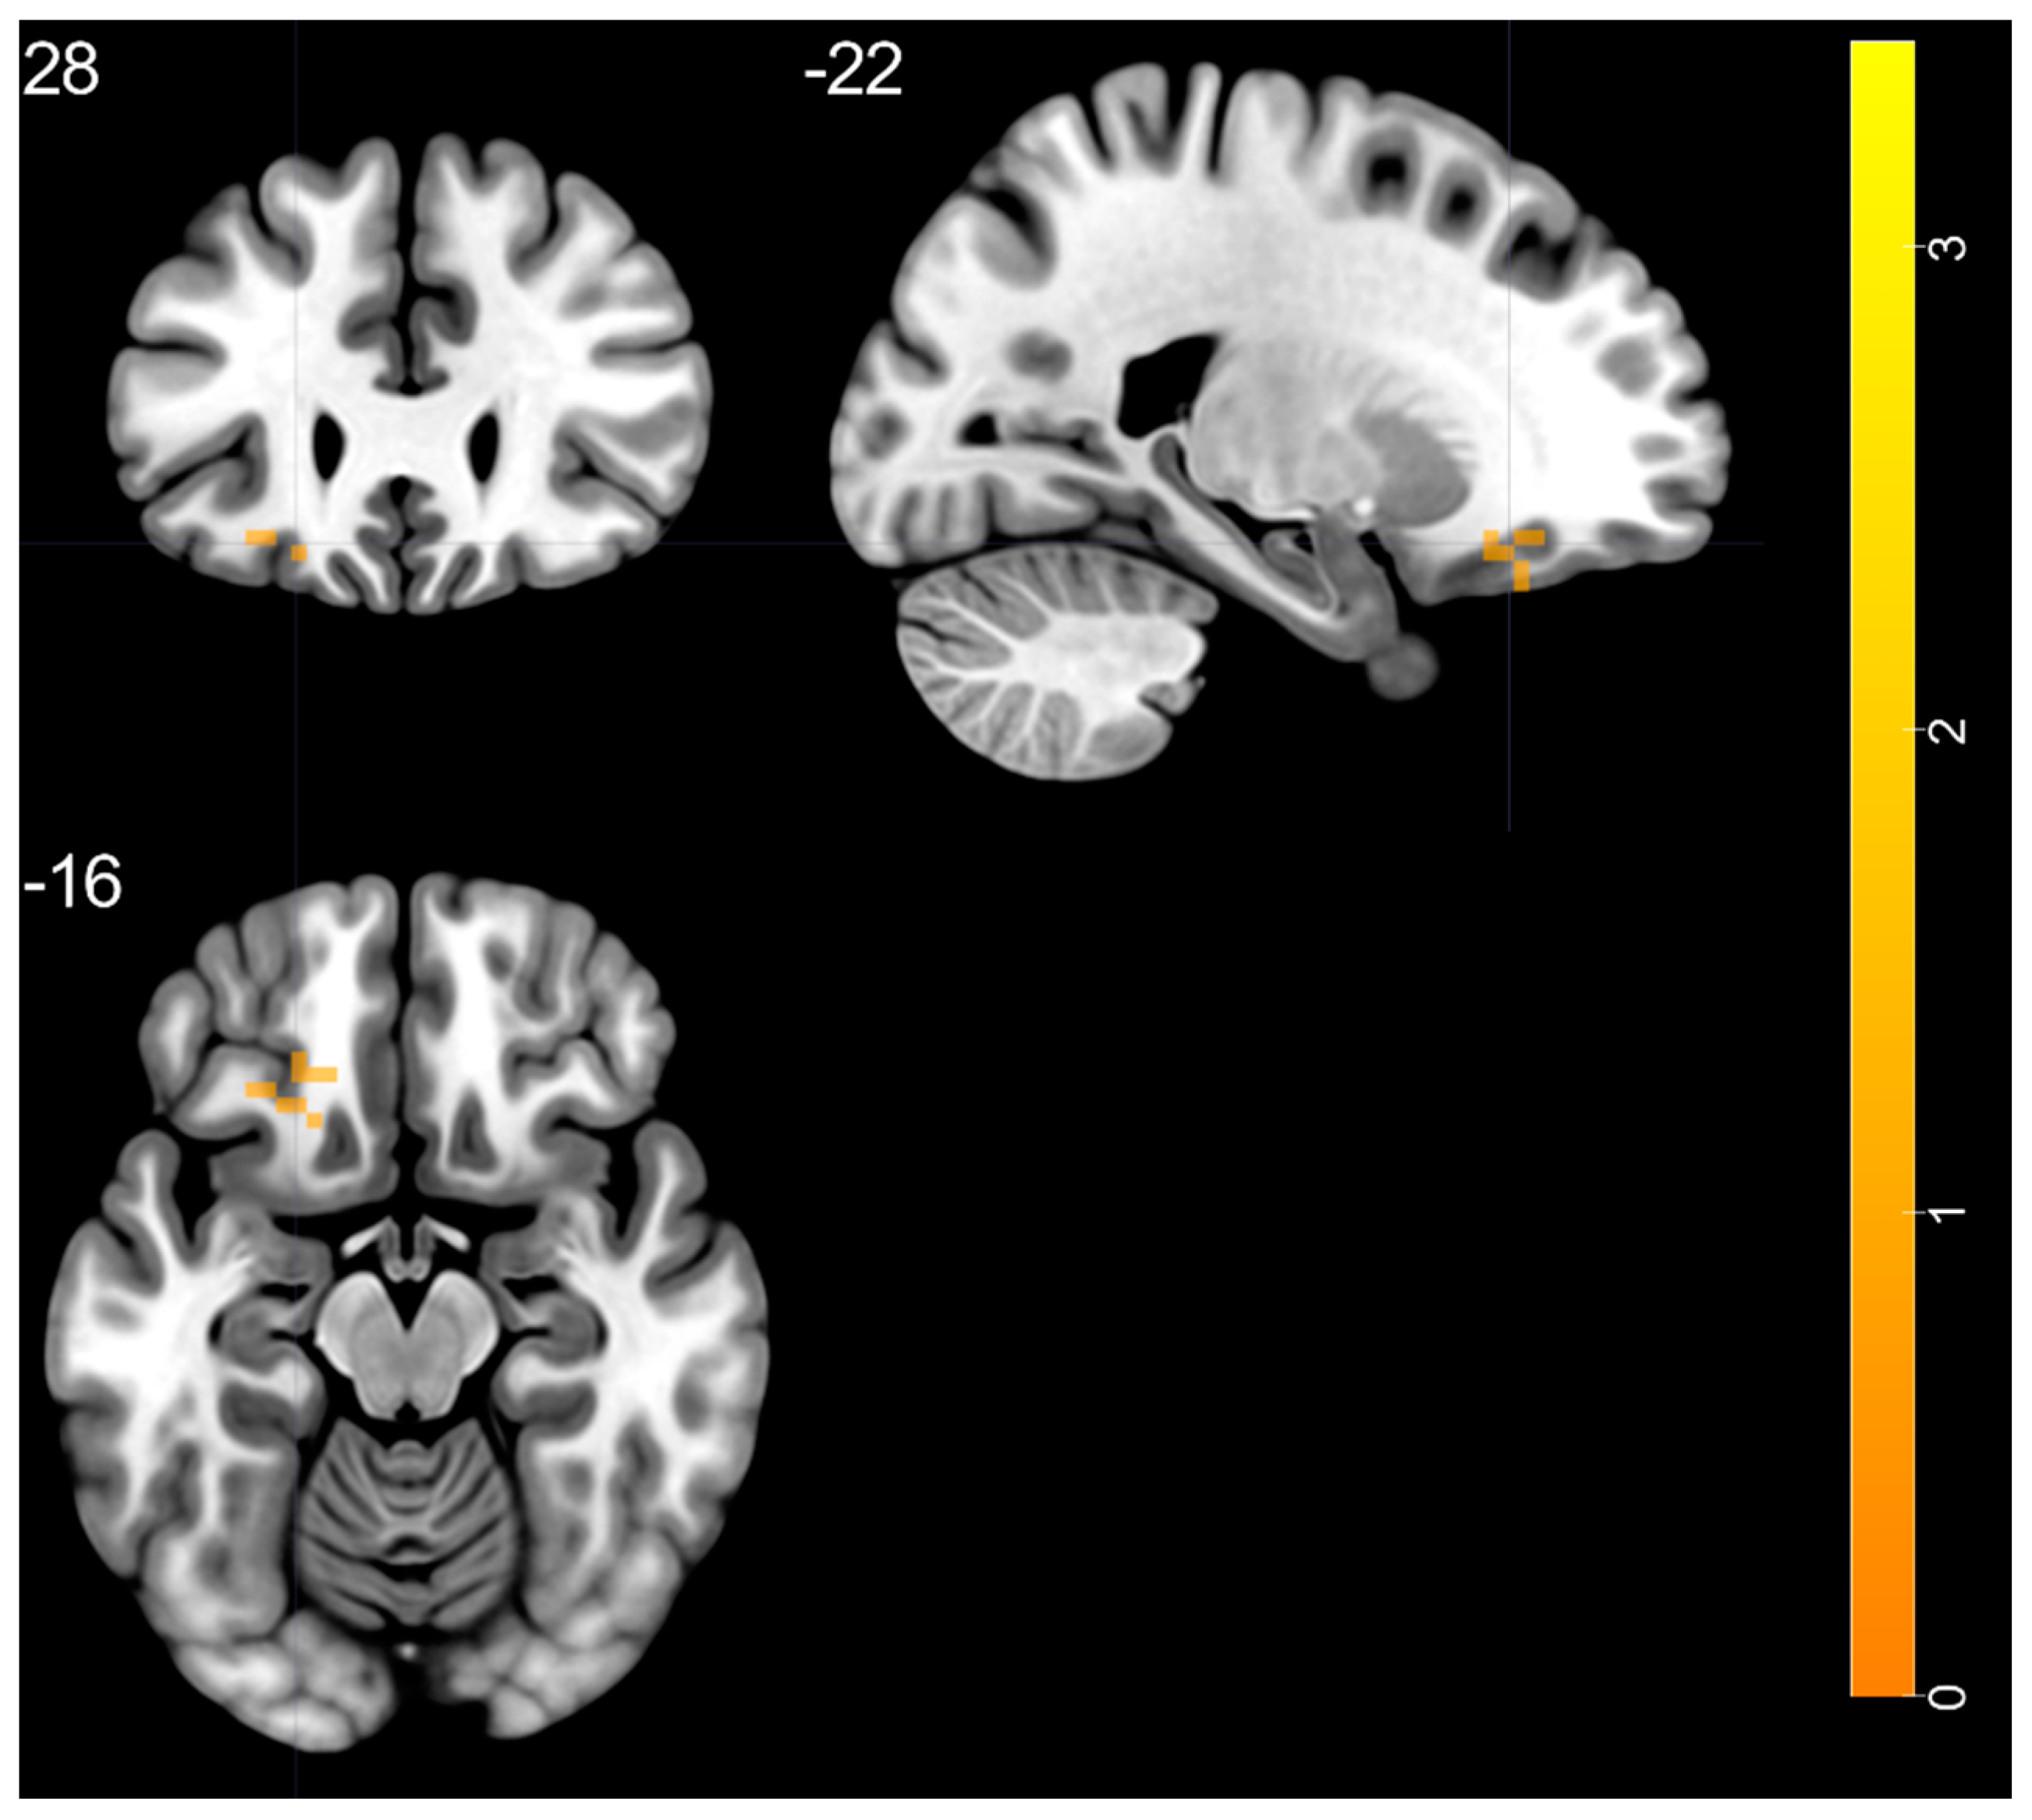
| BD > HC | |||||
| left MTP—BA 21 | 3.425 | −39 | 15 | −42 | 41 |
| BD < HC | |||||
| None | |||||
| Brain Regions | Peak T-Scores | MNI Coordinates | Cluster Size (Voxels) | ||
|---|---|---|---|---|---|
| x | y | z | |||
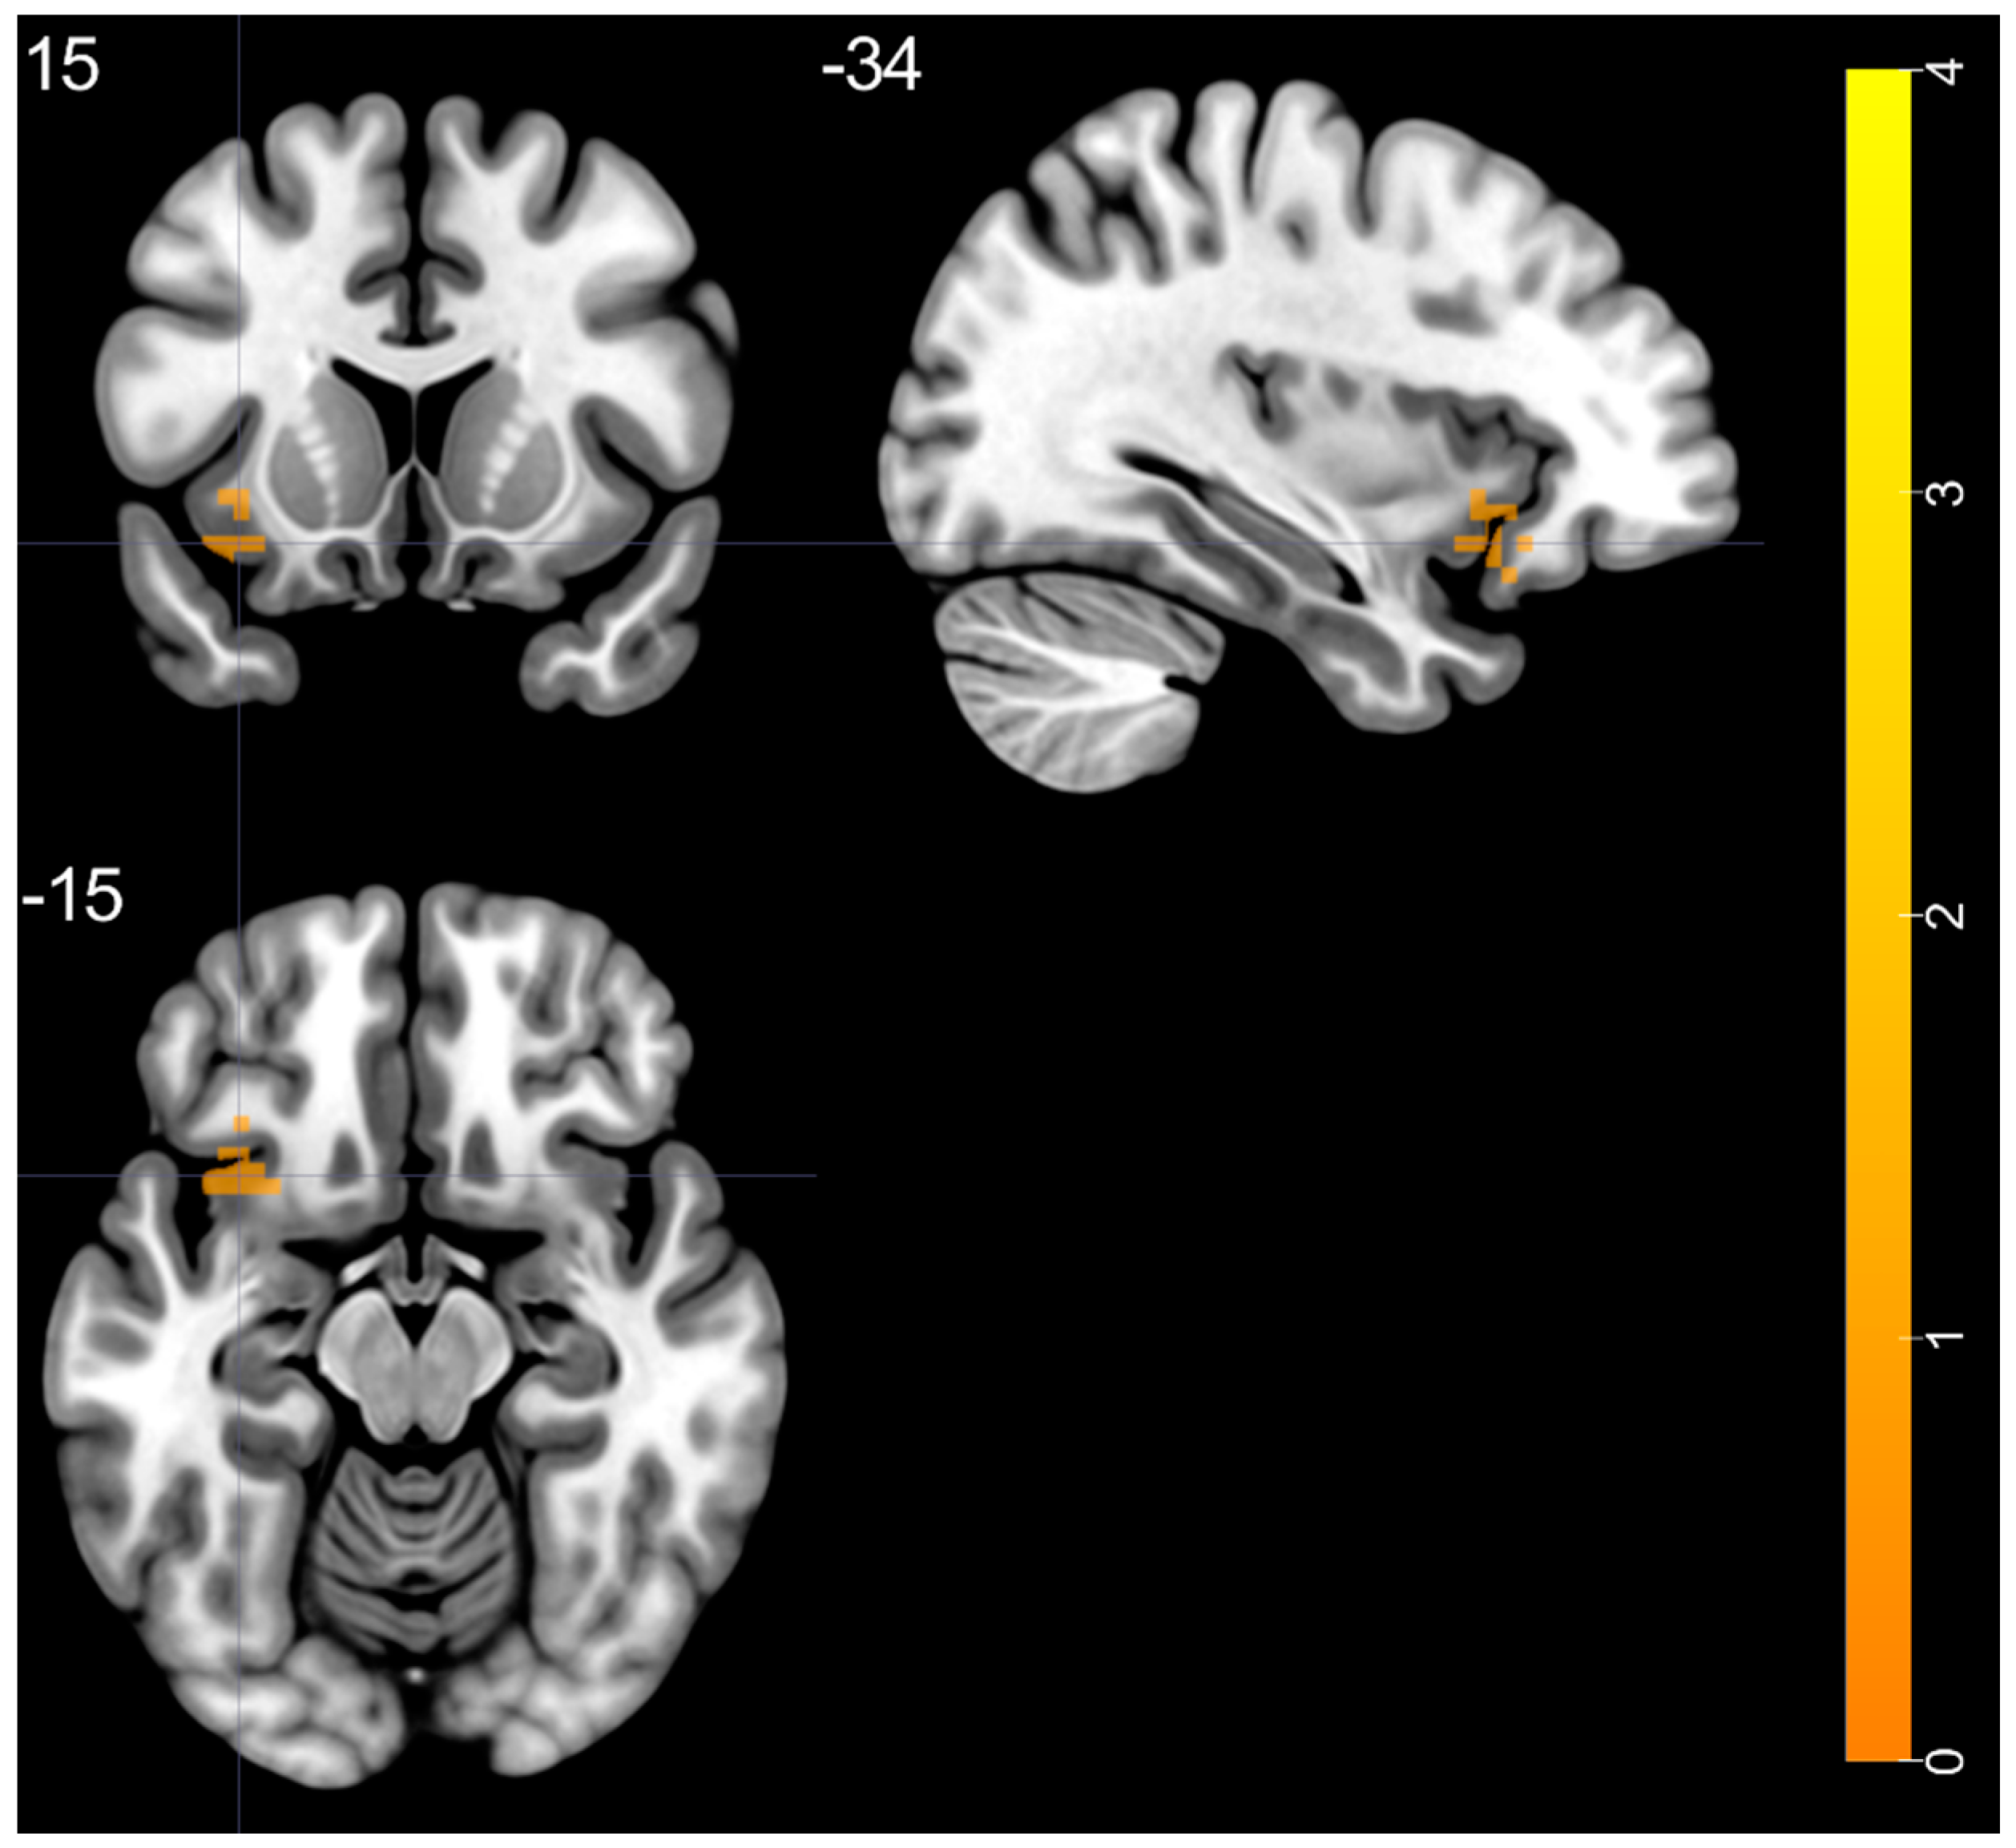
| BD > HC | |||||
| left insula—BA 47 | 4.228 | −36 | 15 | −15 | 37 |
| Brain Regions HC | Peak T-Scores | MNI Coordinates | Cluster Size (Voxels) | ||
|---|---|---|---|---|---|
| x | y | z | |||
| left MFG—BA 46 | −5.174 | −36 | 48 | 30 | 11 |
| right MFG—BA 9 | −5.597 | 39 | 36 | 39 | 18 |
| right SPG—BA 7 | −6.133 | 30 | −63 | 51 | 55 |
| right SMG—BA 40 | −5.191 | 57 | −42 | 42 | 20 |
| left IPG—BA 40 | −6.024 | −30 | −69 | 42 | 26 |
| left CB—lobule VIII | −6.114 | −12 | −72 | −51 | 10 |
| left SMA—BA 6 | −5.010 | −3 | −3 | 60 | 10 |
| Brain Regions | Peak T-Scores | MNI Coordinates | Cluster Size (Voxels) | ||
|---|---|---|---|---|---|
| x | y | z | |||
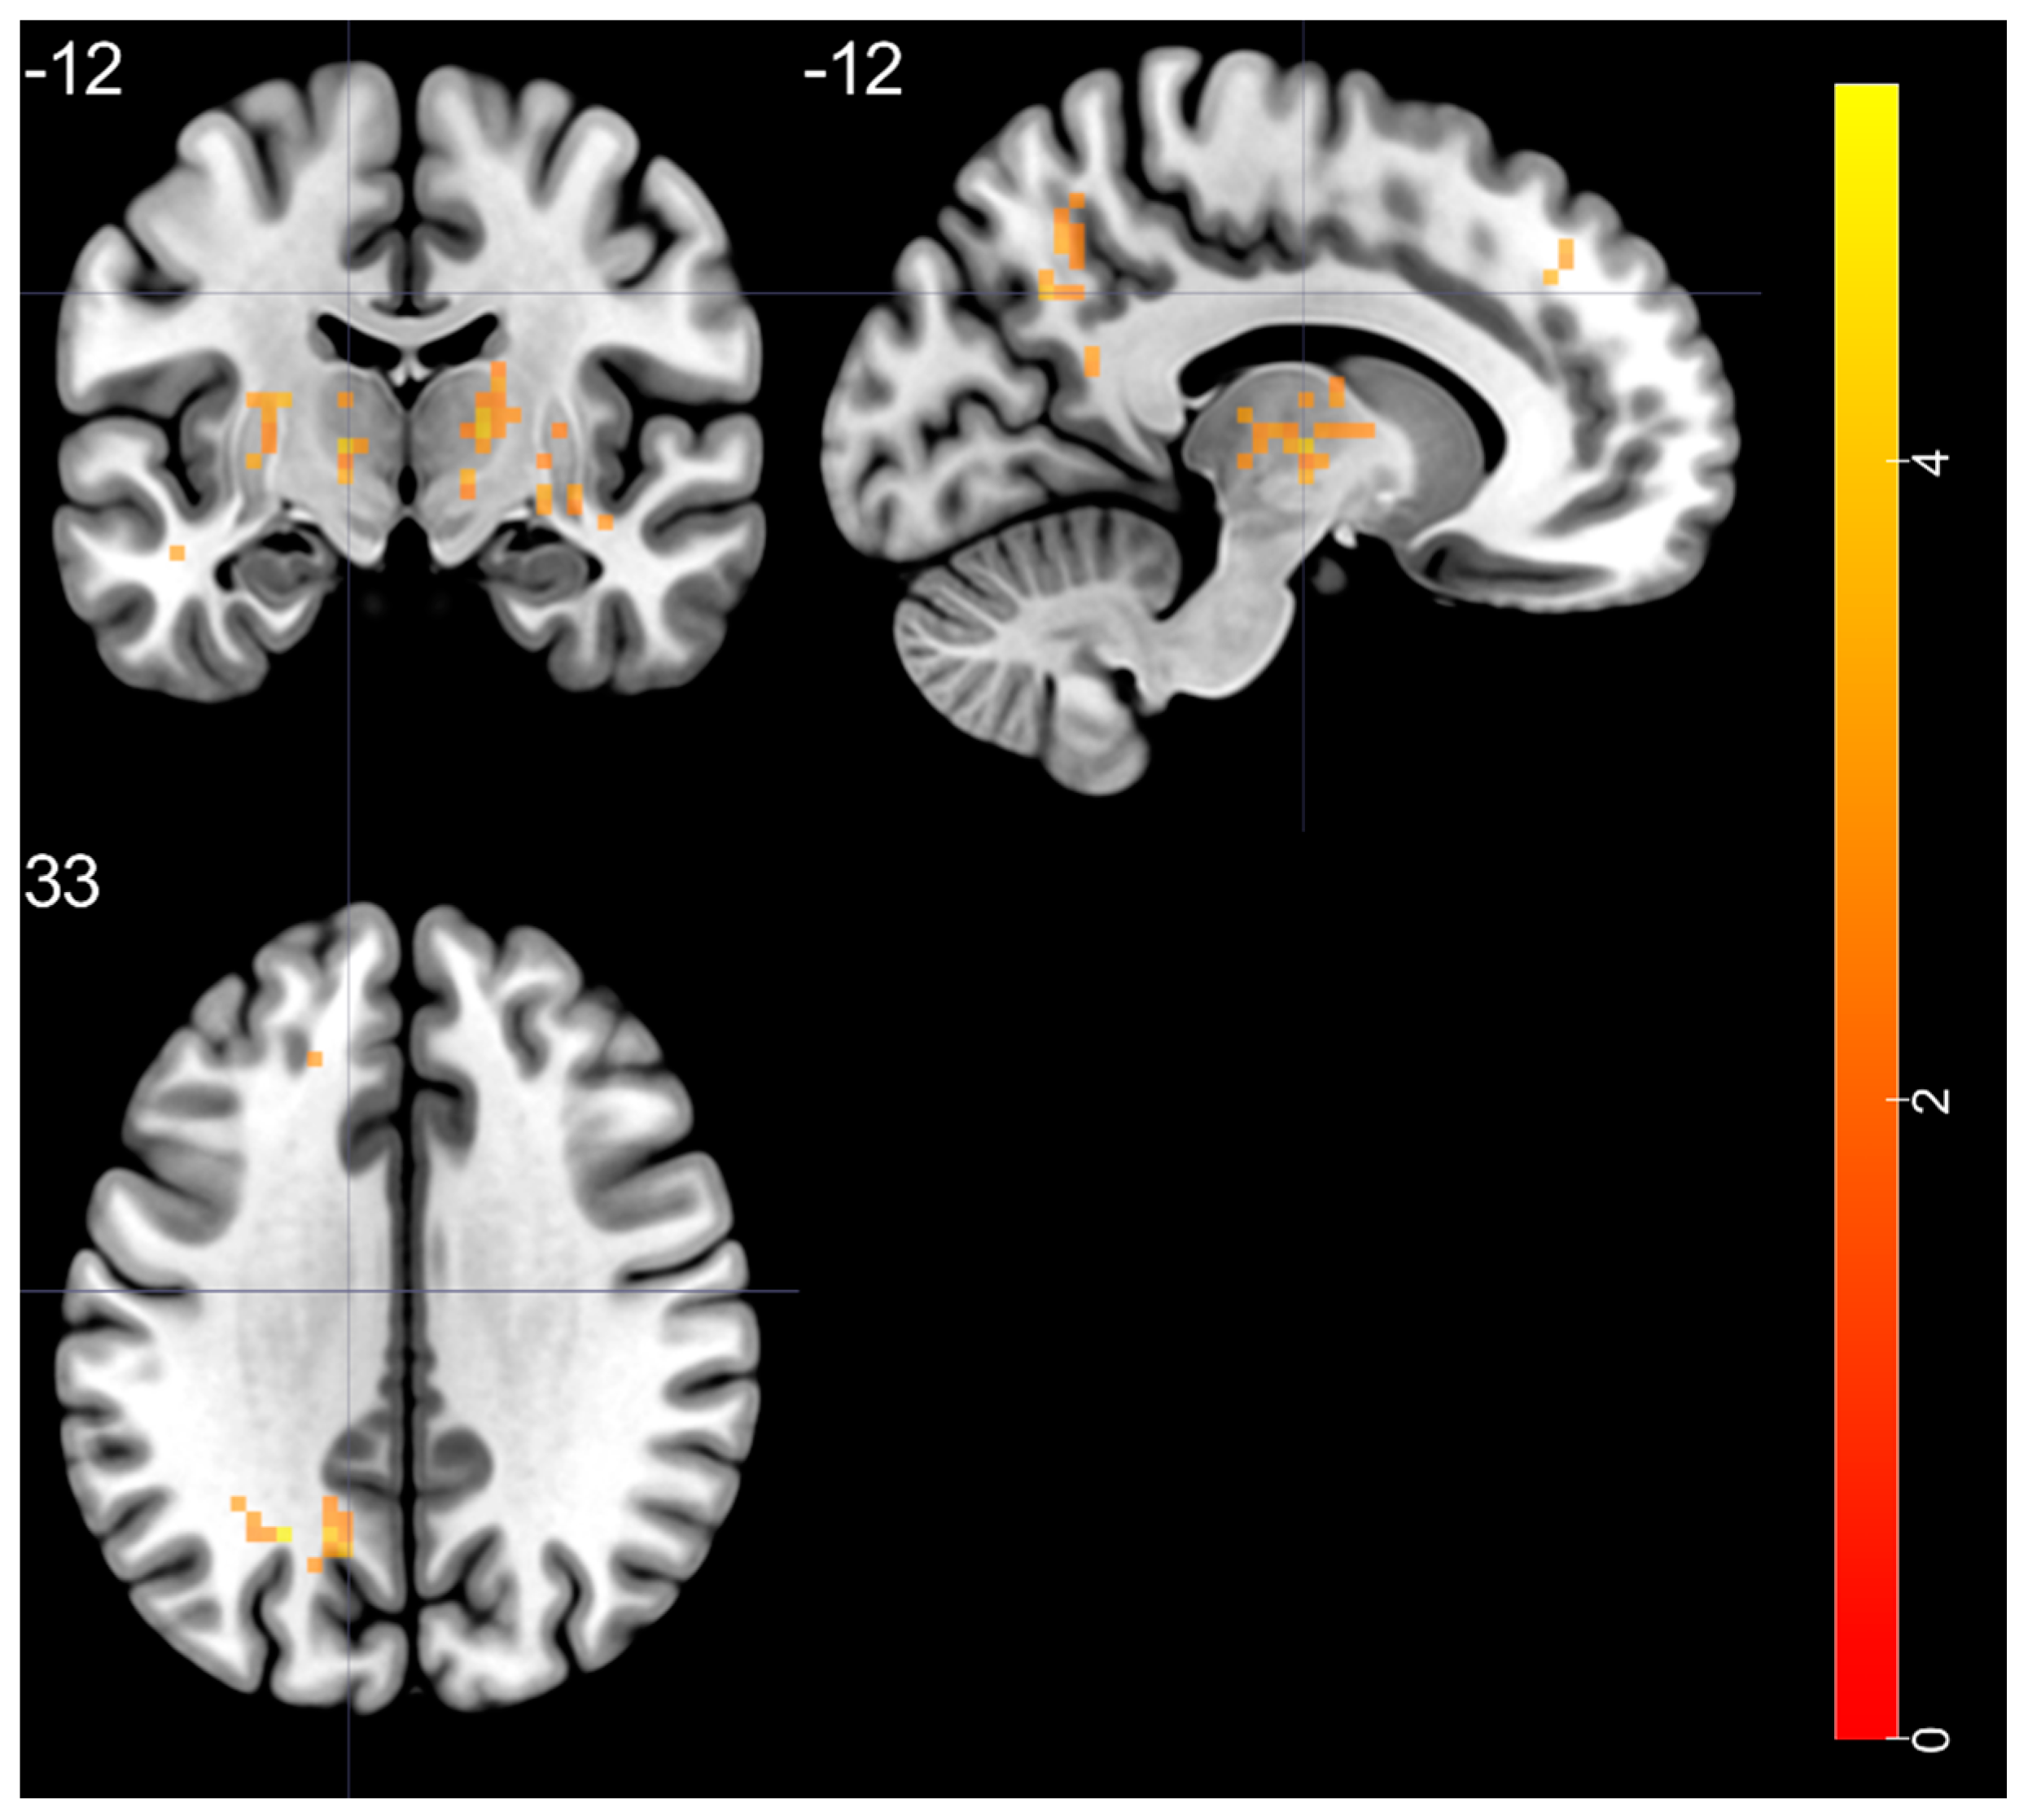
| BD > HC | |||||
| left STG—BA 20 | 4.525 | −48 | −24 | −6 | 38 |
| right putamen—BA 48 | 5.178 | 33 | −6 | 0 | 144 |
| right thalamus (ventral lateral nucleus) | 4.28 | 15 | −12 | 6 | 67 |
| left thalamus (ventral lateral nucleus) | 4.351 | −12 | −12 | 3 | 113 |
| left MOG—BA 19 | 5.075 | −24 | −60 | 33 | 58 |
| left SFG—BA 9 | 3.741 | −9 | 42 | 39 | 27 |
| Brain Regions | Peak T-Scores | MNI Coordinates | Cluster Size (Voxels) | ||
|---|---|---|---|---|---|
| x | y | z | |||
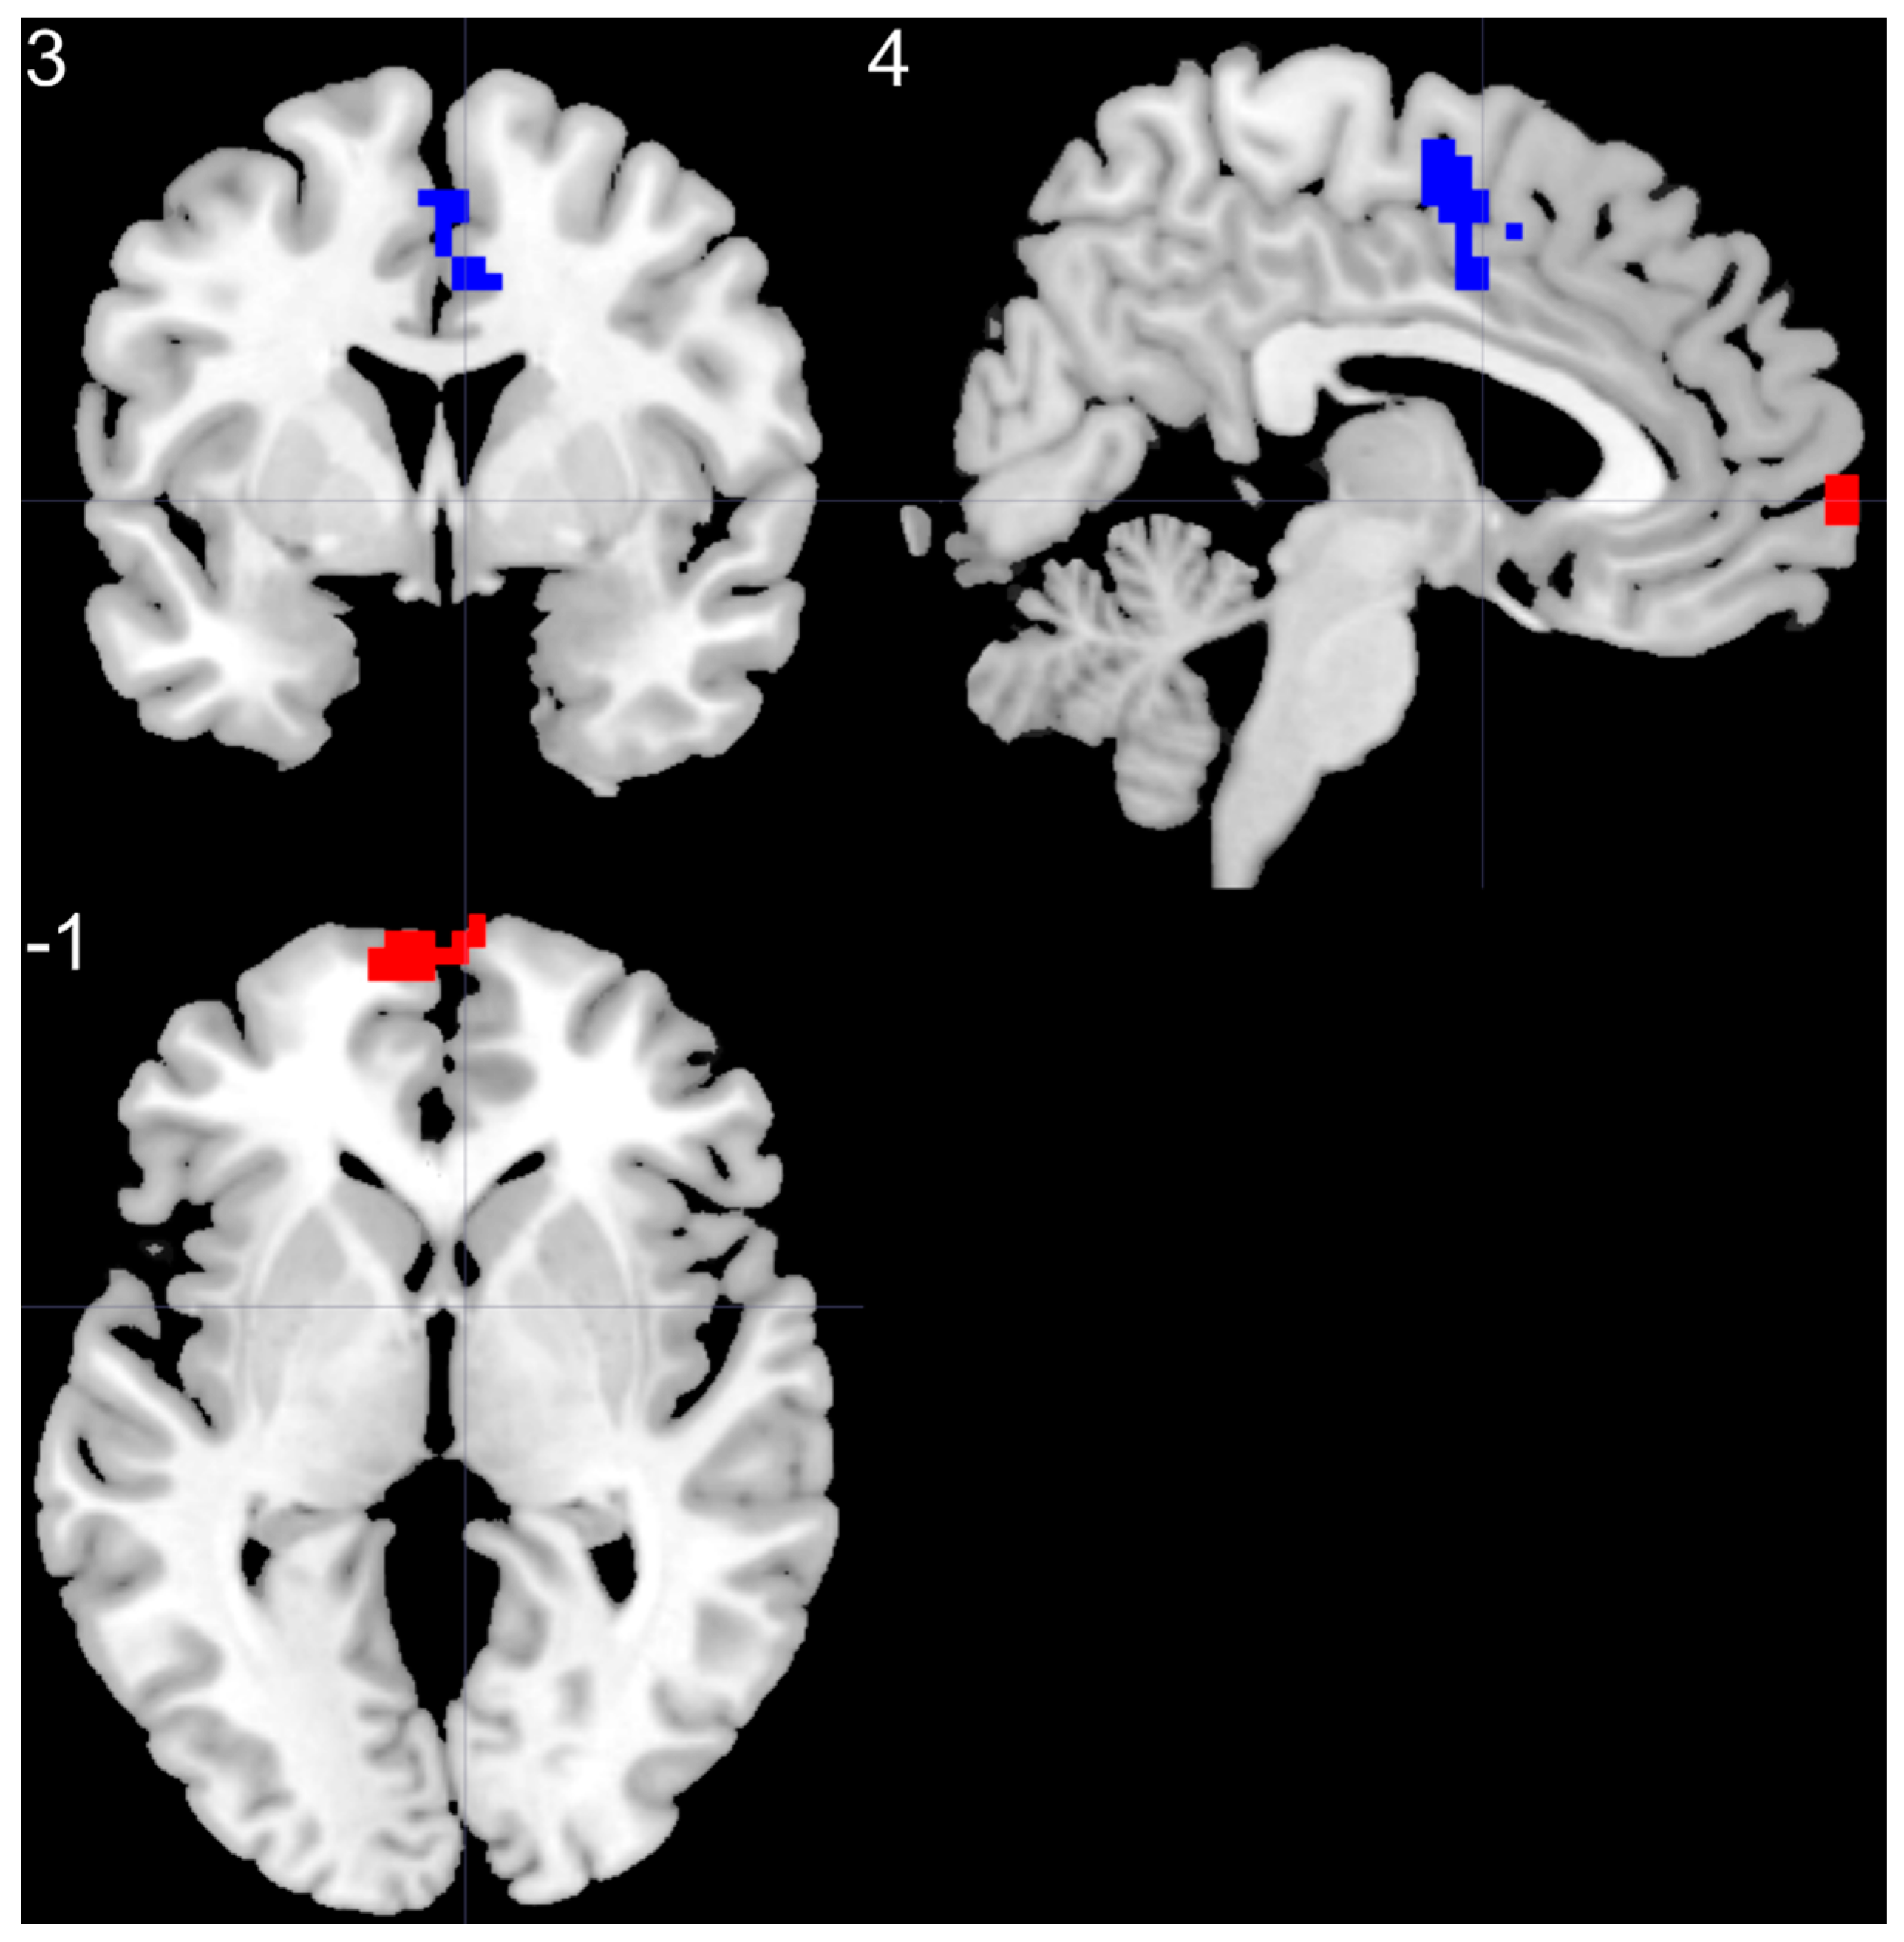
| BD > HC | |||||
| left SMF | 5.37 | −6 | 66 | 0 | 85 |
| BD < HC | |||||
| right SMA | −4.14 | 3 | −6 | 57 | 70 |
Publisher’s Note: MDPI stays neutral with regard to jurisdictional claims in published maps and institutional affiliations. |
© 2021 by the authors. Licensee MDPI, Basel, Switzerland. This article is an open access article distributed under the terms and conditions of the Creative Commons Attribution (CC BY) license (https://creativecommons.org/licenses/by/4.0/).
Share and Cite
Chrobak, A.A.; Bohaterewicz, B.; Sobczak, A.M.; Marszał-Wiśniewska, M.; Tereszko, A.; Krupa, A.; Ceglarek, A.; Fafrowicz, M.; Bryll, A.; Marek, T.; et al. Time-Frequency Characterization of Resting Brain in Bipolar Disorder during Euthymia—A Preliminary Study. Brain Sci. 2021, 11, 599. https://doi.org/10.3390/brainsci11050599
Chrobak AA, Bohaterewicz B, Sobczak AM, Marszał-Wiśniewska M, Tereszko A, Krupa A, Ceglarek A, Fafrowicz M, Bryll A, Marek T, et al. Time-Frequency Characterization of Resting Brain in Bipolar Disorder during Euthymia—A Preliminary Study. Brain Sciences. 2021; 11(5):599. https://doi.org/10.3390/brainsci11050599
Chicago/Turabian StyleChrobak, Adrian Andrzej, Bartosz Bohaterewicz, Anna Maria Sobczak, Magdalena Marszał-Wiśniewska, Anna Tereszko, Anna Krupa, Anna Ceglarek, Magdalena Fafrowicz, Amira Bryll, Tadeusz Marek, and et al. 2021. "Time-Frequency Characterization of Resting Brain in Bipolar Disorder during Euthymia—A Preliminary Study" Brain Sciences 11, no. 5: 599. https://doi.org/10.3390/brainsci11050599