3.3. Step-Three
In step three, we used EFA to inform the development of the specific, second-order factors of psychopathology. Given we had nine observed variables, six BSI variables, and three ASSIST variables, we started by examining a four-factor structure, which is the largest structure with the possibility of at least two observed variables loading onto each factor. The EFAs can be found in table four. For the four-factor EFA, a factor emerged consisting of depression, mental fog, and interpersonal anxiety. This factor also showed a cross-loading between factor two for agoraphobia. Furthermore, a second factor emerged consisting of the cross-loaded agoraphobia variable and somatisation, and a third factor consisting of a single loading > 0.3 in hostility. Finally, a fourth factor emerged consisting of the three substance use variables. Next, we assessed a 3-factor structure. The three-factor structure revealed similar results when compared to the four-factor structure. A factor still emerged consisting of depression, hostility, mental fog, and interpersonal anxiety, but now also included hostility, which was moved from its own factor. Factor two emerged still consisting of somatisation and the agoraphobia cross-loading with factor 1. The third factor contained the three substance use variables. Finally, we tested a two-factor solution. The two-factor solution consisted of a factor accounting for the BSI items and for the ASSIST items. The results of the EFAs are presented in
Table 4.
The three and two-factor models provided the most parsimonious solutions, and were chosen to be further explored using CFAs. First, we tested two different three-factor models and two different two-factor models. The first three-factor model tested (a), following the exact structure as the three-factor EFA, and loading agoraphobia onto factor two, due to its slightly stronger loading, and its conceptual relationship to somatisation. The second three-factor CFA tested (b) was the same as the first. However, hostility was loaded onto factor three, with the substance use variables. All of the three factors were allowed to correlate. The first two-factor solution tested (c) was derived directly from the two-factor EFA, but the second two-factor model tested (d), like the three-factor model (b), had hostility loaded on as a factor with the substance use variables. We tested the alternative two and three-factor models for two reasons; the four-factor solution showed hostility loading on a separate factor, not on factor one, and hostility or conduct issues is primarily conceptualized with substance use as an “externalising” factor within the literature, e.g., see [
21]. Furthermore, regarding the alternative two-factor solution, by having hostility loading onto a factor with substance use, we tested a model with “Internalising” and “Externalising” factors. These factors have been repeatedly validated and received a great amount of interest throughout the literature [
13,
21,
23,
50,
51]. For all models, the factors were allowed to correlate.
The two three-factor solutions showed to be a “reasonably good” and “mediocre” fit, respectively. The first model (a) (χ2 (24, N = 400) = 34.00, CFI = 0.993, TLI = 0.989, SRMR = 0.020, RMSEA = 0.032, 90% CI = [0.000, 0.052]), with hostility loaded onto factor one provided a marginally better fit than the second model (b) (χ2 (24, N = 400) = 73.34, CFI = 0.963, TLI = 0.945, SRMR = 0.057, RMSEA = 0.072, 90% CI = [0.057, 0.087]), with hostility loaded onto factor three with the substance use variables.
Next, we tested the fit of the two variations of the two-factor model. The first two-factor model tested (c), with hostility loading onto factor one, was a “reasonable” fit for the data with regards to the RMSEA, and a good fit for the CFI, TLI, and SRMR (χ2 (26, N = 400) = 96.73, CFI = 0.975, TLI = 0.966, SRMR = 0.027, RMSEA = 0.057, 90% CI = [0.042, 0.073]). The alternative two-factor solution tested (d) was a “mediocre”-to-“reasonable” fit for the data with regards to the RMSEA, and a good fit for the CFI, TLI, and the SRMR (χ2 (26, N = 400) = 96.73, CFI = 0.942, TLI = 0.926, SRMR = 0.059, RMSEA = 0.081, 90% CI = [0.068, 0.097]).
Given that all of the four CFAs tested provided a fit for the data, each model may have been acceptable to select. However, given that a two-factor “Internalising” and “Externalising” model fitted the data and that there is a large amount of conceptual and empirical evidence supporting the use of these factors, we selected this model as our correlated factors model [
13,
18,
21,
23,
51].
Next, after developing the choice of the correlated-factors model, we tested the fit of two different bifactor models. Each model tested consisted of the same observed variables and the same specific factors (Internalising and Externalising) as in the correlated factors model, but included a higher-order
p-factor. Each of the nine observed variables loaded onto the
p-factor as well as either Internalising or Externalising. What differentiated the models was whether the specific factors were allowed to correlate. In the first model tested (a), the specific factors were not allowed to correlate, but in the second model (b), the specific factors were allowed to correlate. We tested both of these versions of the bifactor model as previous research has applied both types successfully [
21,
52]
The first bifactor model tested (a), without correlated specific factors fit the data well (χ
2 (18, N = 400) = 23.82, CFI = 0.996, TLI = 0.992, SRMR = 0.020, RMSEA = 0.029, 90% CI = [0.000, 0.053]). However, none of the three observed variables retained significant loadings on the Internalising specific factor, and hostility did not retain its significant loading on the Externalising factor. Finally, there was also a Heywood case, an observed variable with negative variance (somatisation). These findings are thought to be due to the higher-order
p-factor subsumed the Internalising specific factor, as well as the variance in hostility accounted for by the Externalising factor. The second bifactor model tested (b), that contained correlated specific factors, also fit the data well (χ
2 (17, N = 400) = 21.18, CFI = 0.997, TLI = 0.993, SRMR = 0.017, RMSEA = 0.025, 90% CI = [0.000, 0.051]). However, the second model (b) shared many of the same issues as the first (a). For model two (b), none of the observed variables retained significant loadings on Internalising. Hostility also did not retain its significant loading on Externalising. Furthermore, somatisation was also a Heywood case within this model. Overall, for both bifactor models, the
p-factor subsumes the Internalizing factor. A specific factor being subsumed is relatively common in bifactor models of psychopathology, and previous research has removed the factor subsumed [
21]. However, this is now known to be poor practice, as if the subsumed factor is removed, the
p-factor becomes defined by that removed factor, changing its interpretation, see [
18,
53]. Therefore, the bifactor model is not appropriate to explore further within this data. The results do, however, suggest a single-factor model may be a good fit for the data.
Lastly, we tested the fit of the single-factor model of psychopathology within our sample. The single-factor model consists of the same nine observed variables used in the other models, however, containing one higher-order
p-factor and no specific factors. The single factor provided a “mediocre”-to-“reasonably” good fit for with regards to the RMSEA, and a good fit for the CFI, TLI, and SRMR (χ
2 (27, N = 400) = 98.12, CFI = 0.946, TLI = 0.928, SRMR = 0.062, RMSEA = 0.081, 90% CI = [0.067, 0.095]). All of the nine-observed variables loaded significantly of the
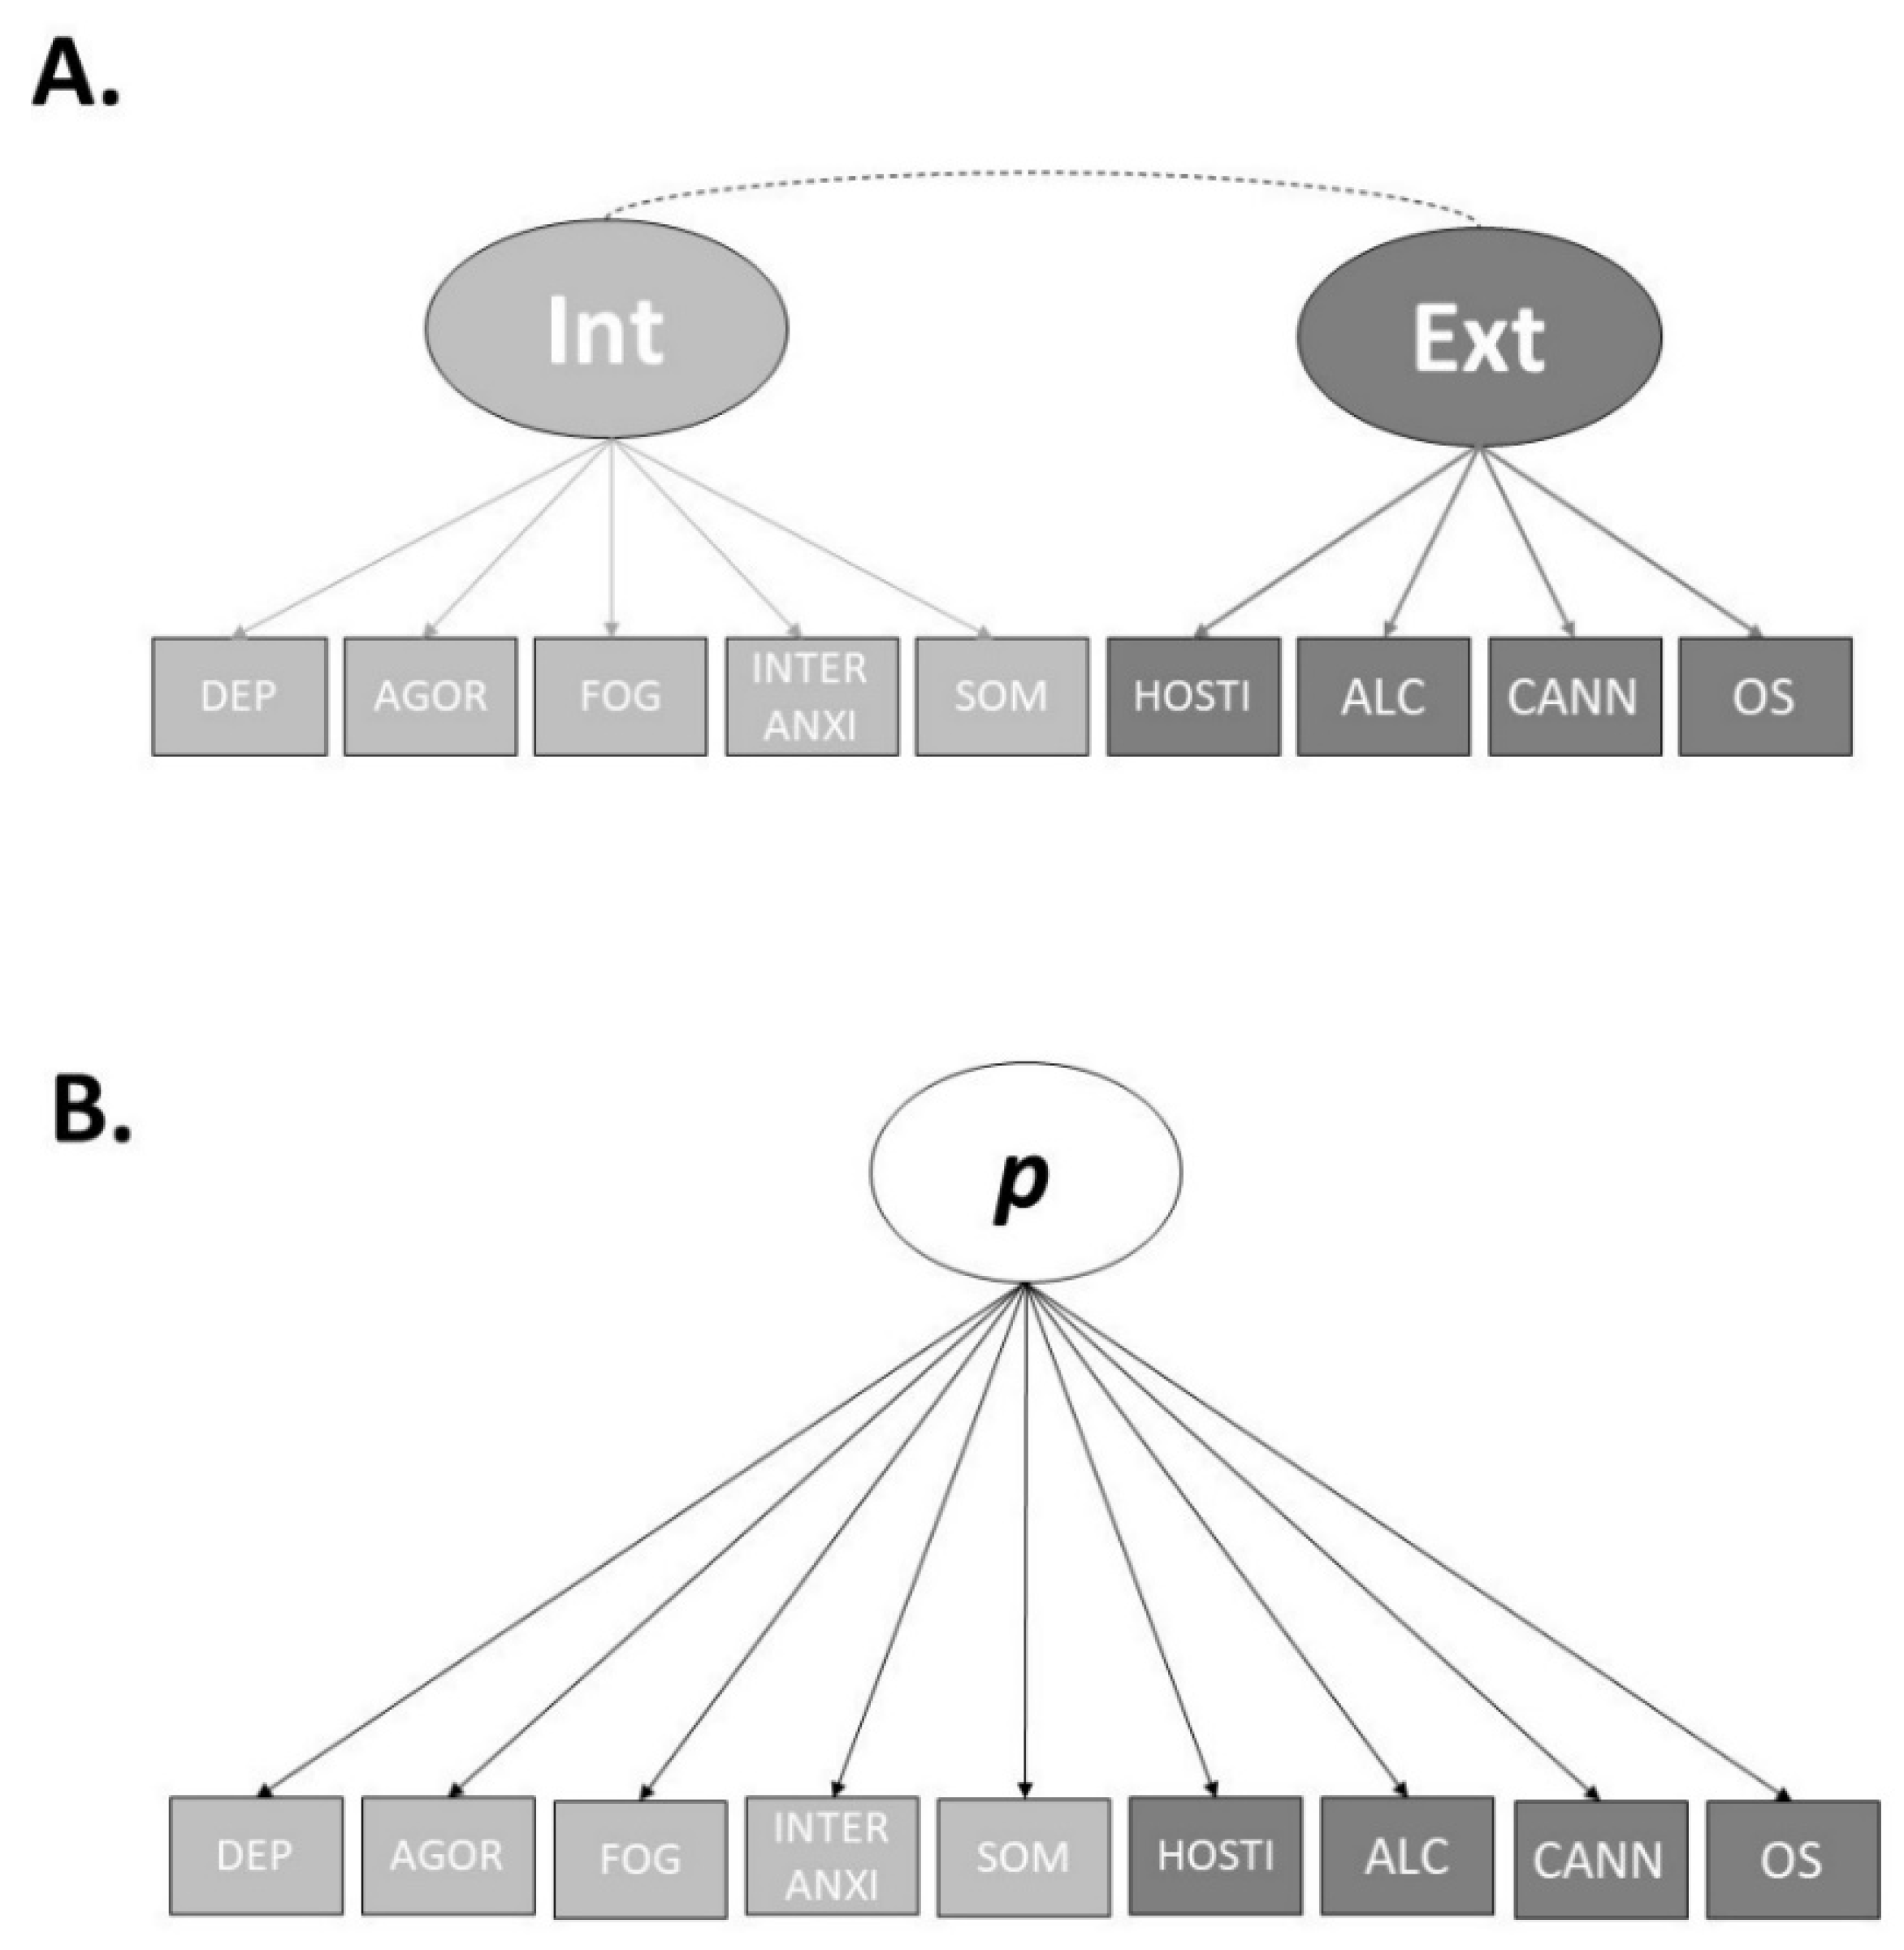
p-factor. Therefore, we decided to use the (A) correlated factors model and (B) the single-factor model for our examination of the utility of neurocognitive abilities in accounting for the factors of psychopathology.
Figure 1 displays two final models.
The factor loadings for both the final correlated factors model and the single-factor model can be found in
Table 5. As specified by Caspi et al. [
21], we standardised the
p-factor scores to a mean of 100 and a standard deviation of 15. The internalising and externalising factors were mildly-to-moderately correlated (r = 0.743), while the correlations between the
p-factor in the single factor model and specific factors in the correlated factors model were strong (
p and Internalising, r = 0.996;
p and Externalising, r = 0.799). The
p-factor and Internalising correlated almost perfectly, indicating the
p-factor in the single-factor model largely represented Internalising symptoms.
3.5. Step-Five
In Step Five we examined the partial (controlling for age and gender) correlations between the neurocognitive tasks and internalising, externalising and the
p-factor. We controlled for age and gender as both demographic variables were significantly associated with one or more of the factors of psychopathology. Higher age being associated with lower internalising, externalising and
p-factor scores (internalising,
r = −0.422,
p < 0.001; externalising,
r = −0.348,
p < 0.001;
p-factor,
r = −0.424,
p < 0.001), and females (males = 1, females = 2) tended to have higher scores on internalising and the
p-factor each factor (internalising,
r = 0.201,
p < 0.001; externalising,
r = 0.006,
p = 0.910;
p-factor,
r = 0.182,
p < 0.001).
Table 7 shows the bivariate correlations between the neurocognitive tasks and the factors of psychopathology after accounting for age and gender.
Of the eight neurocognitive tasks, after accounting for age and gender, only the two tasks designed to measure the speed of processing were significantly associated with one or more of the factors of psychopathology. Specifically, performance on the simple reaction time task was significantly negatively associated with internalising, externalising, and the p-factor. This finding indicates that better performance on the simple reaction time task is significantly associated with lower internalising and externalising symptoms, as well as the p-factor score. The Inspection Time task was significantly positively associated with internalising and the p-factor, indicating that better performance on the Inspection Time task was associated with lower internalising symptoms and lower p-factor scores. Combined, these results indicate that within our data, speed of processing is the primary neurocognitive correlate with higher-order psychopathology.
Next, we used a multivariate multiple regression analysis to examine the degree to which each neurocognitive task could account for unique variance in the psychopathology factors, accounting for age and gender, as well as the common variance amongst the tasks. The model accounted for a significant 23.8% of variance in internalising (
F(10, 389) = 12.17,
p < 0.001, R
2 = 0.238), a significant 15.6% of variance in externalising (F(10, 389) = 8.37,
p < 0.001, R
2 = 0.156), and a significant 23.6% of variance in the
p-factor (F(10, 389) = 12.05,
p < 0.001, R
2 = 0.236).
Table 8 provides the results of the regression analysis.
Regarding internalising, the simple reaction time task and the Inspection Time task remained significant predictors after accounting for the variance of age and gender, as well as the common variance of the neurocognitive tasks. Simple reaction time performance uniquely accounted for 0.9%, and the inspection time task accounted for 0.8% of the variance in internalising, respectively. This indicates that our tasks assessing the speed of processing are not only significantly associated with internalising after accounting for age and gender but can also account for a significant amount of unique variance in internalising after accounting for age and gender in addition to the common variance from the neurocognitive tasks. However, it is important to acknowledge that combined the unique variance in internalising accounted for by the speed of processing tasks was just 1.7%.
Regarding externalising, simple reaction time performance was a significant predictor of externalising in our model after accounting for age, gender, and the common variance of the remaining neurocognitive tasks. Simple reaction time accounted for a significant 4.0% of unique variance in externalising that could not be explained by age and gender or the common variance of the remaining neurocognitive tasks. However, unlike internalising, our other measure of the speed of processing, the inspection time task, did not account for a significant amount of unique variance in externalising.
Even though the internalising and the p-factor were highly correlated, to ensure a full investigation of the study aims and psychopathology factors, it was still important to examine the relations between neurocognitive performance and the general factor. Further, as the internalising and p-factor are highly, but not perfectly, correlated, the analyses remained important. Both simple reaction time and inspection time task performance accounted for a significant amount of unique variance in the p-factor over and above age, gender, and the common variance of the neurocognitive tasks. Simple reaction time performance accounted for a significant 1.2% of unique variance in the p-factor, while performance on the inspection time task accounted for a significant 0.9% of unique variance in the p-factor. Overall, our findings suggest that the tasks measuring the speed of processing were the most efficacious when compared to tasks measuring working memory, shifting, and inhibition, in accounting for higher-order psychopathology within our sample.


